Article

Human Exposure to Dioxins and Other Contaminants Following an Accidental Fire at the Fiumicino Airport (Italy): A Public Health Response

by
Stefania Paola De Filippis
*,
Vittorio Abate
,
Silvia De Luca
,
Anna Rita Fulgenzi
,
Nicola Iacovella
,
Anna Laura Iamiceli
,
Anna Maria Ingelido
,
Gaetano Settimo
,
Maria Eleonora Soggiu
and
Elena De Felip
Department of Environment and Health, Italian National Institute of Health (Istituto Superiore di Sanità—ISS), Viale Regina Elena 299, 00161 Rome, Italy
*
Author to whom correspondence should be addressed.
Atmosphere 2022, 13(12), 2058; https://doi.org/10.3390/atmos13122058
Submission received: 23 September 2022 / Revised: 2 December 2022 / Accepted: 5 December 2022 / Published: 8 December 2022

Abstract

:
In May 2015, a fire occurred at Terminal 3 of the Rome–Fiumicino International Airport. To respond to the health concern associated with the resulting emissions of combustion products, Pier D of Terminal 3 underwent a pre-emptive sequestration. The Italian National Institute of Health was asked to carry out environmental monitoring of the affected areas, and to evaluate the related risk for health. Polychlorinated dibenzo-p-dioxins (PCDDs), polychlorinated dibenzofurans (PCDFs), polychlorinated biphenyls (PCBs) and polycyclic aromatic hydrocarbons (PAHs) were measured in air samples in the pre- and post-remediation phases. Results showed a decrease of 44% of the cumulative concentrations at Pier D after the remediation operations compared to those detected before. The human exposure assessment carried out after the remediation operations confirmed that there were no risks for people in the Terminal which was then reopened. Due to the lack of quality limit values or Italian national guidelines for indoor air, WHO air quality guidelines or legislative/guidance documents of other European countries were considered for the air quality assessment.

1. Introduction

Unintentional fires can lead to emissions of persistent organic pollutants (POPs), such as polychlorinated dibenzo-p-dioxins (PCDDs), polychlorinated dibenzofurans (PCDFs), polychlorinated biphenyls (PCBs) and polycyclic aromatic hydrocarbons (PAHs), as a result of uncontrolled combustion depending on the involved materials, the nature of the fire and the environmental conditions [1,2]. Such pollutants are associated with several adverse health effects [3,4] and are classified as known human carcinogens (Group 1) by the International Agency for Research on Cancer (IARC) [5,6,7].
When accidental fires involve public buildings, risks for people associated with the possible exposure to such contaminants should be properly assessed and remediation actions carried out before reopening the buildings to the public. In 1979, a fire occurred in an office building in Washington DC involving a basement transformer with the consequent releasing of PCDDs, PCDFs and PCBs. Before the building could be reoccupied, appropriate cleanup actions and analytical measurements of dioxin contamination were provided in order to guarantee no risks for public health [8]. In many countries, appropriate guidelines are provided in order to assist the public health response in case of major fires. In New Zealand, the Public Health Unit has prepared specific guidelines focused on industrial and forest fires, providing an overview of the types of contaminants released during fires and information on sampling, analysis of air samples and interpreting the sampling results by comparison against ambient air quality guidelines or national environmental standards [9]. In the United Kingdom, an environmental monitoring of air quality following the Grenfell Tower fire was assigned to the UK Health Security Agency (UKHSA) (formerly Public Health England), which compared the results for PCDDs, PCDFs, DL-PCBs and PAHs to background levels for London to understand if there is a risk to public health [10].
A proper indoor and outdoor air monitoring strategy involves the study and development of a number of aspects, such as operating modes, methods and protocols agreed upon internationally by ISO (International Organization for Standardization) and CEN (European Committee for Standardization). With regard to indoor air monitoring, ISO 16000 describes sampling and analysis techniques for the determination of the concentration levels of PM10 and PM2.5 and their PCDDs/Fs, PCBs and PAHs content [11,12].
To our knowledge, few studies consider the concentrations of PCDDs, PCDFs, PCBs and PAHs in indoor environments after accidental fires. Moreover, few papers are available describing such emergencies in airports and dealing with analysis of causes, action taken and prevention [13]. In addition, none of them analyzed the trends over time of the concentrations of priority combustion products after an accidental fire in an airport terminal.
In this paper we report the case study of an accidental fire occurred in the Rome–Fiumicino International Airport “Leonardo da Vinci” (FCO). This is the main Italian airport in terms of passenger traffic, and one of the busiest airports in Europe, with over 43.5 million passengers served in 2019 [14], located along the coast, 35 km west of the center of Rome. On 7 May 2015, around midnight, a major fire broke out in one of the Airport terminals, Terminal 3, as a result of a short circuit in an electrical cabin and caused serious damages to the transit hall. This Terminal, which operates the highest number of flights, is the largest in the Airport, and hosts over 200 check-in desks, shops, moneychanger stations and passport control booths. To extinguish the fire, seventeen firefighter teams worked the entire night. Although a limited number of people were present when the fire broke out, mostly airport personnel, some people were hospitalized as a consequence of the smoke release, three of whom reported quite serious problems. After an initial closure of several hours, in the following days the airport gradually reopened to air traffic, although with a reduced capacity. Following the preliminary clean-up and recovery operations, and based on the monitoring activities commissioned by the company that manages Aeroporti di Roma (ADR) to assess the air quality in the areas affected by the fire, on 25 May accesses to Terminal 3 were completely reopened. At the same time, the regional Public Health Authority (Azienda Sanitaria Locale Roma D) was called in to carry out environmental monitoring with the support of the regional environmental agency (ARPA) in order to verify air quality in the Terminal affected by the fire. As a result of the detection of high concentrations of PCDDs, PCDFs and PAHs, on 26 May, the Public Prosecutor’s Office of Civitavecchia, taking into account the concern expressed by the airport staff, issued the pre-emptive sequestration of Pier D and asked the Public Health Authority to assess whether there was a possible risk to human health from toxic pollutants in the areas under sequestration. To this aim, the Italian National Institute of Health (Istituto Superiore di Sanità- ISS) Units of Air Hygiene and Toxicological Chemistry were specifically appointed.
The environmental monitoring carried out by ISS, differently from other experiences previously reported [9,10], was especially focused on indoor areas of the airport station as, due to the ventilation system still in operation during the fire event, they were mostly interested in the smoke produced by the combustion spread. The ISS monitoring campaign started on 5 June with the sampling of PM10 in five indoor and one outdoor sites in the Terminal and continued after completion of the remediation interventions in order to verify the remediation’s effectiveness, as issued by the Public Health Authority. Sampling and analysis focused on PCDDs, PCDFs and PCBs, comprising the two groups of congeners with dioxin-like activity (DL-PCBs) and non-dioxin-like activity (NDL-PCBs) and PAHs. Measurements were repeated on different days in order to derive a temporal trend of concentrations of the various pollutants and assess when the Terminal could be reopened to workers and passengers.
Assessment of risk for human health correlated with exposure to these pollutants was conducted with reference to the different groups of people potentially present in the area, such as airport ground personnel with different functions (travelers’ ticket sales, travelers’ ticket control, travelers’ security, travelers’ information, commercial and duty-free areas) and travelers (including vulnerable groups such as children). For the purposes of risk assessment, monitored areas were considered indoor living environments. Different from what concerns industrial sites, to date in Italy, there are still no limits or national guidelines related to PCDDs, PCDFs, PCBs and PAHs values in indoor air [15]. Therefore, the main information on reference values to be used for comparison are those that can be found in the scientific literature, in air quality guidelines developed by the World Health Organization (WHO) or in use in other European countries.
Specifically, WHO has developed the “Guidelines for indoor air quality” for different pollutants as benzene, nitrogen dioxide, formaldehyde, PAHs (with a specific focus on benzo[a]pyrene—B[a]P), carbon monoxide, naphthalene, radon, trichlorethylene and tetrachlorethylene [16]. For the sum of PCDDs, PCDFs and DL-PCBs, several European Union (EU) countries have set indoor reference/guide values with a legal validity in the evaluation of hygienic–sanitary parameters. Among these, with the Bericht des Länderausschusses für Immissionsschutz (LAI), Germany proposed a long-term target value of 150 fg WHO98-TE/m3 (annual average) [17]. Already in the late 1980s, WHO indicated, in the air quality guidelines, a concentration reference value in ambient air of 100 fg WHO98-TE/m3, emphasizing how air represents only a minor contribution to human exposure [18]. In Directive 2004/107/EC, EU set a target value of 1 ng/m3 for B[a]P, used as a marker for PAHs, in order to protect human health [19]. This value coincides with that established by Legislative Decree 155/2010, in force in Italy for ambient air [20].
Our study therefore aims primarily to provide an example response to indoor environmental emergencies to protect public health, but also to contribute in part to fill the data gap on dioxin emissions following accidental fires inside public buildings. Moreover, given the absence of reference values for the assessment of air quality in a non-industrial site, such as an air terminal, the values of contaminants measured in this study in the post-reclamation phase, can be considered an appropriate reference value for future risk assessment evaluations. In the following paragraphs we illustrate the sampling plan of the air samples, the methodology of the chemical analysis, the related risk assessment and report the results of our study.

2. Materials and Methods

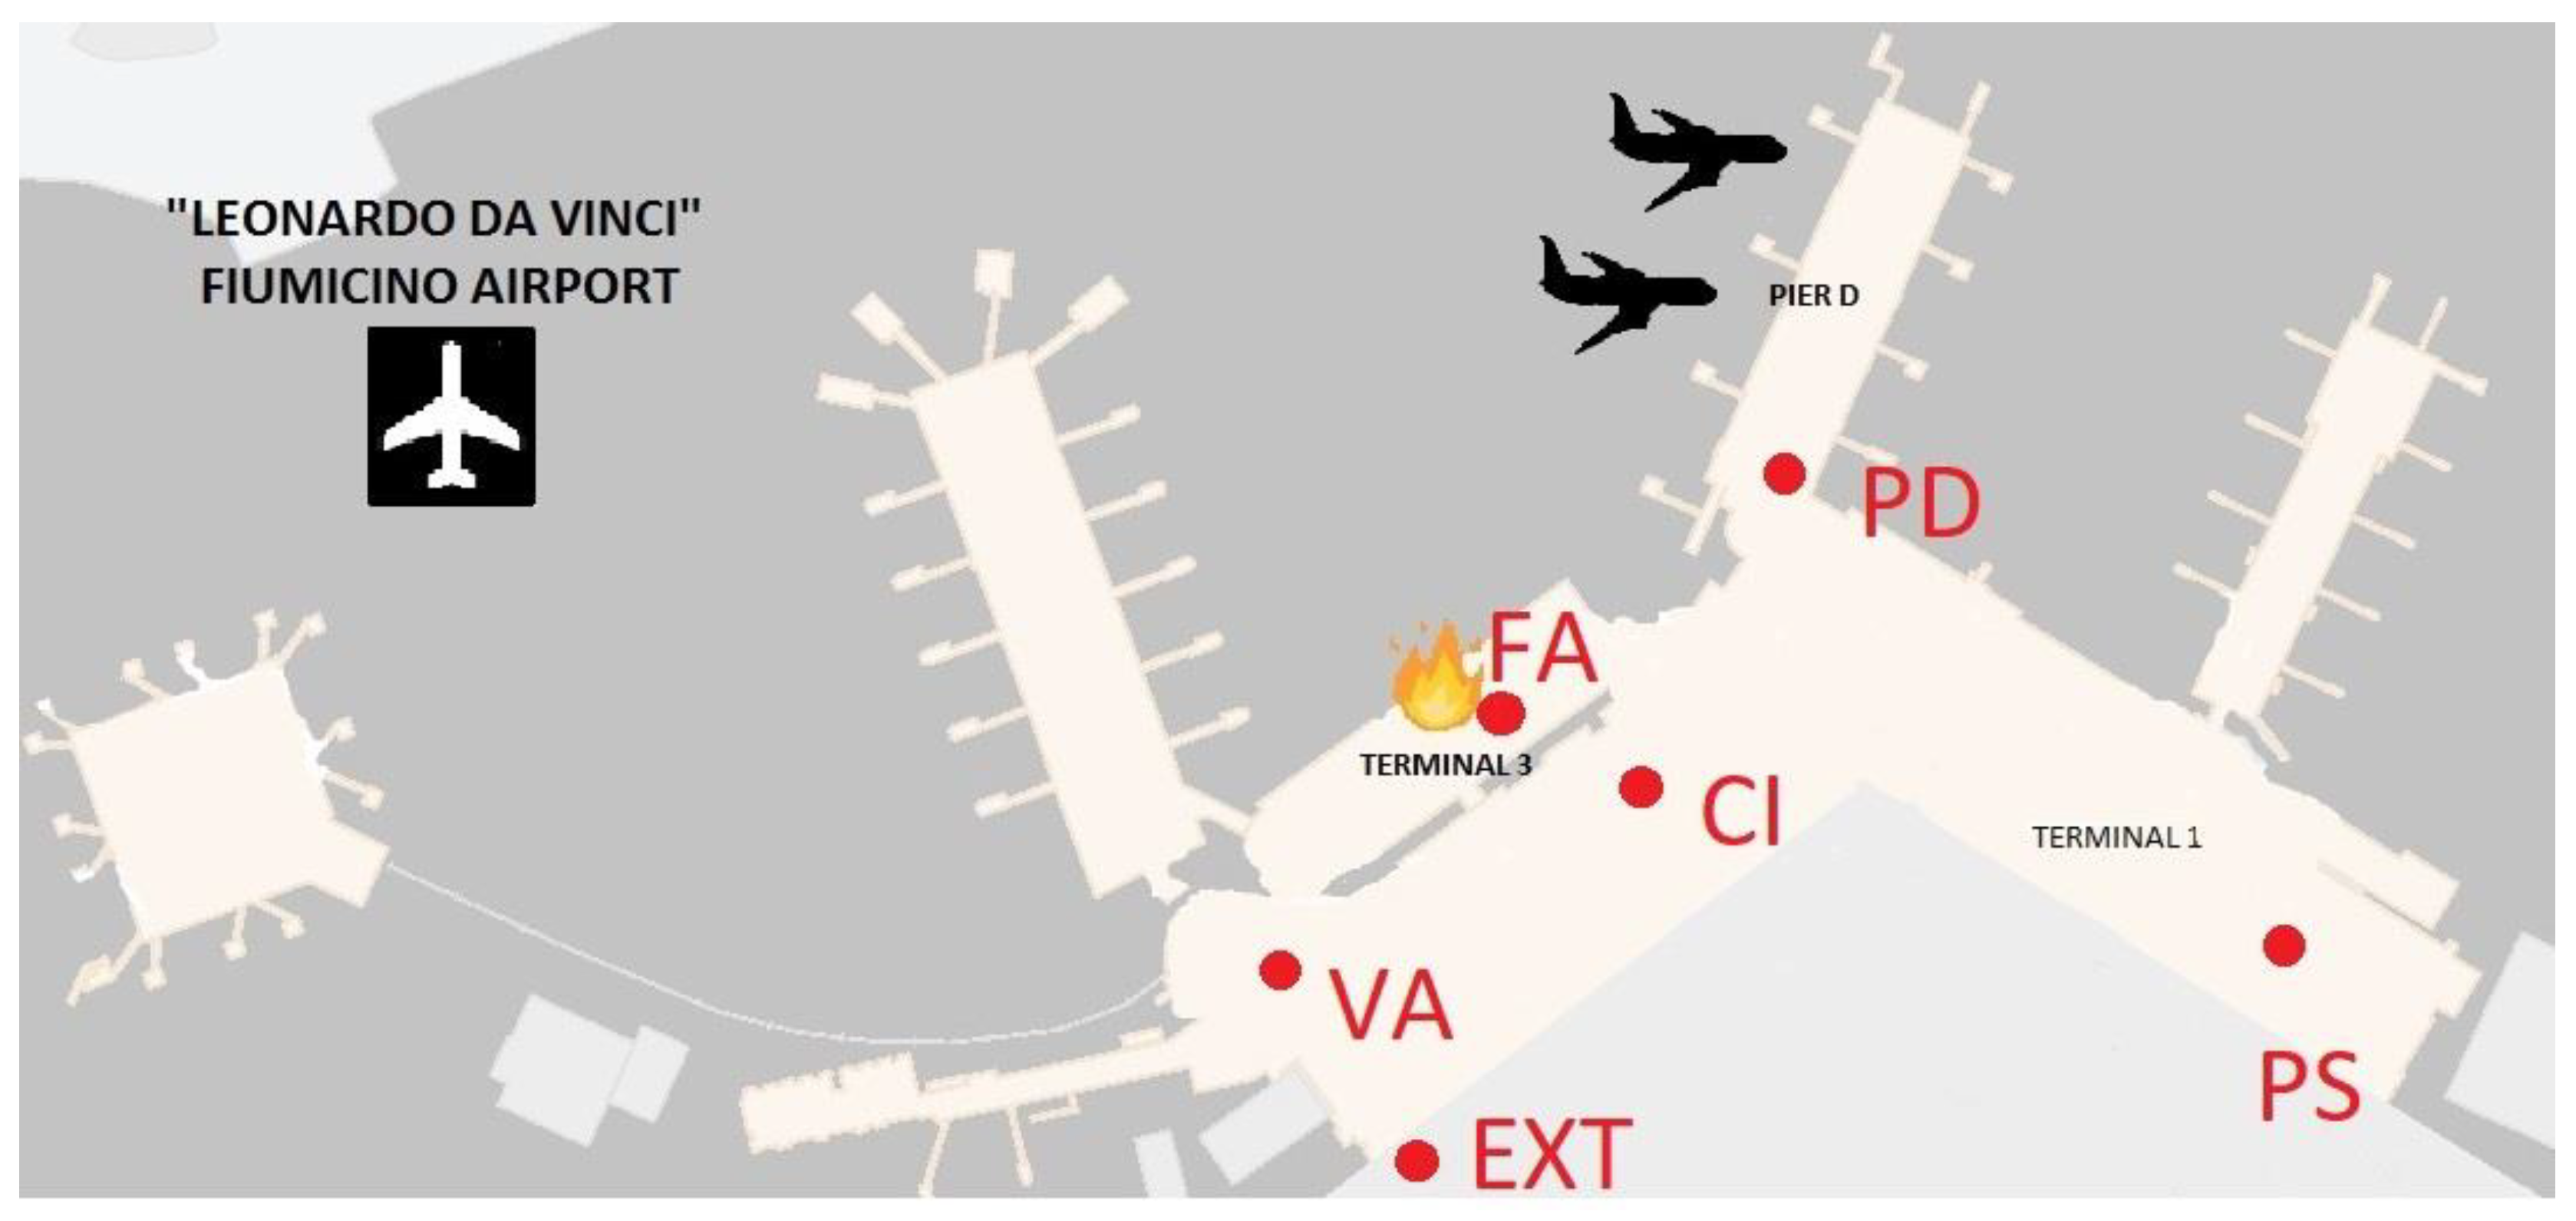
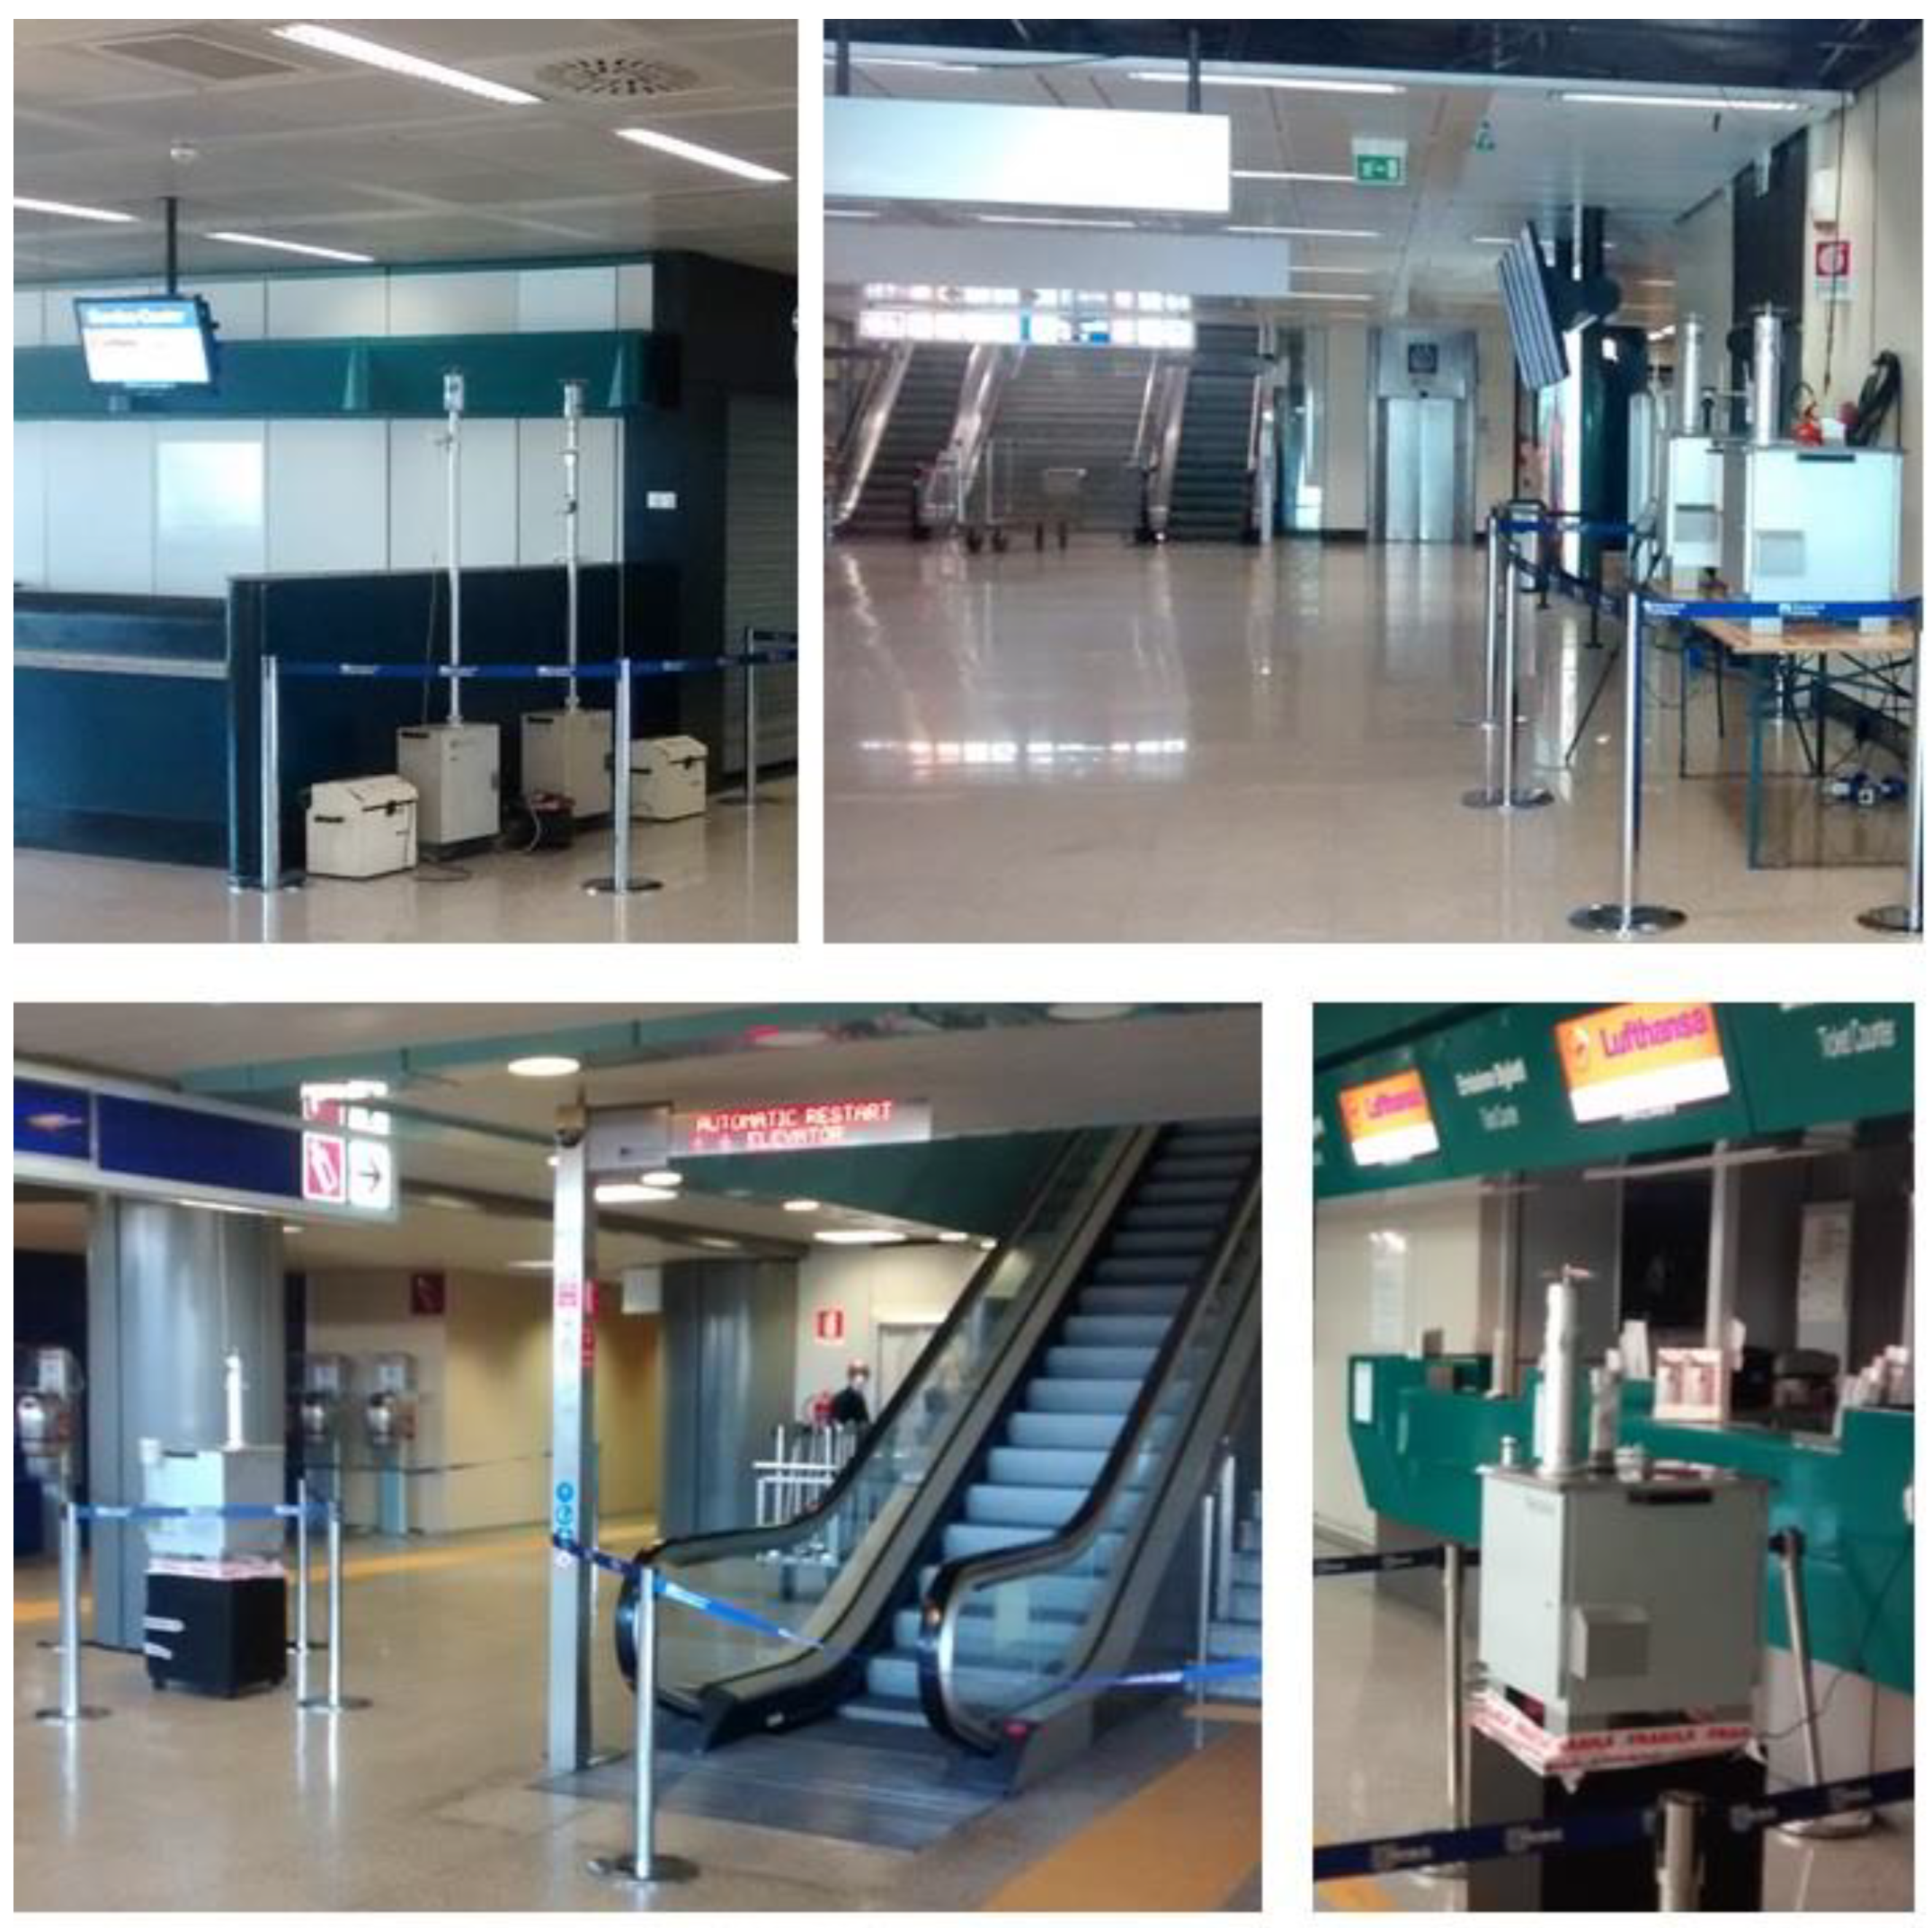
2.1. Study Area and Air Sampling

The airport has an area of 29 km2 and includes four terminals and three runways with a capacity of 90 aircraft movements per hour, including takeoffs and landings. The fire event occurred inside Terminal 3 at 00:05 a.m. on 7 May 2015 between the air conditioner and the electrical grid, developing flames. This resulted in smoke escaping, which caused severe structural damage and affected dedicated dining and shopping areas. The ventilation system (heating, ventilation and air conditioning—HVAC) that remained in operation caused the spread of smoke produced by combustion to areas adjacent to Pier D, and to areas far from the point of ignition. The severity of the fire event was also a consequence of the impossibility of immediate access by the Fire Department to the fire site. Air samples were collected in established workstations from 7 June (one month after the fire accident) to 18 July (Figure 1, Table 1).
All the workstations were placed at street level, on the floor of the departure entrance area (Figure 2).
The Varco Auriemma station was positioned at the gate Auriemma, near a security check; the check-in station was near the escalators in the check-in area; the police station site was in the area just outside the police station door, not frequented by passengers; the external station was immediately outside the area leading to the Auriemma gate. During the sampling period some workstations were moved to allow remediation operations and then repositioned to evaluate the operations’ effectiveness. The ventilation system (HVAC) was stopped during the environmental monitoring because it was likely the main source of contamination of the areas adjacent to the fire area due to its remaining on during the spread of fumes produced by the fire. The monitoring timeline was divided into two sections considering the cleaning and remediation operations of Pier D: a pre-remediation period (until 11 July) and a post-remediation period (starting from 15 July). Reclaiming of the entire Pier D was completed on 11 July with the encapsulation of the fire area, which represented a potential source of contaminant emission that was still active. On 15 July, ISS positioned samplers in the reclaimed areas of Pier D (in the same position where they had been placed before reclaiming). ISS carried out the analysis of PCDDs, PCDFs and PCBs in samples collected in the pre-remediation and in the post-remediation period, and the analysis of PAHs in samples collected in the pre-remediation period. The sampling procedure followed the requirements of ISO 16000-1:2004, ISO 16000-13:2008 and UNI EN 12341:2014, which prescribe the use of low-volume samplers set to supply sampled quartz fiber filters [11,12,21]. Sampling lasted for approximately 24 h. Air volumes of 54–55 m3 were collected every three days for almost all the sampling sites.

2.2. Chemical Analysis

The analysis protocol was based on US EPA Methods 1613B (1994) and 1668C (2010) for PCDDs, PCDFs and PCBs, while an in-house method was used for PAHs [22,23]. Briefly, the quartz fiber filter, removed after the end of sampling, was added with 13C-labeled PCDDs, PCDFs and PCBs used as internal standards (Wellington Laboratories Inc., Guelph, ON, Canada). The spiked sample underwent a triple instrument-aided extraction by accelerated solvent extraction (ASE) carried out with dichloromethane at a temperature of 100 °C and a pressure of 138 atm. A minor fraction of the extract (5%) was used to analyze PAHs; the remaining portion underwent cleanup by elution with n-hexane through a column filled with Extrelut impregnated with sulfuric acid. The eluate was concentrated under a gentle nitrogen stream to undergo an additional cleanup step with an automatic DEXTech™ System (LCTech GmbH, Obertaufkirchen, Germany ) equipped with three different pre-packed columns (acid silica, Florisil, and activated carbon). PCDDs, PCDFs and non-ortho DL-PCBs were determined by high resolution gas-chromatography coupled with high resolution mass-spectrometry (HRGC-HRMS). A Thermo-DFS (Thermo Fisher Scientific Inc., Waltham, MA, USA) was used, operating in selected ion monitoring mode (SIM) through electron impact ionization. Analyte separation was performed on an Agilent J&W DB-5MS UI column (length, 60 m; inner diameter, 0.25 mm; film thickness, 0.25 μm). Mono-ortho DL-PCBs and NDL-PCBs were analyzed by HRGC coupled with tandem mass-spectrometry (HRGC-MS/MS), performed by a Thermo-TSQ Quantum GC (Thermo Fisher Scientific Inc., Waltham, MA, USA) operating in MS/MS mode, using electron impact ionization. Analyte separation was performed on a SGETM HT8-PCB column (length, 60 m; inner diameter, 0.25-mm; film thickness, 0.25 μm). Cumulative concentrations of PCDDs, PCDFs and DL-PCBs were expressed as fg WHO98-TE/m3 [24], applying the most conservative upper bound (UB) approach. Limits of quantifications (LOQs) were in the range of 3–10 fg WHO98-TE/m3 for most PCDDs and PCDFs, in the range of 10–100 fg WHO98-TE/m3 for DL-PCBs and in the range of 0.1–0.5 pg/m3 for NDL-PCBs.
For PAH analysis, the 5% portion was concentrated, 13C-labeled PAHs were added and 10 g of 10% deactivated silica gel were transferred onto a glass column. Elution was carried out with n-hexane (Fraction 1), n-hexane/dichloromethane (90:10) (Fraction 2) and dichloromethane (Fraction 3). The second eluted fraction was reduced and injection standards were added just prior to instrumental analysis. Quantification of PAHs was carried out on a Thermo-DFS (Thermo Fisher Scientific Inc., Waltham, MA, USA) operating in selected ion monitoring mode (SIM), using electron impact ionization. Analyte separation was performed on an Agilent J&W DB-EUPAH column (length, 20 m; inner diameter, 0.18-mm; film thickness, 0.15 μm). Cumulative concentrations of PAHs, as a sum of fluoranthene, pyrene, benz[a]anthracene, chrysene, benzo[j]fluoranthene, benzo[b]fluoranthene, benzo[k]fluoranthene, benzo[e]pyrene, benzo[a]pyrene, perylene, indeno [1,2,3-[cd]pyrene, benzo[ghi]perylene, dibenz[a,h]anthracene, dibenzo[a,l]pyrene, dibenzo[a,e]pyrene, dibenzo[a,i]pyrene and dibenzo[a,h]pyrene were expressed as ng/m3, applying the most conservative UB approach. LOQs were in the range of 1–5 pg/m3.
For internal quality control purposes, a procedural blank sample (a clean quartz filter) was processed with real samples in the same batch run. Internal standard (IS) recovery rates were considered to be acceptable when in the 40–130% range. Accuracy of the analytical procedure was controlled by the regular participation of the laboratory in international proficiency tests, under accreditation conditions.

2.3. Approach to Human Health Risk Assessment

On the basis of the first results of the post-remediation monitoring of Pier D, a preliminary estimate of human exposure to contaminants of priority health interest was carried out, and health risks for workers and children were evaluated.
For PCDDs, PCDFs and DL-PCBs, the two main exposure pathways for the general population were considered: air inhalation and food intake. In this regard, it is worth emphasizing that dietary exposure is normally responsible for more than 90% of total exposure to dioxins and PCBs [25]. In the period when the risk assessment was carried out, the tolerable weekly intake (TWI) adopted by the European Commission Scientific Committee of Food (EC SCF) was 14 pg WHO98-TE/kg of body weight (bw), with a tolerable daily intake (TDI) of 2 pg WHO98-TE/kg bw [26]. In 2018, the European Food Safety Authority (EFSA) lowered the TWI to 2 pg TE/kg bw [27]. In the evaluation of the contribution of the inhalation pathway, the most conservative case was taken into account, considering absence of personal protective equipment, 100% bioavailability of pollutants adsorbed to PM10, 8-h working shifts, inhalation volume of 1.7 m3/h (conservative estimate referred to an average heavy working activity) and body weight of 60 kg. Exposure scenarios for workers of 4–8 h/day was hypothesized and, as a precautionary measure, a two-hour exposure was estimated for children who could pass, as passengers, inside Pier D.

2.4. Statistical Analysis

Statistical analysis was performed using SPSS 28 (IBM Statistics, IBM Corp.: Armonk, NY, USA). The non-parametric Wilcoxon test was used to compare measurements obtained in the sampling sites under study before and after the cleaning and remediation operations of Pier D. A p value equal or lower than 0.1 was considered statistically significant.

3. Results and Discussion

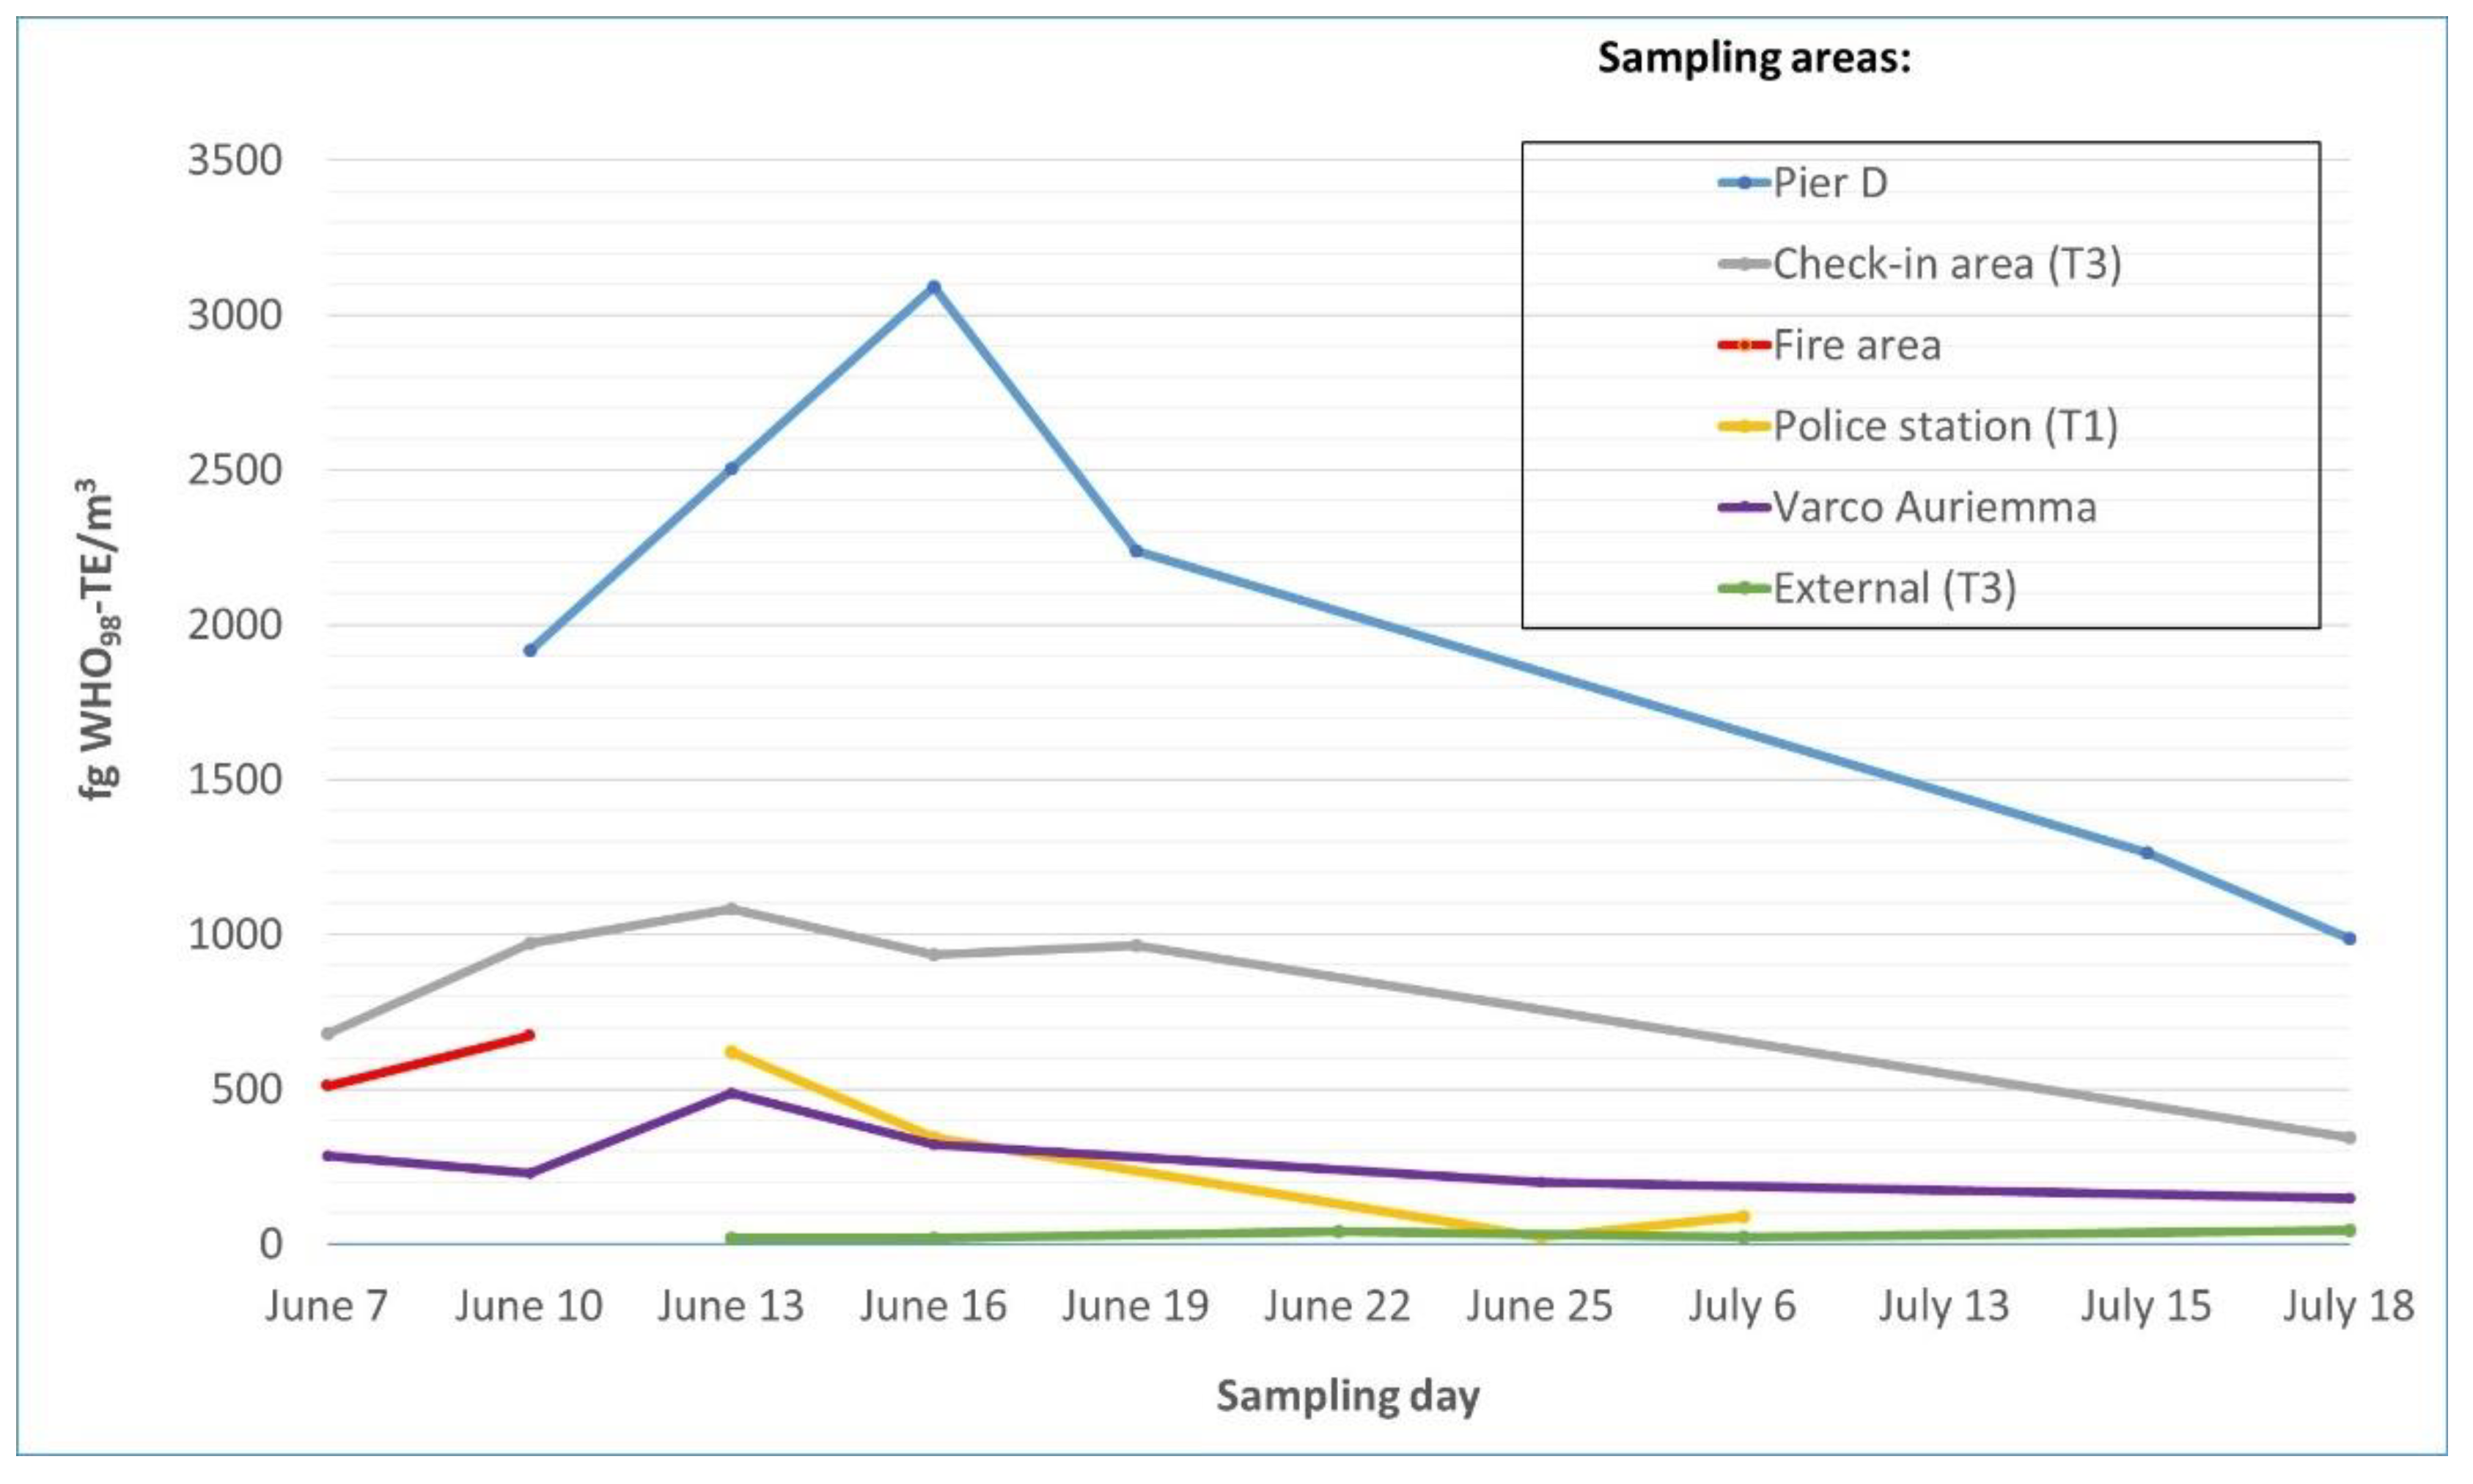
3.1. Environmental Concentrations of Target Pollutants

Fire events are not comparable to each to the other because of differences in the material composition, quantity and conditions of the environment where the fire occurred [2]. In this specific study, the results of the monitoring of pollutants after the fire accident at Fiumicino Airport were aimed at protecting health, and, in particular, at verifying the decrease in concentrations of the contaminants in order to make the banned areas active again (with special attention to Pier D). Because of the absence of limits values for the monitored pollutants in indoor air and of the paucity of existing literature on similar studies, the reference values adopted for comparison are 100–150 fg WHO98- TE/m3 set by WHO and Germany for the sum of PCDDs, PCDFs and DL-PCBs in ambient air [17,18] and 1 ng/m3 for B[a]P, a target value used as a marker for PAHs, established by EU and Italian legislation for ambient air [19,20].
Levels of PCDDs, PCDFs, PCBs and PAHs analyzed in air samples are reported for pre- and post-remediation sampling periods and are summarized in Table 2.

3.2. PCDDs, PCDFs, PCBs, PAHs—Pre-Remediation Levels

The first, measurements carried out after one month from the accidental fire at the Fiumicino Airport showed the persistence of a source of contamination that was still active, affecting the areas outside the burned area. In particular, Pier D presented the highest cumulative levels of PCDDs, PCDFs and DL-PCBs (TETOT), about 20–30 times higher than the concentration level of 100 fg WHO98- TE/m3 recommended by WHO for ambient air [18]. In the period considered, the marked fluctuations in cumulative concentrations of PCDDs, PCDFs and PCBs assessed at the different workstations did not permit identification of a decreasing trend in contamination (Figure 3).
Cumulative TETOT concentrations found in samples collected at Pier D on 10, 13 and 16 June (respectively, 1916, 2503 and 3091 fg WHO98-TE/m3) show an increasing trend in contamination (Table 2, Figure 3). A downward trend is observed only starting from 19 June (Table 2, Figure 3). In the check-in area, an increase in concentration is observed in the sample of 10 June compared to the sample of 7 June (973 vs. 680 fg WHO98-TE/m3). This increase is confirmed in the samples of 13, 16 and 19 June (1083, 936, 965 fg WHO98-TE/m3). In the fire area, a moderate increase in concentration can be observed in the sample of 10 June compared to 7 June (674 vs. 512 fg WHO98-TE/m3). Samples collected at the police station in Terminal 1 halved cumulative levels starting from the second sampling (343 vs. 620 fg WHO98-TE/m3) until reaching values below 100 fg WHO98-TE/m3 in the last measurements (Table 2). Samples collected at external workstations in Terminal 3 show values below 50 fg WHO98-TE/m3 in each sampling date (Table 2). Additionally, for NDL-PCBs, the highest cumulative concentrations observed are those detected at Pier D (Table 2). At a temporal level, fluctuations in concentrations are observed at the other workstations (Table 2).
The cumulative concentrations of PAHs (∑17PAHs) measured at the Fiumicino airport in the pre-remediation period ranged from 0.26 ng/m3 (police station) to 128 ng/m3 (fire area). In the same period, PAH concentrations quantified in the external area were in the range 0.103−0.50 ng/m3. Compared to 7 June, after three days, the concentration of PAHs in the fire area decreased by nearly two orders of magnitude (from 128 to 2.80 ng/m3, respectively). Additionally, for PAHs, excluding the fire area, the highest cumulative concentration was observed at Pier D. Concentrations of PAHs detected in air samples from the monitored indoor spaces in the airport were higher compared with the concentrations measured in hospitals, libraries and coffee shops (0.4–0.6 ng/m3) in the United States [28], while they were within the range of 2.1–18.2 ng/m3 measured inside Czech kindergartens [29]. In all the sampling days, the concentrations of PAHs detected at Pier D exceed the range of 1.2–1.4 ng/m3 found in food courts and shopping malls in the United States [28]. The concentration of B[a]P was below the regulatory limit of 1 ng/m3 [20] in all the sampling days, and in all the monitored areas.

3.3. PCDDs, PCDFs, PCBs—Post-Remediation Levels

Statistical analysis shows that cumulative concentrations quantified in the sampling sites after the cleaning and remediation operations of Pier D were significantly lower compared to those quantified before such operations (Wilcoxon test, p < 0.068). Specifically, comparison of data related to pre- (19 June) and post-remediation (15 July) shows a decrease in cumulative TETOT concentrations of about 44% at the sampling station at Pier D (Figure 3, Table 2). A further decrease of about 22% is observed in the following sampling (18 July). Similarly, for ∑30PCB, a decrease of about 9% is observed comparing the data of 19 June with those of 15 July. Such a reduction further increases in samples collected on 18 July (27%) (Table 2). Concerning the other sampling sites, a reduction in the concentration of cumulative PCDDs, PCDFs and DL-PCBs of about 25% with respect to values measured on 25 June is observed for the Varco Auriemma area. In the check-in area, a decrease of approximately 64% compared to the previous sampling (19 June) is detected. Additionally, for ∑30PCB, a decrease in environmental contamination is observed: about 6% and 57% at the Varco Auriemma and the check-in area, respectively.
The main limitations of our study are related to the small number of data over time in the post-remediation period. This is not a longitudinal study, as the study was commissioned to ISS in response to the prosecutor’s request to provide an immediate opinion on the usability of Pier D in terms of public health protection.

3.4. Human Health Risk Assessment

After Pier D remediation, concentrations of PCDDs, PCDFs and DL-PCBs, despite showing a decreasing trend, remained above the reference values set by WHO [18] and Germany [17], adopted by ISS (100–150 fg WHO98-TE/m3). Taking into account the worst-case scenario, exposure to PCDDs, PCDFs and DL-PCBs for workers and for children passing Pier D was estimated considering the parameters reported in Table 3 and Table 4.
At a concentration of 1250 fg WHO98-TE/m3, the contribution of the estimated inhalation exposure for workers was 0.28 and 0.14 pg WHO98-TE/kg bw, respectively, for 8 and 4 h of exposure. The inhalation dose was added to the average daily food intake for an Italian adult subject, reported to be approximately 1.21 pg WHO98-TE/kg bw [30]. Total daily intake was estimated to be 1.49–1.35 pg WHO98-TE/kg bw, for 8 and 4 h/day workers, respectively, below the TDI of 2 pg WHO98-TE/kg bw adopted by the EC SCF [26] and within the TDI range (1–4 pg WHO98-TE/kg bw) adopted by WHO for dietary exposure to dioxins [31]. For children aged 0–10 years, the inhalation exposure considered (two hours) represented a negligible increase in exposure compared to the exposure via food estimated for these age classes [27]. Such an estimate was precautionary since, as a consequence of the Public Health Authority prescription, workers had to undertake precautionary measures, such as the use of personal protective equipment and reduction of working hours. Assuming the above exposure concentrations to protract for a few weeks, no significant increase in risk associated with current exposure to PCDDs PCDFs and DL-PCBs was likely to occur. As to this specific point, it worthwhile to recall that WHO highlighted that the TDI represents a tolerable intake for the duration of an average life, and that occasional exceedances of the same do not have health consequences as long as that there are no exceedances of the average long-term intake [31]. It should be noted, however, that the substances in question are undesirable pollutants in the environment due to their high toxicity, and that this makes it necessary to adopt all necessary measures to reduce exposure. Moreover, WHO highlights that subtle effects can occur in some groups of the population even at the current levels of intake [31].

4. Conclusions

The paper reports the results of a study commissioned to ISS in response to the prosecutor’s request to provide an immediate opinion on the usability of Pier D in terms of public health protection after the accidental fire occurred at the Fiumicino Airport. An extensive contamination occurred in large indoor areas adjacent the fire area, due to the spread of fumes through the ventilation system (HVAC), which remained on during fire. An environmental monitoring of such areas with particular regard to Pier D started one month after the accidental event and continued after the cleaning and remediation operations in order to verify the effectiveness of the interventions carried out. Preliminary results showed an increasing trend in the concentrations of the monitored pollutants with a marked variability among different areas. Pier D showed higher concentration values for cumulative PCDDs, PCDFs, PCBs (TETOT from 1916 to 3091 fg WHO98-TE/m3) and PAHs (from 2.26 to 3.48 ng/m3). This confirmed the persistence of a source of contamination still in action. Only after the remediation operations was a decreasing trend observed. In particular, Pier D showed a decrease in cumulative TETOT concentrations of about 44%. Despite this, the concentrations detected remained above the reference values set by WHO [18] and Germany [17], adopted by ISS (100–150 fg WHO98-TE/m3). Once the assessment of exposure to PCDDs, PCDFs and PCBs in the days immediately after the remediation operations revealed that there were no particular health risks for passengers and staff, Pier D was reopened on 18 July with subsequent resumption of the airport’s activities. ISS is the technical–scientific body of the Italian National Ministry of Health. Its role in the accident and post-accident management fell within the ISS institutional tasks. All the information derived from this study represents a scheme of intervention with a specific focus on human risk assessment to be considered by health authorities in case of similar accidents.

Author Contributions

Conceptualization, S.P.D.F. and E.D.F.; methodology, V.A., S.D.L., A.R.F., A.L.I., G.S. and M.E.S.; software, N.I.; validation, V.A., S.D.L., A.R.F., N.I. and A.L.I.; formal analysis, S.P.D.F., N.I., A.L.I. and A.M.I.; investigation, S.P.D.F., V.A., S.D.L., A.R.F., N.I., A.L.I., A.M.I., G.S. and M.E.S.; resources, G.S., M.E.S. and E.D.F.; data curation, N.I., A.L.I. and A.M.I.; writing—original draft preparation, S.P.D.F.; writing—review and editing, S.P.D.F., A.L.I., G.S., M.E.S. and E.D.F.; visualization, E.D.F.; supervision, E.D.F.; project administration, E.D.F. All authors have read and agreed to the published version of the manuscript.

Funding

This research received no external funding.

Institutional Review Board Statement

Not applicable.

Informed Consent Statement

Not applicable.

Data Availability Statement

Not applicable.

Acknowledgments

The authors are indebted with Marco Inglessis and Lorenzo Palumbo for their essential support to monitoring activities and logistics.

Conflicts of Interest

The authors declare no conflict of interest.

References

  1. Zhang, M.; Buekens, A.; Li, X. Open burning as a source of dioxins. Crit. Rev. Environ. Sci. Technol. 2017, 47, 543–620. [Google Scholar] [CrossRef]
  2. United Nations Environment Programme. Toolkit for Identification and Quantification of Releases of Dioxins, Furans and Other Unintentional POPs under Article 5 of the Stockholm Convention. January 2013. Available online: http://toolkit.pops.int/Publish/Downloads/UNEP-POPS-TOOLKIT-2012-En.pdf (accessed on 22 November 2022).
  3. Mitrou, P.I.; Dimitriadis, G.; Raptis, S.A. Review article-toxic effects of 2,3,7,8-tetrachlorodibenzo-p-dioxin and related compounds Eur. J. Int. Med. 2001, 12, 406–411. [Google Scholar] [CrossRef]
  4. Mallah, M.A.; Changxing, L.; Mallah, M.A.; Noreen, S.; Liu, Y.; Saeed, M.; Xi, H.; Ahmed, B.; Feng, F.; Mirjat, A.A.; et al. Polycyclic aromatic hydrocarbon and its effects on human health: An overeview. Chemosphere 2022, 296, 133948. [Google Scholar] [CrossRef] [PubMed]
  5. International Agency for Research on Cancer Working Group on the Evaluation of Carcinogenic Risks to Humans. Polychlorinated Dibenzo-Para-Dioxins and Polychlorinated Dibenzofurans; IARC Monographs on the Evaluation of Carcinogenic Risks to Humans, No. 69; International Agency for Research on Cancer: Lyon, France, 1997. Available online: https://www.ncbi.nlm.nih.gov/books/NBK409978/ (accessed on 22 November 2022).
  6. International Agency for Research on Cancer Working Group on the Evaluation of Carcinogenic Risks to Humans. Some Non-Heterocyclic Polycyclic Aromatic Hydrocarbons and Some Related Exposures; IARC Monographs on the Evaluation of Carcinogenic Risks to Humans, No. 92; International Agency for Research on Cancer: Lyon, France, 2010. Available online: https://www.ncbi.nlm.nih.gov/books/NBK321712/ (accessed on 22 November 2022).
  7. International Agency for Research on Cancer Working Group on the Evaluation of Carcinogenic Risks to Humans. Polychlorinated Biphenyls and Polybrominated Biphenyls; IARC Monographs on the Evaluation of Carcinogenic Risks to Humans, No. 107; International Agency for Research on Cancer: Lyon, France, 2016. Available online: https://www.ncbi.nlm.nih.gov/books/NBK361680/ (accessed on 22 November 2022).
  8. National Research Council, Commission on Life Sciences. Acceptable Levels of Dioxin Contamination in an Office Building Following a Transformer Fire; Technical Report; The National Academies Press: Washington, DC, USA, 1988. [Google Scholar] [CrossRef]
  9. Ministry of Health. Response to Major Fires: Guidelines for Public Health Units; Ministry of Health: Wellington, New Zealand, 2014. Available online: https://www.health.govt.nz/publication/response-major-fires-guideline-public-health-units-revised-edition-2014 (accessed on 22 November 2022).
  10. UK Health Security Agency. Environmental Monitoring Following the Grenfell Tower Fire: Data Update 29 December 2021; UKHSA Publications GOV-10932: London, UK, 2021. Available online: https://www.gov.uk/government/publications/environmental-monitoring-following-the-grenfell-tower-fire (accessed on 22 November 2022).
  11. ISO 16000-1:2004; Indoor Air—Part 1: General Aspects of Sampling Strategy. International Organization for Standardization: Geneva, Switzerland, 2004.
  12. ISO 16000-13:2008; Indoor Air—Part 13: Determination of Total (Gas and Particle Phase) Polychlorinated Dioxin-like Biphenyls (PCBs) and Polychlorinated Dibenzo-p-Dioxins/Dibenzofurans (PCDDs/PCDFs)—Collection on Sorbent Backed Filters. International Organization for Standardization: Geneva, Switzerland, 2008.
  13. Sumathi, N.; Kerusiha, K.; Sivani, R. Analysis of Fire Accidents in Airports and Its Mitigation Measures IJLTEMAS 2018, VII, 90–96. Available online: https://www.researchgate.net/publication/324692350_Analysis_of_Fire_Accidents_in_Airports_and_Its_Mitigation_Measures#fullTextFileContent (accessed on 22 November 2022).
  14. Aeroporti di Roma. Dati di Traffico. 2019. Available online: https://adr.it/bsn-dati-di-traffico (accessed on 16 September 2022).
  15. Settimo, G.; Manigrasso, M.; Avino, P. Indoor air quality: A focus on the European legislation and state-of-the-art research in Italy. Atmosphere 2020, 11, 370. [Google Scholar] [CrossRef] [Green Version]
  16. World Health Organization. WHO Guidelines for Indoor Air Quality: Selected Pollutants; World Health Organization Regional Office for Europe: Copenhagen, Denmark, 2010; pp. 1–454. Available online: https://apps.who.int/iris/handle/10665/260127 (accessed on 16 September 2022).
  17. Bericht des Länderausschusses für Immissionsschutz (LAI) Bewertung von Schadstoffen, für die keine Immissionswerte festgelegt sind Orientierungswerte für die Sonderfallprüfung und für die Anlagenüberwachung sowie Zielwerte für die langfristige Luftreinhalteplanung unter besonderer Berücksichtigung der Beurteilung krebserzeugender Luftschadstoffe. 2004. Available online: https://www.lanuv.nrw.de/fileadmin/lanuv/gesundheit/pdf/LAI2004.pdf (accessed on 16 September 2022).
  18. World Health Organization. Air Quality Guidelines for Europe, 2nd ed.; World Health Organization Regional Office for Europe: Copenhagen, Denmark, 2000; pp. 1–273. Available online: https://apps.who.int/iris/handle/10665/107335 (accessed on 16 September 2022).
  19. European Parliament and Council. Directive 2004/107/EC of 15 December 2004 relating to arsenic, cadmium, mercury, nickel and polycyclic aromatic hydrocarbons in ambient air. Off. J. Eur. Union 2004, L23, 3–16. Available online: https://eur-lex.europa.eu/legal-content/EN/TXT/?uri=CELEX:32004L0107 (accessed on 16 September 2022).
  20. Decreto Legislativo 13 agosto 2010, n. 155. Attuazione della direttiva 2008/50/CE relativa alla qualità dell’aria ambiente e per un’aria più pulita in Europa (10G0177) (GU Serie Generale n. 216 del 15-09-2010 –Suppl. Ordinario n. 217L). Available online: https://www.gazzettaufficiale.it/eli/gu/2010/09/15/216/so/217/sg/pdf (accessed on 16 September 2022).
  21. UNI EN 12341:2014; Ambient Air-Standard Gravimetric Measurement Method for the Determination of the PM10 or PM2.5 Mass Concentration of Suspended Particulate Matter. Ente Nazionale Italiano di Unificazione: Rome, Italy, 2014.
  22. United States Environmental Protection Agency. Method 1613 Tetra-through Octa-Chlorinated Dioxins and Furans by Isotope Dilution HRGC/HRMS; Revision B; U.S. Environmental Protection Agency Office of Water Engineering and Analysis Division: Washington, DC, USA, 1994. Available online: https://www.epa.gov/sites/default/files/2015-08/documents/method_1613b_1994.pdf (accessed on 16 September 2022).
  23. United States Environmental Protection Agency. Method 1668C Chlorinated Biphenyl Congeners in Water, Soil, Sediment, Biosolids, and Tissue by HRGC/HRMS; U.S. Environmental Protection Agency Office of Water Office of Science and Technology Engineering and Analysis Division: Washington, DC, USA, 2010. Available online: https://www.epa.gov/sites/default/files/2015-09/documents/method_1668c_2010.pdf (accessed on 16 September 2022).
  24. Van den Berg, M.; Birnbaum, L.; Bosveld, A.T.C.; Brunström, B.; Cook, P.; Feeley, M.; Giesy, J.P.; Hanberg, A.; Hasegawa, R.; Kennedy, S.W.; et al. Toxic equivalent factors (TEFs) for PCBs, PCDDs and PCDFs for humans and wildlife. Environ. Health Perspect. 1998, 106, 775–792. [Google Scholar] [CrossRef] [PubMed]
  25. Parzefall, W. Risk assessment of dioxin contamination in human food. Food Chem. Toxicol. 2002, 40, 1185–1189. [Google Scholar] [CrossRef] [PubMed]
  26. European Commission Scientific Committee on Food. Opinion of the Scientific Committee on Food on the Risk Assessment of Dioxins and Dioxin-like PCBs in Food; European Commission Scientific Committee on Food: Brussels, Belgium, 2001; Available online: https://food.ec.europa.eu/system/files/2020-12/sci-com_scf_out90_en.pdf (accessed on 16 September 2022).
  27. European Food Safety Authority Panel on Contaminants in the Food Chain; Knutsen, H.K.; Alexander, J.; Barregård, L.; Bignami, M.; Bruschweiler, B.; Ceccatelli, S.; Cottrill, B.; Dinovi, M.; Edler, L.; et al. Scientific Opinion on the risk for animal and human health related to the presence of dioxins and dioxin-like PCBs in feed and food. EFSA J. 2018, 16, 5333. [Google Scholar] [CrossRef] [Green Version]
  28. Levy, J.I.; Dumyahn, T.; Spengler, J.D. Particulate matter and polycyclic aromatic hydrocarbon concentrations in indoor and outdoor microenvironments in Boston, Massachusetts. J. Expo. Sci. Environ. Epidemiol. 2002, 12, 104–114. [Google Scholar] [CrossRef] [PubMed] [Green Version]
  29. Fiala, Z.; Vyskocil, A.; Krajak, V.; Viau, C.; Ettlerova, E.; Bukac, J.; Fialova, D.; Emmingert, S. Environmental exposure of small children to polycyclic aromatic hydrocarbons. Int. Arch. Occup. Environ. Health 2001, 74, 411–420. [Google Scholar] [CrossRef] [PubMed]
  30. European Food Safety Authority. Update of the monitoring of dioxins and PCBs levels in food and feed. EFSA J. 2012, 10, 2832. [Google Scholar]
  31. World Health Organization. Assessment of the Health Risk of Dioxins: Re-Evaluation of the Tolerable Daily Intake (TDI), WHO Consultation 25–29 May 1998; World Health Organization European Centre for Environment and Health International Programme on Chemical Safety: Geneva, Switzerland, 1998; Available online: https://cdn.who.int/media/docs/default-source/chemical-safety/exe-sum-final_may1998.pdf?sfvrsn=bbb9e913_1&download=true (accessed on 16 September 2022).
Figure 1. Air sampling sites at Rome–Fiumicino International Airport “Leonardo Da Vinci” (FCO) after the fire occurred on 7 May 2015 (VA = Varco Auriemma, FA = fire area, CI = check-in area, PS = police station, PD = Pier D).
Atmosphere 13 02058 g001
Figure 2. Air sampling workstations at the monitoring sites inside the Fiumicino Airport.
Atmosphere 13 02058 g002
Figure 3. Temporal trend of the cumulative concentrations of PCDDs, PCDFs and DL-PCBs in air samples collected in the monitoring period in each sampling area.
Atmosphere 13 02058 g003
Table 1. Monitoring scheme.
Sampling SitesSampling Days
June 2015July 2015
Pier D10, 13, 16, 1915 *, 18 *
Check-in area (T3)7, 10,13, 16, 1918 *
Fire area7, 10-
Police station (T1)13, 16, 256
Varco Auriemma7, 10,13, 16, 2518 *
External (T3)13, 16, 226, 18 *
* Days in bold refer to post-remediation sampling. T1 = Terminal 1, T3 = Terminal 3.
Table 2. Upper bound (UB) concentrations of contaminants under study in air samples collected after the fire occurred at the Fiumicino Airport.
Sampling SitesSampling DaysTETOT 1 fgWHO98-TE/m3PCDDs + PCDFs fgWHO98-TE/m3DL-PCBs fgWHO98-TE/m3Σ30NDL-PCBs 2 pg/m3Σ6NDL-PCBs 3 pg/m3Σ17PAHs 4
ng/m3
B(a)P ng/m3
Pier D10 June 201519161842758813123.480.08
13 June 201525032405989663413.930.10
16 June 201530912990101753283
19 June 201522372160787852912.260.04
15 July 20151263120459685264
18 July 201598693946509192
Check-in area (T3)7 June 2015680620605142011.030.01
10 June 2015973899746592491.660.03
13 June 201510831002815532111.670.03
16 June 201593687957378143
19 June 2015965904615302021.080.02
18 July 20153443222221486
Fire area7 June 2015512478342791111280.34
10 June 2015674630444791662.800.10
Police station
(T1)
13 June 201562057941188712.050.07
16 June 2015343324196425
25 June 20152423136120.260.01
06 July 201590873186
Varco Auriemma7 June 201528526619186740.800.03
10 June 201522921316162620.660.02
13 June 201548846028258971.320.04
16 June 20153233081513152
25 June 201519918414157600.600.02
18 July 20151491351414757
External
(T3)
13 June 20151716134110.490.02
16 June 201519181155
22 June 20154038227100.100.01
6 July 2015242313111
18 July 201544413279
1 PCDDs + PCDFs + DL-PCBs. 2 Sum of NDL-PCBs 18, 28, 31, 33, 49, 52, 66, 70, 74, 91, 95, 99, 101, 110, 128, 138, 141, 146, 149, 151, 153, 170, 174, 177, 180, 183, 187, 194, 196, 203 3 Sum of NDL-PCBs 28, 52, 101, 138, 153, 180 4 Sum of FLU, PYR, B[a]A, CRY, B[b]F, B[k]F, B[j]F, B[e]P, B[a]P, PER, I[cd]P, B[ghi]P, D[ah]A, D[al]P, D[ae]P, D[ai]P, D[ah]P. The upper bound (UB) approach requires using the limit of quantification for the contribution of each non-quantified congener to the cumulative concentrations.
Table 3. Estimation of workers’ exposure trough inhalation and via food intake.
SubjectInhalation Rate
m3/h
Body Weight kgWorking Time
h/Day
Concentration
fg WHO98TE/m3
Inhalation
Intake
pg/kg bw/day
Average Food
Intake
pg/kg bw/Day
Total Daily Intake
pg/kg bw/Day
Adult1.760812500.281.211.49
Adult1.760412500.141.211.35
Table 4. Estimation of children’s (0–10 years old) inhalation exposure.
SubjectInhalation Rate m3/hBody Weight kgTime Spent
h/Day
Concentration
fg WHO98TE/m3
Total Inhalation Dose
pg/kg bw/Day
Children
(0–1 year old)
0.257212500.09
Children
(1–5 years old)
0.3515212500.06
Children
(5–10 years old)
0.3828212500.03
Publisher’s Note: MDPI stays neutral with regard to jurisdictional claims in published maps and institutional affiliations.

