Article

The Association between Household Air Pollution and Blood Pressure in Obuasi Municipality, Ghana

1
Kintampo Health Research Centre, Research and Development Division of Ghana Health Service, Kintampo P.O. Box 200, Ghana
2
Department of Public Health, Policy and Systems, University of Liverpool, Liverpool L69 7ZX, UK
3
Biological, Environmental & Occupational Health Sciences, School of Public Health, College of Health Sciences, University of Ghana, Legon, Accra P.O. Box LG 1181, Ghana
*
Author to whom correspondence should be addressed.
Atmosphere 2022, 13(12), 2033; https://doi.org/10.3390/atmos13122033
Submission received: 13 October 2022 / Revised: 28 November 2022 / Accepted: 29 November 2022 / Published: 3 December 2022
(This article belongs to the Special Issue Air Pollution Exposure and Health Impact Assessment)

Abstract

:
Emerging evidence suggests a possible link between exposure to household air pollution (HAP) from a reliance on polluting solid fuels (SFs) (e.g., wood and charcoal) for cooking and high blood pressure. As part of the CLEAN-Air(Africa) project, we measured the blood pressure among 350 cooks in Obuasi Municipality, Ghana after 24 h exposure to particulate matter (PM2.5) from the combustion of either solid fuels (n = 35) or liquefied petroleum gas (LPG) (n = 35). Multinomial regression models were used to describe the relationship between different stages of blood pressure (mmHg) and the respondents’ main fuel type used, adjusting for key covariates. A linear regression model was used to describe the relationship between personal exposure to PM2.5 and the respondent’s systolic as well as diastolic blood pressure, adjusting for key covariates. Blood pressure was higher in cooks using SFs for cooking than in those using LPG. A significant exposure–response relationship was not observed between increasing exposure to PM2.5 and increasing blood pressure (systolic: β = −2.42, 95% CI: −8.65, 3.80, p-value = 0.438, and diastolic: β = −0.32, 95% CI: −5.09; 4.45, p-value = 0.893).

1. Introduction

Globally, almost three billion people still use solid fuels (SFs) for cooking and heating [1]. Household air pollution (HAP) is the second leading environmental cause of burden of disease in low- and middle-income countries (LMICs), responsible for an estimated 3.8 million premature deaths annually [2,3]. Exposure to elevated levels of fine particulate matter (PM2.5) (a key constituent of HAP) is causally related to acute lower respiratory infection (ALRI) in children and lung cancer, ischemic heart disease, stroke, diabetes, tuberculosis and chronic obstructive pulmonary disease (COPD) in adults [2,3,4]. Emerging evidence also suggests that exposure to HAP can contribute to high blood pressure (HBP), a precursor to cardiovascular disease and a leading risk factor for mortality and morbidity globally [5]. The prevalence of hypertension has increased in recent years [6] and is predicted to rise to 60% of all adults globally in 2025 [7]. Several studies have shown hypertension to be a widespread problem in Sub-Saharan Africa (SSA), with an estimated 10 to 20 million out of a total population of 650 million experiencing hypertensive symptoms [8]; some countries have reported rates as high as 33% in adults aged 44 years or more [9]. A study of Ghanaian adults aged 15 years and older found a prevalence rate of 2.8% to 67.5% [10]. Although heredity and lifestyle factors are major factors associated with high blood pressure, environmental factors such as exposure to air pollution can also increase blood pressure through the disruption of blood vessels [11].
In Ghana, almost 70% of households rely on solid fuels (33.3% on wood and 34.1% on charcoal) for cooking, with one-quarter (25%) using LPG as a primary cooking fuel, mostly in urban areas [12]. Ghana has stated a target of 50% access to LPG by 2030 and has proposed a Cylinder Recirculation Model, a program that seeks to ensure safety and accessibility to LPG as a cleaner fuel [13]. Given that LPG use reduces exposure to PM2.5, it lends more weight to the urgent need to scale up the transition to clean fuels for domestic energy to enhance potential health benefits such as a reduction in blood pressure. A better understanding of the relationship between cooking with LPG and blood pressure in real-life settings can provide critical evidence to stakeholders about the substantial health benefits of the adoption of clean fuels. The main objective of the current paper was to elucidate the health (blood pressure) benefits or detriments associated with different fuels using different groups (polluting SFs and LPG for cooking) and exposure to HAP (PM2.5) in a peri-urban community in Obuasi, Ghana. The Obuasi area is currently transitioning to the Cylinder Recirculation Model described above. The study takes advantage of the in-depth evaluation of both objectively measured PM2.5 and blood pressure as part of a program providing evidence for facilitating the transition to clean cooking with LPG in Ghana (the CLEAN-Air(Africa) project: www.cleanairafrica.com (accessed on 15 August 2021)).

2. Methods

2.1. Study Design and Settings

CLEAN-Air(Africa) included a cross-sectional survey carried out in 2019 among 2000 households in the Obuasi Municipality located in the southern part of the Ashanti Region, Ghana. Gold mining and its associated activities are the main economic activities in the study area, with a total population of 165,052 (living in 41,312 households). The population predominantly uses charcoal for cooking (48.6%), while LPG (27.2%) and wood (7.4%) are also used [14]. The site was chosen for the CLEAN-Air(Africa) project due to the implementation of a pilot for the Cylinder Recirculation Model (CRM) for LPG in the county, for which CLEAN-Air(Africa) is conducting evaluative research.

2.2. Study Respondents and Sampling Procedure

Compounds were randomly selected from the Obuasi Municipal Assembly database to recruit 2000 respondents for a census survey from July to September 2019. More information on the census survey population is available elsewhere [15]. During the two-month period (November to December 2019), return household visits were made to 350 primary cooks selected based on stratified random sampling according to reported primary cooking fuel (50% LPG primary users and 50% solid fuel (charcoal and/or wood) exclusive users) from the census survey [16]. Primary users of LPG were defined as those respondents who predominantly used the fuel for cooking (the main cooking fuel) and exclusive SF users were defined as those respondents who exclusively cooked with SFs.

2.3. Sample Size Calculation

A sample size of 350 respondents was deemed appropriate for the follow-up surveys based on a 35% prevalence of hypertension, a 95% confidence and 80% power (based on previous work in Nigeria) [17]; 163 primary cooks were required in each fuel-use group to detect a difference of 0.31. Adjusting for an 8% non-response rate, 175 respondents were required in each fuel-use group.
These selected respondents each received a more detailed survey on household socio-economic characteristics, cooking fuel usage patterns and self-reported health assessments, as well as blood pressure and body mass index (BMI) measurements. Face-to-face interviews were employed for all surveys, which were completed on tablets using REDCap (Research Data Capture) software [18]. Blood pressure was measured three times for each participant using an Omron M7 intelli IT 360 upper arm blood pressure monitor. Blood pressure was first measured (using standardized methods) at the start of the survey, the second measurement was taken midway through the survey and the third measurement was taken at the end of the survey to ensure a minimum time of one minute between blood pressure measurements within the same day [19].

2.4. Household Air Pollution Exposure Assessment

In assessing the required sample size for comparative analysis of exposure to PM2.5, we assumed a mean of 250 μg/m3 ± 125 μg/m3 in SF users and a mean of 175 μg/m3 ± 87.5 μg/m3 (equivalent to a 30% reduction) or lower in primarily LPG-using homes, with a significance of 5% and power of 80%. This yielded a sample size of 33 per group; allowing for approximately 20% refusals and lost data, a total of 40 per group (combined total of 80) were required. A random subset of 35–40 households from each fuel group was thus randomly selected to receive 24 h HAP kitchen and personal exposure measurements during a subsequent visit in January–May 2020.
Gravimetric measurements of PM2.5 were carried out using MicroPEMs (Research Triangle Institute (RTI), Research Triangle, North Carolina, USA) to represent kitchen concentrations and personal exposure over a 24 h period. For kitchen measurements, the MicroPEMs were placed on a stand 1.5 m above ground level and approximately 1 m away from the stove in a location that would not interfere with cooking. Personal monitoring included placement of the MicroPEM in a specially designed sling near the breathing zone of the participant to be worn except when bathing or sleeping (the monitor was placed on a table nearby). Activity level and protocol-wearing compliance were also monitored simultaneously through an on-board accelerometer. Pre-weighted filters were used before deployment. Trained fieldworkers deployed the monitors and downloaded PM2.5 data. The monitors were calibrated before redeployment in another household. RTI processed the PM2.5 data using a proprietary SAS script to validate the real-time data and flagged data files with parameters outside of predetermined acceptable ranges. Flagged data files were manually inspected for potential hardware malfunctions or improper settings. The monitoring was repeated for households with flagged data.

2.5. Covariates

Socio-demographic characteristics such as the respondent’s age, educational status, average household income and household size were collected via an in-depth survey at the same time as blood pressure measurements were taken. The survey included questions about cooking location, time spent cooking, active smoking, exposure to secondhand smoke, average heart rate (average of three heart rate recordings), known hypertensive status (derived from a question of whether a medical doctor informed the respondents that they had hypertension), heating device used by the household and other energy used for lighting. BMI was grouped into four categories: underweight (BMI < 18.5), normal (BMI ≥ 18.5 and BMI < 25), overweight (BMI ≥ 25 and BMI < 30) and obese (BMI ≥ 30). Weight and height were measured using a seca mechanical personal scale placed on a flat ground surface and a stadiometer, respectively. Following completion of the survey and all physical measurements, all respondents were advised on good lifestyle choices to promote health maintenance of blood pressure, and respondents with HBP were referred to a health facility.

2.6. Analysis

Systolic and diastolic blood pressure measurements used in epidemiological models were calculated by averaging the three readings recorded during the survey. Average systolic and diastolic blood pressure were categorized based on WHO classification into the following categories: normal (systolic blood pressure (SBP) < 120 mmHg and diastolic blood pressure (DBP) < 80 mmHg), pre-hypertension (SBP within the range of 120–139 mmHg or DBP within the range of 80–89 mmHg), stage one hypertension (SBP within the range of 140–199 mmHg or DBP within the range of 90–99 mmHg) and stage two hypertension (SBP ≥ 160 mmHg or DBP ≥ 100 mmHg) [19]. A multinomial logistic regression model was used to model the categorized blood pressure measurement to assess the relationship between a respondent’s blood pressure stage and the primary fuel type used. A binary indicator of SFs versus LPG was explored as the main explanatory variable. Subsequently, two linear regression models were fitted in the exposure–response relationship to assess the relationship between respondents’ systolic and diastolic blood pressure levels and their exposure to PM2.5.
Due to the skewed nature of the PM2.5 measurements, data were log-transformed. In models assessing the relationship between blood pressure and PM2.5 exposure and kitchen concentrations, potential confounding variables including primary cook age group, occupation, income level, active smoking, exposure to secondhand smoke, self-reported time spent cooking in hours, cooking location, heating device used by the household and energy used for lighting were explored. Any factors found to be significant in the univariate model were adjusted for the multivariable model.

3. Results

3.1. Overall Demographics

A total of 350 (177 SF users and 173 LPG users) respondents were enrolled in the study. The majority of the primary cook respondents were female (97.4%). The average age of the respondents was thirty-five years, ranging from eighteen to seventy-two years. The majority (60.0%) of the respondents were married. Approximately 71.7% of the household heads earned regular income as opposed to being paid in kind. Nearly one-third (30.1%) of the household heads earned below the minimum average monthly income of GHC213 (USD 36.6)*. Most (55.4%) of the respondents owned their own businesses. More than 87.7% of the respondents had a formal education (Table 1). The average BMI was 28.2 kg/m2 (SD: 5.5), ranging from 15.8 kg/m2 to 51.0 kg/m2. Over one-third (37.4%) of the enrolled respondents were overweight. More than 63% of the respondents used their veranda or covered porch to conduct their cooking activities. Approximately 10% of the respondents had a history of hypertension and none of the respondents had ever smoked; however, 5% of the respondents consumed alcohol. Approximately 21.7% were limited when performing a vigorous activity such that 40% were not enthused to carry out their daily activities. The average heart rate reading was 80.6 bpm (SD: 11.1), ranging from 45.7 bpm to 141.7 bpm.

3.2. PM2.5 Concentration by Fuel Type

The geometric mean (GM) concentration of personal exposure to PM2.5 among the respondents was 54.4 μg/m3 (95% CI: 44.3–67.4 μg/m3) compared with a GM kitchen concentration of PM2.5 of 54.9 μg/m3 (95% CI: 43.9 μg/m3; 69.6 μg/m3). PM2.5 concentrations in the kitchens of SF users were higher, 72.3 μg/m3 (95% CI: 52.7 μg/m3; 99.3 μg/m3), compared with those measured in the kitchens of LPG users, 51.9 μg/m3 (95% CI: 39.2 μg/m3; 68.8 μg/m3). The GM of personal PM2.5 exposure among primary SF users was 65.6 μg/m3 (95% CI: 52.2 μg/m3; 83.5 μg/m3), and LPG users were exposed to 45.9 μg/m3 (95% CI: 33.3 μg/m3; 65.1 μg/m3) (Figure 1).

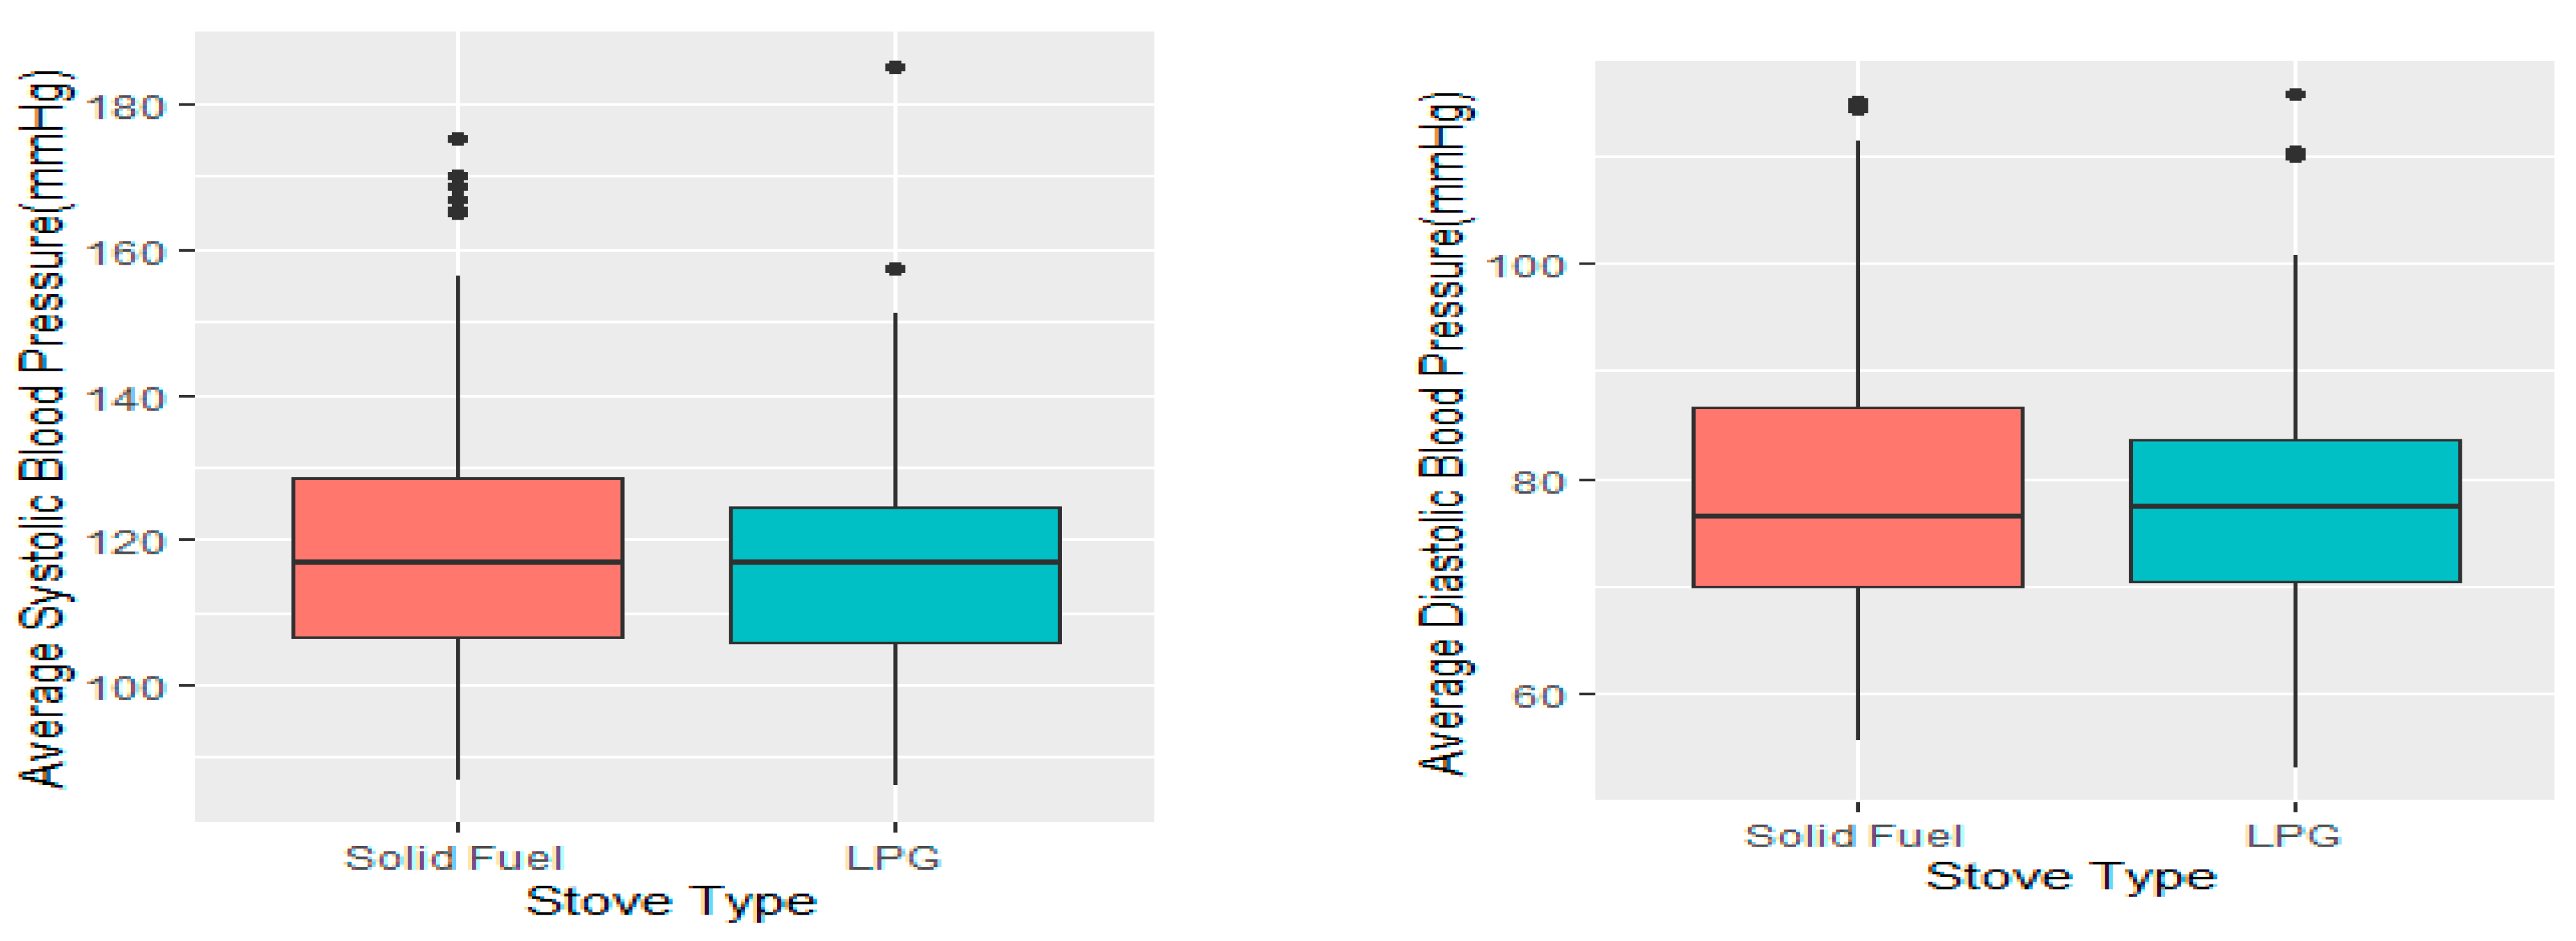
3.3. Average Systolic and Diastolic Blood Pressure

The average systolic blood pressure of the respondents was found to be 117.9 mmHg (SD: 15.8), and this ranged from 86.0 mmHg to 185.0 mmHg. Average diastolic blood pressure was 78.0 mmHg (SD: 11.7), ranging from 53.0 mmHg to 115.7 mmHg. The average (standard deviation, SD) systolic blood pressure among SF users was 119.6 (±17.1) mmHg compared with 116.1 (±14.2) mmHg among LPG users, and the difference was found to be statistically significant (p-value = 0.0194). The average (SD) diastolic blood pressure was 78.5 (±12.4) mmHg for SF users compared with 77.5 (±11.0) mmHg among LPG users. Although the diastolic blood pressure for SF users was high, the difference was not statistically significant (p-value = 0.212) (Figure 2).
Per the study classification of BP measurements according to WHO guidance, the overall prevalence of normal blood pressure was 175 (50.0%), and that of severe or stage two hypertension was 17 (4.9%). The prevalence of normal blood pressure, pre-hypertension, and stage one and stage two hypertension was 52.6%, 42.9%, 56.4% and 70.6% among SF users compared with 47.4%, 57.1%, 43.6% and 29.4% among LPG users, respectively. This difference was, however, not statistically significant (p-value = 0.095).

3.4. Relationship between Type of Fuel Use and Blood Pressure

In the univariate multinomial model, the log odds of an LPG user being pre-hypertensive versus being normal were 0.39 (95% CI: −0.8; 0.086, p-value = 0.102) higher. The log odds of an LPG user being a stage one and stage two hypertensive versus normal were 0.15 (95% CI: −0.85; 0.54, p-value = 0.664) and 0.77 (95% CI: −1.85; 0.31, p-value = 0.163) lower, respectively. There was, however, no statistical relationship between the type of fuel use and any stage of one’s blood pressure. In the final model, the respondents’ BMI, age, marital status, physical activities (such as vigorous activity, ability to climb stairs, inability to walk more than 1 km and being asked to reduce work), emotional state (such as feeling down), prevalence of heart disease, prevalence of alcohol consumption and average heart rate were adjusted for. The respondents’ marital status, BMI, age and alcohol consumption were found to be statistically associated with the stage of hypertension in the presence of fuel use (Table 2).

3.5. Exposure–Response Relationship between PM2.5 Exposure and Blood Pressure

Univariate models did not demonstrate an association between personal PM2.5 exposure and systolic nor diastolic blood pressure (SBP: −2.04 mmHg, 95% CI: −7.24; 3.16, and DBP: −1.10 mmHg, 95% CI: −5.05; 2.85). Adjusting for important factors, there was no significant association between systolic blood pressure and personal exposure to PM2.5 (systolic: −2.42 mmHg, 95% CI: −8.65, 3.80, and diastolic: −0.28 mmHg, 95% CI: −5.04, 4.48). However, there was a significant increase in both systolic and diastolic blood pressure as the ages of the respondents increased: 0.87 mmHg, 95% CI: 0.32, 1.42, and 0.68 mmHg, 95% CI: 0.26, 1.10, respectively (Table 3).

4. Discussion

This study examined the association between personal exposure to PM2.5 and blood pressure (systolic and diastolic) among 350 adults in Ghana. Our results showed that personal exposure to household air pollution (PM2.5) was higher in primary cooks using solid fuels (geometric mean (GM) = 69 μg/m3 (range 15.3 μg/m3 to 234.4 μg/m3)) than in those using LPG as a primary cooking fuel (GM = 51.4 μg/m3 (range 5.2 μg/m3 to 232.6 μg/m3)). While this finding agrees with a variety of previous studies that found that SF use compared with LPG produces higher 24 h PM2.5 among primary cooks and kitchens [20,21,22,23], the comparatively high PM2.5 level of 51.4 μg/m3 observed among LPG users in this study remains a concern. Given the smaller size of the study community and the predominant use of solid fuels among the households, however, it is plausible that this scenario could be explained by residual emissions from neighboring households that relied on solid fuels for cooking. It is equally likely that the so-called ‘fuel stacking’ practices, as described in previous studies [24,25,26] together with other environmental sources of PM2.5 such as trash burning may have also increased the exposure levels to PM2.5 even among households with clean fuels [27,28]. Regarding the association between household air pollution and the categories of blood pressure as defined by the National High Blood Pressure Education Program [29], we found no suggestive statistical relationship between the type of fuel use and any of the stages [20,30]. Our results showed that the risk of an LPG user becoming pre-hypertensive versus having a normal blood pressure was 0.59 (95% CI: 0.31; 0.52, p-value = 0.102). Again, the risk of an LPG user being a stage one and stage two hypertensive versus normal was 0.54 (95% CI: 0.29; 0.63, p-value = 0.664) and 0.68 (95% CI: 0.13; 0.58, p-value = 0.163), respectively.
Moreover, our analysis among a subgroup of respondents based on increasing age also showed a significant association with systolic blood pressure (β = 0.87, 95% CI: 0.32, 1.42, p-value = 0.002). This finding is supported by earlier work performed among adult females 40 years or older in which a unit increase in natural log-transformed kitchen PM2.5 concentration was associated with approximately 5.2 mmHg higher systolic blood pressure (95% CI, 2.3 to 8.1) [31,32].
While the clinical implication of this finding is clear, i.e., high exposures to HAP may increase blood pressure levels among older subgroups, it may also have significant social policy implications for developing countries such as Ghana, where senior females under the extended family arrangement actively participate in regular cooking activities, while younger females may be engaged in economic activities outside of the home. In addition to the emerging evidence regarding the age modification effect of the associations between polluting fuel use and blood pressure, it is widely recognized that solid fuel use increases the odds of high blood pressure compared with the use of clean fuels. A study in Thailand revealed that the prevalence of hypertension among SF users was 8% more than among LPG users [33]. Another study in Peru discovered that people using SFs had a higher risk of both pre-hypertension (OR = 5.0; 95% CI: 2.6–9.9) and hypertension (OR = 3.5; 95% CI: 1.7–7.0) [34]. In Ghana, a study conducted in rural settings found that adult females who received improved-combustion biomass-burning BioLite HomeStoves (BioLite Inc., Brooklyn NY) or two-burner liquefied petroleum gas (LPG) stoves had lower post-intervention systolic blood pressure (−2.1 mmHg, 95% CI: −6.6, 2.4) compared with controls but not higher diastolic blood pressure (−0.1 mmHg, 95% CI: −3.2, 3.0) [35], possibly due to low levels of ambient air pollution. Similarly, a cross-sectional study among 147 adult females living in rural Honduras reported a unit increase in natural log PM2.5 concentration was associated with 2.5 mmHg higher systolic blood pressure (95% CI: 0.7 to 4.3) [31]. Taken together, the findings from this study are expected to strengthen the existing evidence in the literature suggesting that detectable health gains can be achieved at reduced PM2.5 concentration levels that remain above WHO provisional recommended exposure levels of 35 μg/m3.
One of the limitations of the study was the short-term effects of household air pollutants on the development of high BP, although there were associations between blood pressure and PM2.5. As 24 h measurements of PM2.5 and blood pressure were not measured during the same household visit in this study, there was the possibility of confounding by time-varying factors. However, we assumed that relative intra-individual BP variability would be minimal within the approximate three-month window period. Second, a small sample of PM2.5 measurements was taken due to logistical constraints and may have influenced the evidence of an association between hypertension and PM2.5 towards the null. A larger sample size should be considered for future studies. Third, even though we considered a number of potential covariates in this study, other covariates such as dietary factors, genetic factors and environmental exposures that may also be risks for hypertension were not measured.

5. Conclusions

In this real-life setting, higher levels of PM2.5 were found in solid fuel users as compared with LPG users, and there was no significant association between BP and PM2.5 exposure or used stove type. We recommend more interventions to reduce household air pollution.

Author Contributions

Conceptualization, K.P.A., D.P., E.P., R.A.d.C., R.Q. and T.T.; methodology, T.T., K.P.A., D.P. and E.P.; software, S.G. and M.S.; formal analysis, S.G., E.N. and M.S.; investigation, T.T., K.P.A. and J.S.; resources, K.P.A., D.P. and E.P.; data curation, T.T., M.S. and M.T.; writing—original draft preparation, T.T. and K.P.A.; writing—review and editing, T.T., K.P.A., M.S., D.P., E.P. and S.G.; visualization, S.G., T.T., K.P.A. and M.S.; supervision, T.T. and J.S.; project administration, T.T., J.S. and K.P.A.; funding acquisition, D.P. and E.P. All authors have read and agreed to the published version of the manuscript.

Funding

This project was funded by the National Institute for Health and Care Research (NIHR) Global Health Research CLEAN-AIR (AFRICA) 17/63/155.

Institutional Review Board Statement

Ethical approval was sought from the Kintampo Health Research Centre Institutional Ethics Committee (KHRCIEC/2019-05) and the Central University Research Ethics Committee Board of the University of Liverpool (5298).

Informed Consent Statement

Written informed consent was sought from the respondents. The purpose of the study was explained in the local language to those who did not understand or were unable to read English. The respondents were assured that the data collected were confidential and anonymized. The respondents were informed of their freedom to refuse or withdraw participation at any time with no negative consequences.

Data Availability Statement

The data presented in this study are available on request from the corresponding author.

Acknowledgments

We appreciate and thank the respondents in this study. We are also grateful to the Ashanti Regional Director of Health Services, Emmanuel Tenkorang, and the staff of the Obuasi Municipal Directorate of Health Services for their support. Our appreciation also goes to the field workers for their efforts in data collection. The authors would also like to thank the National Institute for Health Research (NHIR) Global Health Research for funding this work.

Conflicts of Interest

The authors declare no conflict of interest.

References

  1. World Health Organization. Household Air Pollution and Health. Available online: https://www.who.int/news-room/fact-sheets/detail/household-air-pollution-and-health (accessed on 30 November 2021).
  2. Dockery, D.W.; Pope, C.A.; Xu, X.; Spengler, J.D.; Ware, J.H.; Fay, M.E.; Ferris, B.G., Jr.; Speizer, F.E. An association between air pollution and mortality in six US cities. N. Engl. J. Med. 1993, 329, 1753–1759. [Google Scholar] [CrossRef] [PubMed] [Green Version]
  3. Hoek, G.; Brunekreef, B.; Goldbohm, S.; Fischer, P.; van den Brandt, P.A. Association between mortality and indicators of traffic-related air pollution in the Netherlands: A cohort study. Lancet 2002, 360, 1203–1209. [Google Scholar] [CrossRef] [Green Version]
  4. Lin, H.H.; Murray, M.; Cohen, T.; Colijn, C.; Ezzati, M. Effects of smoking and solid-fuel use on COPD, lung cancer, and tuberculosis in China: A time-based, multiple risk factor, modelling study. Lancet 2008, 372, 1473–1483. [Google Scholar] [CrossRef] [PubMed]
  5. Gakidou, E.; Afshin, A.; Abajobir, A.A.; Abate, K.H.; Abbafati, C.; Abbas, K.M.; Abd-Allah, F.; Abdulle, A.M.; Abera, S.F.; Aboyans, V.; et al. Global, regional, and national comparative risk assessment of 84 behavioural, environmental and occupational, and metabolic risks or clusters of risks, 1990–2016: A systematic analysis for the Global Burden of Disease Study 2016. Lancet 2017, 390, 1345–1422. [Google Scholar] [CrossRef] [Green Version]
  6. Zhou, B.; Bentham, J.; Di Cesare, M.; Bixby, H.; Danaei, G.; Cowan, M.J.; Paciorek, C.J.; Singh, G.; Hajifathalian, K.; Bennett, J.E.; et al. Worldwide trends in blood pressure from 1975 to 2015: A pooled analysis of 1479 population-based measurement studies with 19.1 million participants. Lancet 2017, 389, 37–55. [Google Scholar] [CrossRef] [PubMed] [Green Version]
  7. Kearney, P.M.; Whelton, M.; Reynolds, K.; Muntner, P.; Whelton, P.K.; He, J. Global burden of hypertension: Analysis of worldwide data. Lancet 2005, 365, 217–223. [Google Scholar] [CrossRef] [PubMed]
  8. Opie, L.H.; Seedat, Y.K. Hypertension in sub-Saharan African populations. Circulation 2005, 112, 3562–3568. [Google Scholar] [CrossRef] [Green Version]
  9. Ataklte, F.; Erqou, S.; Kaptoge, S.; Taye, B.; Echouffo-Tcheugui, J.B.; Kengne, A.P. Burden of undiagnosed hypertension in sub-saharan Africa: A systematic review and meta-analysis. Hypertension 2015, 65, 291–298. [Google Scholar] [CrossRef] [Green Version]
  10. Bosu, W.K.; Bosu, D.K. Prevalence, awareness and control of hypertension in Ghana: A systematic review and meta-analysis. PLoS ONE 2021, 16, e0248137. [Google Scholar] [CrossRef]
  11. Brook, R.D.; Weder, A.B.; Rajagopalan, S. “Environmental hypertensionology” the effects of environmental factors on blood pressure in clinical practice and research. J. Clin. Hypertens. 2011, 13, 836–842. [Google Scholar] [CrossRef]
  12. Ghana Statistical Service. Ghana Living Standards Survey Main Report (GLSS 7); Ghana Statistical Service: Accra, Ghana, 2019. [Google Scholar]
  13. Mensah Mustapha. Cylinder Recirculation Model: Ensures Household Energy Efficiency and Sustainability. 2021. Available online: https://thebftonline.com/2021/10/07/cylinder-recirculation-model-ensures-household-energy-efficiency-and-sustainability/ (accessed on 30 September 2022).
  14. Ghana Statistical Service. 2010 Population and Housing Census, District Analytical Report, Obuasi Municipality; Ghana Statistical Service: Accra, Ghana, 2014. [Google Scholar]
  15. Shupler, M.; Baame, M.; Nix, E.; Tawiah, T.; Lorenzetti, F.; Saah, J.; de Cuevas, R.A.; Sang, E.; Puzzolo, E.; Mangeni, J.; et al. Multiple aspects of energy poverty are associated with lower mental health-related quality of life: A modelling study in three peri-urban African communities. SSM Ment. Health 2022, 2, 100103. [Google Scholar] [CrossRef]
  16. Shupler, M.; Mangeni, J.; Tawiah, T.; Sang, E.; Baame, M.; de Cuevas, R.A.; Nix, E.; Betang, E.; Saah, J.; Twumasi, M.; et al. Modelling of supply and demand-side determinants of liquefied petroleum gas consumption in peri-urban Cameroon, Ghana and Kenya. Nat. Energy 2021, 6, 1198–1210. [Google Scholar] [CrossRef]
  17. Ofori, S.N.; Fobil, J.N.; Odia, O.J. Household biomass fuel use, blood pressure and carotid intima media thickness; a cross sectional study of rural dwelling women in Southern Nigeria. Environ. Pollut. 2018, 242, 390–397. [Google Scholar] [CrossRef]
  18. REDCap. Available online: https://projectredcap.org/software/ (accessed on 6 April 2022).
  19. American Heart Association. Monitoring Your Blood Pressure at Home. Available online: https://www.heart.org/en/health-topics/high-blood-pressure/understanding-blood-pressure-readings/monitoring-your-blood-pressure-at-home (accessed on 30 September 2022).
  20. Du, W.; Wang, J.; Zhang, S.; Fu, N.; Yang, F.; Wang, G.; Wang, Z.; Mao, K.; Shen, G.; Qi, M.; et al. Impacts of Chinese spring festival on household PM2.5 pollution and blood pressure of rural residents. Indoor Air 2021, 31, 1072–1083. [Google Scholar] [PubMed]
  21. Okello, G.; Devereux, G.; Semple, S. Women and girls in resource poor countries experience much greater exposure to household air pollutants than men: Results from Uganda and Ethiopia. Environ. Int. 2018, 119, 429–437. [Google Scholar] [CrossRef] [PubMed]
  22. Van Vliet, E.D.; Asante, K.; Jack, D.W.; Kinney, P.L.; Whyatt, R.M.; Chillrud, S.N.; Abokyi, L.; Zandoh, C.; Owusu-Agyei, R.M. Personal exposures to fine particulate matter and black carbon in households cooking with biomass fuels in rural Ghana. Environ. Res. 2013, 127, 40–48. [Google Scholar] [CrossRef] [PubMed] [Green Version]
  23. Dionisio, K.; Howie, S.R.C.; Dominici, F.; Fornace, K.; Spengler, J.D.; Adegbola, R.A.; Ezzati, M. Household Concentrations and Exposure of Children to Particulate Matter from Biomass Fuels in The Gambia. Environ. Sci. Technol. 2012, 46, 3519–3527. [Google Scholar] [CrossRef] [Green Version]
  24. Gould, C.; Schlesinger, S.; Toasa, A.O.; Thurber, M.; Waters, W.F.; Graham, J.P.; Jack, D. Government policy, clean fuel access, and persistent fuel stacking in Ecuador. Energy Sustain. Dev. 2018, 46, 111–122. [Google Scholar] [CrossRef]
  25. Abdulai, M.A.; Afari-Asiedu, S.; Carrion, D.; Ae-Ngibise, K.A.; Gyaase, S.; Mohammed, M.; Agyei, O.; Boamah-Kaali, E.; Tawiah, T.; Dwommoh, R.; et al. Experiences with the Mass Distribution of LPG Stoves in Rural Communities of Ghana. EcoHealth 2018, 15, 757–767. [Google Scholar] [CrossRef]
  26. Shankar, A.V.; Quinn, A.K.; Dickinson, K.L.; Williams, K.N.; Masera, O.; Charron, D.; Jack, D.; Hyman, J.; Pillarisetti, A.; Bailis, R.; et al. Everybody stacks: Lessons from household energy case studies to inform design principles for clean energy transitions. Energy Policy 2020, 141, 111468. [Google Scholar] [CrossRef]
  27. Karanasiou, A.; Alastuey, A.; Amato, F.; Renzi, M.; Stafoggia, M.; Tobias, A.; Reche, C.; Forastiere, F.; Gumy, S.; Mudu, P.; et al. Short-term health effects from outdoor exposure to biomass burning emissions: A review. Sci. Total. Environ. 2021, 781, 146739. [Google Scholar] [CrossRef] [PubMed]
  28. Amegah, A.K.; Jaakkola, J.J.; Quansah, R.; Norgbe, G.K.; Dzodzomenyo, M. Cooking fuel choices and garbage burning practices as determinants of birth weight: A cross-sectional study in Accra, Ghana. Environ. Health 2012, 11, 78. [Google Scholar] [CrossRef] [PubMed] [Green Version]
  29. Chobanian, A.V.; Bakris, G.L.; Black, H.R.; Cushman, W.C.; Green, L.A.; Izzo, J.L., Jr.; Jones, D.W.; Materson, B.J.; Oparil, S.; Wright, J.T., Jr.; et al. The Seventh Report of the Joint National Committee on Prevention, Detection, Evaluation, and Treatment of High Blood Pressure: The JNC 7 Report. JAMA 2003, 289, 2560–2572. [Google Scholar] [CrossRef] [PubMed]
  30. Ye, W.; Steenland, K.; Quinn, A.; Liao, J.; Balakrishnan, K.; Rosa, G.; Ndagijimana, F.; Ntivuguruzwa, J.d.D.; Thompson, L.M.; McCracken, J.P.; et al. Effects of a liquefied petroleum gas stove intervention on gestational blood pressure: Intention-to-treat and exposure-response findings from the HAPIN trial. Hypertension 2022, 79, 1887–1898. [Google Scholar] [CrossRef] [PubMed]
  31. Young, B.N.; Clark, M.L.; Rajkumar, S.; Benka-Coker, M.L.; Bachand, A.; Brook, R.D.; Nelson, T.L.; Volckens, J.; Reynolds, S.J.; L’Orange, C.; et al. Exposure to household air pollution from biomass cookstoves and blood pressure among women in rural Honduras: A cross-sectional study. Indoor Air 2018, 29, 130–142. [Google Scholar] [CrossRef] [PubMed] [Green Version]
  32. Abba, M.S.; Nduka, C.U.; Anjorin, S.; Uthman, O.A. Household Air Pollution and High Blood Pressure: A Secondary Analysis of the 2016 Albania Demographic Health and Survey Dataset. Int. J. Environ. Res. Public Health 2022, 19, 2611. [Google Scholar] [CrossRef]
  33. Juntarawijit, C.; Juntarawijit, Y. Cooking with biomass fuel and cardiovascular disease: A cross-sectional study among rural villagers in Phitsanulok, Thailand. F1000Research 2020, 9, 307. [Google Scholar]
  34. Peña, M.B.; Romero, K.M.; Velazquez, E.J.; Davila-Roman, V.G.; Gilman, R.H.; Wise, R.; Miranda, J.J.; Checkley, W. Relationship Between Daily Exposure to Biomass Fuel Smoke and Blood Pressure in High-Altitude Peru. Hypertension 2015, 65, 1134–1140. [Google Scholar] [CrossRef] [Green Version]
  35. Quinn, A.K.; Ae-Ngibise, K.A.; Kinney, P.L.; Kaali, S.; Wylie, B.J.; Boamah, E.; Shimbo, D.; Agyei, O.; Chillrud, S.N.; Mujtaba, M.; et al. Ambulatory monitoring demonstrates an acute association between cookstove-related carbon monoxide and blood pressure in a Ghanaian cohort. Environ. Health 2017, 16, 76. [Google Scholar] [CrossRef]
Figure 1. PM2.5 exposure (μg/m3) by fuel type and monitoring type.
Atmosphere 13 02033 g001
Figure 2. Average systolic and diastolic blood pressure (mmHg) by stove type.
Atmosphere 13 02033 g002
Table 1. Description of respondents’ basic demographic characteristics.
CharacteristicsFuel TypeTotal
SFs
n (%)
LPG
n (%)
n (%)
Sex
  Female175 (98.9)166 (96.0)341 (97.4)
  Male2 (1.1)7 (4.1)9 (2.6)
Age group
  18–30 years67 (37.8)69 (39.9)136 (38.9)
  31–40 years56 (31.6)66 (38.2)122 (34.9)
  >40 years54 (30.5)38 (22.0)92 (26.3)
Marital status
  Married101 (57.1)109 (63.0)210 (60.0)
  Unmarried76 (42.9)64 (37.0)140 (40.0)
Household head regular cash income
  Yes124 (70.1)127 (73.4)251 (71.7)
  No53 (29.9)46 (26.6)99 (28.3)
Household average monthly income *
  <GH500 (USD 82)68 (38.4)41 (23.7)109 (31.1)
  GH501–1000 (USD 82–172)55 (31.1)55 (31.8)110 (31.4)
  >GH1000 (USD 172)36 (20.3)65 (37.6)101 (28.9)
  Don’t know18 (10.1)12 (6.9)30 (8.6)
Primary cook occupation
  Farming34 (19.2)9 (5.2)43 (12.3)
  Employed12 (6.8)27 (15.6)39 (11.1)
  Own business92 (52.0)102 (59.0)194 (55.4)
  Unemployed37 (20.9)31 (17.9)68 (19.4)
  Other2 (1.1)4 (2.3)6 (1.7)
Educational status
  Informal education31 (17.5)12 (6.9)43 (12.3)
  Formal education146 (82.5)161 (93.1)307 (87.7)
Cooking location
  In main house: no separate room4 (2.3)7 (4.1)11 (3.1)
  In main house: separate room23 (13.0)42 (24.3)65 (18.6)
  Outside main house: in separate room10 (5.7)2 (1.2)12 (3.4)
  Outside main house: open air32 (18.1)7 (4.1)39 (11.1)
  On veranda or covered porch108 (61.0)115 (66.5)223 (63.7)
BMI category (kg/m2)
  Underweight (BMI < 18.5)4 (2.3)1 (0.6)5 (1.4)
  Normal (BMI ≥ 18.5–<25)60 (33.9)37 (21.4)97 (27.7)
  Overweight (BMI ≥ 25–<30)58 (32.8)70 (40.5)128 (36.6)
  Obese (BMI ≥ 30)52 (29.4)60 (34.7)112 (32.0)
  Missing3 (1.7)5 (2.9)8 (2.3)
Physically active
  Yes94 (53.1)111 (64.2)205 (58.6)
  No83 (46.9)62 (35.8)145 (41.4)
Emotionally stressed
  Yes162 (91.5)160 (92.5)322 (92.0)
  No15 (8.5)13 (7.5)28 (8.0
History of known hypertension status
  Yes21 (11.9)13 (7.5)34 (9.7)
  No156 (88.1)160 (92.5)316 (90.3)
Prevalence of heart disease
  Yes2 (1.1)5 (2.9)7 (2.0)
  No175 (98.9)168 (97.1)343 (98.0)
Currently consumed alcohol
  Yes9 (5.1)9 (5.2)18 (5.1)
  No168 (94.9)164 (94.8)332 (94.9)
Does a household member smoke cigarettes?
  Yes9 (5.1)6 (3.5)15 (4.3)
  No168 (94.9)167 (96.5)335 (95.7)
Average heart rate (mean; min–max) (bpm)80.8 (55.3–113.3)80.5 (45.7–141.7)80.6 (45.7–141.7)
Table 2. Association between fuel use and blood pressure.
Outcome per Fuel TypeCoefficient (mmHg)95% CIp-Value
Model 1Pre-hypertension
SFsReference
LPG0.28−0.23; 0.790.279
Model 2Stage one hypertension
SFsReference
LPG−0.24−1.02; 0.530.542
Model 3Stage two hypertension
SFsReference
LPG−0.76−1.97; 0.440.215
Note: The results presented are adjusted for the respondents’ BMI, age, marital status, physical activity, emotions, prevalence of heart disease, prevalence of alcohol consumption and average heart rate.
Table 3. Relationship between systolic and diastolic blood pressure (mmHg) and PM2.5 (μg/m3) adjusting for important covariates.
Model Coefficient (mmHg)95% CI
(mmHg)
p-Value
Systolic blood pressure
AdjustedLog (PM2.5)−2.42−8.65; 3.800.438 *
Diastolic blood pressure
AdjustedLog (PM2.5)−0.28−5.04; 4.480.960 *
Note: * Adjusting for primary cook occupation, average income, age, BMI, average hours spent in the kitchen, cooking location, household size and other sources of power.
Publisher’s Note: MDPI stays neutral with regard to jurisdictional claims in published maps and institutional affiliations.

