Article

Twelve-Year Cycle in the Cloud Top Winds Derived from VMC/Venus Express and UVI/Akatsuki Imaging

by
Igor V. Khatuntsev
1,*,
Marina V. Patsaeva
1,
Dmitrij V. Titov
2,
Ludmila V. Zasova
1,
Nikolay I. Ignatiev
1 and
Dmitry A. Gorinov
1
1
Space Research Institute, Russian Academy of Sciences, 117997 Moscow, Russia
2
Leiden Observatory, Leiden University, 2300 RA Leiden, The Netherlands
*
Author to whom correspondence should be addressed.
Atmosphere 2022, 13(12), 2023; https://doi.org/10.3390/atmos13122023
Submission received: 27 September 2022 / Revised: 28 November 2022 / Accepted: 29 November 2022 / Published: 1 December 2022
(This article belongs to the Special Issue Planetary Atmospheres: From Solar System to Exoplanets)

Abstract

:
We present joint analysis of the UV (365 nm) images captured by the cameras on board ESA’s Venus Express and JAXA’s Akatsuki spacecraft. These observations enabled almost continuous characterization of the cloud top circulation over the longest period of time so far (2006–2021). More than 46,000 wind vectors were derived from tracking the UV cloud features and revealed changes in the atmospheric circulation with the period of 12.5 ± 0.5 years. The zonal wind component is characterized by an annual mean of −98.6 ± 1.3 m/s and an amplitude of 10.0 ± 1.6 m/s. The mean meridional wind velocity is −2.3 ± 0.2 m/s and has an amplitude of 3.4 ± 0.3 m/s. Plausible physical explanations of the periodicity include both internal processes and external forcing. Both missions observed periodical changes in the UV albedo correlated with the circulation variability. This could result in acceleration or deceleration of the winds due to modulation of the deposition of the radiative energy in the clouds. The circulation can be also affected by the solar cycle that has a period of approximately 11 years with a large degree of deviation from the mean. The solar cycle correlated with the wind observations can probably influence both the radiative balance and chemistry of the mesosphere. The discovered periodicity in the cloud top circulation of Venus, and especially its similarity with the solar cycle, is strongly relevant to the study of exoplanets in systems with variable “suns”.

1. Introduction

The dense atmosphere of Venus, with its thick cloud layer and vivid circulation, presents a remarkable example of a complex system with multiple chemical and dynamical couplings affected by external forcings, the behavior of which is not yet fully understood. Decades-long wind measurements by tracking cloud motions in ultraviolet (UV) images established a general picture of the circulation at the cloud top (~70 km) [1]. The observations revealed various waves and variabilities at different spatial and temporal scales. In particular, the Pioneer Venus Orbiter (PVO) UV imaging indicated that the Venusian atmosphere at the cloud top vacillates on a time scale of 5–10 years between two distinct dynamical states differing in zonal wind speed and appearance of planetary waves [2]. This was a tentative indication of a long-term periodicity. However, the data set was limited by the relatively short duration (1979–1986) of the mission.
The Venus Express/ESA [3,4] and Akatsuki/JAXA [5] spacecraft provided the longest-to-date and almost continuous set of UV (365 nm) images of Venus. Khatuntsev et al. [6] and Kouyama et al. [7] analyzed the UV images captured by the Venus Monitoring Camera (VMC) in 2006 through 2012 [8,9]. They reported a gradual increase from 85 m/s to ~110 m/s of the zonal wind speed at the cloud top (70 ± 2 km) in equatorial latitudes 20 ± 2.5 °S. Bertaux et al. [10] explained this trend by the influence of the surface topography on the cloud top circulation, suggesting that gravity waves generated by Aphrodite Terra, the largest highland province in the equatorial region, decelerated the retrograde flow. In December 2015, approximately one year after completion of the Venus Express mission, the Akatsuki spacecraft began observations that extended the circulation monitoring. The highly elliptical equatorial orbit of Akatsuki allowed for comparison of the circulation in both hemispheres. Horinouchi et al. [11] reported low-latitude zonal winds obtained from UV images (283 nm and 365 nm) captured by the UVI camera on board the Akatsuki orbiter from December 2015 to March 2017.
The Venus Express and Akatsuki observations revealed significant long-term variations of the cloud morphology and planet brightness. McGouldrick and Tsang [12] found a 150-day period in the Venusian condensational clouds. Lee et al. [13] reported changes in the UV albedo in the range of 0.25–0.4 on a time scale of approximately a decade. We note here that according to Shalygina et al. [14], one cannot exclude that these variations can be partially attributed to the temporal degradation of the VMC’s detector sensitivity. Pioneer Venus and Venus Express spectroscopic observations also suggested remarkably strong, approximately an order of magnitude, annual variations of abundance of sulfur dioxide, the major cloud forming specie, above the cloud top [15]. Based on the combination of ground based and spacecraft IR observations from 1978 to 2017, Peralta et al. [16] reported long-term variations in the winds in the nightside lower clouds of Venus.
In this paper, we present the long-term variations of both zonal and meridional components of the cloud top winds. For the first time, we jointly analyze the wind fields derived from the VMC/Venus Express and UVI/Akatsuki UV cameras using the same digital cloud-tracking technique that resulted in the longest-to-date and almost continuous temporal coverage of approximately 24 Venusian years (2006–2021). To focus the study on the long-term changes and exclude the influence of spatial and local time variations, we limited the latitude range to 20 ± 2.5 °S and local time to 11–13 h. More than 46,000 wind vectors were derived from the VMC and UVI images using the digital cloud tracking technique developed by Khatuntsev et al. [6] and described by Patsaeva et al. [17], enabling intercomparison of the results obtained by both cameras.

2. VMC and UVI Data Sets

In this work, we used two datasets of UV images captured by the VMC/Venus Express (2006–2014) and UVI/Akatsuki (2015-present) cameras.
The first dataset includes VMC dayside images [8,9] taken at 365 ± 40 nm. The VMC operated on board the Venus Express spacecraft, which had a highly elliptical polar orbit with an apocenter altitude of 63000 km above the southern pole and a pericenter altitude of approximately 250 km above the northern pole, and an orbital period of 24 h [4]. This orbit limited the observations usable for the wind measurements to the Southern hemisphere.
Analysis of the image pairs separated by long enough time intervals (30 min–2 h) allowed us to measure velocities of displacement of cloud features. An automated digital procedure was used to process the cloud images [6,17,18]. The analyzed data consisted of images taken from the ascending branch of the orbit at 63,000 km to ~12,000 km distance to Venus at a spatial resolution of 50 km/pixel to 10 km/pixel correspondingly.
The second dataset of wind vectors was derived from the images of the Ultraviolet Imager (UVI) camera [19] on board the Akatsuki orbiter [5]. Out of two bands of the UVI/Akatsuki camera (283 nm and 365 nm), we used the second one for consistency with the VMC/Venus Express observations. Since December 2015, the Akatsuki spacecraft has been operating on a highly elliptical equatorial orbit around Venus (less than 10° inclination) with an orbital period of 10.5 Earth days. This orbit allowed comparison of the wind fields in both hemispheres. The spatial resolution of the UVI images used in this analysis ranges from ~78 km/pixel for images close to the apocenter (~375,000 km) to 13 km/pixel at a distance of ~65,000 km, at which the observed Venusian disk has maximal size. The dayside calibrated images (365 nm) were taken from the version VCO-V-UVI-3-CDR [20], with the corresponding level 3x geometry [21]. For close-up images, we made visual verification of limb fitting. The images with bad limb fitting were rejected.
We enhanced the contrast of the cloud features in UVI images in the same way it had been conducted for the infrared (IR) [22] and visible (VIS) [23] channels of the VMC due to their initially low contrast. The contrast enhancement procedure allowed for increasing the number of retrieved vectors per image pair and expanding the longitude–latitude coverage. Brightness correction of each pixel was performed according to Minnaert’s law [24,25,26] with subsequent application of a 2D-wavelet filter. RegiStax software was used to apply the 2D-wavelet filter (http://www.astronomie.be/registax/, accessed on 28 November 2022) [27,28].
The total, almost-continuous temporal coverage of data is 14.8 Earth or 24 Venusian years. Due to Venus Express’ orbital particularities, the observations are naturally grouped into Venusian years (or observation seasons; for more details, see [6]). The final VMC dataset contains the orbits that provide coverage of the equatorial latitudes. The final set of vectors (~6000) after processing approximately 420 orbits is distributed relatively evenly across the entire observation period.
UVI images were processed with the algorithm that was previously developed to analyze VMC images [6,17]. The processing of 106 orbits provided approximately 40,000 wind velocity vectors.
To summarize, in this work, we used VMC data from 19 June 2006 to 26 September 2006 and UVI data from 25 April 2016 to 28 May 2021 within 20 ± 2.5 °S around noon (11–13 h LT). The time periods and orbit numbers corresponding to each Venusian year are provided in the Supplementary Materials (SM) (see Table S1 for VMC and Table S2 for UVI).

3. Results

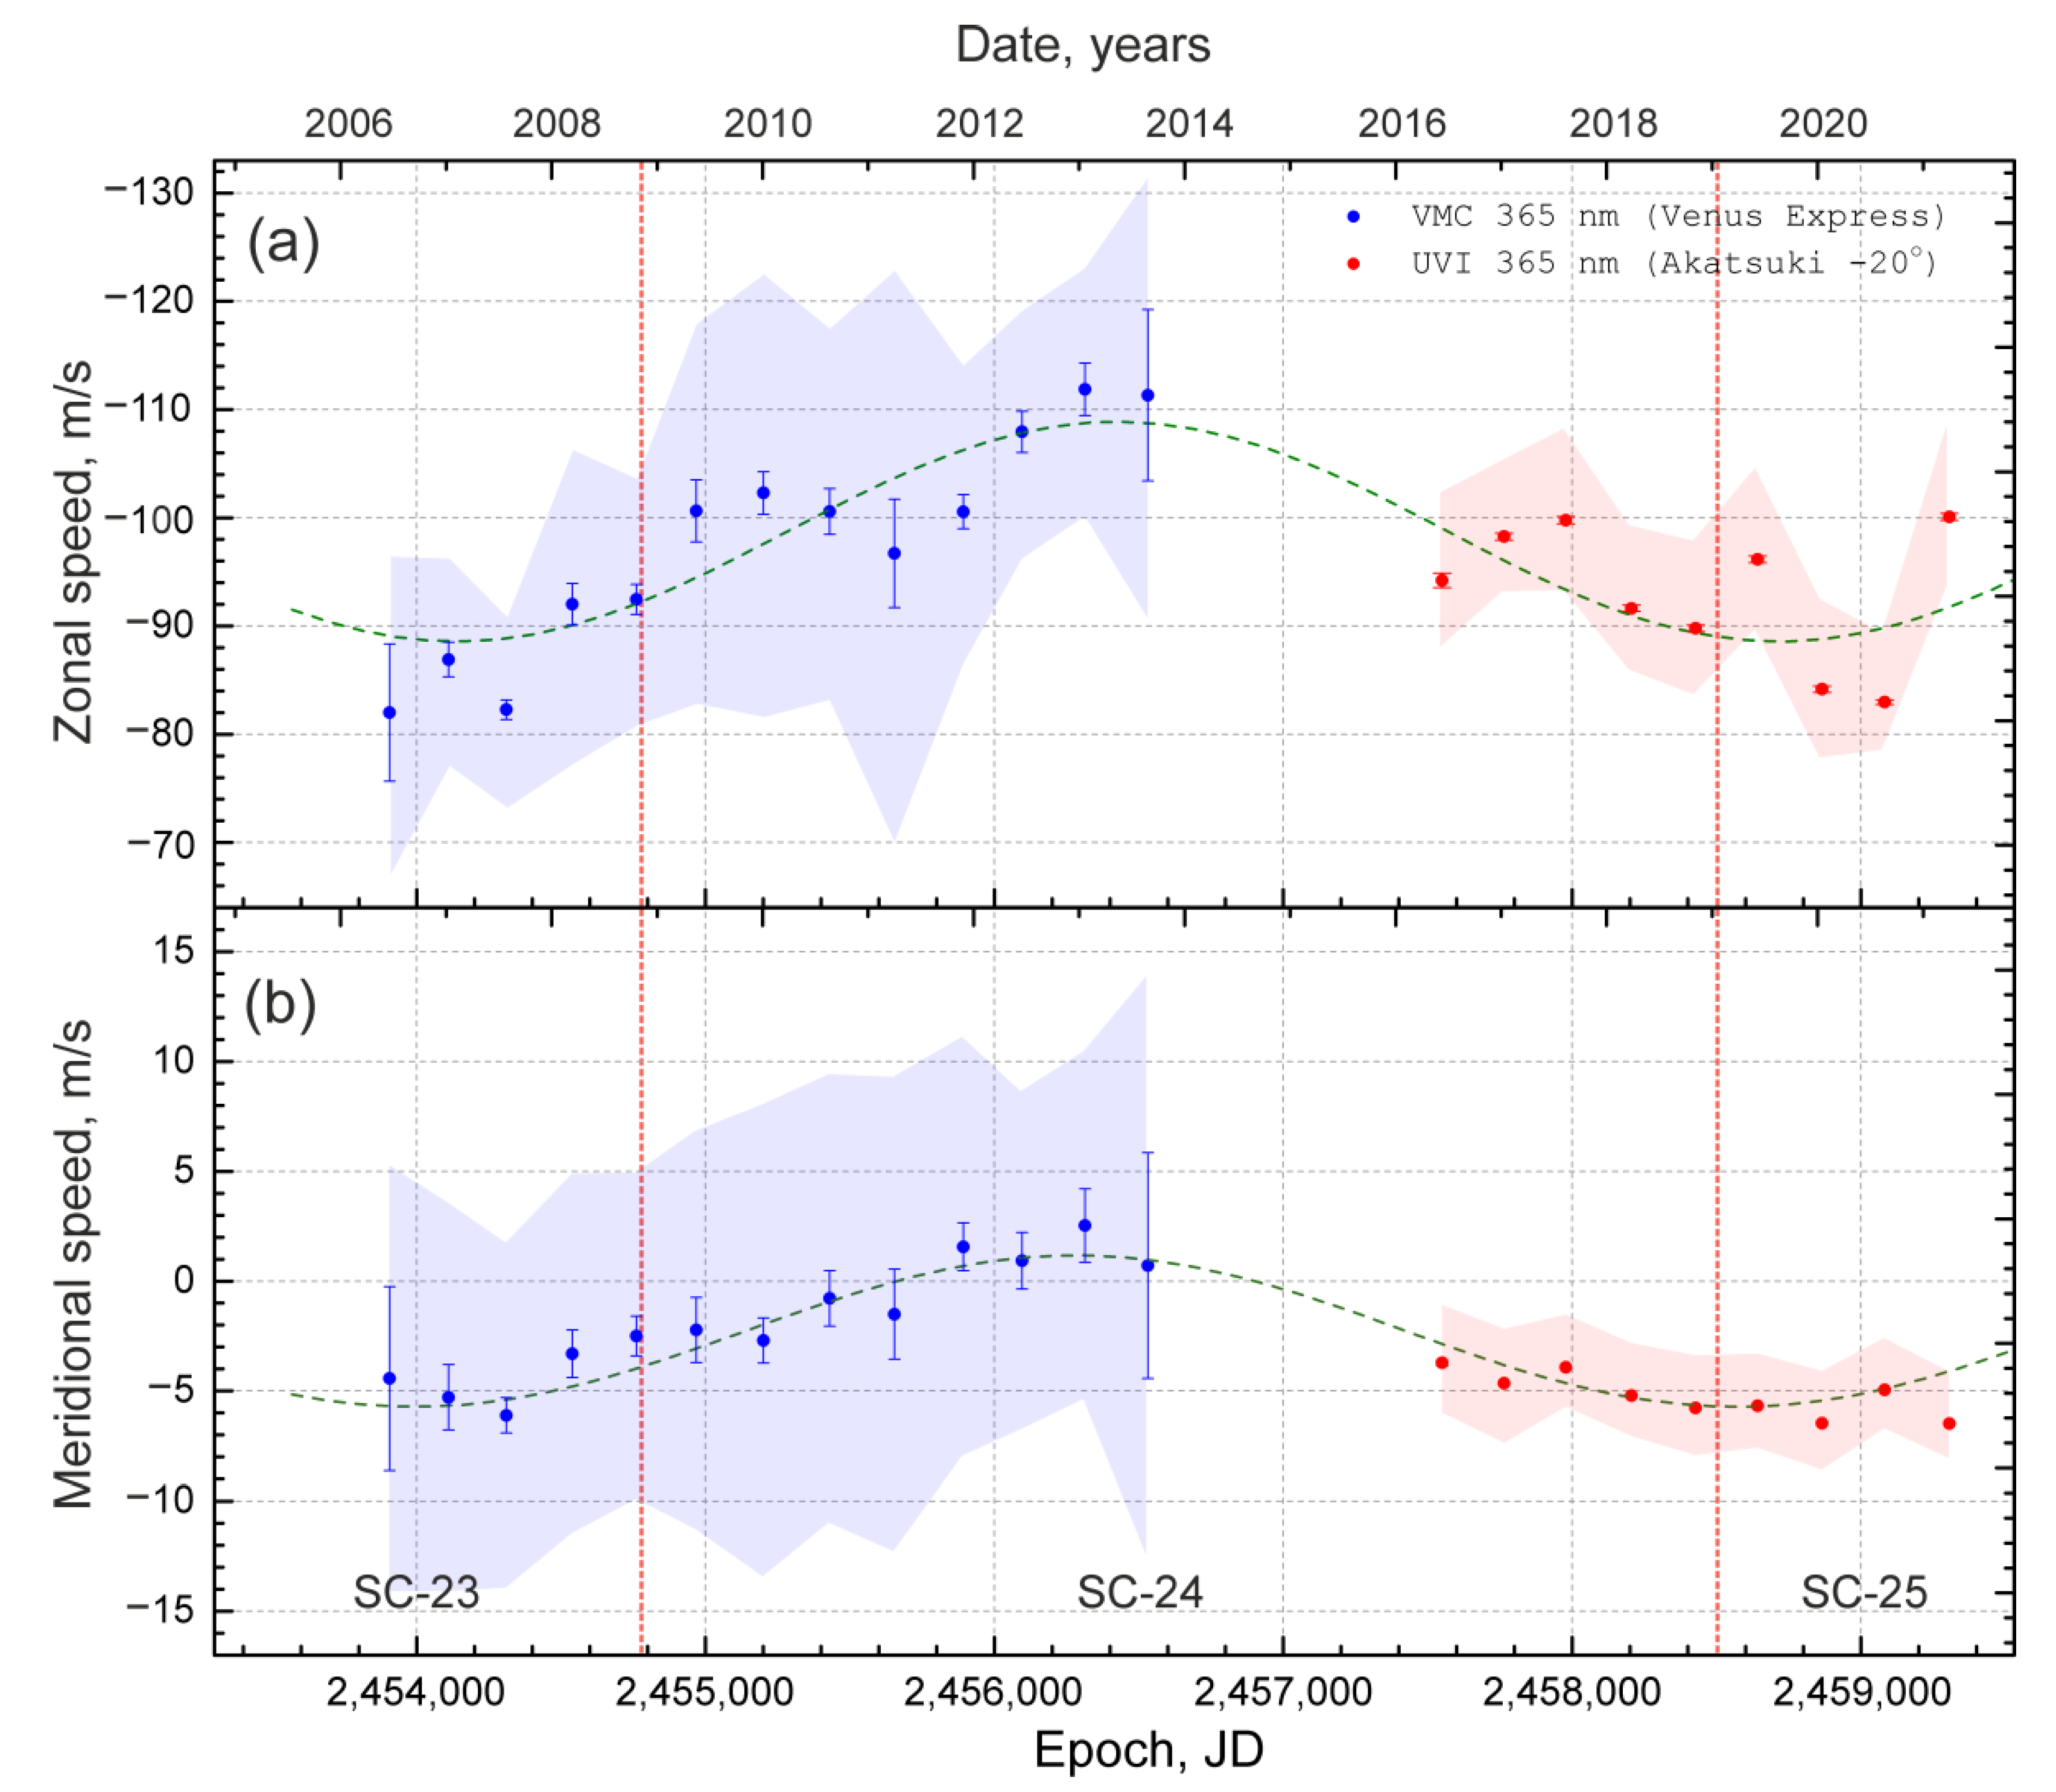
3.1. Variations of the Mean Wind Speed in the Southern Equatorial Latitudes

In 2006–2013, the VMC registered an increase in the mean zonal wind (see Figure 14 in [6]). Figure 1a shows the long-term variations of zonal speed within 20 ± 2.5 °S around noon (12 ± 1 h LT) from UV (365 nm) VMC/Venus Express and UVI/Akatsuki images in 2006–2021. In 2006–2014, the mean zonal velocity notably increases from 82 to 112 m/s. From early 2016 through 2020, the mean zonal wind speed decreases from 95 to 84 m/s. In 2021, the wind speed rises to 100 m/s (Figure 1a). Despite the two-year pause between VMC and UVI observations, we can assume that the mean zonal wind speed trend in the southern equatorial latitudes changes from increasing to decreasing in approximately 2013.
The mean meridional component shows similar long-term variations but of the opposite sign (Figure 1b), changing from −5 to +2 m/s in 2006–2014. Therefore, in 2013, the meridional circulation switches from poleward to slightly equatorward. Hueso et al. [29] also reported the acceleration of the zonal wind and decrease in the value of the meridional component with time from cloud feature tracking in VIRTIS-M/Venus Express UV images (360–400 nm). In 2014–2021, the mean meridional wind speed changes from −3.7 to −6.5 m/s.
Thus, both zonal and meridional cloud top wind components averaged over a Venusian year of horizontal wind show coherent variations.
To extend the wind monitoring interval by two more decades, we added the earlier observations: during the Mariner-10 flyby in 1974 (−92 m/s), by the Pioneer Venus Orbiter in 1979–1985 (−92.8–−94.2 m/s) and during the Galileo flyby in 1990 (−103.2 m/s). These measurements were included in the analysis discussed in the next section.

3.2. Long-Term Variations of the Mean Speed

We analyzed long-term variations of the time series u i ( t ) shown in Figure 1. We used the Lafler–Kinman method [30], which is widely applied in astronomy for detection of periodicities. The method is also referred to as the epoch folding method. For any trial period P a phase curve is created, where for every measurement u i made at the time t i a phase φ i is determined as the fractional part of E = t i t 0 P . Thus, for a periodical time series all measurements performed at different moments are brought together within one cycle. Then, the statistical parameter
θ = i ( u i u i + 1 ) 2 i ( u i u ¯ ) 2
where u ¯ = i u i N is the average over across N measurements is calculated. According to Lafler and Kinman [30], the trial period P is close to the true period P, when parameter θ is minimal. This situation corresponds to the minimum dispersion of points in the phase plot. To analyze our data for periodicity, we used WinEfk software, which implements this method. WinEfk software is provided by V.P. Goranskij (http://www.vgoranskij.net/software/WinEFengInstruction.pdf, accessed on 28 November 2022).
Figure 2 shows a periodogram of the mean zonal speed time series (Figure 1) for the trial periods ranged between 1000 and 5000 Earth days. A strong maximum (of the θ−1 value) is detected at the frequency corresponding to the period of 4576.21 days (12.5 years). Formally, the error of the detected period is rather small. Therefore, keeping in mind the width of the periodogram peak, we assume the error to be 0.5–180 days (0.5 year).
After subtracting the phase curve corresponding to this period, the remaining series does not show any significant periods in the selected frequency range. As a result, the observation date t i and initial date t 0 = 2456314.26 ( φ 0 = 0 ) are related to the period P = 4576.21 and phase (fractional part of E) as follows:
t i = 2456314.26 + 4576.21 E
The phase curves for the zonal and meridional components were calculated for the period of 4576.21 ± 180 days (12.5 ± 0.5 years) (Figure 3). The total time coverage of all the measurements was 5399.14 days (14.8 years). The phase curves were approximated by sine functions using the least-squares method. For the zonal component (Figure 3a), the amplitude was found to be 10.0 ± 1.6 m/s with the mean wind speed value of −98.6 ± 1.3 m/s. The amplitude of the meridional component (Figure 3b) was found to be 3.4 ± 0.3 m/s with the mean value of −2.3 ± 0.2 m/s. Noticeably, the dispersion of points on the phase curve for the zonal speed is higher than for the meridional one. This can be either due to morphological properties of the Venusian clouds or intrinsic variations. The cloud features used for the wind tracking have zonally elongated shapes due to the mostly zonal transport. This leads to a more precise determination of meridional displacement (see details in [6]). It is also worth noting that the approximation of the phase curves with sine functions does not mean a precisely harmonic mode of the long-term variations. This approximation is used to illustrate periodical character of the measurements in this time interval.
Figure 3a also includes mean zonal wind speed results from the previous missions, Television Photography Experiment (TPE)/Mariner-10 [31], Orbiter Cloud Photo-Polarimeter (OCPP)/Pioneer Venus [32] and Solid-State Imaging (SSI)/Galileo [33], for comparison to the VMC and UVI results. These early measurements (Table S3 in SM) fit remarkably well in the period and amplitude of the periodical variations derived in this work, thus tentatively indicating that the periodicity has existed for at least 50 years.
The plots similar to Figure 3 for the trial periods of 13.00, 12.53, 12.00 and 11.00 years are presented in the Supplementary Material (SM, Figure S2). These examples demonstrate the sensitivity of the match of the early wind measurements to the selected trial period. The measurements from the earlier missions fit the zonal wind phase curve for the 13- and 12-year period quite well. However, decreasing the trial period to 11 years results in a higher dispersion and the mismatch with OCPP/Pioneer Venus measurements becomes critically large. This is where we can see the strong difference between 12–13 years and 11 years due to the much longer time scale.
Thus, the long-term variations of the mean zonal and the meridional wind speed in the upper cloud show periodical behavior within the period of 12.5 ± 0.5 years.

4. Discussion

The observed periodicity of the cloud top circulation can be driven either by an internal vacillation of the atmosphere, the nature of which is still unknown, or be caused by external forcing. In this section, we discuss other observations that correlate with variations of the cloud top winds and try to outline possible external mechanisms affecting the cloud top circulation.

4.1. Anti-Correlation of the Cloud Top Wind Field and UV Albedo

Figure 1 shows long-term variations of the mean zonal and meridional wind speed at 20 ± 2.5 °S around local noon (LT = 11–13 h) derived from the VMC/ Venus Express and UVI/ Akatsuki UV imaging. The sine approximation of phase curves suggests that the cloud top circulation vacillates within the period of 12.5 Earth years. Interestingly, the wind speed measurements performed several decades earlier by the TPE/Mariner-10, OCPP/Pioneer Venus and SSI/Galileo spacecraft fit rather well in the derived periodicity, thus tentatively suggesting that the 12.5-year period in the wind field has existed for at least several past decades.
Similar acceleration of the mean zonal wind speed by the end of the Venus Express mission was also found in the wind field derived from the VMC visible channel (513 ± 25 nm). Khatuntsev et al. [23] reported a periodic increase in the number of cloud features seen simultaneously in the UV and visible channel. This tentatively implies extension of the unknown UV absorption feature to visible wavelengths or changes in the vertical distribution of aerosols. This behavior also resulted in apparent quasi-periodic (P~3 Venusian years) variations of the difference between wind velocities measured in the UV and visible channel.
VMC/Venus Express and UVI/ Akatsuki observations during approximately 15 years indicated significant variations of the UV albedo, ranging from 0.25 to 0.4 at equatorial latitudes (0–30 °S) ([13]; see also Figure S1 in SM). Although Shalygina et al. [14] noted that the apparent trend could result from the degradation of the VMC detector sensitivity, we cannot exclude that at least part of the albedo changes are real. The observed variations in the zonal circulation and UV albedo are in remarkable anti-correlation: the smaller the UV albedo, the higher the zonal wind speed. This implies an important physical relation between the cloud level dynamics and abundance and distribution of the unknown UV absorber that strongly affects the radiative energy balance in the upper cloud [34,35]. Lee et al. [13] initially mentioned this connection and discussed its possible physical mechanisms. The general circulation modelling provided a quantitative proof of that the above-mentioned increase in the UV absorber abundance in the upper cloud layer causes acceleration of the zonal flow consistent with the VMC observations.
Contrary to the zonal circulation, the meridional poleward (north–south in the Southern hemisphere) flow decelerates and even changes its direction to equatorward by the end of the Venus Express mission (Figure 1b). The indication of the meridional flow reversal is marginal and does not affect the main result of this paper, i.e., discovery of the 12.5-year period in the cloud top circulation. We note, however, that, if confirmed, the reversal of the meridional flow at low latitudes might be interesting. A simplistic view of the meridional circulation implies equator symmetric meridional winds. However, the equatorial circulation exhibits variations with latitude, local time and altitude, thus breaking the hemispheric symmetry. There is other experimental evidence for this. For instance, the VEGA balloons that detected northward winds in both hemispheres close to the equator present another example of such an asymmetry, albeit in the middle cloud (52–53 km) [36]. Additionally, in the lower cloud level on the nightside (1.74 µm VIRTIS-M/ Venus Express), the meridional flow was shown to occasionally change direction around 7 °S [37].

4.2. Cloud Top Winds and SO2 Abundance

Sulfur dioxide abundance above the clouds exhibits strong, by an order of magnitude, spatial and temporal variations. Of special interest for this study are the long-term changes of SO2 abundance at the cloud top (~70 km) observed during the course of the Pioneer Venus and Venus Express missions [15]. Both missions detected significant variations of the SO2 abundance with the time scale of approximately 5 years in the equatorial regions. Short duration of the observation periods does not allow us to fully quantify the correlation between the cloud top winds and SO2 abundance. However, the trends that can be tentatively derived from the Pioneer Venus and Venus Express observations are not coherent. High zonal wind speeds observed by PV in the beginning of the mission (1979–1980) correspond to very high SO2 abundance, while VEX observed sulfur dioxide enhancement when the wind velocities were low (2007–2008). Thus, we could not arrive at an unambiguous conclusion about the relation between the cloud top winds and sulfur dioxide abundance. However, noteworthy is the increase in SO2 abundance from 2014 to 2019, obtained from the data of the TEXES/NASA InfraRed telescope [38], which is consistent with the decrease in zonal wind speed that we found for the same time interval.

4.3. Cloud Top Winds Periodicity and the Solar Cycle

The period of 12.5 ± 0.5 years is close to the solar magnetic activity Schwabe cycle, which on average lasts for 11 years. The VMC/Venus Express observations started in June of 2006 (Table S1), which corresponds to the end of 23rd Solar cycle (SC), with the minimum in November 2008 [39]. The maximum phase of SC 24 lasted from the end of 2011 through the beginning of 2015. Solar cycle 25 began in December 2019 [39]. The UVI/Akatsuki observation series started at the end of April 2016 (Table S2), when the maximum of SC 24 has already passed. Solar cycle 23 lasted as long as 12.48 years, while SC 24 was approximately 10.8 years long [39]. The minimum of the solar activity between SC 23 and SC 24 was relatively long, more than 3 years (Figure S1 in SM), while the minimum between SC 24 and 25 lasted less than 2 years. Taking into account the variability of the solar cycle period and its blurred boundaries, we may state that the detected value of the long-term wind speed variations of 12.5 ± 0.5 years is not considerably different from the 11 years of the solar activity cycle, variations of which may be within 10–13 years.
It seems quite probable that the long-period variations of the wind speed at the upper cloud boundary are related to the reaction of the massive Venusian atmosphere to the solar activity cycle that can either modulate the energy balance or chemistry of the upper atmosphere. The radiative energy flux varies by 1–2 W/m2 over the solar cycle, which is less than 0.1%. It is doubtful that such a tiny change in deposited solar energy could, by itself, result in significant acceleration (by ~10%) of the atmospheric circulation. A more plausible mechanism is related to enhanced photochemical production of UV absorbers in the upper atmosphere that in turn provokes deposition of additional radiative energy accelerating the circulation. To understand the nature and relation of the observed 12.5-year period to the solar cycle, observations during several solar cycles would be needed.
Venus is often considered as an exoplanet, “next door” and a laboratory for exoplanetary science (e.g., [40]). The detected relationship between the solar activity and the circulation of the massive atmosphere may be an important aspect in such investigations. Long-term periodic brightness variations of the central star may be an argument to similar variations in the atmospheric circulation of exoplanets orbiting such stars.

4.4. On the Influence of Surface Topography

Bertaux et al. [10] found that the zonal wind speed south of the equator (−5 °S … −15 °S) showed conspicuous variations from −101 m/s to −83 m/s correlated with the underlying relief of Aphrodite Terra, the largest province on the surface. This pattern was explained as the result of stationary gravity waves produced by the surface topography transferring momentum to the atmosphere and decelerating the flow.
In contrast to Bertaux et al.’s [10] investigations, in this paper, we analyze the wind measurements averaged over the period of one Venusian year. During this time, interval VMC dayside observations cover an up to 300° longitude range. Since Aphrodite Terra occupies approximately 60 degrees in longitude, the surface influence even from this large province is significantly smoothed in the annual mean zonal wind values. Most of the observed long-term trend in Figure 1a can be explained by the periodical component with the period of 12.5 years. The residual after subtracting it from the observations shows variations of less than 5 m/s. Since the study of the influence of topography on atmospheric dynamics is not the goal of the paper, we left a detailed work on this topic for the future. Figure S3c in the supplementary material shows evolution of the mean longitude observed by the VMC over the course of the mission. Comparison of panels (a) and (c) in Figure S3 shows that both weak and strong winds are observed above Aphrodite Terra, thus suggesting no strong correlation of the zonal wind velocity with the surface topography, at least in the annual mean values.

5. Conclusions

In this paper, we presented the longest almost-continuous data set so far of the zonal and meridional winds at the Venusian cloud top (~70 km) derived from the UV (365 nm) images collected by VMC/Venus Express and UVI/Akatsuki in 2006–2021. The data revealed long-term variations of both zonal and meridional wind components within a period of 12.5 ± 0.5 years. The zonal wind component is characterized by an annual mean of −98.6 ± 1.3 m/s and an amplitude of 10.0 ± 1.6 m/s. The mean meridional wind velocity is −2.3 ± 0.2 m/s and has an amplitude of 3.4 ± 0.3 m/s. The changes in the zonal and meridional components have opposite signs: acceleration of the zonal circulation is accompanied by deceleration and even reversal of the meridional poleward flow. Observations by the earlier missions (Mariner-10, Pioneer Venus and Galileo) fit rather well in the derived periodicity, tentatively suggesting that the 12.5-year period has existed for at least several past decades.
The observed periodicity of the cloud top circulation can be driven either by an internal vacillation of the atmosphere of a still-unknown nature or caused by an external forcing. Simultaneous monitoring of the UV albedo showed coherent changes of the UV albedo ([13]; see also Figure S1c in SM): the lower the UV albedo, the stronger the cloud top zonal winds. This anticorrelation points to a physically sensible explanation linked to the radiative energy deposition in the upper cloud. Low UV albedo resulting from increased abundance of the unknown UV absorber leads to a larger energy deposition that intensifies the circulation. This link was quantitively confirmed by the general circulation modelling [13]. SO2 abundance also demonstrates strong long-term variations [15]. However, we could not arrive at an unambiguous conclusion about the relation between the cloud top winds and sulfur dioxide abundance. In this paper, we analyzed the wind measurements averaged over the period of one Venusian year. During this time interval, VMC dayside observations cover an up to 300° longitude range, thus strongly smoothing surface influence in the annual means in contrast to the investigation by Bertaux et al. [10]. Most of the observed long-term trend in Figure 1a can be explained by the periodical component within the period of 12.5 years. The residual after subtracting it from the observations shows variations of less than 5 m/s. Since the study of the influence of topography on atmospheric dynamics is not the goal of the paper, we left a detailed work on this topic for the future.
The discovered trend in the cloud top circulation correlates rather well with the solar activity cycle (SM, Figure S1). We note that the solar cycle period varies between 10.8 years and 12.5 years, which does not exactly match the observed circulation periodicity. The solar activity can modulate the energy balance or chemistry of the upper atmosphere. The radiative energy flux changes by 1–2 W/m2 during the solar cycle that casts doubts about its ability to significantly (by ~10 %) accelerate the atmospheric circulation. A more plausible mechanism could be related to enhance the photochemical production of UV absorbers in the mesosphere that could, in turn, provoke deposition of additional radiative energy accelerating the circulation.
The discovered periodicity in the cloud top circulation of Venus, and especially its correlation with the solar cycle, is strongly relevant to the study of exoplanets in systems with variable “suns”.

Supplementary Materials

The following supporting information can be downloaded at: https://www.mdpi.com/article/10.3390/atmos13122023/s1. The supplemental material that accompanies this work consists of a PDF file that contains two Tables and two Figures. Tables contain the timeslots and orbit numbers of the VMC/Venus Express (Table S1) and UVI/Akatsuki (Table S2) used in this work. Table S3 contains early measurements of the mean zonal wind speed from the previous missions. The figures provide additional visual information that makes it easier to understand the text in the Discussion and Conclusions section.

Author Contributions

Conceptualization, I.V.K.; Data curation, I.V.K. and M.V.P.; Formal analysis, I.V.K., M.V.P., D.V.T., L.V.Z. and N.I.I.; Investigation, I.V.K. and M.V.P.; Methodology, I.V.K. and M.V.P.; Software, I.V.K. and M.V.P.; Supervision, I.V.K.; Validation, I.V.K., M.V.P., D.V.T., L.V.Z. and N.I.I.; Visualization, I.V.K. and M.V.P.; Writing—original draft, I.V.K., M.V.P., D.V.T., L.V.Z., N.I.I. and D.A.G.; Writing—review and editing, I.V.K., M.V.P., D.V.T., L.V.Z., N.I.I. and D.A.G. All authors have read and agreed to the published version of the manuscript.

Funding

This research was funded by the grant 075-15-2020-780 of the Ministry of Science and Higher Education of the Russian Federation.

Institutional Review Board Statement

Not applicable.

Informed Consent Statement

Not applicable.

Data Availability Statement

The retrieved wind tracking vectors for UV (365 nm) images obtained by the VMC/Venus Express and UVI /Akatsuki in the latitude range of 20 ± 2.5 °S at approximately noon (12 ± 1 h) are available in Mendeley Data [41]. The original VMC images used in this work are available on the ESA Planetary Science Archive (PSA) at https://archives.esac.esa.int/psa/#!Table%20View/VMC%20(Venus%20Express)=instrument (accessed on 28 November 2022). The original UVI images are available on the JAXA AKATSUKI Ultraviolet Imager (UVI) Data Archive at https://darts.isas.jaxa.jp/planet/project/akatsuki/uvi.html.en (accessed on 28 November 2022) [20,21].

Acknowledgments

The authors thank S. Lebonnois and Y.J. Lee for helpful comments and sharing the data. We also thank the anonymous reviewers for their useful comments that helped improve the manuscript.

Conflicts of Interest

The authors declare no conflict of interest.

References

  1. Sánchez-Lavega, A.; Lebonnois, S.; Imamura, T.; Read, P.; Luz, D. The Atmospheric Dynamics of Venus. Space Sci. Rev. 2017, 212, 1541–1616. [Google Scholar] [CrossRef]
  2. Del Genio, A.D.; Rossow, W.B. Planetary scale waves and the cyclic nature of cloud top dynamics on Venus. J. Atmos. Sci. 1990, 47, 293–318. [Google Scholar] [CrossRef]
  3. Titov, D.V.; Svedhem, H.; Koschny, D.; Hoofs, R.; Barabash, S.; Bertaux, J.-L.; Drossart, P.; Formisano, V.; Häusler, B.; Korablev, O.; et al. Venus Express science planning. Planet. Space Sci. 2006, 54, 1279–1297. [Google Scholar] [CrossRef]
  4. Svedhem, H.; Titov, D.V.; Taylor, F.W.; Witasse, O. The Venus Express mission. J. Geophys. Res. 2009, 114, E00B33. [Google Scholar] [CrossRef] [Green Version]
  5. Nakamura, M.; Imamura, T.; Ishii, N.; Abe, T.; Kawakatsu, Y.; Hirose, C.; Satoh, T.; Suzuki, M.; Ueno, M.; Yamazaki, A.; et al. AKATSUKI returns to Venus. Earth Planets Space 2016, 68, 75. [Google Scholar] [CrossRef] [Green Version]
  6. Khatuntsev, I.V.; Patsaeva, M.V.; Titov, D.V.; Ignatiev, N.I.; Turin, A.V.; Limaye, S.S.; Markiewicz, W.J.; Almeida, M.; Roatsch, T.; Moissl, R. Cloud level winds from the Venus Express Monitoring Camera imaging. Icarus 2013, 226, 140–158. [Google Scholar] [CrossRef]
  7. Kouyama, T.; Imamura, T.; Nakamura, M.; Satoh, T.; Futaana, Y. Long-term variation in the cloud-tracked zonal velocities at the cloud top of Venus deduced from Venus Express VMC images. J. Geophys. Res. Planets 2013, 118, 37–46. [Google Scholar] [CrossRef]
  8. Markiewicz, W.J.; Titov, D.V.; Ignatiev, N.; Keller, H.U.; Crisp, D.; Limaye, S.S.; Jaumann, R.; Moissl, R.; Thomas, N.; Esposito, L.; et al. Venus Monitoring Camera for Venus Express. Planet. Space Sci. 2007, 55, 1701–1711. [Google Scholar] [CrossRef]
  9. Titov, D.V.; Markiewicz, W.J.; Ignatiev, N.I.; Song, L.; Limaye, S.S.; Sanchez-Lavega, A.; Hesemann, J.; Almeida, M.; Roatsch, T.; Matz, K.D.; et al. Morphology of the cloud tops as observed by the Venus Express Monitoring Camera. Icarus 2012, 217, 682–701. [Google Scholar] [CrossRef]
  10. Bertaux, J.-L.; Khatuntsev, I.V.; Hauchecorne, A.; Markiewicz, W.J.; Marcq, E.; Lebonnois, S.; Patsaeva, M.; Turin, A.; Fedorova, A. Influence of Venus topography on the zonal wind and UV albedo at cloud top level: The role of stationary gravity waves. J. Geophys. Res. Planets 2016, 121, 1087–1101. [Google Scholar] [CrossRef]
  11. Horinouchi, T.; Kouyama, T.; Lee, Y.J.; Murakami, S.; Ogohara, K.; Takagi, M.; Imamura, T.; Nakajima, K.; Peralta, J.; Yamazaki, A.; et al. Mean winds at the cloud top of Venus obtained from two-wavelength UV imaging by Akatsuki. Earth Planets Space 2018, 70, 10. [Google Scholar] [CrossRef]
  12. McGouldrick, K.; Tsang, C.C.C. Discovery of a 150 day period in the Venus condensational clouds. Icarus 2017, 286, 118–133. [Google Scholar] [CrossRef] [Green Version]
  13. Lee, Y.J.; Jessup, K.-L.; Perez-Hoyos, S.; Titov, D.V.; Lebonnois, S.; Peralta, J.; Horinouchi, T.; Imamura, T.; Limaye, S.; Marcq, E.; et al. Long-term Variations of Venus’s 365 nm Albedo Observed by Venus Express, Akatsuki, MESSENGER, and the Hubble Space Telescope. Astron. J. 2019, 158, 126. [Google Scholar] [CrossRef]
  14. Shalygina, O.S.; Shalygin, E.V.; Ignatiev, N.I.; Petrova, E.V. Comment on “Long-term Variations of Venus’s 365 nm Albedo Observed by Venus Express, Akatsuki, MESSENGER, and the Hubble SpaceTelescope” by Lee et al. (2019, AJ, 158, 126). Res. Notes Am. Astron. Soc. 2019, 3, 168. [Google Scholar] [CrossRef]
  15. Marcq, E.; Mills, F.P.; Parkinson, C.P.; Vandaele, A.C. Composition and Chemistry of the Neutral Atmosphere of Venus. Space Sci. Rev 2018, 214, 10. [Google Scholar] [CrossRef] [Green Version]
  16. Peralta, J.; Muto, K.; Hueso, R.; Horinouchi, T.; Sánchez-Lavega, A.; Murakami, S.Y.; Luz, D. Nightside Winds at the Lower Clouds of Venus with Akatsuki/IR2: Longitudinal, Local Time, and Decadal Variations from Comparison with Previous Measurements. Astrophys. J. Suppl. Ser. 2018, 239, 29. [Google Scholar] [CrossRef] [Green Version]
  17. Patsaeva, M.V.; Khatuntsev, I.V.; Patsaev, D.V.; Titov, D.V.; Ignatiev, N.I.; Markiewicz, W.J.; Rodin, A.V. The relationship between mesoscale circulation and cloud morphology at the upper cloud level of Venus from VMC/Venus Express. Planet. Space Sci. 2015, 113, 100–108. [Google Scholar] [CrossRef]
  18. Patsaeva, M.V.; Khatuntsev, I.V.; Zasova, L.V.; Hauchecorne, A.; Titov, D.V.; Bertaux, J.-L. Solar Related Variations of the Cloud Top Circulation Above Aphrodite Terra From VMC/Venus Express Wind Fields. J. Geophys. Res. Planets 2019, 124, 1864–1879. [Google Scholar] [CrossRef]
  19. Yamazaki, A.; Yamada, M.; Lee, Y.J.; Watanabe, S.; Horinouchi, T.; Murakami, S.; Kouyama, T.; Ogohara, K.; Imamura, T.; Sato, T.M.; et al. Ultraviolet imager on Venus orbiter Akatsuki and its initial results. Earth Planets Space 2018, 70, 23. [Google Scholar] [CrossRef] [Green Version]
  20. Murakami, S.; Yamada, M.; Yamazaki, A.; McGouldrick, K.; Yamamoto, Y.; Hashimoto, G.L. Venus Climate Orbiter Akatsuki UVI Calibrated Data v1.0, VCO-V-UVI-3-CDR-V1.0. NASA Planet. Data Syst. 2017. [Google Scholar] [CrossRef]
  21. Murakami, S.; Ogohara, K.; Takagi, M.; Kashimura, H.; Yamada, M.; Kouyama, T.; Horinouchi, T.; Imamura, T. Venus Climate Orbiter Akatsuki UVI Longitude-Latitude Map Data v1.0. JAXA Data Arch. Transm. Syst. 2018. [Google Scholar] [CrossRef]
  22. Khatuntsev, I.V.; Patsaeva, M.V.; Titov, D.V.; Ignatiev, N.I.; Turin, A.V.; Fedorova, A.A.; Markiewicz, W.J. Winds in the middle cloud deck from the near-IR imaging by the Venus Monitoring Camera onboard Venus Express. J. Geophys. Res. Planets 2017, 122, 2312–2327. [Google Scholar] [CrossRef]
  23. Khatuntsev, I.V.; Patsaeva, M.V.; Zasova, L.V.; Titov, D.V.; Ignatiev, N.I.; Gorinov, D.A.; Turin, A.V. Winds From the Visible (513 nm) Images Obtained by the Venus Monitoring Camera Onboard Venus Express. J. Geophys. Res. Planets 2022, 127, e2021JE007032. [Google Scholar] [CrossRef]
  24. Minnaert, M. The reciprocity principle in lunar photometry. Astrophys. J. 1941, 93, 403–410. [Google Scholar] [CrossRef]
  25. Limaye, S.S.; Suomi, V. A normalized view of Venus. J. Atmos. Sci. 1977, 34, 205–215. [Google Scholar] [CrossRef]
  26. Limaye, S.S. Morphology and movements of polarization features on Venus as seen from the Pioneer Orbiter Cloud Photopolarimeter data. Icarus 1984, 57, 362–385. [Google Scholar] [CrossRef]
  27. Berrevoets, C.; DeClerq, B.; George, T.; Makolkin, D.; Maxson, P.; Pilz, B.; Presnyakov, P.; Roel, E.; Weiller, S. RegiStax: Alignment, stacking and processing of images. Astrophys. Source Code Libr. 2012. 2012ascl.soft06001B. [Google Scholar]
  28. Lim, A.; Jaenisch, H.; Handley, J.; Filipovic, M.; White, G.; Hons, A.; Berrevoets, C.; Deragopian, G.; Payne, J.; Schneider, M.; et al. Image resolution and performance analysis of webcams for ground-based astronomy. In Proceedings of the SPIE—The International Society for Optical Engineering, Glasgow, UK, 21–25 June 2004. [Google Scholar] [CrossRef]
  29. Hueso, R.; Peralta, J.; Garate-Lopez, I.; Bandos, T.V.; Sánchez-Lavega, A. Six years of Venus winds at the upper cloud level from UV, visible and near infrared observations from VIRTIS on Venus Express. Planet. Space Sci. 2015, 113–114, 78–99. [Google Scholar] [CrossRef]
  30. Lafler, J.; Kinman, T.D. An RR Lyrae Star Survey with Ihe Lick 20-INCH Astrograph II. The Calculation of RR Lyrae Periods by Electronic Computer. Astrophys. J. Suppl. 1965, 11, 216. [Google Scholar] [CrossRef]
  31. Limaye, S.S.; Suomi, V.E. Cloud motions on Venus: Global structure and organization. J. Atmos. Sci. 1981, 38, 1220–1235. [Google Scholar] [CrossRef]
  32. Limaye, S.S. Venus atmospheric circulation: Known and unknown. J. Geophys. Res. 2007, 112, E04S09. [Google Scholar] [CrossRef] [Green Version]
  33. Belton, M.J.S.; Gierasch, P.J.; Smith, M.D.; Helfenstein, P.; Schinder, P.J.; Pollack, J.B.; Rages, K.; Morrison, D.; Klaasen, K.P.; Pilcher, C.B. Images from Galileo of the Venus cloud deck. Science 1991, 253, 1531–1536. [Google Scholar] [CrossRef] [PubMed] [Green Version]
  34. Limaye, S.S.; Grassi, D.; Mahieux, A.; Migliorini, A.; Tellmann, S.; Titov, D. Venus atmospheric thermal structure and radiative balance. Space Sci. Rev. 2018, 214, 102. [Google Scholar] [CrossRef] [Green Version]
  35. Titov, D.V.; Ignatiev, N.I.; McGouldrick, K.; Wilquet, V.; Wilson, C.F. Clouds and Hazes of Venus. Space Sci. Rev. 2018, 214, 126. [Google Scholar] [CrossRef] [Green Version]
  36. Crisp, D.; Ingersoll, A.P.; Hildebrand, C.E.; Preston, R.A. VEGA balloon meteorological measurements. Adv. Space Res. 1990, 10, 109–124. [Google Scholar] [CrossRef]
  37. Gorinov, D.A.; Zasova, L.V.; Khatuntsev, I.V.; Patsaeva, M.V.; Turin, A.V. Winds in the Lower Cloud Level on the Nightside of Venus from VIRTIS-M (Venus Express) 1.74 μm Images. Atmosphere 2021, 12, 186. [Google Scholar] [CrossRef]
  38. Encrenaz, T.; Greathouse, T.K.; Marcq, E.; Sagawa, H.; Widemann, T.; Bezard, B.; Fouchet, T.; Lefèvre, F.; Lebonnois, S.; Atreya, S.K.; et al. HDO and SO2 thermal mapping on Venus. V. Evidence for a long-term anti-correlation. Astron. Astrophys. 2020, 639, A69. [Google Scholar] [CrossRef]
  39. Woods, T.N.; Harder, J.W.; Kopp, G.; Snow, M. Solar-Cycle Variability Results from the Solar Radiation and Climate Experiment (SORCE) Mission. Sol. Phys. 2022, 297, 43. [Google Scholar] [CrossRef]
  40. Kane, S.R.; Arney, G.; Crisp, D.; Domagal-Goldman, S.; Glaze, L.S.; Goldblatt, C.; Grinspoon, D.; Head, J.W.; Lenardic, A.; Unterborn, C.; et al. Venus as a laboratory for exoplanetary science. J. Geopys. Res. Planets 2019, 124, 2015–2028. [Google Scholar] [CrossRef]
  41. Khatuntsev, I.; Patsaeva, M. Twelve years cycle in the Venusian cloud top winds derived from VMC/Venus Express and UVI/Akatsuki imaging. Mendeley Data 2022, V1. Available online: https://data.mendeley.com/datasets/nfwrrzwr5x/1 (accessed on 28 November 2022).
Figure 1. Long-term variations of the mean zonal (a) and meridional (b) wind speed at 20 ± 2.5 °S at around noon (12 ± 1 h LT) derived from VMC/ Venus Express (blue) and UVI/ Akatsuki (red) images. Each point is the result of averaging over one Venusian year (224.7 days). Vertical red dotted lines mark sequential minima of the solar cycle #24 (Figure S1). Olive dashed lines denote sine functions approximating the measurements. Error bars correspond to 99.6% confidence interval (3· σ X ¯ ). Colored shaded areas correspond to the standard deviations σ. The zonal wind component is negative, indicating east–west retrograde circulation. The negative sign of the meridional speed corresponds to north–south motions.
Atmosphere 13 02023 g001
Figure 2. Periodogram of the mean zonal speed time series in 20 ± 2.5 °S latitude range for the trial period range of 5000–1000 days. Red mark indicates the period of 12.5 years, corresponding to the minimum of the phase dispersion parameter θ.
Atmosphere 13 02023 g002
Figure 3. Phase curves of the zonal (a) and meridional (b) components of the wind speed for the trial period of 12.5 years. Color symbols denote wind measurements by different missions. The green dashed line is the sine approximation of the phase curves.
Atmosphere 13 02023 g003
Publisher’s Note: MDPI stays neutral with regard to jurisdictional claims in published maps and institutional affiliations.

