Article

Selection of Plant Species for Particulate Matter Removal in Urban Environments by Considering Multiple Ecosystem (Dis)Services and Environmental Suitability

Laboratory of Environmental and Urban Ecology, ENdEMIC Research Group, Department of Bioscience Engineering, University of Antwerp, Groenenborgerlaan 171, 2020 Antwerp, Belgium
*
Author to whom correspondence should be addressed.
Atmosphere 2022, 13(12), 1960; https://doi.org/10.3390/atmos13121960
Submission received: 27 October 2022 / Revised: 21 November 2022 / Accepted: 22 November 2022 / Published: 24 November 2022

Abstract

:
To select plant species for particulate matter (PM) removal from urban environments, it is important to consider the plant species’ ecosystem (dis)services and environmental suitability in addition to their effectiveness in PM removal. In this study, 61 plant species were ranked for PM removal using three separate models: (i) leaf traits, (ii) leaf saturation isothermal remanent magnetization (SIRM), and (iii) ecosystem services and disservices. The plant species’ effectiveness in PM accumulation and the effective leaf traits were identified using leaf SIRM. In each model, plant species were assigned scores and weights for each criterion. The weighted average or the product (Π)-value was calculated for each plant species. The weighted average of each plant species was multiplied by the scores of leaf longevity and leaf area index (LAI) to scale up to a yearly basis and per unit of ground surface area. The preference ranking organization method for enrichment of evaluations (PROMETHEE) method was employed for the services and disservices model because of the lack of precise weights for the included criteria in the model. A scenario analysis was performed to determine a change in the ranking of plant species when the weights of the criteria were modified in the services and disservices model. The plant species with increased ecosystem services and reduced ecosystem disservices were Tilia cordata (Mill.), Tilia platyphyllos (Scop.), Alnus incana (L.), Acer campestre (L.), and Picea abies (L.). The findings of this study can be relevant to urban planners for recommending suitable choices of plant species for the development of urban green spaces.

1. Introduction

Urban forests are an asset to the city inhabitants as they provide ecosystem services through pollutant reduction, microclimate regulation, storm water management, thermal comfort, improved human health and well-being, as well as aesthetic and biodiversity benefits [1,2,3]. Ecosystem services (ESs) are defined as benefits that humans obtain from ecosystem functions [4] or as direct or indirect contributions from ecosystems to human well-being [5]. Urban forests also supply ecosystem disservices (EDs), i.e., functions of ecosystems that are considered as negative for human well-being [6], such as biogenic volatile organic compound (BVOC) emissions and allergenicity from pollen emissions. The selection of plant species for urban environments requires a thorough assessment to obtain an optimal provision of ESs and a minimal of EDs of plant species. Incorrect selection of plant species could result in considerable costs to the public and private sectors, particularly if these plant species cannot tolerate limited space or urban stress. Non-optimal growing conditions might result in reduced ESs or increased EDs [7].
Urban forests are connected to other elements of the urban environments such as roads, homes, and industrial parks; as such, management of these infrastructures requires adept coordination [8]. However, citizens are often socio-economically diverse, resulting in a huge variety of values, experiences, and needs. Consequently, the distribution and governance of ESs may vary accordingly [9,10,11]. For example, large-scale aggregated ES studies are unlikely to reflect the values of poorer or more marginalized people [12]. Many studies have demonstrated that people perceive ESs differently based on motivations, i.e., human values [13], wealth, age, education [14], livelihood type [12,15], beneficiary group [16], rural versus urban residents, and citizenship [17]. Therefore, the first step in plant species selection is to determine the purpose that the plants need to serve and, based on that, determine the selection criteria. For example, in “traditional” forestry, wood quality, volume production, and resistance to pests and diseases are included in the selection criteria, whereas in “urban” forestry, very little focus is on wood quality, volume production, or even on growth rates. Instead, more focus is on aesthetic qualities, such as shape and form, flowering, fruiting, leaf colors, bark structure and color, resistance to urban stresses, and so forth [18]. To enhance the choice of plant species for particulate matter removal in urban environments, it is important to incorporate attributes such as leaf longevity, i.e., evergreen or deciduous, to distinguish their lifespan and leaf area index (LAI: one-sided green leaf area per unit ground surface area, expressed in m2 m−2) to characterize the total leaf surface. The duration leaves are exposed to PM emissions and the amount of leaves present in a plant canopy can, overall, predict the effectiveness of a given plant species in improving ambient air quality.
Several researchers have put forward performance indices for urban trees to (i) address various environmental challenges, such as green belt development for pollution alleviation [19,20] and traffic-generated noise reduction [21], (ii) evaluate ESs and goods from urban forests using biophysical indicators, (i.e., tree cover and soil pH) [22], and (iii) plan new streetscapes [23,24]. However, EDs were commonly overlooked. Yang et al. [25] consolidated information found in the literature on plant species frequently found around the world and ranked them based on the following: (a) PM2.5 removal efficiency, (b) suitability in urban environments, and (c) their disservices, using a simple additive method. The drawback of Yang et al.’s [25] approach is that the included criteria do not have weights assigned to them. As a consequence, two or more criteria or their attributes can independently have a large impact on the overall outcome.
In this study, we aim to enhance the selection of effective plant species for PM removal in urban environments while taking into account multiple ecosystem (dis)services and plants’ environmental suitability. The effective plant species (based on leaf magnetic analysis) and the effective leaf traits (i.e., leaf area, specific leaf area, leaf shape, leaf roundness, leaf wettability, and trichome density) for optimal PM removal were identified in our previous study [26]. Additional data from the literature on leaf longevity (i.e., evergreen/deciduous), canopy characteristics (i.e., LAI), origin of plant species (i.e., native/non-native to Western Europe), invasive potential, environmental suitability (i.e., plant hardiness and drought tolerance), disease susceptibility, ESs (i.e., PM mitigation, net carbon sequestration, reduce urban heat island effect, and supporting biodiversity in terms of being food sources for pollinators and insects) and EDs (i.e., BVOC emissions and allergenicity) were consolidated. For the purpose of scaling up the effectiveness of plant species to plant canopy level, leaf longevity and LAI were taken into account.
Next, we employed the preference ranking organization method for enrichment of evaluations for species selection (PROMETHEE) [27]. Finally, a scenario analysis was performed to determine whether the ranking of plant species changed if the weights of the criteria were modified. We hypothesize that (i) the ranking of plant species will be similar using the leaf traits and the leaf magnetic signal as indicator for PM accumulation on leaves because PM accumulation on leaf surfaces is in conformity of their leaf traits; (ii) the ranking of plant species for PM removal changes when other ESs, EDs, and environmental suitability are taken in consideration; and (iii) depending on stakeholders’ preferences, the list of recommended plant species alters and other plant species would be selected for urban greening.

2. Methodology

The following steps were performed subsequently to build the respective models (i.e., leaf traits, leaf SIRM and services and disservices) to enhance the selection of plant species for PM removal in urban environments:
2.1 Determine the effective plant species and effective leaf traits in PM accumulation.
2.2 Determine the criteria for respective models.
2.3 Consolidate data from the literature for the criteria included in the respective models.
2.4 Assign scores and weights to the criteria included in the respective models.
2.5 Calculate the weighted average or product (Π)-value for the plant species included in the respective models.
Each of the steps is described in detail in the following sections.

2.1. Determine the Effective Plant Species and the Effective Leaf Traits in PM Accumulation

In a separate study, we investigated 96 perennial plant species commonly found in the urban environments of western Europe for their effectiveness in PM accumulation on their leaf surfaces [26]. This study was performed as a controlled experiment in a common-garden setting on the premises of the University of Antwerp (Antwerp, Belgium). In brief, the experiment set-up was as follows; a total of 480 plants involving 96 perennial urban plant species (i.e., 45 deciduous broadleaf/needle-like trees, 32 deciduous broadleaf shrubs, 12 evergreen, needle/scale-like, 5 evergreen broadleaves, and 2 climber species), along with their 5 representative replicates, were bought from one nursery (Houtmeyers in Eindhout, Laakdal, Belgium). These plants were planted in 15 L pots with organic potting soil and controlled release fertilizer and placed randomly in a 1.5 m × 1.5 m arrangement. All plants were generously watered. Leaf samples of each investigated plant species were fully grown and free of pests and diseases. To determine the effectiveness of plant species in PM accumulation on leaf surfaces, we measured the ferro-magnetic and magnetizable component of PM [26] using leaf saturation isothermal remanent magnetization (SIRM) in September 2016. Of the evergreen plant species, we harvested leaves that emerged in May–June to minimize the time exposure bias between deciduous and evergreen species. The effective leaf traits in PM accumulation were also analyzed in the same study by applying the random forest algorithm [28]. The explanatory variables (i.e., leaf traits) on the basis of their importance in PM accumulation were ranked and termed as variables of importance.

2.2. Determine the Criteria for Building Leaf Traits, Leaf SIRM, and Services and Disservices Models

Based on the outcomes of multiple linear regression and random forest from our previous study [26], the criteria included in the leaf traits model consisted of [single leaf area (cm2), specific leaf area (m2 kg−1), leaf dissection index (LDI: dimensionless), leaf roundness (dimensionless), leaf wettability (angular degrees), and trichome density (mm−2)]. Additional data from the literature on leaf longevity and the LAI were included to scale up to a yearly basis and per unit of ground surface area.
In the leaf SIRM model, the criteria included were leaf SIRM values (i.e., measured in September 2016), leaf longevity, and LAI.
The services and disservices model included criteria on the ESs (i.e., PM mitigation, supporting biodiversity, reduce urban heat island effect, and net carbon sequestration), the EDs (disease susceptibility, allergenicity, and BVOC emissions) and environmental suitability (i.e., plant hardiness and drought tolerance).

2.3. Consolidate Data from the Literature for the Criteria Included in the Respective Models

The data for leaf longevity and leaf area index (LAI) included in the leaf traits and leaf SIRM model were collected from the literature. The data for criteria included in the services and disservices model were predominantly gathered from the literature. The data source for each criterion is indicated in Table 1. In this study, we were unable to include 96 perennial urban plant species initially investigated for PM removal capacity [26] in the leaf traits, leaf SIRM, and services and disservices models. This was mainly because of the unavailability of data on criterion such as LAI. Only those plant species were included that had data available on each of the included criterion in the respective models. Therefore, the leaf traits and the leaf SIRM models consisted of a subset of plant species (n = 61). Similarly, due to missing information on ecosystem (dis)services and environmental suitability, a subset of plant species (n = 21) was included in the services and disservices model.

2.4. Assign Scores and Weights to the Criteria Included in the Respective Models

In the leaf traits model, the scores were assigned on a scale of 1 to 3, with 1 pointing to low PM-removal potential and 3 as high PM-removal potential. For criteria with Boolean data (i.e., yes/no), we used values 1 and 3 to maintain the same scoring range for all criteria. A detailed explanation has been provided in Section 2.4.1, Section 2.4.2, Section 2.4.3 for the underlying reasons to include specific criteria in each model. In addition, data classification methods used and the rationale for each assigned score has also been explained. The measured data values (i.e., leaf traits and leaf SIRM), with the exception of LAI and leaf longevity, were classified into three groups using quantile classification in the software R, version 3.4.2 (R Development Core Team 2017) and the package classInt [29]. For leaf traits and leaf SIRM models, the higher the Π-value, the more the considered species contributes to the delivery of a service. The leaf longevity and LAI were used to scale up the weighted average scores on a yearly basis and per unit of ground surface area. The assignment of weights (Table 2) for leaf traits was based on the outcomes of the multiple linear regression (MLR) analyses and random forest employed in our previous study [26]. The advantage of the leaf traits model is that it considers only the leaf traits, coupled with leaf longevity and LAI, which can be used when research facilities may be minimally equipped, whereas the leaf SIRM model is straightforward as it considers the measured leaf SIRM values.

2.4.1. Leaf Traits Model

The primary aim of leaf traits model is to identify the effective plant species based only on leaf traits coupled with leaf longevity and LAI (Table 3). Based on the outcomes of the random forest algorithm, the variable of importance (i.e., leaf traits) in the leaf traits model were as follows: i.e., single leaf area, specific leaf area, leaf dissection index, leaf roundness, leaf wettability, and trichome density.
Single leaf area (cm2): to measure the single leaf area, fresh leaves were scanned using a CanoScan LiDE 110 scanner (resolution of 300 dpi) and leaf area measurements were obtained using ImageJ (https://imagej.nih.gov/ij/, accessed on 26 October 2022). The relationship between single leaf area and PM accumulation was not indicated as significant in our previous study [26]. Leaf area is related to boundary layer thickness: the larger the leaf, the thicker the boundary layer and lower the deposition per surface area [30]. Therefore, large leaves were given a low score, whereas small leaves were given a high score. The single leaf area measurements were classified into three groups using the Jenks natural breaks classification. Leaves with a leaf area ranging from 97.1 to 182.3 cm2 were assigned a score of 1, leaves with a leaf area ranging from 33.8 to 97.0 cm2 were assigned a score of 2, and leaves with a leaf area ranging from 0.1 to 33.7 cm2 were assigned a score of 3.
Leaf dissection index (LDI: dimensionless): the leaf perimeter divided by the square root of leaf area indicates the leaf shape complexity in terms of LDI. Linear and serrated leaves show a high LDI, whereas circular and unserrated leaves have a low LDI, as analyzed in our previous study [26]. In general, the relationship between LDI and PM accumulation is positive. For example, a circular and unserrated leaf with low LDI will have a thicker boundary layer, resulting in low deposition as shown in previous studies [30,31,32,33]. Nonetheless, the relationship between LDI and PM accumulation was not indicated as significant in our previous study [26]. The LDI measurements were classified into three groups using the Jenks natural breaks classification. Leaves with an LDI ranging from 6.8 to 11.3 were assigned a score of 1, leaves with an LDI ranging from 11.4 to 22.4 were assigned a score of 2, and leaves with an LDI ranging from 22.5 to 42.5 were assigned a score of 3.
Leaf roundness (dimensionless) is a measure for indicating leaf shape in terms of the circularity of the leaf (i.e., a function of leaf perimeter and leaf area). Leaf roundness measurements are similar to circularity measurements but are insensitive to irregular borders along the perimeter of an object. A rounded leaf will result in a roundness value close to 1, while linear elongated leaves have a roundness value close to 0. A negative but not significant relationship between leaf roundness and PM accumulation was indicated in our previous study [26]. The leaf roundness measurements were classified into three groups using the Jenks natural breaks classification. Leaves with a roundness value ranging from 0.69 to 0.95 were assigned a score of 1, leaves with a roundness value ranging from 0.36 to 0.68 were assigned a score of 2, and leaves with a roundness value ranging from 0.05 to 0.35 were assigned a score of 3.
Specific leaf area (SLA: m2 kg−1): the specific leaf area (SLA; expressed in m2 kg−1) was calculated as the leaf area (m2) per unit leaf dry matter (kg−1) [34]. The leaf area of the samples were measured on fresh leaves. The SLA is a measure to indicate the structure, thickness, or density of the leaf [35]. A thick leaf will result in a low SLA value, while a thin leaf results in a high SLA value. A significant and negative (p < 0.001) relationship between SLA and PM accumulation was indicated in our previous study [26] using multiple linear regression. The SLA values were classified into three groups using the Jenks natural breaks classification. Leaves with SLA values ranging from 14.8 to 23.6 m2 kg−1 were assigned a score of 1, leaves with SLA values ranging from 9.5 to 14.7 m2 kg−1 were assigned a score of 2, and leaves with SLA values ranging from 3.8 to 9.4 m2 kg−1were assigned a score of 3.
Leaf wettability (angular degrees °): leaf wettability was determined by measuring the drop contact angle (DCA), the angle between a water droplet and the leaf surface [36]. A significant (p = 0.049) and negative relationship between DCA and PM accumulation was indicated in our previous study [26]. Leaf wettability influences the PM accumulation on leaf surfaces [37,38]. Leaves with low wettability can be anti-adhesive because PM does not adhere to the leaf surface as much but adheres more to the water droplets. Hence, the PM may be removed when water droplets roll off the leaf surface, resulting in the self-cleaning mechanism of leaves also known as the lotus effect [39]. Leaf wettability classification intervals were as defined in the literature [40,41]. Leaves with a DCA greater than 100° were assigned a score of 1 because hydrophobic leaf surfaces tend to self-clean, resulting in a lower PM accumulation; conversely, hydrophilic leaves accumulate more PM on their leaf surfaces. Therefore, leaves with a DCA between 90° to 100° were assigned a score of 2, whereas leaves with a DCA less than 90° were assigned a score of 3.
Trichome density (mm−2): the trichome density (i.e., the number of trichomes per leaf surface area) was analyzed using light microscopy after chlorophyll clearing (for complete dataset on trichome density per plant species and a detailed description on the chlorophyll clearing methodology refer to our previous study [26]). Trichome density contributes to the roughness of the leaf surface while influencing the leaf boundary layer, thereby enhancing PM accumulation and immobilization. Based on the findings of our previous study [26] using the random forest algorithm, the absence of trichomes is the first variable of importance in identifying plant species that may have a low PM accumulation on their leaf surfaces. Therefore, a score of 1 was assigned to plant species that did not possess any trichomes; leaves with sparse (≤10 mm−2) trichomes were assigned a score of 2, while leaves with dense (>10 mm−2) trichomes were assigned a score of 3.
Leaf longevity indicates the plants’ persistence or lifespan (i.e., evergreen or deciduous). Leaves of deciduous broadleaf/needle-like trees and shrubs were assigned a score of 0.5 as they have leaves only in the growing season. Leaves of evergreen plants including broadleaf/needle/scale-like were assigned a score of 1 as they have leaves year-round.
Leaf area index (LAI: m2 m−2) is the one-sided green leaf area (m2) per unit ground surface area (m2). The larger the LAI, the more leaf area is available to accumulate PM. The actual LAI values were used in the leaf traits and leaf SIRM models to scale up from leaf to canopy level.

2.4.2. Leaf SIRM Model

The primary aim of the leaf SIRM model was to identify effective plant species based on leaf SIRM values as measured in our previous study [26] in September 2016, coupled with leaf longevity and LAI (Table 4). The leaf SIRM model included the following criteria: scores of leaf SIRM values, leaf longevity, and LAI. The classification method and score assignment for LAI and leaf longevity has been described in the ‘leaf traits’ model Section 2.4.1.
Saturation isothermal remanent magnetization (SIRM: µA) indicates the ferro-magnetic and magnetizable component of PM accumulated on leaf surfaces. The leaf SIRM values measured in September 2016 in our previous study [26] were classified into three groups using the Jenks natural breaks classification. Leaf SIRM values ranging from 3.1 to 15.1 µA were assigned a score of 1, leaf SIRM values ranging from 15.2 to 24.6 µA were assigned a score of 2, and leaf SIRM values ranging from 24.7 to 39.8 µA were assigned a score of 3.

2.4.3. Services and Disservices Model

The purpose of building a services and disservices model in this study was to further enhance the plant species selection for urban environments. The benchmark for selecting urban plants to reduce PM in urban environments should not be limited to the plant species’ effectiveness in PM accumulation on leaf surfaces. Several other aspects need to be taken into consideration, for example, are plant species native to that region or do they hold a potential of becoming invasive. In addition, with rising air temperatures and more frequent and severe periods of drought [42], the environmental suitability of plant species’ is a vital factor to be taken into consideration, as well as the ecosystem services and disservices provided by those plant species. A brief explanation of each criterion regarding ESs (PM mitigation, supporting biodiversity, reducing urban heat island effect, and net carbon sequestration), EDSs (allergenicity and BVOC emissions), and environmental suitability (nativeness and invasiveness, drought tolerance, hardiness for low temperatures, and disease susceptibility) included in this model is given below.
ES—PM mitigation: the PM mitigation criterion was included in the service and disservices model because it is an ecosystem service that the plant species provide. The included plant species were assigned scores based on the performance values obtained from the leaf SIRM model (refer Section 2.4.2, Table 4).
ES—supporting biodiversity: the supporting biodiversity criterion indicates the contribution of the plant species in providing provision to birds and pollinators. A two-step approach consisted of (a) determining if the plant species were pollinated by wind or by birds, bees, or other insects, and (b) identifying if the plant parts are a source of provision for birds and pollinators. A score of 3 was assigned to plant species if they are pollinated by bees or other insects and the plant parts are a source of provision to birds and pollinators. A score of 2 was assigned to plant species if they are pollinated by wind and the plant parts are a source of provision for birds and pollinators. A score of 1 was assigned to plant species irrespective of the form of pollination (i.e., by wind or by birds, bees, or other insects) of which the plant parts are poisonous and a health hazard to other living organisms when consumed.
ES—reducing urban heat island effect: the reducing urban heat island effect or the microclimate regulation effect indicates a plant species’ effectiveness in reducing air temperatures in the urban environments. This criterion has been categorically classified into three groups (i.e., high, moderate, and low) based on the expert judgement and growth characteristics as provided by Roloff and Bärtels [43]. Plant species that grow large (height over 15 m) and develop broad and densely foliated crowns were assigned a score of 3. Medium-sized plants (height 10–15 m) with open or relatively small crowns were assigned a score of 2. Small plants (height < 10 m) with narrow columnar-shaped crowns were assigned a score of 1.
ES—net carbon sequestration: the net carbon sequestration criterion was important to include in the services and disservices model because carbon dioxide is the most marked constituent of anthropogenic greenhouse gas emissions. It mainly originates from fuel-combustion-related activities such as the heating and cooling of dwellings. Plants possess the ability to sequester carbon dioxide during photosynthesis and can therefore store carbon in plant biomass and in the soil [44]. This criterion has been categorically classified into three groups (i.e., high, moderate, and low) as categorized in a previous study of [45]. Large plants were assigned a score of 3, while moderate and small plants were assigned scores of 2 and 1, respectively.
EDS—allergenicity: the allergenicity criterion is an important aspect to take into consideration as it indicates the plant species’ ability to emit allergens such as pollen. In some cases, plant species with very small hairs from leaves can cause similar effects during pruning activities, consequently worsening the air quality. Based on classification rules proposed by Cariñanos et al. [46], this criterion was classified into three groups. If a plant species has a low tendency to emit allergens then it was assigned a score of 3, while plant species with a tendency of moderate and high emissions were assigned scores of 2 and 1, respectively.
EDS—biogenic volatile organic compound (BVOC) emissions: the BVOC emission criterion indicates a plant species’ potential of emitting BVOCs, possibly resulting in the formation of ground-level ozone. Plants release BVOCs when a plant tissue is damaged either at the time of pruning or mowing, or during pest or disease infestation [47]. According to Singh et al. [48], plant species with BVOC emission rates of <1 µg VOC g dry weight −1 h−1 were classified as low, whereas 1 to 10 µg VOC g dry weight −1 h−1 were classified as moderate and >10 µg VOC g dry weight −1 h−1 as high emitters. A score of 3 was assigned to low-BVOC-emitting plant species, while scores of 2 and 1 were assigned, respectively, to plant species with moderate and high emissions.
Suitability—native and invasive: to maintain plant species diversity and ecological balance, it is crucial to determine that a plant species is native and/or non-invasive. A plant species is considered native if found within its presumed area of evolutionary origin, or if it arrived without human intervention [49]. The introduction of species beyond their native range as a direct or indirect result of human action and causing changes in the ecosystems to which they are introduced are known as non-native plant species [50]. An invasive species is defined as having the ability to produce reproductive offspring, often in very large numbers at considerable distances from the parent and/or site of introduction, and having the potential to spread over long distances [49,51]. This criterion has been categorically classified into three groups, as follows: if a plant species is ‘native and non-invasive’ it was assigned a score of 3, if ‘non-native and non-invasive’ or ‘native and invasive’ a score of 2 was assigned, and a score of 1 was assigned if a plant species was ‘non-native and invasive’.
Suitability—drought tolerance: the drought tolerance criterion of plant species is not directly an ecosystem service or disservice. However, if a plant species is unable to withstand extreme environmental conditions (i.e., high temperature and less precipitation), it may lead to stunted growth or dieback, eventually resulting in loss of ecosystem services. Drought tolerance indicates the ability of a plant species to withstand lack of soil moisture for a prolonged duration. This criterion has been categorically classified into three groups (i.e., high, moderate, and low/no tolerance). A score of 3 was assigned to plant species with a high drought tolerance, while plant species with moderate tolerance to drought were assigned a score of 2. Plant species with low or no tolerance to drought were assigned a score of 1.
Suitability—hardiness for low temperatures: the hardiness for low temperatures criterion of plant species is not directly an ecosystem service or disservice. Nonetheless, if a plant species is unable to thrive in extreme temperature conditions it will likely result in a loss of ecosystem services. The hardiness for low temperatures refers to the plant’s ability to withstand and tolerate extreme temperature conditions [45]. The hardiness of a plant is defined by native geographic locations (i.e., latitude, longitude, and altitude), which are then simplified to determine a hardiness zone. A hardiness zone is a geographic area defined to encompass a certain range of climatic conditions relevant to plant growth and survival. Plant hardiness values published in the literature include a range. The first temperature value indicates the lower limit, while the second temperature value indicates the upper limit [45]. The plant species included in the services and disservices model were found in the USDA zone range of 2 (−45.6 to −40.0 °C) to 10 (−1.1 to +4.4 °C), indicating that the lower the zone number the species occurs in, the higher the hardiness for sub-zero temperatures [43]. Considering the lower limit of the USDA zone range, plant species were assigned a score of 3 if they were found in USDA zones 2 and 3, a score of 2 was assigned to plant species found in USDA zone 4, while plant species occurring in USDA zone 5 and above were assigned a score of 1, taking into account their climate suitability.
Suitability—disease susceptibility: the disease susceptibility criterion indicates the vulnerability of a plant species to diseases. If a plant species is highly susceptible to diseases, it will not only result in high maintenance costs (i.e., removal) but may also pose a threat of spreading the disease to nearby plants. The aim here is not to give in-depth information for each plant species but rather an overview for some of the major diseases (e.g., ash dieback for Fraxinus sp, Dutch elm for Ulmus sp, and fire blight for Crataegus and Malus sp) that can incur added costs to the public or private sectors. This criterion is classified into two categories (i.e., yes/no); if a plant species is not susceptible to diseases, it is assigned a score of 3, while a plant species with susceptibility to diseases is assigned a score of 1. The scores of 1 and 3 were used to maintain the same scoring range for all criteria.

2.5. Calculate the Weighted Average or Product (Π)-Value for Plant Species Included in the Respective Models

The weighted average for each plant species included in the leaf traits model was calculated as follows:
W = i = 1 n x i W i i = 1 n w i
where W = weighted average, n = number of criteria to be averaged, xi = scores assigned to each criterion, and wi = weights applied to each criterion.
For each plant species in the leaf traits model, the product (Π)-value was estimated by multiplying the weighted average of leaf traits with the score of leaf longevity and the LAI. Similarly, for each plant species in the leaf SIRM model, the product (Π)-value was estimated by multiplying the score of leaf SIRM, score of leaf longevity, and the LAI. The Π-values in the respective models were classified into three groups using quantile classification and indicated as high (+++), moderate (++), and low (+) performance of plant species.
As for the services and disservices model, the scores (Table 5) were assigned based on the information in the literature. The PROMETHEE method [52] was used to enhance the selection of plant species for reducing PM in urban environments. We preferred employing PROMETHEE for the following reasons: (a) the unavailability of precise weights for each criterion included in the services and disservices model, (b) its frequent use in planning of natural resources such as forests [53], and (c) its user friendliness [54] and stability [55]. We suppose that when selecting plant species for urban environments, both ESs [56] and EDs [6,57] need to be taken into consideration because overlooking any of the EDs may exacerbate the air quality while affecting the human health and well-being. Therefore, the weights for criteria included in the services and disservices model (Table 2) at first were set to equal. A scenario analysis was performed to determine whether the ranking of plant species changed if the weights of the criteria were modified based on the following three scenarios (S), which are likely to vary based on the perspective of the stakeholders involved [14]. It was important to perform scenario analysis because different stakeholders have different preferences, which can be expressed as weights assigned to each criterion in the model. The scenarios for scenario analysis were as follows:
S1—Select plant species that help in the removal of PM while having low BVOC emissions and allergenicity, (i.e., equally high importance weights for PM mitigation, allergenicity, and BVOC emissions);
S2—Select plant species that help in the removal of PM but are also suitable in severe environmental conditions, (i.e., equally high importance weights for PM mitigation, drought tolerance, disease susceptibility, and native and invasiveness of plant species);
S3—Select plant species that help in the removal of PM while reducing the urban heat island effect, sequestering carbon dioxide, and supporting biodiversity in terms of providing provision to other fauna and microorganisms (i.e., equally high importance weights for PM mitigation, reduce urban heat island effect, net carbon sequestration, and supporting biodiversity).
Prior to analysis, the following configurations were made in the Visual PROMETHEE 1.4 Academic Edition software; the included plant species were the actions, while PM mitigation, supporting biodiversity, reducing urban heat island effect, net carbon sequestration, allergenicity, BVOC emissions, native/ invasiveness, hardiness for low temperatures, drought tolerance, and disease susceptibility were set as criteria. For qualitative criteria, the ‘usual’ preference function is a good choice [27]; thresholds were set to absolute. For scenario analysis, the weights as shown in Table 2 for each scenario (S1, S2, and S3) were adjusted using PROMETHEE-GAIA, the walking weights tool. GAIA stands for ‘graphical analysis for interactive aid’. The investigated plant species were assessed for their overall performance based on the ESs and EDs they provide using the phi net flow scores. The phi refers to the preference flows (phi+ and phi−). The sum of the phi+ minus the sum of the phi− is equal to the phi net flow score of the action (i.e., plant species). The phi net flow scores are in the −1 to +1 range. Plant species with increased ESs and reduced EDs will result in a phi net flow score close to +1. Conversely, plant species with increased EDs and reduced ESs will result in a phi net flow score close to −1

3. Results

3.1. Effective Plant Species for Reducing PM as Identified by the Leaf Traits and Leaf SIRM Models

On the basis of the leaf traits model (Table 3), the investigated plant species (n = 61) showed a Π-value range from 0.93 to 22.33, with the lowest Π-value estimated for L. tartarica (L.), R. glauca (Pourret), and S. purpurea (L.), while the highest Π-value was estimated for P. menziesii (Mirb.), A. fraseri (Pursh.), and P. abies (L.). The broadleaf species with the highest Π-value were I. aquifolium (L.), Q. ilex (L.), and Rhododendron (L.). The investigated plant species (n = 61) in the leaf SIRM model (Table 4) showed a Π-value range from 0.62 to 19.00, with the lowest Π-value estimated for S. purpurea (L.), R. glauca (Pourret.), and L. vulgare (L.) and the highest Π-value estimated for P. menziesii (Mirb.), T. plicata (Donn.), and C. betulus (L.).

3.2. Classification of Plant Species: Similarities and Differences between Leaf Traits and Leaf SIRM Models

Plant species did not rank in an exact identical order in the leaf traits and leaf SIRM models, but an ordinal order (i.e., high, moderate, and low) based on the Π-value was typically maintained for the investigated plant species. Plant species, such as P. menziesii (Mirb.), A. fraseri (Pursh.), T. plicata (Donn.), Q. ilex (L.), and C. betulus (L.), with a high Π-value in the leaf traits model also showed a high Π-value in the leaf SIRM model. Similarly, plants species with moderate (e.g., A. ginnala (Maxim.), A. pseudoplatanus (L.), B. pendula (Roth.), Q. palustris (Münchh.), and R. pseudoacacia (L.)) and low (e.g., B. davidii (Franch.), C. alba (L.), L. vulgare (L.), R. glauca (Pourret.), and S. purpurea (L.)) Π-values in the leaf traits model also showed moderate and low Π-values, respectively, in the leaf SIRM model. There were few exceptions to these findings; for example, A. incana (L.), A. platanoides (L.) and Q. robur (L.) were classified as moderately effective plant species in the leaf traits model, but in the leaf SIRM model they were classified as highly effective ones. Similarly, plant species such as C. sanguinea (L.) and H. syriacus (L.) were grouped in the moderate category of plant species in the leaf traits model but were classified as least effective plant species for PM mitigation in the leaf SIRM model.

3.3. Identifying Plant Species for Reducing PM in Urban Environments Considering the Environment Adaptability and Ecosystem (Dis)Services

The PROMETHEE method facilitated in identifying the most effective plant species for reducing PM in urban environments while incorporating the ESs and EDs these plants species provide. Based on the equal weightage for the criteria (Figure 1) included in the services and disservices model, the least effective plant species in ES provisioning and ED avoidance were L. styraciflua (L.), F. sylvatica (L.), Q. ilex (L.), F. excelsior (L.), and Q. robur (L.), while the most effective plant species in ES provisioning and ED avoidance were T. cordata (Mill.), T. platyphyllos (Scop.), A. incana (L.), A. campestre (L.), and P. abies (L.).

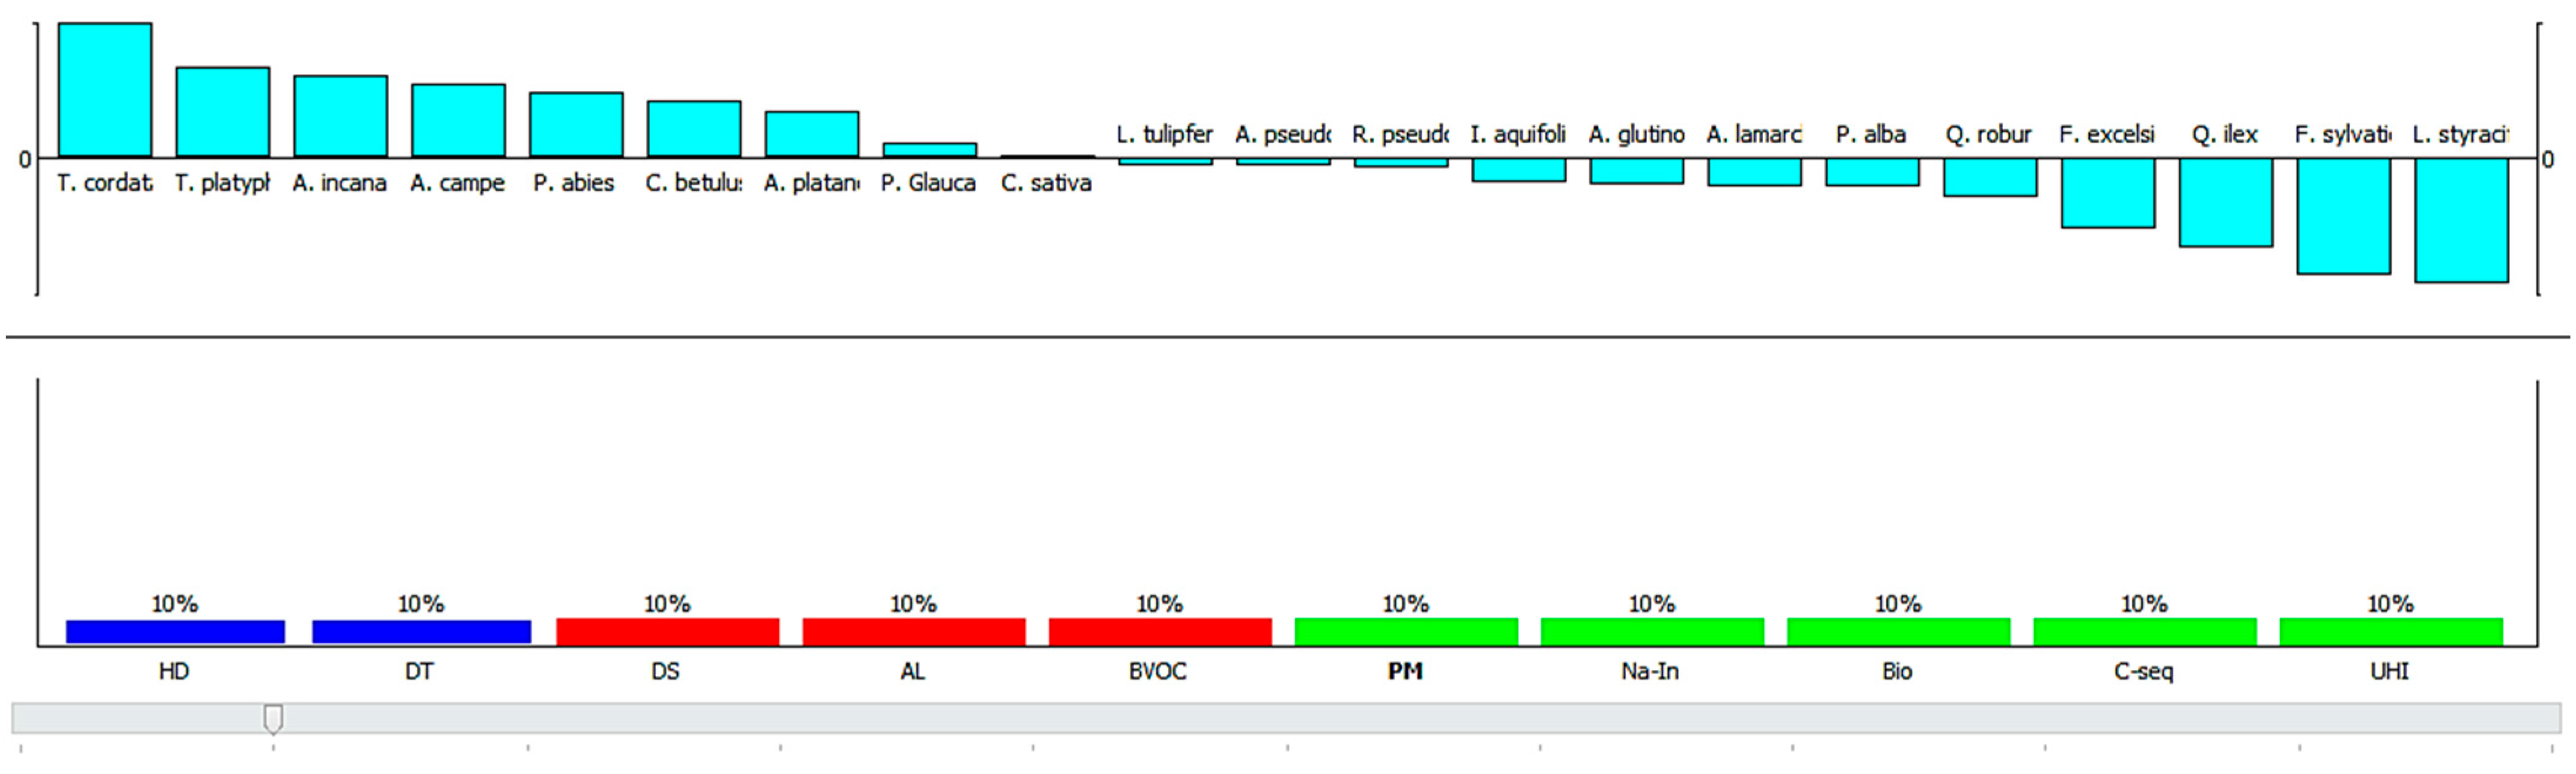
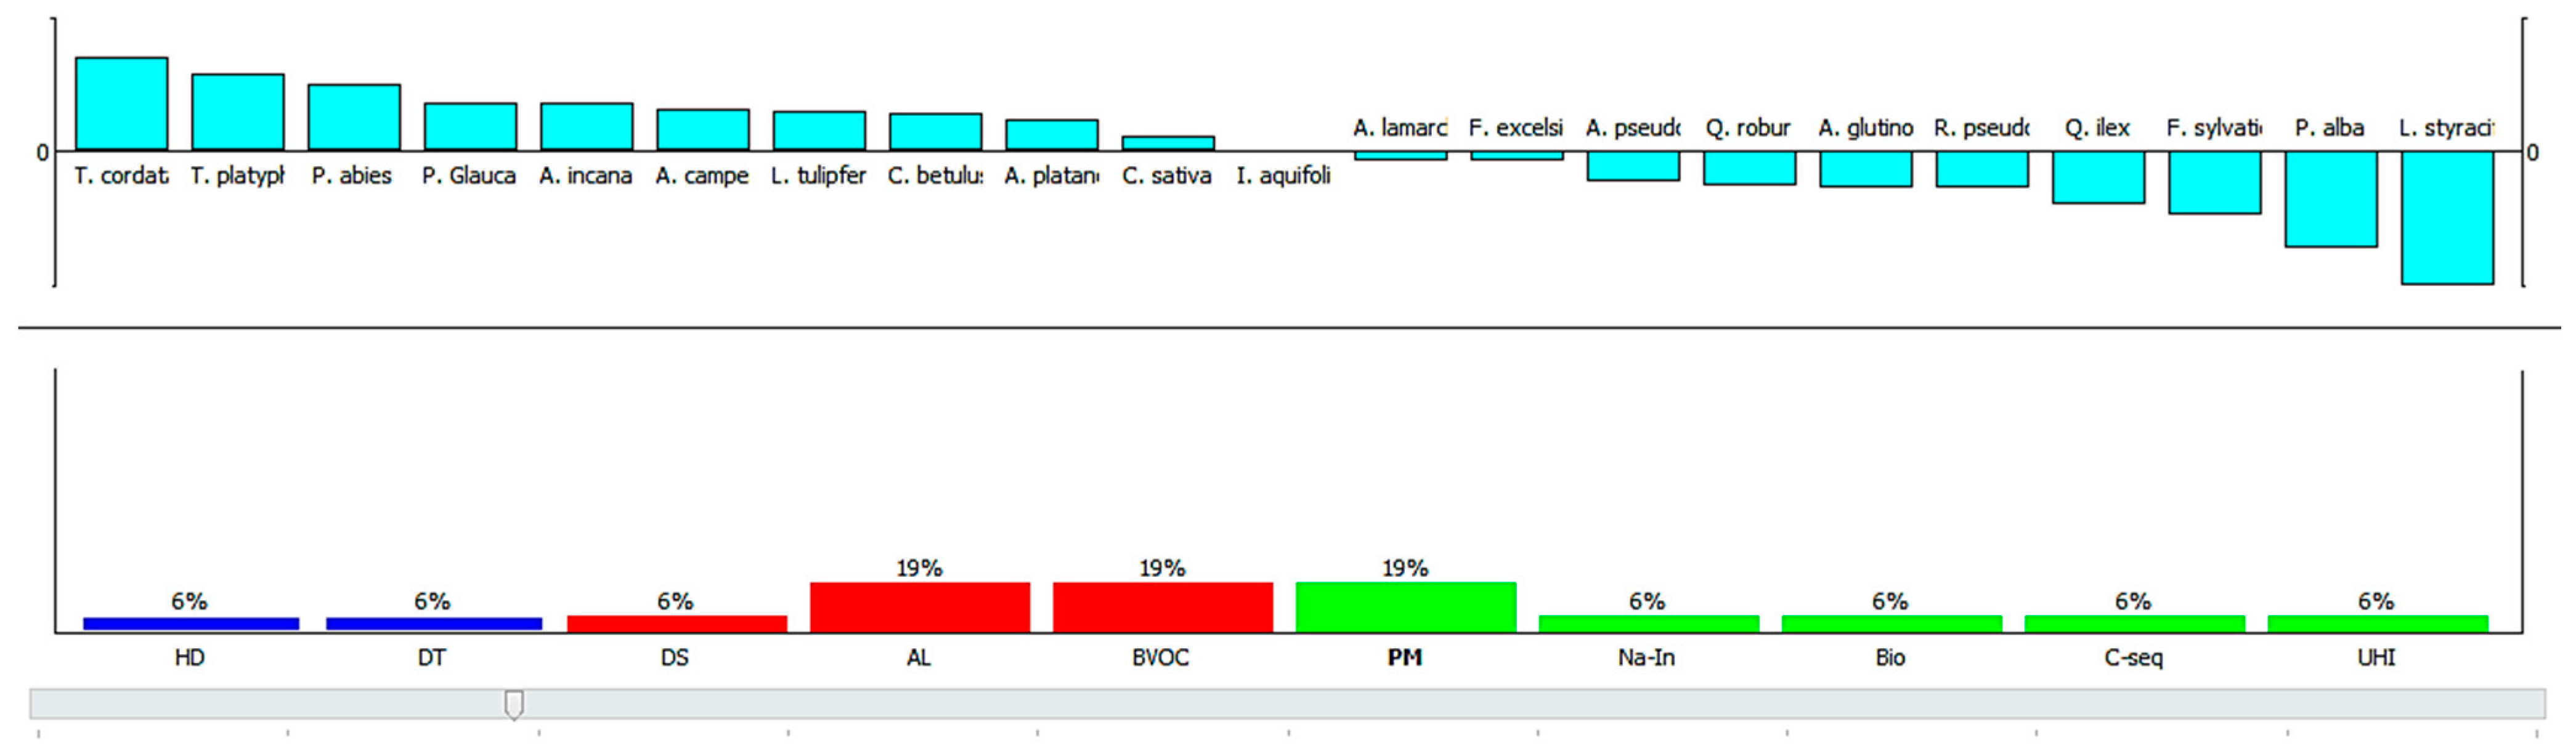
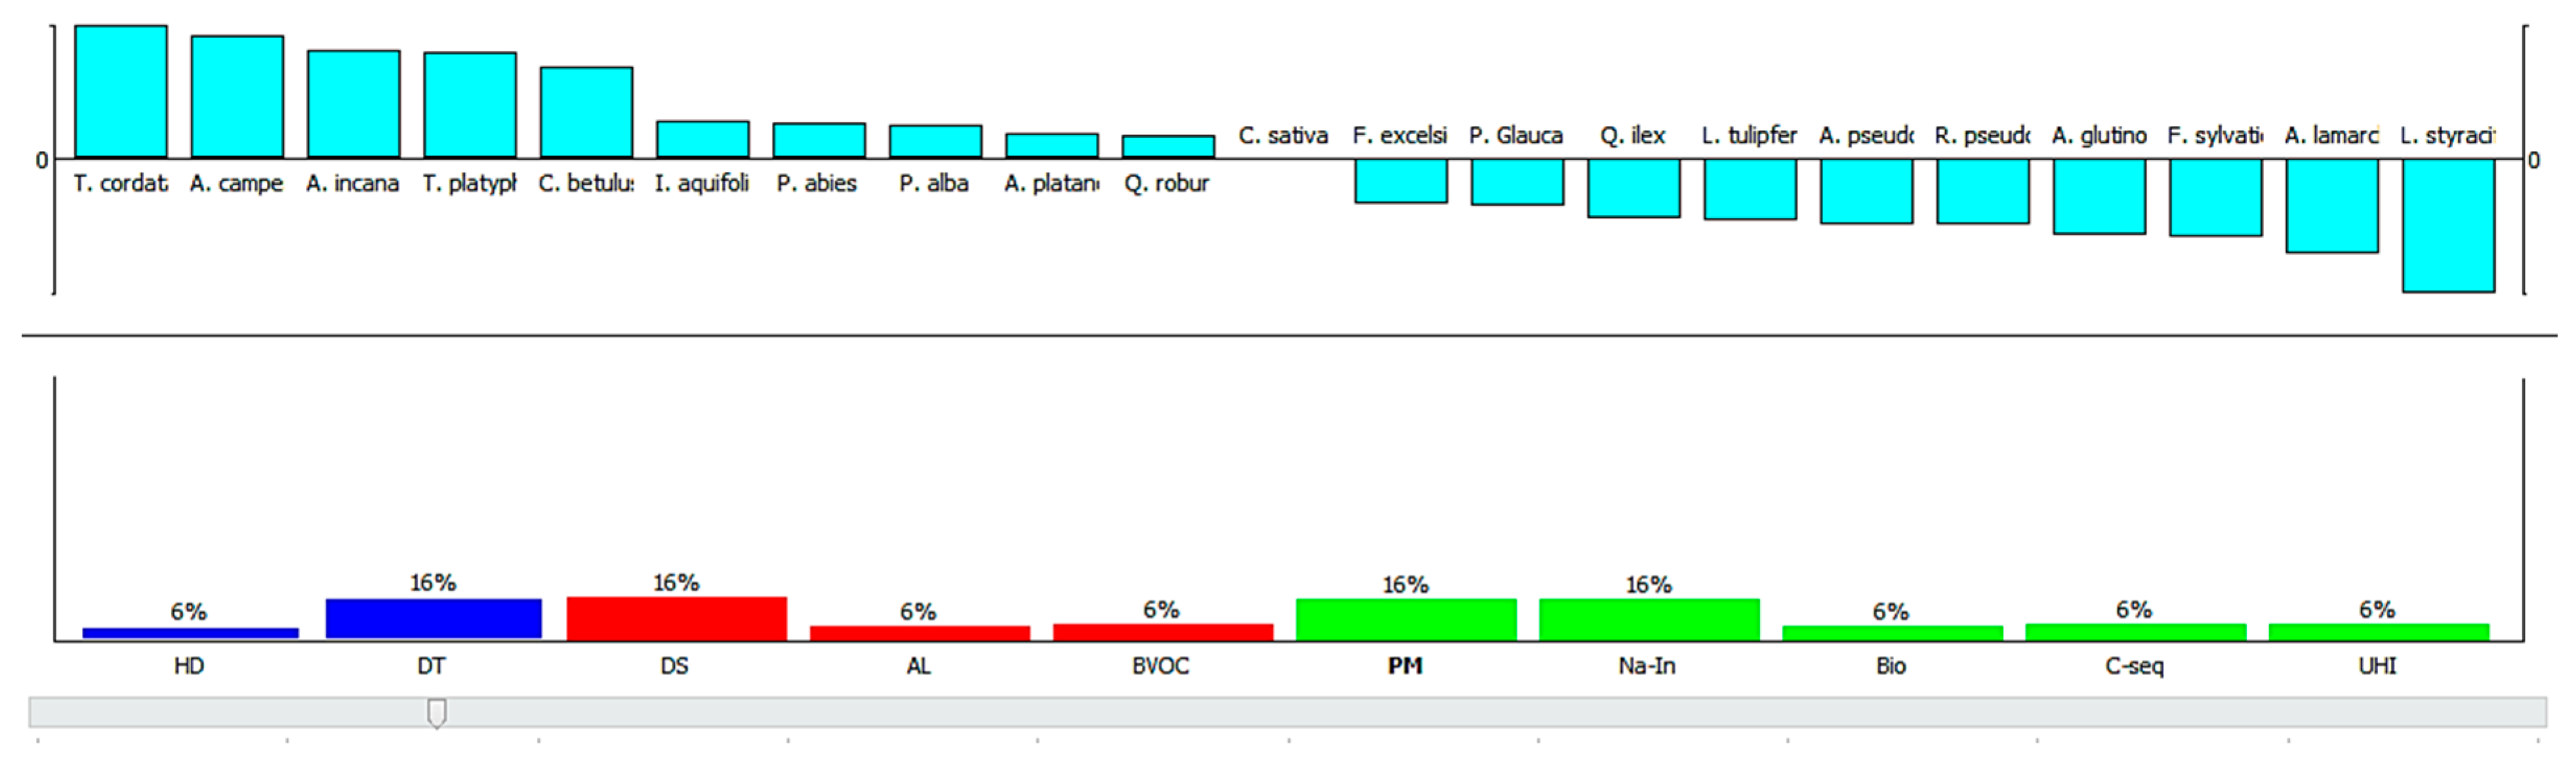
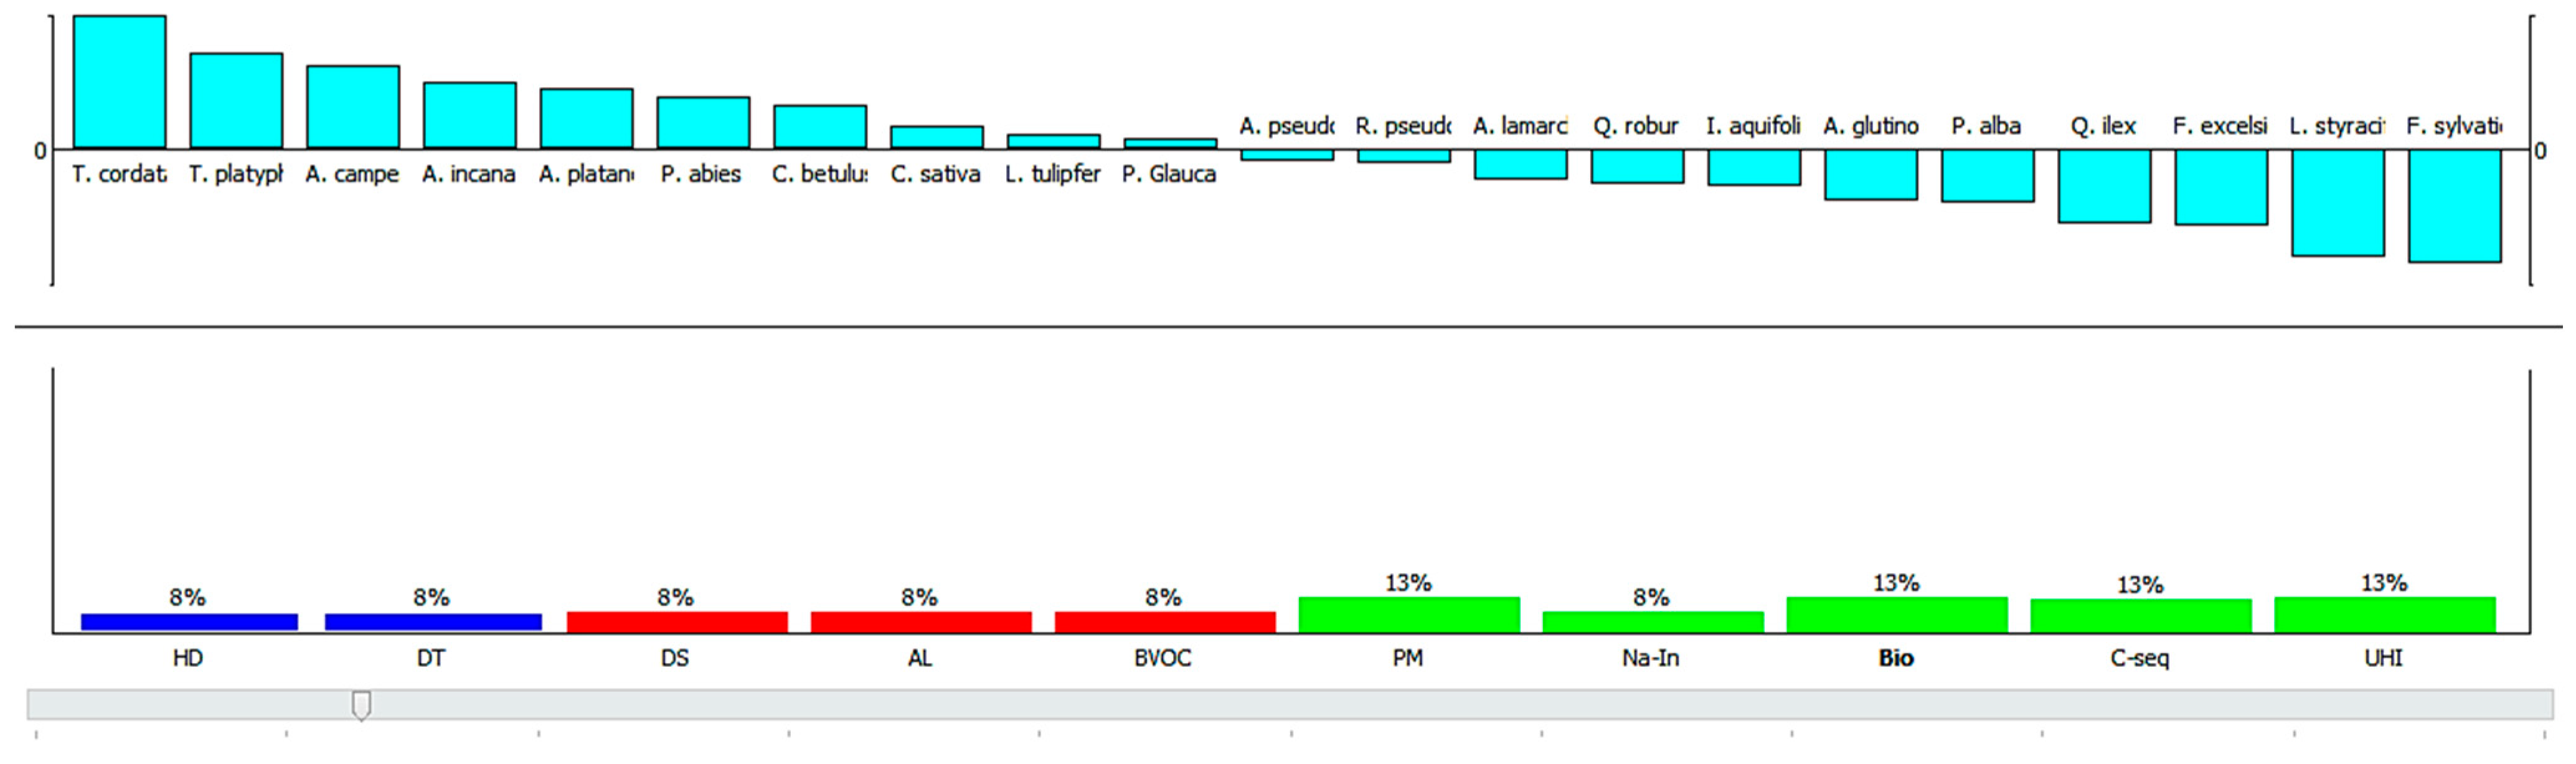
3.3.1. Scenario Analysis

A scenario analysis was performed to determine whether the ranking of plant species changed if the weights were modified. In the case of S1, i.e., the selection based on PM mitigation and reduced EDs (refer to Section 2.5), plant species such as L. styraciflua (L.), P. alba (L.), F. sylvatica (L.), Q. ilex (L.), and R. pseudoacacia (L.) (Figure 2) were ranked low, while plant species such as T. cordata (Mill.), T. platyphyllos (Scop.), P. abies (L.), P. glauca (Moench.), and A. incana (L.) were ranked high for their effectiveness in PM mitigation but also for having low BVOC emissions and low allergenicity levels (Figure 2).
In the case of S2, i.e., the selection based on PM mitigation and environmental suitability (refer to Section 2.5), plant species such as L. styraciflua (L.), A. lamarckii (Schroed.), F. sylvatica (L.), A. glutinosa (L.), and R. pseudoacacia (L.) were ranked low when their environmental suitability was evaluated (Figure 3). The results indicated that plant species such as T. cordata (Mill.), A. campestre (L.), A. incana (L.), T. platyphyllos (Scop.), and C. betulus (L.) were ranked high for their effectiveness in PM mitigation while having a high drought tolerance, low susceptibility for diseases, being native to Western Europe, and having a non-invasive character (Figure 3).
In the case of S3, i.e., the selection based on PM mitigation, ability to support biodiversity, net carbon sequestration, and reduction in the heat island effect (Section 2.5), plant species such as F. sylvatica (L.), L. styraciflua (L.), F. excelsior (L.), Q. ilex (L.), and P. alba (L.) were ranked low, while plant species such as T. cordata (Mill.), T. platyphyllos (Scop.), A. campestre (L.), A. incana (L.), and A. platanoides (L.) were ranked high (Figure 4) for their effectiveness in PM mitigation, supporting biodiversity in terms of providing provisions for birds, bees, and other insects, net carbon sequestration, and reducing the urban heat island effect.

3.3.2. A Comprehensive Evaluation of Plant Species for Their Contribution in Ecosystem Services and Disservices

The phi net flow scores provided in Table 6 demonstrate the overall performance of plant species based on the ESs and EDs they provide. In Figure 5 for each plant species, a bar is drawn with slices equivalent to the number of criteria (i.e., 10). Each slice corresponds to the contribution of the criterion to both the phi+ and phi− values (Table 6). The positive (i.e., upward) slices correspond to good features while negative (i.e., downward) slices correspond to weaknesses. The phi net flow score of plant species is the sum of the positive slices minus the sum of the negative slices. Plant species such as T. cordata (Mill.), P. abies (L.), A. incana (L.), T. platyphyllos (Scop.), and A. campestre (L.) were ranked high with positive net flow scores (Table 6), while plant species such as L. styraciflua (L.), F. sylvatica (L.), Q. ilex (L.), F. excelsior (L.), and A. lamarckii (Schroed.) were ranked low with negative net flow scores.

4. Discussion

4.1. Selection of Plant Species for PM Removal in Urban Environments: Similarities and Differences Using the Leaf Traits and Leaf SIRM Models

Three separate models, i.e., leaf traits (n = 61), leaf SIRM (n = 61), and services and disservices (n = 21), were constructed in this study to enhance the selection of plant species for PM removal in urban environments. The investigated plant species in the leaf traits and the leaf SIRM model were not ranked in the exact same order, but an ordinal order was frequently maintained. Plant species that were identified as highly effective in PM removal through the leaf traits model were also identified as highly effective in the leaf SIRM model. Similarly, an ordinal order was typically maintained in the leaf traits and the leaf SIRM models for moderately and least effective plant species in PM removal. Occasionally, an ordinal order was not maintained for some plant species; for example, A. platanoides (L.), A. incana (L.), and Q. robur (L.) were identified as moderately effective for PM mitigation in the leaf traits model but as highly effective in the leaf SIRM model. The order of plant species in the top-three and bottom-three effective plant species differed in the leaf traits (Table 3) and leaf SIRM models (Table 4). Based on the Π-values, plant species such as P. menziesii (Mirb.), A. fraseri (Pursh.), and P. abies (L.) were identified as highly effective for PM removal through the leaf traits model, whereas plant species such as P. menziesii (Mirb.), T. plicata (Donn.), and C. betulus (L.) were identified as highly effective for PM removal using the leaf SIRM model. These differences in classification may be due to the differences in assigned scores and weights of the criteria, (i.e., high scores for leaf area, leaf wettability, and leaf roundness). Nonetheless, plant species that occurred in one of the models’ top three were still observed in the other model’s top ten.
Based on the ordinal order of plant species, it can be concluded that the leaf traits model adequately identifies the effective plant species for PM mitigation based on the morphological leaf traits combined with LAI. This implies that the use of advanced magnetic measurements for identifying effective plant species for PM removal is not compulsory and leaf trait measurements are sufficient to estimate the PM mitigation potential of a plant species. This is particularly interesting when research facilities may be minimally equipped, considering that PM accumulation on leaf surfaces is typically in proportion to its morphological leaf traits, as observed in our previous study [26]. On the one hand, the leaf SIRM model is straightforward, as the leaf SIRM values incorporate the effect of leaf traits. On the other hand, the importance of leaf traits in the leaf traits model was derived from leaf SIRM values [26], which reveals the dependency of the leaf traits model on the leaf SIRM values. Moreover, the micro-morphological leaf attributes were rescaled into scores, which reduces the resolution of the data in the leaf traits model.

4.2. Enhancement of Plant Species Selection for Reducing PM in Urban Environments Using PROMETHEE

When addressing the issue of PM mitigation in polluted urban environments using plants, the selection process should not be limited to just plant canopy and leaf traits related to PM mitigation. It is also essential to incorporate the benefits and detrimental effects provided by these plant species. In this study, data on ecosystem services such as PM mitigation, supporting biodiversity, net carbon sequestration, and reducing the urban heat island effect, and disservices such as BVOC emissions, allergenicity, and environmental suitability such as plant hardiness for low temperatures, drought tolerance, and disease susceptibility were consolidated for a subset of plant species (n = 21).
With equal weightage for the criteria included in the services and disservices model, the plant species with enhanced ESs and reduced EDs were T. cordata (Mill.), T. platyphyllos (Scop.), and A. incana (L.). The scenario analysis (Section 3.3.1) elaborated that the ranking of plant species differed slightly based on the assigned weights of the criteria. For example, L. tulipifera (L.) showed a negative phi net flow score when equal weights were assigned to all criteria, but when weights were increased for PM mitigation, BVOC emissions, and allergenicity (S1), a positive phi net flow score was observed (Figure 2). Similarly, when equally high weights were assigned for PM mitigation, net carbon sequestration, reducing urban heat island effect, and supporting biodiversity (S3), a positive phi net flow score was observed for L. tulipifera (L.) (Figure 4). However, when environmental suitability was considered (S2), L. tulipifera (L.) indicated a negative phi net flow score (Figure 3). This illustrates the conflicting aspect of a multi-criteria analysis. It is not always straightforward to compare two plant species, as one can be much better on one subset of criteria and the other can be much better on another subset of criteria. In such cases and according to the preference parameters defined by the decision-maker, different ways of evaluation (such as phi+ and phi–) can also lead to different rankings. Nonetheless, two species, i.e., T. cordata (Mill.) and T. platyphyllos (Scop.), were in the top three of all PROMETHEE models (i.e., the equal-weightage and the three scenarios), while A. incana (L.) occurred two times in the top three and A. campestre (L.) occurred three times in the top five.
The leaf traits (Table 3) and leaf SIRM models (Table 4) indicated plant species such as T. cordata (Mill.), P. abies (L.), T. platyphyllos (Scop.) and A. campestre (L.) as among the effective plant species for PM removal. A comprehensive evaluation of plant species for their ESs and EDs (Figure 5) also indicated that the aforementioned plant species can be optimal choices for PM removal in urban environments. The highest phi net flow score (Table 6) was indicated for T. cordata (Mill.), followed by P. abies (L.), A. incana (L.), T. platyphyllos (Scop.), and A. campestre (L.) as the criteria for plant hardiness, drought tolerance, and BVOC emissions contributed positively toward the phi net flow score. In general, the scores for criteria such as disease susceptibility and allergenicity contributed negatively toward the phi net flow scores. The criteria for EDs may lower the overall ranking of a plant species. Nevertheless, informed decisions can be made when EDs are taken into account during the plant species selection process. The abovementioned plant species showed higher phi+ scores compared to phi– scores, suggesting that the ESs were higher compared to the EDs of these plant species, hence making them a preferable choice of plant species when designing and planning urban green areas.
Plant species Q. ilex (L.) and F. sylvatica (L.) were identified as highly effective for PM mitigation using the leaf traits (Table 3) and leaf SIRM (Table 4) models, but because of their low drought tolerance, increased susceptibility to diseases, and moderate to high BVOC emissions they obtained a negative phi net flow score. Similarly, L. styraciflua (L.) was indicated as moderately effective in the leaf traits and leaf SIRM models for PM mitigation, but its EDs outweighed its ESs (Figure 5). These findings emphasize the importance of an integrated approach when selecting plant species for PM removal in urban environments because an inappropriate choice of plant species may further exacerbate the ambient air quality instead of improving it. The effective plant species in PM removal identified by the leaf traits and leaf SIRM models, such as P. menziesii (Mirb.), A. fraseri (Pursh.), and T. plicata (Donn.), could not be assessed for their ESs and EDs because of the lack of available information. Nonetheless, the species-specific information compiled in this study is of great value for urban planners and decision makers and it can be further enhanced by future researchers supplementing it with more data.

4.3. Implications

The breath of information consolidated on perennial plant species commonly found in the urban environments of Western Europe indicates that, although plants provide various ESs, some EDs may undesirably be inherited. The combination of ESs and EDs leads to trade-offs and synergies [57]. When ESs are high and EDs are low, there are positive synergies, whereas negative synergies result from high EDs and low ESs. Trade-offs arise when plant species have ESs and EDs with similar magnitudes [57].
The plant species identified as highly effective for PM removal by the leaf traits and leaf SIRM models were mostly trees as opposed to shrubs. Although trees have larger surface areas available for PM deposition compared to shrubs, these shrub species can be used as substitutes in locations where planting trees is either restricted by law or not possible because of limited space [58]. To design an efficient plant barrier for the protection of vulnerable areas such as playgrounds, schools, hospitals, and residential areas, a combination of taller and shorter vegetation (i.e., shrubs, meadows, and herbaceous plants) needs to be used to promote wind flow and PM deposition on leaf surfaces [59]. It has been shown that herbaceous plant species are more effective in accumulating PM on their leaf surfaces compared to leaves of tree species [60]. A possible explanation may be that herbaceous plants may filter the toxic air emitted from the road because of their close proximity while the toxic air reaches the surface of tree leaves later [60]. In addition, the PM resuspended from taller vegetation (i.e., trees) due to rainfall or when blown-off by wind may likely be accumulated by the herbaceous plant growing under and close to the tall vegetation [60]. Previous simulation studies [61,62,63,64,65] have suggested that trees in urban street canyons can obstruct wind flow, thereby reducing ventilation and the dilution of air pollution emitted by sources underneath the trees, which can lead locally to a high pollutant concentration. Hence, a good plant barrier design is of significant importance. Another aspect that needs consideration is that if a plant species produces fleshy fruits, such as L. styraciflua (L.) or has weak fragile branches that may break off easily during storms, these species should best be avoided, especially in areas where pedestrian traffic is high and/or when side-walk/street cleanup budgets are low. Similarly, plant species that emit allergens (e.g., C. betulus (L.), A. incana (L.), and A. glutinosa (L.)) or are susceptible to diseases (e.g., F. sylvatica (L), P. abies (L.), and F. excelsior (L.)) also need to be avoided. In general, plants in urban environments are selected for their aesthetic appeal. Nonetheless, previous studies provide evidence that urban forests can also facilitate the diversity of habitats of other taxa, such as birds, insects, mammals, and bacteria [66,67].
The dataset provided in this study can be of huge interest to a broad audience (i.e., from a novice to an experienced urban planner) for making informed decisions. For example, the comparison of two different methodologies for identifying the effective plant species for PM removal using the leaf traits and leaf SIRM models (i.e., magnetic measurements) demonstrates that a lack of sophisticated equipment should not be a limitation in determining the effectiveness of a plant species in PM removal. However, there are some gaps that need to be filled to further enhance the dataset; for example, the inclusion of microstructural leaf traits such as leaf venation patterns and groove ratio [68], along with macro-structural traits such as plant height, crown density, leaf arrangements, and petiole length [69] of the plant species, are some of the attributes that may enhance the plant species selection process for PM removal. Furthermore, the interaction of plant species with air pollutants, which can be achieved by calculating the air pollution tolerance index (APTI) [70,71], is of central importance to reduce the risk of incurring management costs.
Due to the unavailability of data on criteria such as LAI, the leaf traits and leaf SIRM models consisted of 61 plant species. Similarly, due to missing information on environmental suitability and ecosystem (dis)services, a subset of plant species (n = 21) was included in the services and disservices model. Our study draws attention toward the need for additional species-specific data on leaf traits, ecosystem (dis)services, and environmental suitability to extreme conditions, particularly for trees in urban environments. Unlike forest trees, on which most data are collected, urban trees have to function in unfavorable conditions, exposed to air and soil pollution, drought, dry air, high temperature extremes, soil compaction, nutrient deficiencies, inadequate light, and biotic threats [72]. According to the IPCC experts, the frequency and intensity of extreme weather associated with air temperature and precipitation will increase in the future [42]. Such incidents may either provoke forest fires [73] because of high air temperatures or flooding because of increased precipitation. Hence, the selection criteria in terms of environmental suitability may differ accordingly. Nonetheless, the findings of this study can be used for recommending suitable plant species for the development of urban green spaces. Future studies need to enhance the existing dataset by adding information on criteria with missing data for plant species excluded from the leaf traits, leaf SIRM, and services and disservices models. Accordingly, this can improve the basis for recommendations of plant species to be planted in urban environments.

5. Conclusions

Planting trees has been frequently proposed as a passive approach to reduce airborne PM. Nevertheless, planting any tree or shrub species may not be an immediate solution, but instead it requires a thorough assessment and appropriate selection of plant species. The outcomes of the leaf traits and leaf SIRM models in identifying effective plant species for PM mitigation were fairly similar, with an exception for some plant species. Plant species did not rank in an exact identical order, but an ordinal order was maintained. This suggests that the lack of sophisticated equipment should not be a limitation in identifying the effective plant species for PM removal in urban environments. The comprehensive analyses performed in this study identified T. cordata (Mill.), T. platyphyllos (Scop.), A. incana (L.), A. campestre (L.), and P. abies (L.) as effective plant species for PM removal considering their ecosystem (dis)services and environmental suitability. The scenario analysis illustrated that the plant-species selection process can become fairly complicated, especially when various stakeholders may be involved and their preferences and perspectives may significantly influence the criteria of importance and, consequently, the selection of plant species. Moreover, the ranking of plant species may vary with the specific roles that are expected from trees depending on the neighborhood, culture, and environmental conditions. Future studies are needed for supplementing and enhancing the existing dataset on leaf and canopy traits, susceptibility to stress, and ecosystem (dis)services delivery to make informed decisions when planning urban green spaces.

Author Contributions

S.M. contributed to the field experiments, data collection, and literature search. S.M. and K.W. performed the data analyses and interpretation. S.M., K.W. and R.S. contributed to the study design and writing and revision of the manuscript. All authors have read and agreed to the published version of the manuscript.

Funding

This research was carried out using the facilities and instruments available at the University of Antwerp, Belgium and did not receive any specific grant from funding agencies in the public, commercial, or not-for-profit sectors.

Institutional Review Board Statement

Not applicable.

Informed Consent Statement

Not applicable.

Data Availability Statement

Not applicable.

Acknowledgments

The data used in this article have been obtained with permission of the authors or from the public domain. The included Figure 1, Figure 2, Figure 3, Figure 4, Figure 5 in this article have been created by the authors. The research was funded by the Ontario Student Assistance Program (OSAP #15103399) and the University of Antwerp. The authors would like to thank the ENdEMIC group for the management and upkeep of the common garden. The authors would like to thank the anonymous reviewers for their critical comments and constructive suggestions in improving the quality of the article.

Conflicts of Interest

The authors of this manuscript declare that there are no conflict of interest to disclose.

References

  1. Tzoulas, K.; Korpela, K.; Venn, S.; Yli-Pelkonen, V.; Kaźmierczak, A.; Niemela, J.; James, P. Promoting ecosystem and human health in urban areas using Green Infrastructure: A literature review. Landsc. Urban Plan. 2007, 81, 167–178. [Google Scholar] [CrossRef] [Green Version]
  2. Taylor, L.; Hochuli, D.F. Creating better cities: How biodiversity and ecosystem functioning enhance urban residents’ wellbeing. Urban Ecosyst. 2015, 18, 747–762. [Google Scholar] [CrossRef]
  3. Davies, P.; Corkery, L.; Nipperess, D.; Barnett, G.; Bishop, M.; Hochuli, D.; Hose, G.; Joei, C.; Lin, B.; Keane, A.; et al. Blueprint for Living Cities: Policy to Practice. National Green Infrastructure Network; National Green Infrastructure Network: Sydney, Australia, 2017. [Google Scholar]
  4. Millennium Ecosystem Assessment (MEA). Ecosystems and Human Well-Being: A Framework for Assessment; Island Press: Washington, DC, USA, 2003. [Google Scholar]
  5. TEEB (The Economics of Ecosystems and Biodiversity). The Economics of Ecosystems and Biodiversity: Ecological and Economic Foundations; Earthscan: London, UK, 2010. [Google Scholar]
  6. Lyytimäki, J. Disservices of urban trees. In Routledge Handbook of Urban Forestry; Ferrini, F., van den Bosch, C.C.K., Fini, A., Eds.; Routledge: London, UK, 2017; pp. 164–176. [Google Scholar]
  7. Staas, L.; Beaumont, L.; Leishman, M. Which Plant Where: What We Heard: Documenting the Stakeholder Workshops; National Green Infrastructure Network: Sydney, Australia, 2017. [Google Scholar]
  8. Dwyer, J.F.; Nowak, D.J.; Noble, M.H. Sustaining urban forests. J. Arboric. 2003, 29, 49–55. [Google Scholar] [CrossRef]
  9. Berbés-Blázquez, M.; González, J.A.; Pascual, U. Towards an ecosystem services approach that addresses social power relations. Curr. Opin. Environ. Sustain. 2016, 19, 134–143. [Google Scholar] [CrossRef]
  10. Daw, T.; Brown, K.; Rosendo, S.; Pomeroy, R. Applying the ecosystem services concept to poverty alleviation: The need to disaggregate human well-being. Environ. Conserv. 2011, 34, 370–379. [Google Scholar] [CrossRef] [Green Version]
  11. Sikor, T.; Baggio, J.A. Can smallholders engage in tree plantations? An entitlements analysis from Vietnam. World Dev. 2014, 64, 101–112. [Google Scholar] [CrossRef]
  12. Brooks, E.G.E.; Smith, K.G.; Holland, R.A.; Poppy, G.M.; Eigenbrod, F. Effects of methodology and stakeholder disaggregation on ecosystem service valuation. Ecol. Soc. 2014, 19, 18. [Google Scholar] [CrossRef] [Green Version]
  13. Hicks, C.C.; Cinner, J.E.; Stoeckl, N.; McClanahan, T.R. Linking ecosystem services and human-values theory. Conserv. Biol. 2015, 29, 1471–1480. [Google Scholar] [CrossRef]
  14. Lau, J.D.; Hicks, C.C.; Gurney, G.G.; Cinner, J.E. Disaggregating ecosystem service values and priorities by wealth, age, and education. Ecosyst. Serv. 2018, 29, 91–98. [Google Scholar] [CrossRef] [Green Version]
  15. Caceres, D.M.; Tapella, E.; Quetier, F.; Diaz, S. The social value of biodiversity and ecosystem services from the perspectives of different social actors. Ecol. Soc. 2015, 20, 62. [Google Scholar] [CrossRef]
  16. Milcu, A.I.; Leventon, J.; Hanspach, J.; Fischer, J. Disaggregated contributions of ecosystem services to human well-being in low-intensity farmland. Reg. Environ. Chang. 2015, 16, 117–163. [Google Scholar]
  17. Orenstein, D.E.; Groner, E. In the eye of the stakeholder: Changes in perceptions of ecosystem services across an international border. Ecosyst. Serv. 2014, 8, 185–196. [Google Scholar] [CrossRef]
  18. Sæbø, A.; Benedikz, T.; Randrup, T.B. Selection of trees for urban forestry in the Nordic countries. Urban For. Urban Green 2003, 2, 101–114. [Google Scholar] [CrossRef] [Green Version]
  19. Prajapati, S.K.; Tripathi, B.D. Anticipated performance Index of some tree species considered for green belt development in and around an urban area: A case study of Varanasi city, India. J. Environ. Manag. 2008, 88, 1343–1349. [Google Scholar] [CrossRef]
  20. Nowak, D.J.; Heisler, G.M. Air Quality Effects of Urban Trees and Parks; National Recreation and Park Association: Ashburn, VA, USA, 2010; 46p. [Google Scholar]
  21. Pathak, V.; Tripathi, B.D.; Mishra, V.K. Evaluation of anticipated performance Index of some tree species for green belt development to mitigate traffic generated noise. Urban For. Urban Green. 2011, 10, 61–66. [Google Scholar] [CrossRef]
  22. Dobbs, C.; Escobedo, F.J.; Zipperer, W.C. A framework for developing urban forest ecosystem services and goods indicators. Landsc. Urban Plan. 2011, 99, 196–206. [Google Scholar] [CrossRef]
  23. Tiwary, A.; Williams, I.D.; Heidrich, O.; Namdeo, A.; Bandaru, V.; Calfapietra, C. Development of multi-functional streetscape green infrastructure using a performance index approach. Environ. Pollut. 2015, 208, 209–220. [Google Scholar] [CrossRef] [Green Version]
  24. O’Sullivan, O.S.; Holt, A.R.; Warren, P.H.; Evans, K.L. Optimising UK urban road verge contributions to biodiversity and ecosystem services with cost effective management. J. Environ. 2017, 191, 162–171. [Google Scholar] [CrossRef] [PubMed]
  25. Yang, J.; Chang, Y.; Yan, P. Ranking the suitability of common urban tree species for controlling PM2.5 pollution. Atmos. Pollut. Res. 2015, 6, 267–277. [Google Scholar] [CrossRef] [Green Version]
  26. Muhammad, S.; Wuyts, K.; Samson, R. Atmospheric net particle accumulation on 96 plant species with contrasting morphological and anatomical leaf characteristics in a common garden experiment. Atmos. Environ. 2019, 202, 328–344. [Google Scholar] [CrossRef]
  27. Mareschal, B. Visual PROMETHEE 1.4 Manual. 2013. Available online: http://en.promethee-gaia.net/academic-edition.html (accessed on 2 February 2021).
  28. Breiman, L. Random forest. Mach. Learn. 2001, 45, 15–32. [Google Scholar]
  29. Bivand, R. classInt: Choose Univariate Class Intervals; R Package Version 0.3–3. 2019. Available online: https://github.com/r-spatial/classInt/ (accessed on 16 October 2022).
  30. Beckett, K.P.; Freer-Smith, P.H.; Taylor, G. Urban woodlands: Their role in reducing the effects of particulate pollution. Environ. Pollut. 1998, 99, 347–360. [Google Scholar] [CrossRef]
  31. Tiwary, A.; Sinnett, D.; Peachey, C.; Chalabi, Z.; Vardoulakis, S.; Fletcher, T.; Leonardi, G.; Grundy, C.; Azapagic, A.; Tony, R.; et al. An integrated tool to assess the role of new planting in PM10 capture and human health benefits: A case study in London. Environ. Pollut. 2009, 157, 2645–2653. [Google Scholar] [CrossRef] [Green Version]
  32. Tallis, M.; Taylor, G.; Sinnett, D.; Freer-Smith, P. Estimating the removal of atmospheric particulate pollution by the urban tree canopy of London, under current and future environments. Landsc. Urban Plan. 2011, 103, 129–138. [Google Scholar] [CrossRef]
  33. Sæbø, A.; Popek, R.; Nawrot, B.; Hanslin, H.M.; Gawronska, H.; Gawronski, S.W. Plant species differences in particulate matter accumulation on leaf surfaces. Sci. Total Environ. 2012, 427, 347–354. [Google Scholar] [CrossRef] [PubMed]
  34. Larcher, W. Physiological Plant Ecology: Ecophysiology and Stress Physiology of Functional Groups, 4th ed.; Springer: Berlin, Germany, 2003; pp. 48–53. [Google Scholar]
  35. Vile, D.; Garnier, E.; Shipley, B.; Laurent, G.; Navas, M.L.; Roumet, C.; Lavorel, S.; Díaz, S.; Hodgson, J.G.; Lloret, F.; et al. Specific leaf area and dry matter content estimate thickness in laminar leaves. Ann. Bot. 2005, 96, 1129–1136. [Google Scholar] [CrossRef]
  36. Holder, C.D. The relationship between leaf hydrophobicity, water droplet retention, and leaf angle of common species in a semi-arid region of western United States. Agric. For. Meteorol. 2012, 152, 11–16. [Google Scholar] [CrossRef]
  37. Neinhuis, C.; Barthlott, W. Seasonal changes of leaf surface contamination in beech, oak, and ginkgo in relation to leaf micromorphology and wettability. New Phytol. 1998, 138, 91–98. [Google Scholar] [CrossRef]
  38. Wang, H.; Shi, H.; Li, Y.; Yu, Y.; Zhang, J. Seasoonal variations in leaf capturing of particulate matter, surface wettability and micromorphology in urban tree species. Front. Environ. Sci. Eng. 2013, 4, 579–588. [Google Scholar] [CrossRef]
  39. Neinhuis, C.; Barthlott, W. Characterization and distribution of water-repellent, self-cleaning plant surfaces. Ann. Bot. 1997, 79, 667–677. [Google Scholar] [CrossRef] [Green Version]
  40. Roach, P.; Shirtcliffe, N.J.; Newton, M.I. Progress in superhydrophobic surface development. Soft Matter 2008, 84, 224–240. [Google Scholar] [CrossRef]
  41. Zhang, X.; Shi, F.; Niu, J.; Jiang, Y.; Wang, Z. Superhydrophobic surfaces: From structural control to function application. J. Mater. Chem. 2008, 18, 621–663. [Google Scholar] [CrossRef]
  42. IPCC. Climate Change 2022: Impacts, Adaptation and Vulnerability. Contribution of Working Group II to the Sixth Assessment Report of the Intergovernmental Panel on Climate Change; Pörtner, H.-O., Roberts, D.C., Adams, H., Adler, C., Aldunce, P., Ali, E., Begum, R.A., Betts, R., Kerr, R.B., Biesbroek, R., Eds.; Cambridge University Press: Cambridge, UK; New York, NY, USA, 2022. [Google Scholar]
  43. Roloff, A.; Bärtels, A. Flora der Gehölzer; Eugen Ulmer Verlag: Stuttgart, Germany, 2014. [Google Scholar]
  44. Samson, R.; Ningal, T.F.; Tiwary, A.; Grote, R.; Fares, S.; Paoletti, E.; Calfapietra, C.; Saaroni, H.; Hiemstra, J.A.; Zhiyanski, U.V.; et al. Urban trees as environmental engineers. In The Urban Forest; Pearlmutter, D., Calfapietra, C., Samson, R., O’Brien, L., Ostoić, S.K., Sanesi, G., del Amo, R.A., Eds.; Future City 7; Springer International Publishing: New York, NY, USA, 2017; pp. 31–39. [Google Scholar]
  45. Samson, R.; Ningal, T.F.; Tiwary, A.; Grote, R.; Fares, S.; Saaroni, H.; Hiemstra, J.A.; Zhiyanski, M.; Vilhar, U.; Cariñanos, P.; et al. Species-specific information for enhancing ecosystem services. In The Urban Forest; Pearlmutter, D., Calfapietra, C., Samson, R., O’Brien, L., Ostoić, S.K., Sanesi, G., del Amo, R.A., Eds.; Future City 7; Springer International Publishing: New York, NY, USA, 2017; pp. 111–144. [Google Scholar]
  46. Cariñanos, P.; Adinolfi, C.; Díaz de la Guardia, C.; De Linares, C.; Casares-Porcel, M. Characterization of Allergen Emission Sources in Urban Areas. J. Environ. Qual. 2016, 45, 244–252. [Google Scholar] [CrossRef] [Green Version]
  47. Barwise, Y.; Kumar, P. Designing vegetation barriers for urban air pollution abatement: A practical review for appropriate plant species selection. Npj Clim. Atmos. Sci. 2020, 3, 12. [Google Scholar] [CrossRef] [Green Version]
  48. Singh, R.; Singh, M.P.; Singh, A.P. Ozone forming potential of tropical plant species of the Vidarbha region of Maharashtra state of India. Urban For. Urban Green. 2014, 13, 814–820. [Google Scholar] [CrossRef]
  49. Pyšek, P.; Richardson, D.M.; Rejmánek, M.; Webster, G.L.; Williamson, M.; Kirschner, J. Alien plants in checklists and floras: Towards better communication between taxonomists and ecologists. Taxon 2004, 53, 131–143. [Google Scholar] [CrossRef]
  50. Jeschke, J.M.; Bacher, S.; Blackburn, T.M.; Dick, J.T.; Essl, F.; Evans, T.; Gaertner, M.; Hulme, P.E.; Kühn, I.; Mrugała, A.; et al. Defining the Impact of Non-Native Species. Conserv. Biol. 2014, 28, 1188–1194. [Google Scholar] [CrossRef] [PubMed] [Green Version]
  51. Richardson, D.M.; Pyšek, P.; Rejmanek, M.; Barbour, M.G.; Panetta, F.D.; West, C.J. Naturalization and invasion of alien plants: Concepts and definitions. Divers. Distrib. 2000, 6, 93–107. [Google Scholar] [CrossRef]
  52. Tsiaras, S.; Samara, T. Selection of the most suitable tree species in urban areas based on their capability of capturing heavy metals: A forest policy approach. Int. J. Sustain. Agric. Manag. Inform. 2019, 5, 15–24. [Google Scholar] [CrossRef]
  53. Kangas, A.; Kangas, J.; Pykäläinen, J. Outranking methods as tools in strategic natural resources planning. Silva Fenn. 2001, 35, 215–227. [Google Scholar] [CrossRef] [Green Version]
  54. Brans, J.P.; Mareschal, B. Promethee Methods. In Multiple Criteria Decision Analysis: State of the Art Surveys; Figueira, J., Greco, S., Ehrgott, M., Eds.; Springer: New York, NY, USA, 2005; pp. 163–186. [Google Scholar]
  55. Brans, J.P.; Vincke, P.; Mareschal, B. How to select and how to rank projects: The PROMETHEE method. Eur. J. Oper. Res. 1986, 24, 228–238. [Google Scholar] [CrossRef]
  56. Escobedo, F.J.; Kroeger, T.; Wagner, J.E. Urban forests and pollution mitigation: Analyzing ecosystem services and disservices. Environ. Pollut. 2011, 159, 2078–2087. [Google Scholar] [CrossRef] [PubMed]
  57. Roman, L.A.; Conway, T.M.; Eisenman, T.S.; Koeser, A.K.; Ordóñez Barona, C.; Locke, D.H.; Jenerette, G.D.; Östberg, J.; Vogt, J. Beyond ‘trees are good’: Disservices, management costs, and tradeoffs in urban forestry. Ambio 2020, 50, 615–630. [Google Scholar] [CrossRef]
  58. Mori, J.; Ferrini, F.; Sæbø, A. Air pollution mitigation by urban greening. Italus Hortus 2018, 25, 13–22. [Google Scholar] [CrossRef]
  59. Przybysz, A.; Popek, R.; Stankiewicz-Kosyl, M.; Zhu, C.Y.; Małecka-Przybysz, M.; Maulidyawati, T.; Mikowska, K.; Deluga, D.; Griżuk, K.; Sokalski-Wieczorek, J.; et al. Where trees cannot grow—Particulate matter accumulation by urban meadows. Sci. Total Environ. 2021, 785, 147310. [Google Scholar] [CrossRef]
  60. Popek, R.; Fornal-Pieniak, B.; Chyliński, F.; Pawełkowicz, M.; Bobrowicz, J.; Chrzanowska, D.; Piechota, N.; Przybysz, A. Not Only Trees Matter—Traffic-Related PM Accumulation by Vegetation of Urban Forests. Sustainability 2022, 14, 2973. [Google Scholar] [CrossRef]
  61. Gromke, C.; Ruck, B. Influence of trees on the dispersion of pollutants in an urban street canyon-Experimental investigation of the flow and concentration field. Atmos. Environ. 2007, 41, 3287–3302. [Google Scholar] [CrossRef] [Green Version]
  62. Gromke, C.; Ruck, B. Effects of trees on the dilution of vehicle exhaust emissions in urban street canyons. Int. J. Environ. Waste Manag. 2009, 4, 225–242. [Google Scholar] [CrossRef]
  63. Gromke, C.; Ruck, B. Pollutant concentration in street canyons of different aspect ratio with avenues of trees for various wind directions. Bound.-Layer Meteorol. 2012, 144, 41–64. [Google Scholar] [CrossRef] [Green Version]
  64. Wania, A.; Bruse, M.; Blond, N.; Weber, C. Analysing the influence of different street vegetation on traffic-induced particle dispersion using microscale simulations. J. Environ. Manag. 2011, 94, 91–101. [Google Scholar] [CrossRef]
  65. Vos, P.E.J.; Maiheu, B.; Vankerkom, J.; Janssen, S. Improving local air quality in cities; To tree or not to tree? Environ. Pollut. 2013, 183, 113–122. [Google Scholar] [CrossRef] [PubMed]
  66. Khera, N.; Metha, V.; Sabata, B.C. Interrelationship of birds and habitat features in urban green spaces in Delhi, India. Urban For. Urban Green. 2009, 8, 187–196. [Google Scholar] [CrossRef]
  67. Farinha-Marques, P.; Lameiras, J.M.; Fernandes, C.; Silva, S.; Guiherme, F. Urban biodiversity: A review of current concepts and contributions to multidisciplinary approaches. Eur. J. Soc. Sci. Res. 2011, 24, 247–271. [Google Scholar] [CrossRef]
  68. Chen, L.; Liu, C.; Zhang, L.; Zou, R.; Zhang, Z. Variation in tree species ability to capture and retain airborne fine particulate matter (PM2.5). Nat.-Sci. Rep. 2017, 7, 1–11. [Google Scholar] [CrossRef] [Green Version]
  69. Leonard, R.J.; McArthur, C.; Hochuli, D.F. Particulate matter deposition on roadside plants and the importance of leaf trait combinations. Urban For. Urban Green. 2016, 20, 249–253. [Google Scholar] [CrossRef]
  70. Singh, S.N.; Rao, D.N. Certain responses of wheat plants to cement dust pollution. Environ. Pollut. 1981, 24, 75–81. [Google Scholar] [CrossRef]
  71. Rai, P.K. Impacts of particulate matter pollution on plants: Implications for environmental biomonitoring. Ecotoxicol. Environ. Saf. 2016, 129, 120–136. [Google Scholar] [CrossRef]
  72. Czaja, M.; Kołton, A.; Muras, P. The complex issue of urban trees—Stress factor accumulation and ecological service possibilities. Forests 2020, 11, 932. [Google Scholar] [CrossRef]
  73. Vyshkvarkova, E.; Sukhonos, O. Compound extremes of air temperature and precipitation in Eastern Europe. Climate 2022, 10, 133. [Google Scholar] [CrossRef]
Figure 1. The upper part of the bar chart shows the ranking of plant species. The lower part is a bar chart with each criterion assigned equal weights (hardiness for low temperatures and drought tolerance (dark blue bars), disease susceptibility, allergenicity and BVOC emissions (red bars), PM mitigation, native-invasive, supporting biodiversity, net carbon sequestration, and reducing urban heat island effect (green bars)) included in the services and disservices model. (For an interpretation of the references to color in this figure legend, the reader is referred to the web version of this article.)
Atmosphere 13 01960 g001
Figure 2. Ranking of plant species is shown in the upper part of the bar chart according to scenario (S1) PM mitigation and reduced EDs. The lower part of the bar chart shows an equally high importance for allergenicity, BVOC emissions (red bars), and PM mitigation. The criteria including hardiness, drought tolerance (dark blue bars), disease susceptibility (red bar), native-invasive, supporting biodiversity, net carbon sequestration, and reducing urban heat island effect (green bars) are adjusted as having low importance. Plant species are ordered from best to worst. (For an interpretation of the references to color in this figure legend, the reader is referred to the web version of this article.)
Atmosphere 13 01960 g002
Figure 3. Ranking of plant species shown in the upper part of the bar chart according to scenario (S2) PM mitigation and environmental adaptability. The lower part of the bar chart shows an equally high importance for hardiness, drought tolerance (dark blue bars), disease susceptibility (red bar), PM mitigation, and native-invasive (green bars). The criteria including allergenicity, BVOC emissions (red bars), supporting biodiversity, net carbon sequestration, and reducing urban heat island effect (green bars) are adjusted as having low importance. Plant species are ordered from best to worst. (For an interpretation of the references to color in this figure legend, the reader is referred to the web version of this article.)
Atmosphere 13 01960 g003
Figure 4. Ranking of plant species shown in the upper part of the bar chart according to scenario (S3) for PM mitigation, ability to support biodiversity, net carbon sequestration, and reducing urban heat island effect. The lower part of the bar chart shows an equally high importance for PM mitigation, ability to support biodiversity, net carbon sequestration, and reducing the urban heat island effect (green bars). The criteria including hardiness, drought tolerance (dark blue bars), disease susceptibility, allergenicity, BVOC emissions (red bars), native-invasive (green bar) are adjusted as having low importance. Plant species are ordered from best to worst. (For an interpretation of the references to color in this figure legend, the reader is referred to the web version of this article.)
Atmosphere 13 01960 g004
Figure 5. The PROMETHEE rainbow diagram illustrating a disaggregated view of the PROMETHEE II complete ranking of the investigated plant species for the criteria: hardiness (HD) and drought tolerance (DT) illustrated in blue slices; allergenicity (AL), BVOC emissions (BVOC), and disease susceptibility (DS) illustrated in red slices; and biodiversity (Bio), native-invasive (Na-In), PM mitigation (PM), net carbon sequestration (C-seq), and reduce urban heat island effect (UHI) illustrated in green slices. The upward slices on the phi scale correspond to the criteria contributing positively (+1) while the downward slices correspond to the criteria contributing negatively (−1). (For an interpretation of the references to color in this figure legend, the reader is referred to the web version of this article.)
Atmosphere 13 01960 g005
Table 1. Criteria and their data source to build the leaf traits, leaf SIRM, and services and disservices models. Data for leaf longevity, leaf area index, pollination, hardiness, invasive potential, and origin/native disease susceptibility available in open access. Data for leaf traits, leaf SIRM, drought tolerance, BVOC, allergenicity, food source, reduce urban heat island effect, and net carbon sequestration used with permission.
CriterionData Source
Leaf Traits
Leaf SIRM
Measured in September 2016, Muhammad et al. (2019)
Leaf LongevityMissouri Botanical Garden http://www.missouribotanicalgarden.org/plantfinder/plantfindersearch.aspx [accessed on 20 December 2020]
Leaf Area IndexA Global Database of Field-observed Leaf Area Index in Woody Plant Species, 1932–2011
https://daac.ornl.gov/VEGETATION/guides/LAI_Woody_Plants.html [accessed on 21 November 2022]
Drought Tolerance, BVOC, Allergenicity, Food Source, Reduce Urban Heat Island Effect, Net Carbon SequestrationThe Urban Forest-Cultivating Green Infrastructure for People and the Environment, Samson, R., Ningal, T.F., Tiwary, A., Grote, R., Fares, S., Saaroni, H., Hiemstra, J.A., Zhiyanski, M., Vilhar. U., Cariñanos, P., Järvi, L., Przybysz, A., Moretti, M., Zürcher, N., 2017. The Urban Forest, Future City 7. Species–specific information for enhancing ecosystem services. Springer International Publishing. Pearlmutter, D., et al. (eds) pp. 111–144.
PollinationPlants For A Future
https://pfaf.org/user/default.aspx [accessed on 23 December 2020]
HardinessUrban Forest Ecosystems Institute
https://selectree.calpoly.edu/ [accessed on 2 January 2021]
Invasive PotentialInvasive Species in Belgium
https://ias.biodiversity.be/species/all [accessed on 5 January 2021]
Origin/Native
Disease Susceptibility
Forest Ecology and Forest Management Group
https://www.wur.nl/en/Research-Results/Chair-groups/Environmental-Sciences/Forest-Ecology-and-Forest-Management-Group/Education/Tree-database/Temperate-Species.htm [accessed on 10 January 2021]
Table 2. The assignment weights for each criterion in the leaf traits and services and disservices models. Each criterion in the services and disservices model was initially assigned with equal weights (equal). A scenario analysis based on three scenarios (S) and weights within each scenario (S1, S2, and S3) assigned in accordance to the preferred criteria.
Leaf Traits ModelServices and Disservices Model
CriteriaWeightCriteriaEqualS1S2S3
Single leaf area0.10PM mitigation0.100.190.160.13
Leaf dissection index (LDI)0.09Supporting biodiversity0.100.060.060.13
Leaf roundness0.11Urban heat island effect0.100.060.060.13
Specific leaf area0.23Net carbon sequestration0.100.060.060.13
Leaf wettability0.19Allergenicity0.100.190.060.08
Trichome density0.28BVOC emissions0.100.190.060.08
Native/invasive0.100.060.160.08
Drought tolerance0.100.060.160.08
Plant hardiness0.100.060.060.08
Disease susceptibility0.100.060.160.08
Table 3. Leaf traits model with the assignment of scores (1–3) and weights indicated in parenthesis (W) under each leaf trait to estimate the weighted average based on single leaf area (LA: cm−2), leaf dissection index (LDI: dimensionless), trichome density (TD: mm−2), wettability of leaves (drop contact angles expressed in angular degrees), specific leaf area (SLA: m2 kg−1), leaf roundness (binary format 0 &1), and leaf area index (LAI m2 m−2). The sum of weights is 1 for calculating the weighted average of leaf traits and “Π” is the product value of leaf traits weighted average, leaf longevity, and LAI. The plant species are grouped into three classes based on quantile classification and their performance is indicated as high (+++), moderate (++), and low (+). Plant species are shown in descending order based on their performance values.
Plant SpeciesLA
(0.10)
LDI
(0.09)
TD
(0.28)
Wettability
(0.19)
SLA
(0.23)
Roundness
(0.11)
LongevityLAIΠPerformance
Pseudotsuga menziesii (Mirb.) 3213331.09.5022.33+++
Abies fraseri (Pursh.) 3113331.09.0120.35+++
Picea abies (L.) 3211331.07.8015.37+++
Pinus nigra (Arnold.) 3113331.05.7513.00+++
Thuja plicata (Donn.)3112321.06.4512.64+++
Ilex aquifolium (L.) 3112321.05.7511.27+++
Quercus ilex (L.) 3231321.04.5010.89+++
Rhododendron (L.)2213331.04.5010.13+++
Carpinus betulus (L.) 3223220.56.106.98+++
Castanea sativa (Mill.) 2133230.55.106.35+++
Fagus sylvatica (L.) 3122120.56.255.56+++
Tilia platyphyllos (Scop.) 2132110.55.955.50+++
Quercus petraea (Matt.)3131220.55.155.41+++
Alnus glutinosa (L.)2223110.55.204.81+++
Tilia cordata (Mill.) 2212110.56.854.73+++
Acer campestre (L.) 3133210.53.904.62+++
Liriodendron tulipifera (L.) 1311110.57.404.37+++
Quercus rubra (L.) 2221220.54.604.16+++
Populus alba (L.) 2223110.54.504.16+++
Picea pungens glauca (Moench.) 3213331.01.764.14+++
Acer ginnala (Maxim.) 3113210.54.554.12++
Acer platanoides (L.) 2122210.54.554.10++
Quercus palustris (Münchh.) 3312120.54.553.82++
Quercus robur (L.) 3111220.54.553.50++
Liquidambar styraciflua (L.) 2212110.54.803.31++
Betula pendula (Roth.)3123210.53.103.24++
Acer pseudoplatanus (L.) 2211210.54.553.23++
Larix decidua (Mill.) 3111330.53.052.87++
Robinia pseudoacacia (L.) 3231120.52.902.84++
Fraxinus excelsior (L.) 3123220.52.505.78++
Alnus incana (L.) 2122210.53.002.70++
Corylus avellana (L.) 2123110.52.542.24++
Salix viminalis (L.) 3131130.51.541.52++
Salix repens (L.) 3132230.51.231.48++
Salix rosmarinifolia (L.) 3331230.51.231.47++
Viburnum lantana (L.)2133220.51.231.46++
Rosa rugosa (Thunb.) 3131320.51.231.43++
Prunus spinosa (L.) 3132220.51.231.41++
Cornus sanguinea (L.)2133210.51.231.40++
Viburnum opulus (L.) 2133210.51.231.40++
Hibiscus syriacus (L.) 3133120.51.231.38++
Salix aurita (L.) 3131230.51.231.36+
Euonymus europaeus (L.) 3123220.51.231.35+
Buddleja davidii (Franch.) 3231220.51.231.35+
Lonicera xylosteum (L.) 3131220.51.231.29+
Rosa rubiginosa (L.) 3123210.51.231.29+
Syringa vulgaris (L.) 2113320.51.231.26+
Larix kaempferi (Lamb.) 3111230.51.451.20+
Ligustrum ovalifolium (Hasssk.) 3113220.51.231.18+
Sambucus nigra (L.) 2123120.51.231.15+
Salix cinerea (L.) 3131120.51.231.15+
Ligustrum vulgare (L.) 3112230.51.231.13+
Amelanchier lamarckii (Schroed.) 3212220.51.231.12+
Rosa pimpinellifolia (L.) 3121220.51.231.12+
Cornus alba (L.)2131120.51.231.09+
Prunus padus (L.) 2121220.51.231.06+
Rhamnus frangula (L.) 3113120.51.231.04+
Hippophae rhamnoides (L.) 3111230.51.231.01+
Salix purpurea (L.) 3111230.51.231.01+
Rosa glauca (Pourret.) 3211220.51.231.00+
Lonicera tatarica (L.) 3211210.51.230.93+
Table 4. Leaf SIRM model with the assignment of scores (1-3) for leaf SIRM (µA) values based on measurements conducted in September 2016 and classified into three groups based on Jenks natural breaks classification. The leaf longevity: i.e., evergreen needle/scale-like/broadleaf (assigned a value of 1) or deciduous broadleaf/needle-like (assigned a value of 0.5). The values for leaf area index (LAI m2 m−2) are obtained from the literature. Π is the product of leaf SIRM score, leaf longevity values, and LAI. The plant species are grouped into three classes based on quantile classification indicating their performance as high (+++), moderate (++), and low (+). Plant species are shown in descending order based on their performance values.
Plant SpeciesSIRMLongevityLAIΠPerformance
Pseudotsuga menziesii (Mirb.)21.09.5019.00+++
Thuja plicata (Donn.) 21.06.4512.90+++
Carpinus betulus (L.) 30.56.109.15+++
Abies fraseri (Pursh.)11.09.019.01+++
Quercus ilex (L.) 21.04.509.00+++
Picea abies (L.) 11.07.807.80+++
Fagus sylvatica (L.) 20.56.256.25+++
Tilia platyphyllos (Scop.) 20.55.955.95+++
Acer campestre (L.) 30.53.905.85+++
Ilex aquifolium (L.) 11.05.755.75+++
Pinus nigra (Arnold.) 11.05.755.75+++
Quercus petraea (Matt.) 20.55.155.15+++
Castanea sativa (Mill.) 20.55.105.10+++
Acer platanoides (L.) 20.54.554.55+++
Quercus robur (L.) 20.54.554.55+++
Rhododendron (L.) 11.04.504.50+++
Liriodendron tulipifera (L.) 10.57.403.70+++
Picea pungens glauca (Moench.) 21.01.763.52+++
Tilia cordata (Mill.)10.56.853.43+++
Alnus incana (L.) 20.53.003.00+++
Alnus glutinosa (L.) 10.55.202.60++
Corylus avellana (L.) 20.52.542.54++
Liquidambar styraciflua (L.) 10.54.802.40++
Quercus rubra (L.) 10.54.602.30++
Acer ginnala (Maxim.) 10.54.552.28++
Acer pseudoplatanus (L.) 10.54.552.28++
Quercus palustris (Münchh.) 10.54.552.28++
Populus alba (L.) 10.54.502.25++
Rosa rugosa (Thunb.) 30.51.231.85++
Viburnum lantana (L.) 30.51.231.85++
Viburnum opulus (L.) 30.51.231.85++
Betula pendula (Roth.)10.53.101.55++
Salix viminalis (L.) 20.51.541.54++
Larix decidua (Mill.)10.53.051.53++
Robinia pseudoacacia (L.) 10.52.901.45++
Fraxinus excelsior (L.) 10.52.501.25++
Amelanchier lamarckii (Schroed.) 20.51.231.23++
Euonymus europaeus (L.) 20.51.231.23++
Hippophae rhamnoides (L.)20.51.231.23++
Lonicera tatarica (L.)20.51.231.23++
Lonicera xylosteum (L.) 20.51.231.23++
Prunus spinosa (L.) 20.51.231.23++
Prunus padus (L.) 20.51.231.23++
Rhamnus frangula (L.) 20.51.231.23++
Rosa pimpinellifolia (L.) 20.51.231.23++
Rosa rubiginosa (L.) 20.51.231.23++
Salix aurita (L.) 20.51.231.23++
Salix cinerea (L.) 20.51.231.23++
Salix rosmarinifolia (L.) 20.51.231.23++
Salix repens (L.) 20.51.231.23++
Sambucus nigra (L.) 20.51.231.23++
Syringa vulgaris (L.) 20.51.231.23++
Larix kaempferi (Lamb.)10.51.450.73+
Buddleja davidii (Franch.) 10.51.230.62+
Cornus alba (L.) 10.51.230.62+
Cornus sanguinea (L.) 10.51.230.62+
Hibiscus syriacus (L.) 10.51.230.62+
Ligustrum ovalifolium (Hassk.) 10.51.230.62+
Ligustrum vulgare (L.) 10.51.230.62+
Rosa glauca(Pourret.)10.51.230.62+
Salix purpurea (L.) 10.51.230.62+
Table 5. Services and disservices model with the assignment of scores (1−3) to evaluate the ranking and suitability of plant species (n = 21) for PM mitigation in urban environments using the PROMETHEE method based on origin of plant species (native to western Europe), nature type (invasive/non-invasive), plant hardiness, drought tolerance, ecosystem disservices (disease susceptibility, allergenicity, and biogenic volatile organic compound emissions (BVOC)) and ecosystem services, as in the ability to mitigate PM pollution, support biodiversity, net carbon sequestration, and reduce the urban heat island effect.
Plant SpeciesNative/Invasive Plant HardinessDrought ToleranceDisease SusceptibilityAllergenicityBVOC EmissionsPM MitigationBiodiversityNet Carbon SequestrationUrban Heat Island Effect
Acer campestre (L.)3131223312
Acer platanoides (L.)2221223323
Acer pseudoplatanus (L.)2221222323
Alnus glutinosa (L.)3311132232
Alnus incana (L.)3313133222
Amelanchier lamarckii (Schroed.)1113322311
Carpinus betulus (L.)3213133222
Castanea sativa (Mill.)3111223333
Fagus sylvatica (L.) 3111213133
Fraxinus excelsior (L.) 3111133133
Ilex aquifolium (L.)3113313111
Liquidambar styraciflua (L.)2113112322
Liriodendron tulipifera (L.)2111323323
Picea abies (L.) 2321323222
Picea pungens glauca (Moench.) 2311323222
Populus alba (L.)3223112233
Quercus ilex (L.) 3111213222
Quercus robur (L.) 3121213233
Robinia pseudoacacia (L.) 1231312332
Tilia cordata (Mill.) 3221323333
Tilia platyphyllos (Scop.) 3121323333
Table 6. The PROMETHEE table indicating the ranks of plant species based on the phi net flow score. Phi+ indicates the positive (strengths) and phi− indicates the negative (weakness) scores.
RankPlant SpeciesPhiPhi+Phi−
1Tilia cordata (Mill.)0.340.440.11
2Picea abies (L.)0.210.410.20
3Alnus incana (L.)0.200.410.21
4Tilia platyphyllos (Scop.)0.190.350.16
5Acer campestre (L.)0.190.370.18
6Acer platanoides (L.)0.150.370.22
7Carpinus betulus (L.)0.120.360.25
8Picea pungens glauca (Moench.)0.060.310.26
9Robinia pseudoacacia (L.)0.050.380.33
10Acer pseudoplatanus (L.)0.030.340.31
11Populus alba (L.)−0.010.340.35
12Alnus glutinosa (L.)−0.030.300.33
13Castanea sativa (Mill.)−0.050.210.26
14Liriodendron tulipfera (L.)−0.070.220.29
15Quercus robur (L.)−0.080.230.31
16Ilex aquifolium (L.)−0.100.230.34
17Amelanchier lamarckii (Schroed.)−0.110.260.37
18Fraxinus excelsior (L.)−0.200.170.38
19Quercus ilex (L.)−0.240.130.37
20Fagus sylvatica (L.)−0.300.110.41
21Liquidambar styraciflua (L.)−0.320.160.48
Publisher’s Note: MDPI stays neutral with regard to jurisdictional claims in published maps and institutional affiliations.

