
Using a Pollution-to-Risk Method to Evaluate the Impact of a Cold Front: A Case Study in a Downstream Region in Southeastern China

1
Division of Environment and Sustainability, The Hong Kong University of Science and Technology, Hong Kong 999077, China
2
Li Cheng Tax Service, State Taxation Administration, Putian 351100, China
*
Author to whom correspondence should be addressed.
Atmosphere 2022, 13(12), 1944; https://doi.org/10.3390/atmos13121944
Submission received: 20 October 2022
/
Revised: 10 November 2022
/
Accepted: 21 November 2022
/
Published: 22 November 2022
(This article belongs to the Special Issue Air Pollution Exposure and Health Impact Assessment)
Abstract
:Cold fronts frequently intrude China in winter, causing air pollution episodes in downwind regions. Fine particulate matter (PM2.5) has been used as a major proxy of air pollution to examine the impacts of cold fronts. Compared to particles, gaseous pollutants can cause comparable or even higher levels of short-term health risks. In this study, a pollution-to-risk model was used to systematically evaluate the impacts of cold fronts on the combined health risks of air pollution mixtures, including PM2.5, nitrogen dioxide (NO2), ozone (O3), and sulfur dioxide (SO2). Dominant pollutants that caused significant mortality risks during a cold frontal passage in December 2019 over Fuzhou, a downwind city in southeastern China, were then examined. Under northerly frontal airflows, a pollution belt propagated southwards. In Fuzhou, two pollution peaks existed during the cold frontal passage. At the first peak, convergence and stagnant air in the frontal zone rapidly accumulated local air pollutants. The dominant pollutants that caused the mortality risk were identified as NO2 and PM2.5, both of which contributed 45% to the total risk. At the second peak, advection transported a significant amount of secondary pollutants from the upwind regions. Although PM2.5 was the dominant pollutant at this peak, gaseous pollutants still accounted for 34% of the total risk. Our risk analyses underscore the significant health impacts of gaseous pollutants during cold frontal passages in winter. The results generated from this study will help guide environmental policy makers in forming and improving air pollution control strategies during pollution episodes.
1. Introduction
Severe air pollution episodes are frequently reported in China [1]. Because pollutant emissions are relatively steady from day to day, the evolution and occurrence of pollution episodes are largely governed by synoptic patterns and meteorological conditions [2,3,4]. Cold fronts are common synoptic patterns that frequently intrude China in winter [5,6]. They play a significant role in the earth’s heat regulation system, transferring heat between polar and tropical regions. As the cold front passes a location, temperature falls, wind speed increases, and wind direction changes. In pollution source regions (e.g., northern China), the windy conditions in the immediate aftermath of a cold front often help to dilute and disperse air pollution [7].
However, downwind regions of a cold front are often affected by pollutants transported from source regions through the advection process [8,9]. Hu et al. [10] investigated a severe air pollution event in eastern China and found that a belt of fine particulate matter (PM2.5) pollution was transported at the leading edge of a cold front. Similar transport of PM2.5 pollution was found during another cold frontal passage that occurred in central China [5]. Kang et al. [11] examined the pollutant transport in the Yangtze River Delta (YRD) during a cold frontal passage, and showed a southward propagation of PM2.5 peaks under northwesterly frontal airflows. In these studies, PM2.5 was used as a major proxy of air pollution to examine the impacts of cold fronts.
Air pollution in the atmosphere is characterized by highly diverse chemical species, including not only particles but also gaseous pollutants, such as nitrogen dioxide (NO2), ozone (O3), and sulfur dioxide (SO2) [12,13]. Compared to particles, these gaseous pollutants can cause comparable or even higher levels of short-term health risks during pollution episodes. A global review of the short-term all-cause mortality risk of air pollution concluded that the relative risks per 10 µg/m3 increase in PM2.5, NO2, O3, and SO2 concentrations were 1.0065, 1.0072, 1.0043, and 1.0059, respectively (i.e., NO2 > PM2.5 > SO2 > O3) [14,15]. A similar relative significance of the short-term health risks of air pollutants was found in the Air Quality Health Index (AQHI) systems of Canada (NO2 > O3 > PM2.5) and Hong Kong (O3 > NO2 > PM2.5 > SO2) [16,17]. Given the significant health risks of both particle and gaseous pollutants, it is important to systematically evaluate the impacts of cold fronts on air pollution mixtures and their health risks.
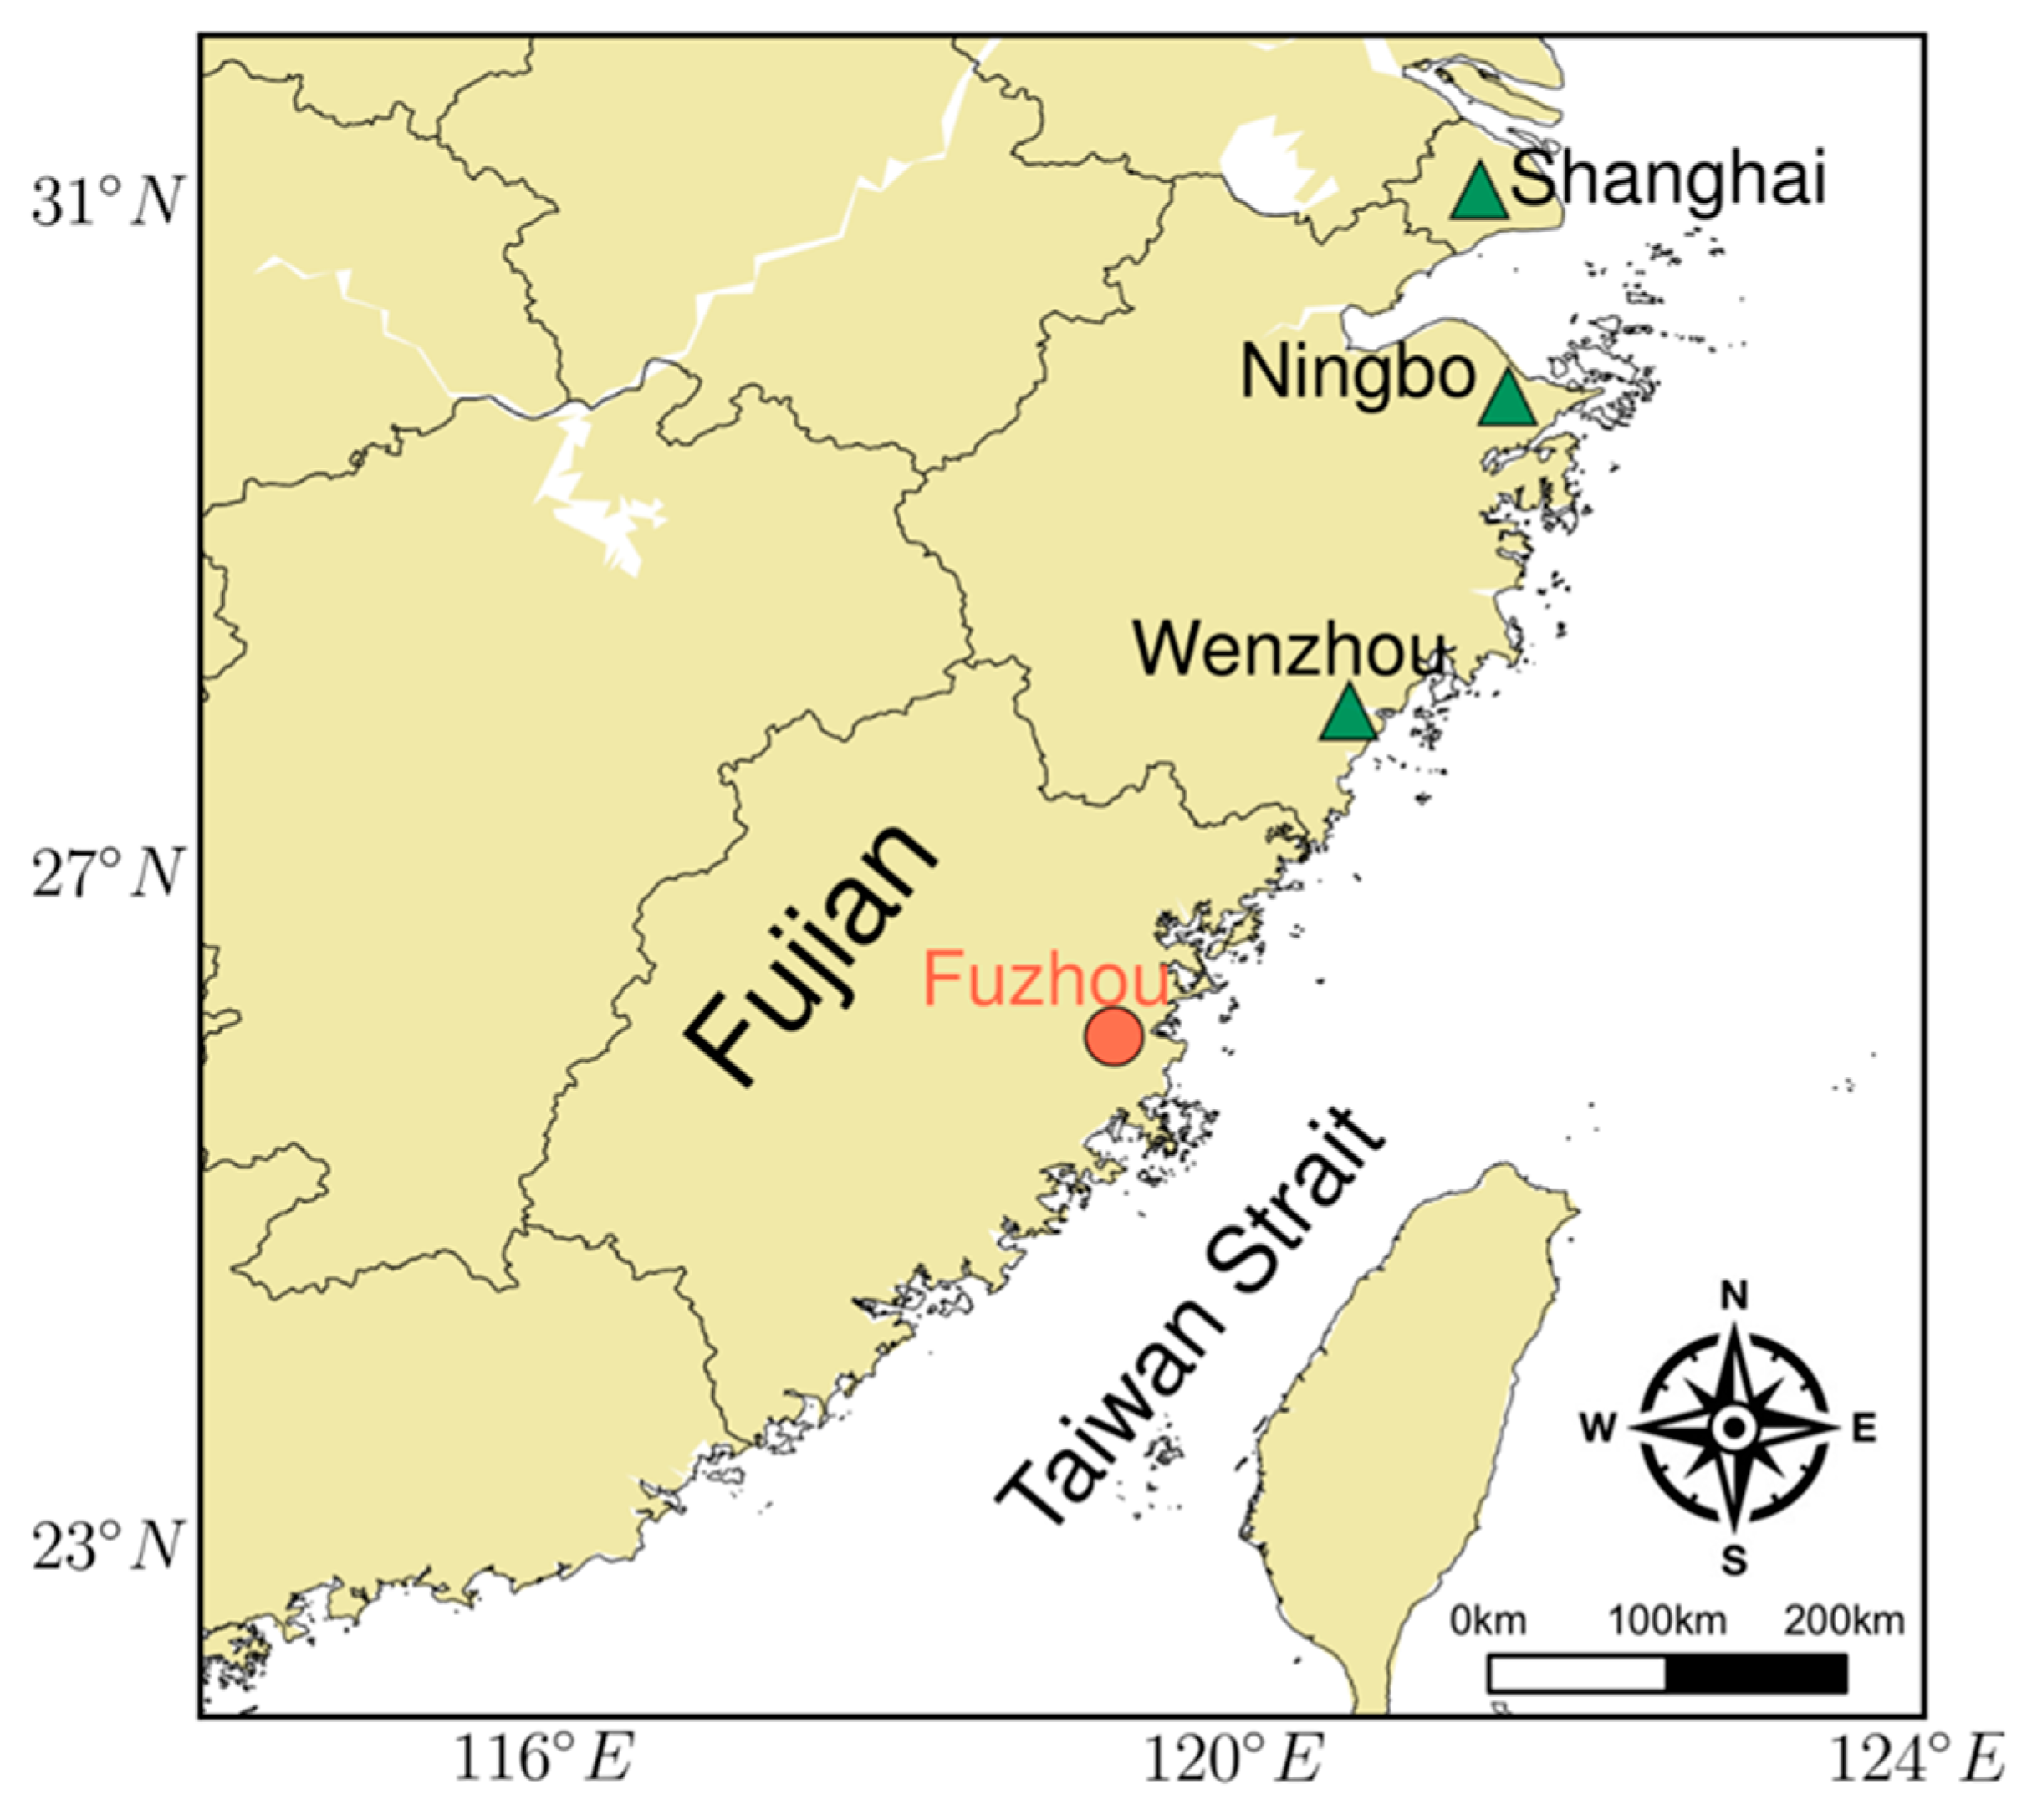
Most of the aforementioned assessments were concentrated in the major city clusters in central and eastern China [11]. It is worth noting that coastal cities around the Taiwan Strait are significantly affected by pollutant transport from surrounding regions [18,19]. In the winter, the monsoon not only brings cold air, but also transports air pollutants over a long distance. Fuzhou, the capital of Fujian Province, is one of the major cities in the Western Taiwan Straits (WTS) economic zone [20]. As a key coastal city in southeastern China, Fuzhou is at a location between two major city clusters of China: the YRD and Pearl River Delta (PRD). Therefore, an evaluation of air quality variations in Fuzhou is of particular importance to reveal the impacts of cold fronts in the downstream regions. Compared to the major city clusters of China, the evaluations in the WTS economic zone remain limited.
In the frontal zone, cold air advances into warm air, thereby creating convergence between the two air masses [21]. This convergence forces the warm air to ascend in the frontal region and noticeably enhance condensation rates [22]. With a southward-moving cold front, surface wind in the frontal zone is governed by the convergence of cold air from the north and warm air from the south. This convergence causes stagnant air, which rapidly accumulates air pollutants near the ground. Compared to the advection process, the convergence effect is much less discussed.
Compared to previous literature, the contributions of this study and our objectives are summarized as follows: PM2.5 has been used as a major proxy of air pollution to examine the impacts of cold fronts [5,10,11]. Compared to particles, gaseous pollutants can cause comparable or even higher levels of short-term health risks [14,15,16,17]. Conventional investigations without considering the impacts of gaseous pollutants may lead to a bias in recommending air pollution control strategies to policy makers. This study targets the combined impacts of both particulate matter and gaseous pollutants during a cold frontal passage. The dominant pollutants that cause health risks are examined using a pollution-to-risk model.
In this study, we investigated an air pollution episode that occurred in Fuzhou during a cold frontal passage in December 2019. The potential impacts of advection and convergence processes on the occurrence of the pollution episode were discussed. In addition, the variations in the concentration levels of both particulate matter and gaseous pollutants (e.g., NO2, O3, and SO2) were systematically evaluated. The pollution-to-risk model from the AQHI systems of Canada and Hong Kong was adopted to evaluate the combined health risk of air pollution mixtures. Dominant pollutants that increased health risk during the pollution episode were then examined. The results generated from this study are envisioned to guide local and regional environmental policy makers in forming and improving air pollution control strategies during pollution episodes.
2. Materials and Methods
The research design of our study is summarized as follows: (1) Because cold fronts can significantly worsen air quality in downwind regions, this study targets a downwind city in southeastern China. (2) Both transport and convergence can play a significant role in the occurrence of a pollution episode that is associated with a cold front. The equation of continuity is used to understand the different impacts of transport and convergence on pollution variations during a cold frontal passage. (3) Given the considerable short-term health risks of both particles and gaseous pollutants, a pollution-to-risk model is used to systematically evaluate the impacts of cold fronts on the health risks of air pollution mixtures. The dominant pollutants that cause significant health risks during a cold frontal passage are then examined.
2.1. Study Region
As shown in Figure 1, Fuzhou is one of the major cities located in the WTS economic zone. As a new economic zone, the WTS was developed by the Chinese government in 2009. A sustainable ecological environment is one of the major requirements of economic development [23]. The growth of the regional economy, however, rapidly worsens air quality in this region. The conflict between rapid economic development and ecological sustainability has become increasingly prominent [24]. In the winter, this region is frequently affected by cold fronts, which may bring a substantial amount of air pollutants from northern China and the YRD. Accordingly, the primary study region of our analyses is Fuzhou, the capital of Fujian Province, China.
2.2. Air Quality and Meteorological Data
Hourly air pollution (PM2.5, NO2, O3, and SO2) mass concentration data for the four cities (shown in Figure 1) were obtained from the Chinese national air quality monitoring network (http://www.cnemc.cn/, accessed on 20 December 2019). To evaluate the effects of meteorological variations, hourly wind data over East Asia were acquired from the global telecommunications system of the World Meteorological Organization (WMO). To assist the analyses, weather charts over East Asia during the pollution episode were obtained from the Hong Kong Observatory (https://www.hko.gov.hk/, accessed on 20 December 2019).
2.3. Air Quality Model Configuration
To better understand pollutant transport, air quality model simulations were also used in this study. Our air quality modelling system comprises the Sparse Matrix Operator Kernel Emissions Processing System (SMOKE) as an emission module, the Weather Research and Forecast model (WRF) as a meteorological module, and the Community Multiscale Air Quality (CMAQ) model as a chemical transport module. The WRF model provides a time-varying meteorological field, which powers the CMAQ model. The modelling system is set up on a nested domain with a grid size of 27 km over East Asia. More details of the model setup can be found in Zhang et al. [25].
2.4. Equation of Continuity
Assuming local emissions remain steady, severe air pollution can be caused by the advection and convergence processes. The continuity equation in fluid dynamics states that the rate of change in mass within a volume is equal to the net inflow rate of mass. The differential form of the continuity equation can be expressed as:
Here, c represents fluid density, which is pollutant concentration (unit: μg/m3) in this study; t represents time (unit: s); and represents the field of velocity vector (unit for wind speed: m/s). The equation can be decomposed by separating pollutant concentration and the velocity vector:
The first term is the effect of pollutant transport, resulting from a decreasing concentration gradient from the upwind region to the study region. Both and are vectors. The dot product of these two vectors produces a scalar. The second term is the effect of convergence, resulting from the change in wind velocity. With a southward-moving cold front, surface wind in the frontal zone is governed by the convergence of cold air from the north and warm air from the south. The equation of continuity will be used to explain and understand the occurrence and evolution of the pollution episode during the cold frontal passage.
2.5. Pollution-to-Risk Model
The Air Pollution Index (API) is a common value reported by governments in a lot of countries, including China and the United States. AQHI, which directly calculates the combined health risk of air pollutants, is used in Canada and Hong Kong. Compared with the API system, the AQHI system can help better inform the public of the short-term air quality-related health risks in a more timely and quantitative manner. In this study, the quantification of the short-term health risks of air pollutants relies on the pollution-to-risk model used in the AQHI systems of Canada and Hong Kong [16,17]. The model estimates the percentage of added health risk (%AR, or so-called excess risk) of all-cause mortality or cause-specific hospital admission for different air pollutants. For specific pollutants, i, the %AR can be calculated as:
where represents the concentration level of a specific pollutant and represents the corresponding risk coefficient. The sum of the %AR for individual pollutants represents the combined health risk of air pollution mixtures. Table 1 summarizes the β coefficients for different air pollutants from a global literature review and the AQHI systems of Canada and Hong Kong. The β coefficients from the global review and the AQHI of Canada are associated with all-cause mortality. SO2 was dropped from the Canadian AQHI because of its low additional health risk. The β coefficients from the AQHI of Hong Kong were associated with hospital admissions for respiratory and cardiovascular diseases. The primary β coefficients used in this study were those obtained from the global review. Results based on the β coefficients from the two AQHI systems were used for comparisons.
3. Results
3.1. Impact of the Cold Front on Meteorology
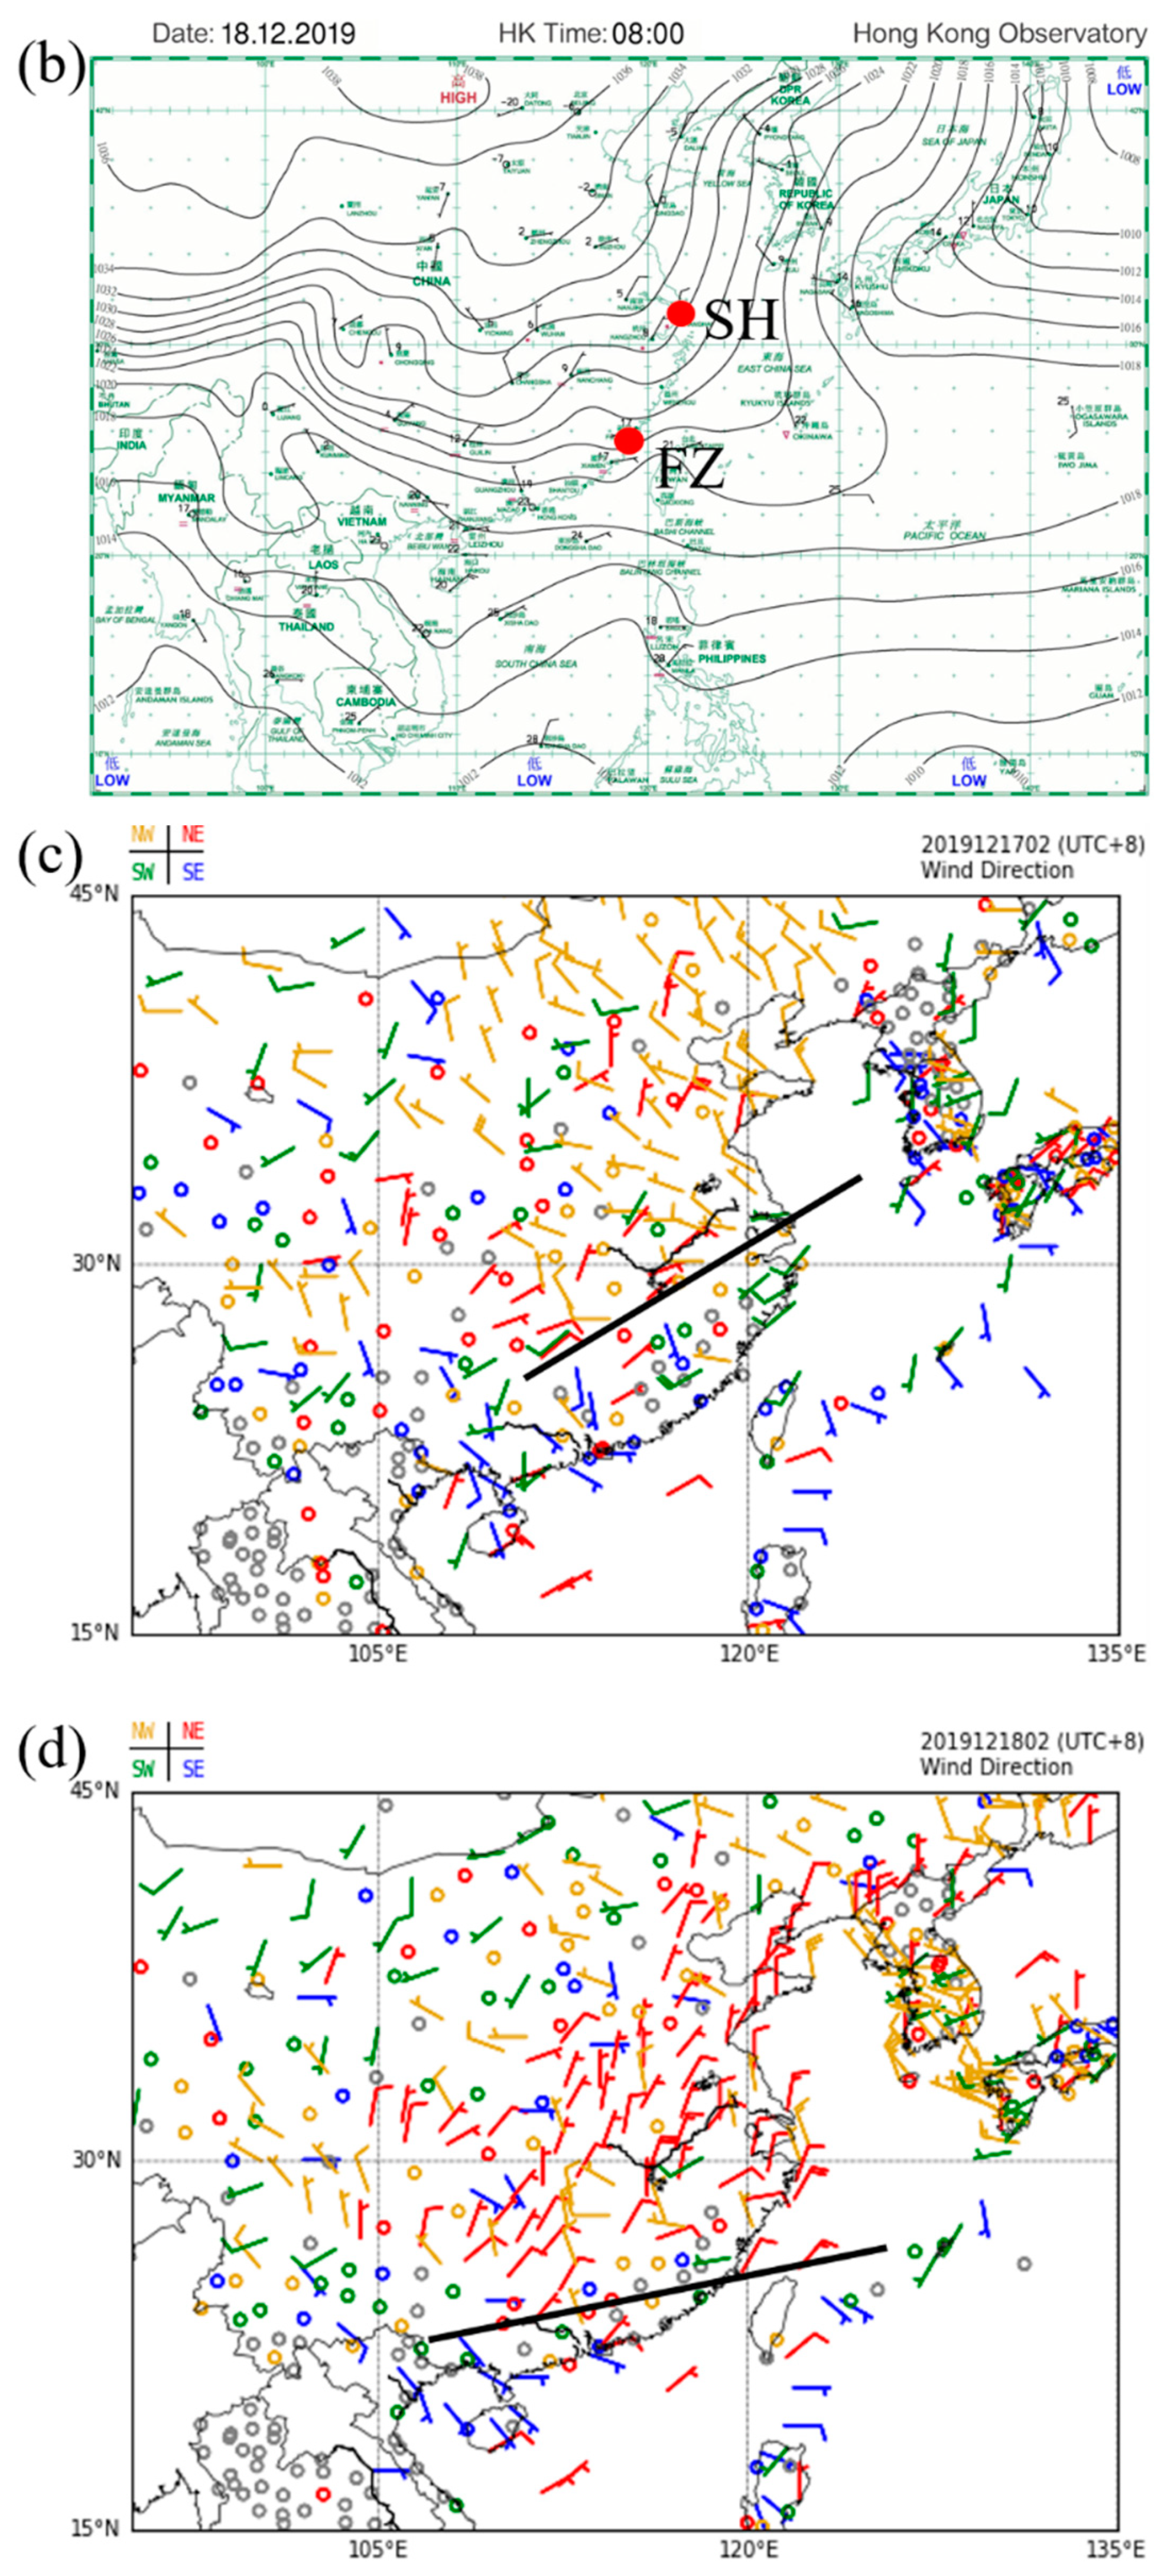
Weather charts provide basic information on synoptic patterns. Panels (a) and (b) in Figure 2 display the weather charts at 8:00 a.m. local standard time (LST) on 17 and 18 December 2019, respectively. In the winter, low temperatures continuously created high surface air pressures over the Asian continent. After the cold air mass intensified over its source region at high latitudes, it began to move southwards. As the cold air mass advanced towards a warm region, a cold front was generated at the boundary surface that separated the cold and warm air masses. The cold front arrived at Shanghai in the early morning of 17 December, and at Fuzhou overnight between 17 and 18 December.
Behind the cold front, wind speed increased and the wind direction turned northerly due to the change in pressure gradient force. Figure 2c,d show the spatial distributions of wind conditions (wind barbs) from ground weather stations over East Asia at 2:00 a.m. LST on 17 and 18 December 2019, respectively. Black straight lines represent the locations of the cold front. Behind the cold front, the dominant winds were either northwesterly (orange barbs) or northeasterly (red barbs). These northerly winds could transport air pollutants from northern China and the YRD region into southeastern China.
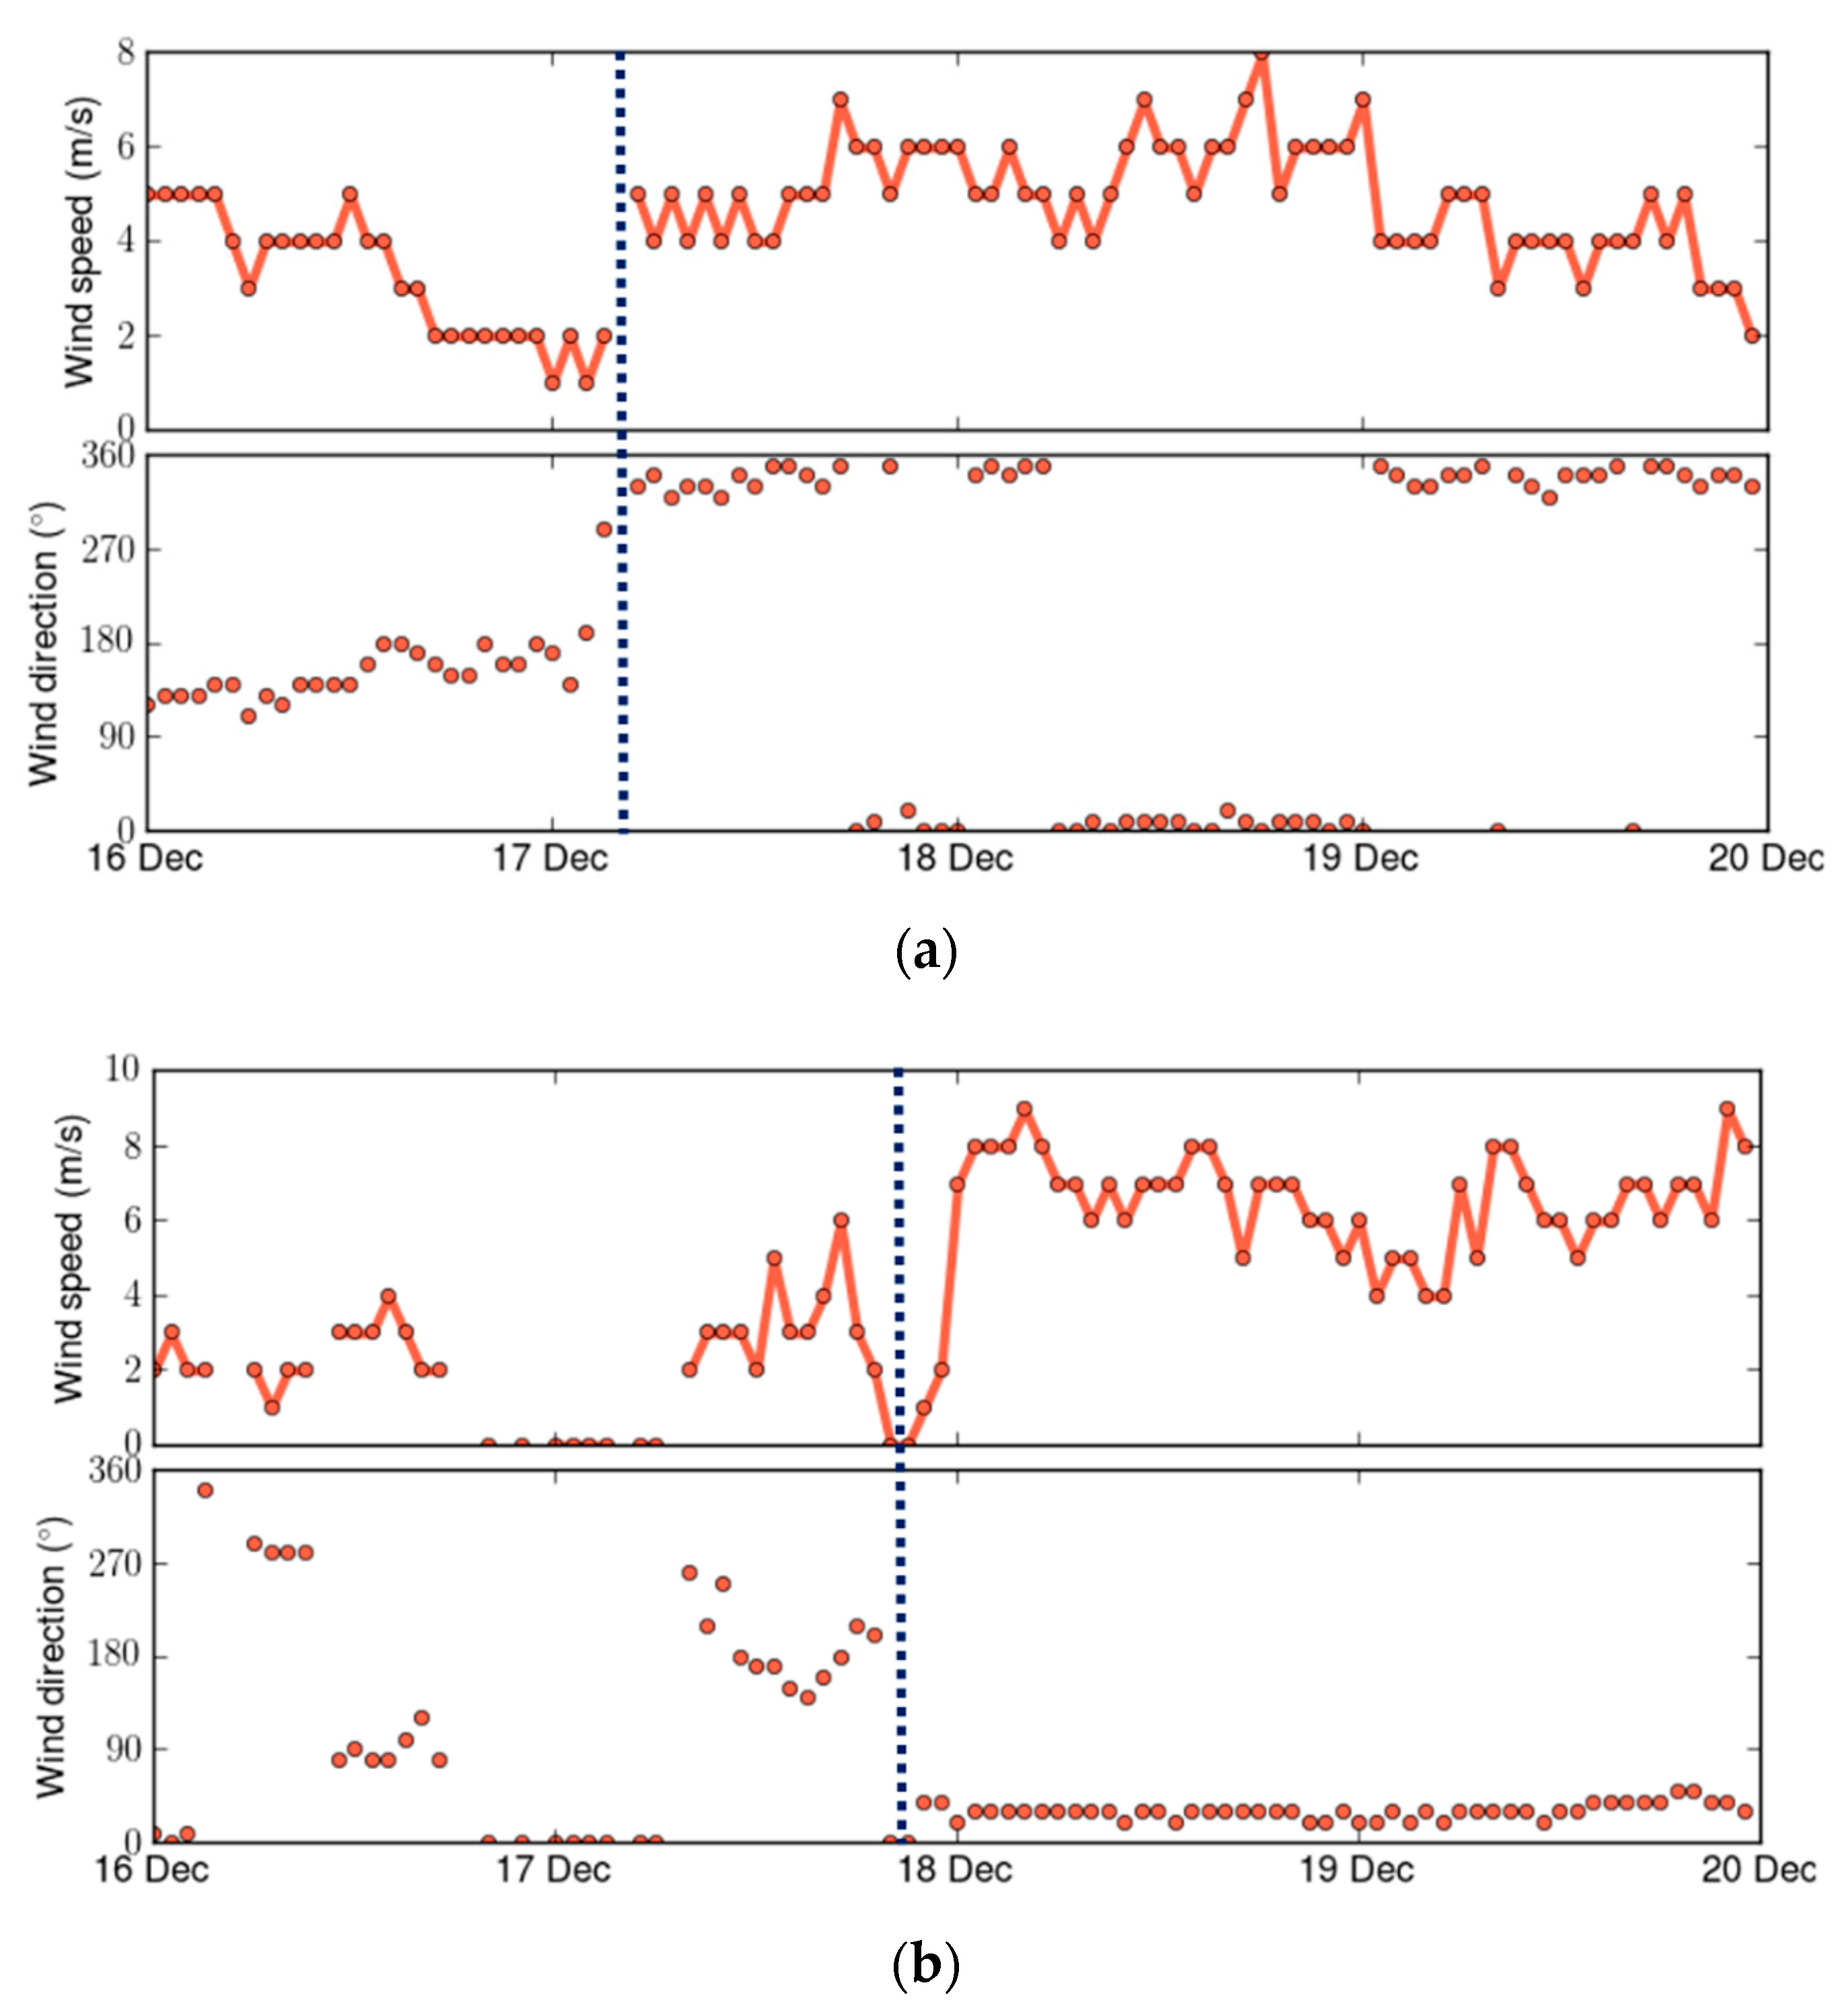
To better understand the impacts of the cold front on wind conditions, the time series of wind speed and direction are analysed. Figure 3a,b display the time series of wind speed and direction at Shanghai and Fuzhou, respectively, from 16 to 19 December 2019. Before the cold front arrived at Shanghai, the dominant winds in Shanghai were southerly. As the cold front arrived at Shanghai in the early morning of 17 December, the wind speed rapidly increased and wind direction turned northerly. The changes in wind conditions were found in Fuzhou overnight between December 17 and 18, when the cold front arrived at the city. With this southward-moving cold front, the wind in the frontal zone was governed by significant air convergence, causing stagnant air with low wind speeds.
3.2. Impact of the Cold Front on Air Pollution
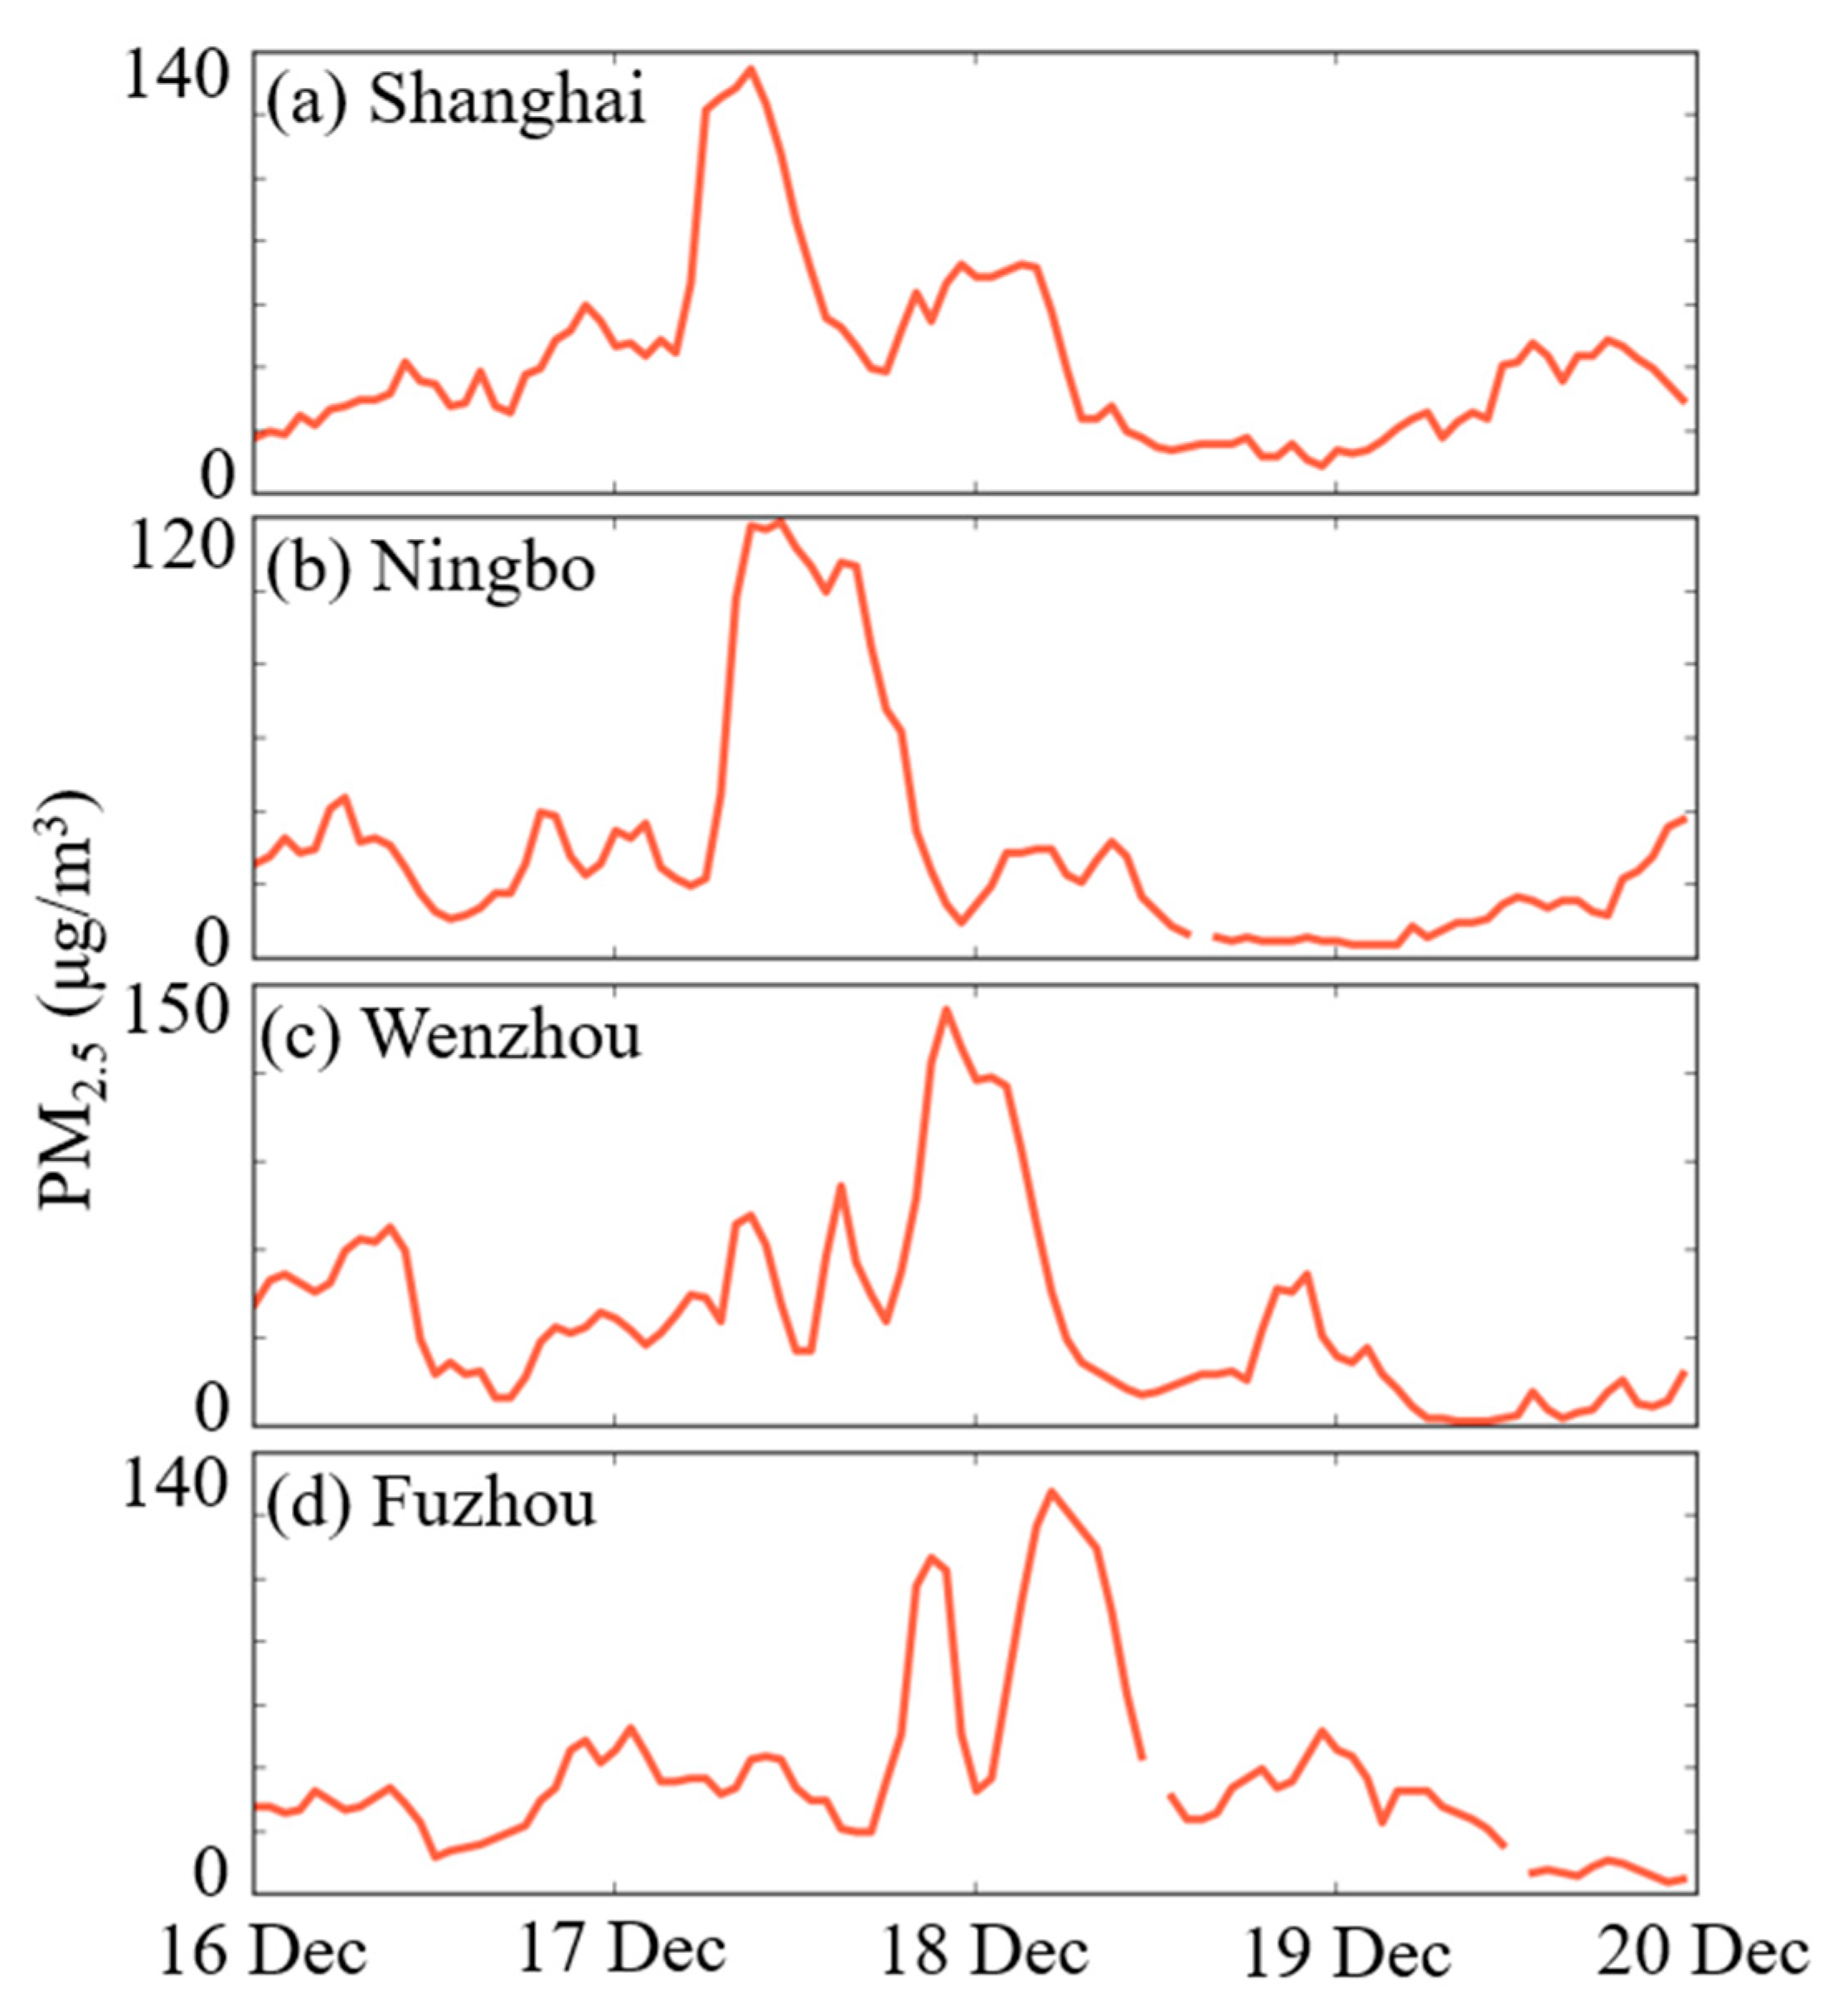
Cold fronts can transport pollutants from upstream polluted regions. Figure 4 shows the time series of PM2.5 concentrations in Fuzhou and three upwind cities, including Shanghai, Ningbo, and Wenzhou, from 16 to 19 December 2019. A southward propagation of the PM2.5 peak was found under the northerly frontal airflows. The cold frontal passage caused a burst of PM2.5 in Shanghai in the early morning of 17 December. PM2.5 in Shanghai reached its peak of 135 µg/m3 at 9:00 a.m. on 17 December. Later on, the PM2.5 peak with a maximum of 119 µg/m3 propagated to Ningbo during the daytime of 17 December. PM2.5 increases were observed overnight between 17 and 18 December in Wenzhou and Fuzhou. PM2.5 in Wenzhou reached its peak of 142 µg/m3 at 22:00 p.m. on December 17, while PM2.5 in Fuzhou reached its peak of 128 µg/m3 at 5:00 a.m. on 18 December. The association between the cold frontal passage and the occurrence of the pollution peak is clear.
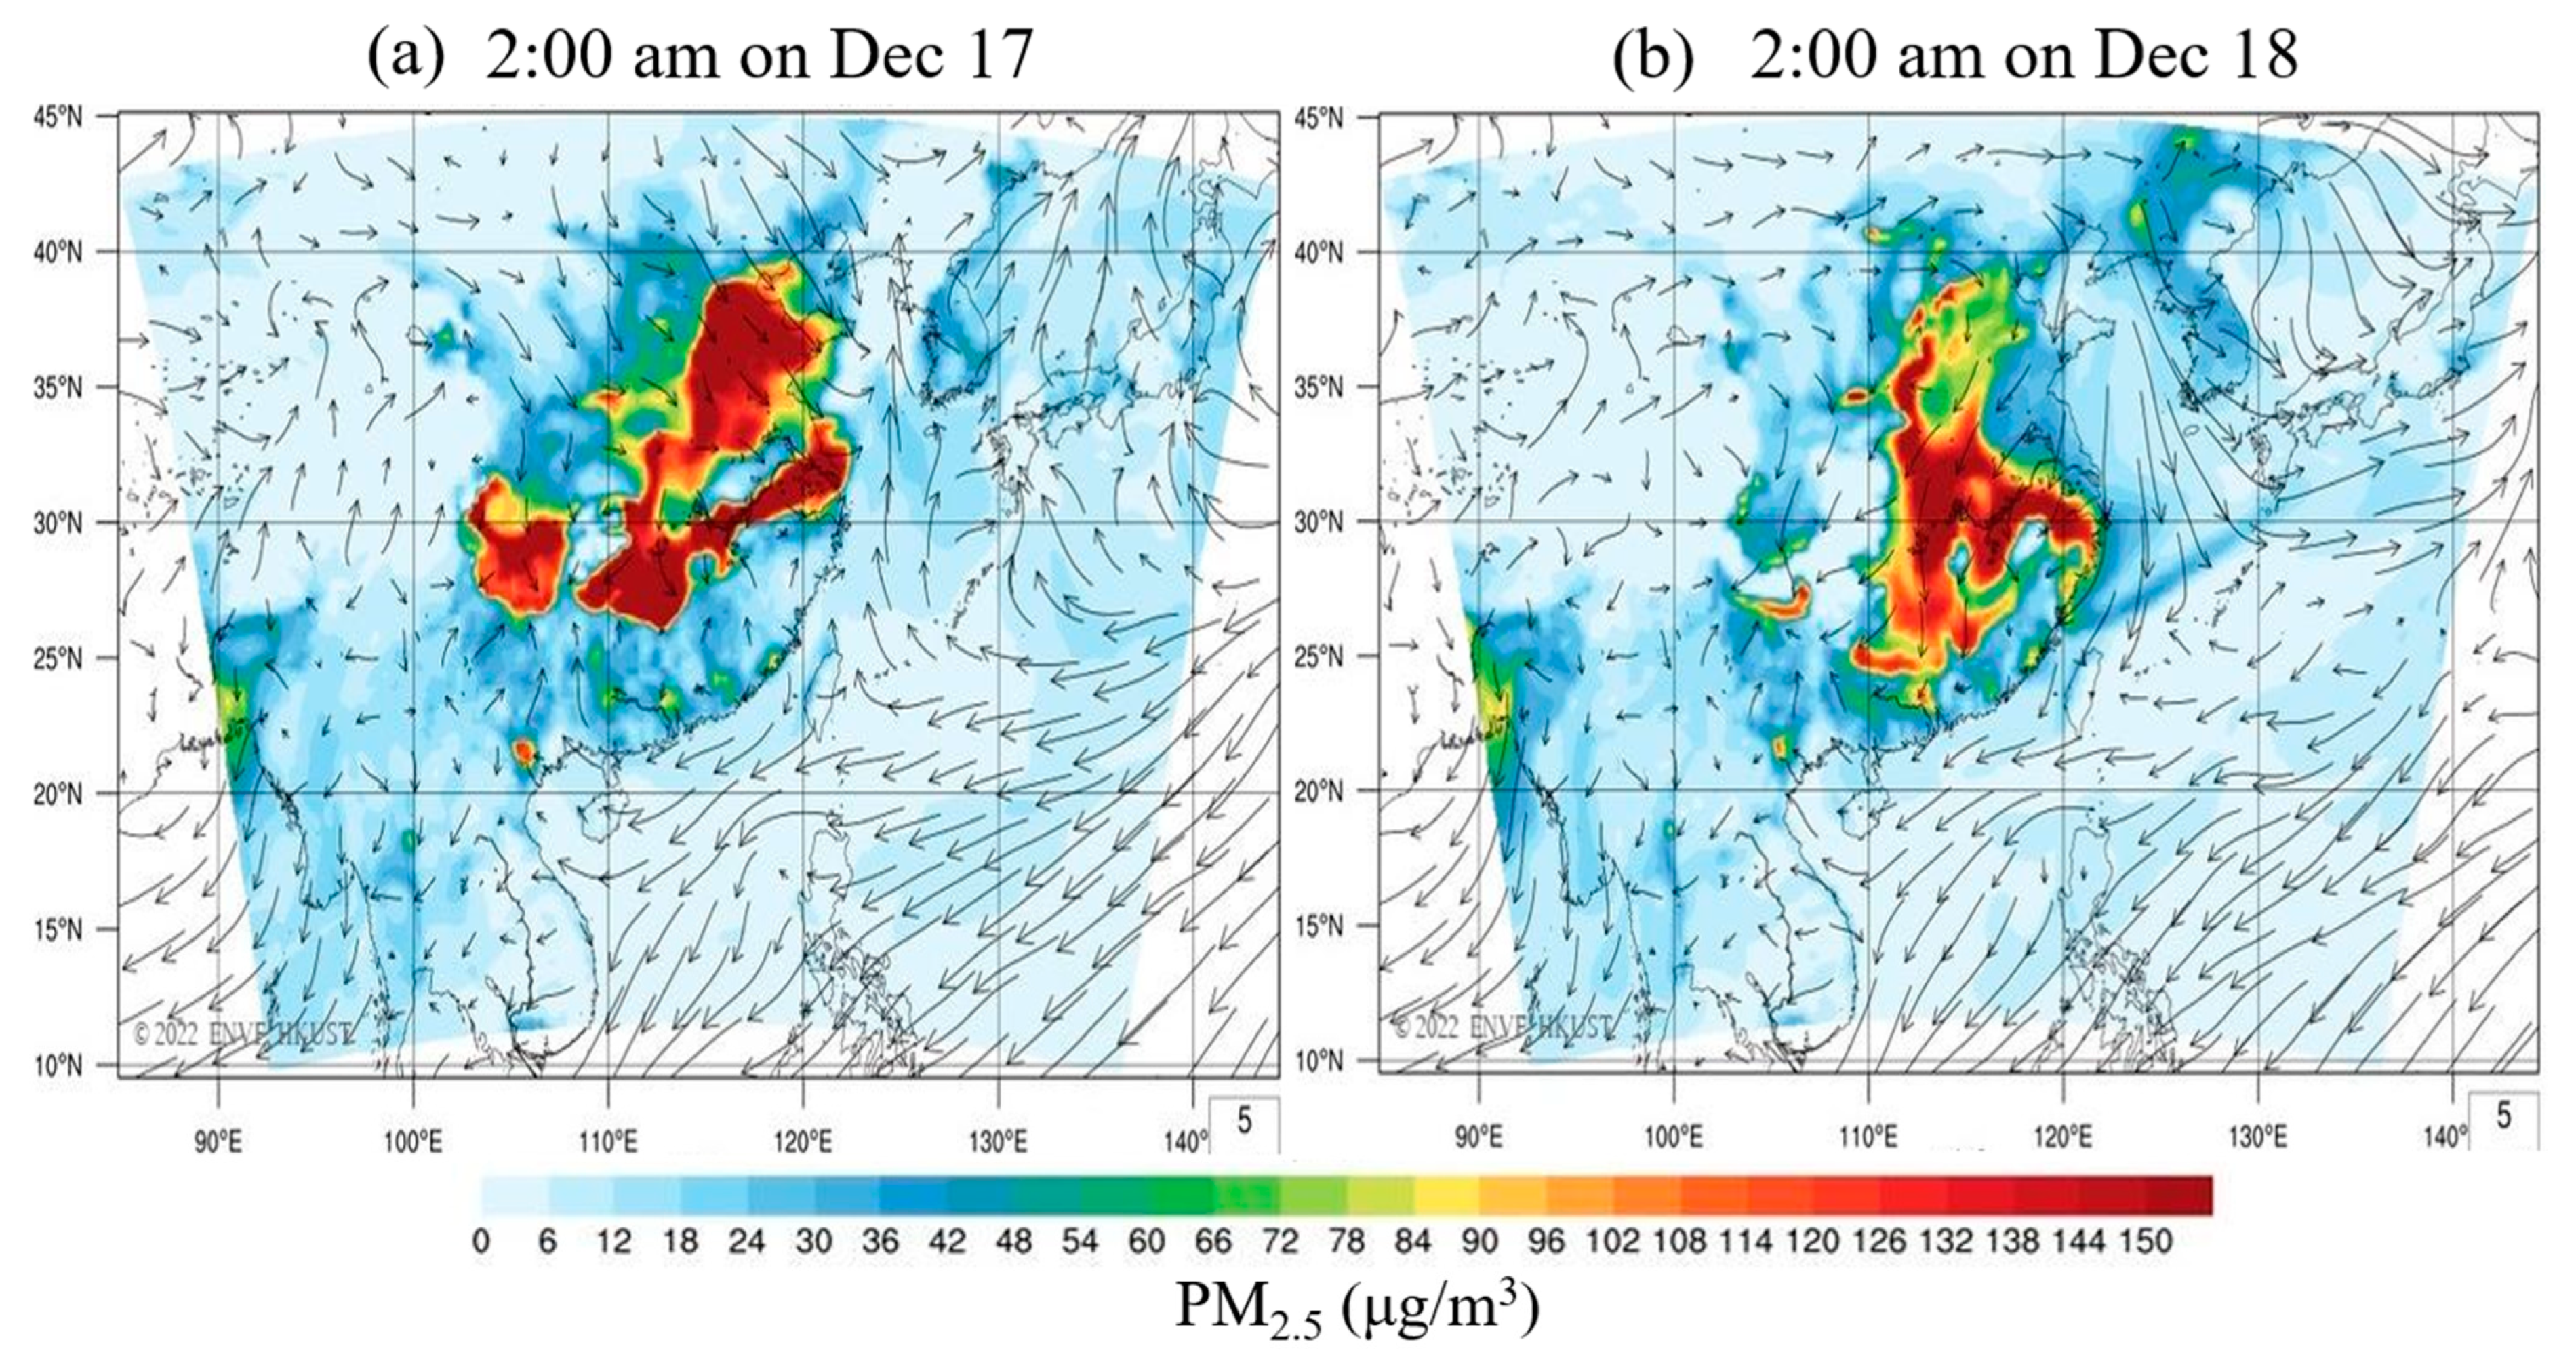
WRF-CMAQ model simulations were used to further reveal the impact of the cold front on the evolution of air pollution in China. Figure 5 shows the spatial distributions of PM2.5 concentrations in China at 2:00 a.m. LST on (a) 17 December and (b) 18 December 2019, from the WRF-CMAQ model simulations. As the cold front moved southwards, the strengthened winds diluted the pollutants in northern China and transported them to southern and southeastern China. In northern China, PM2.5 concentrations greatly declined on 17 December. Based on ground air quality monitoring, the PM2.5 concentration in Beijing (39.9425° N, 116.3610° E), a key city in northern China, dropped from 75 µg/m3 at 22:00 p.m. on December 16 to 3 µg/m3 at 23:00 p.m. on 17 December. In addition, a belt of PM2.5 pollution propagated southwards, affecting southern and southeastern China on 17 December.
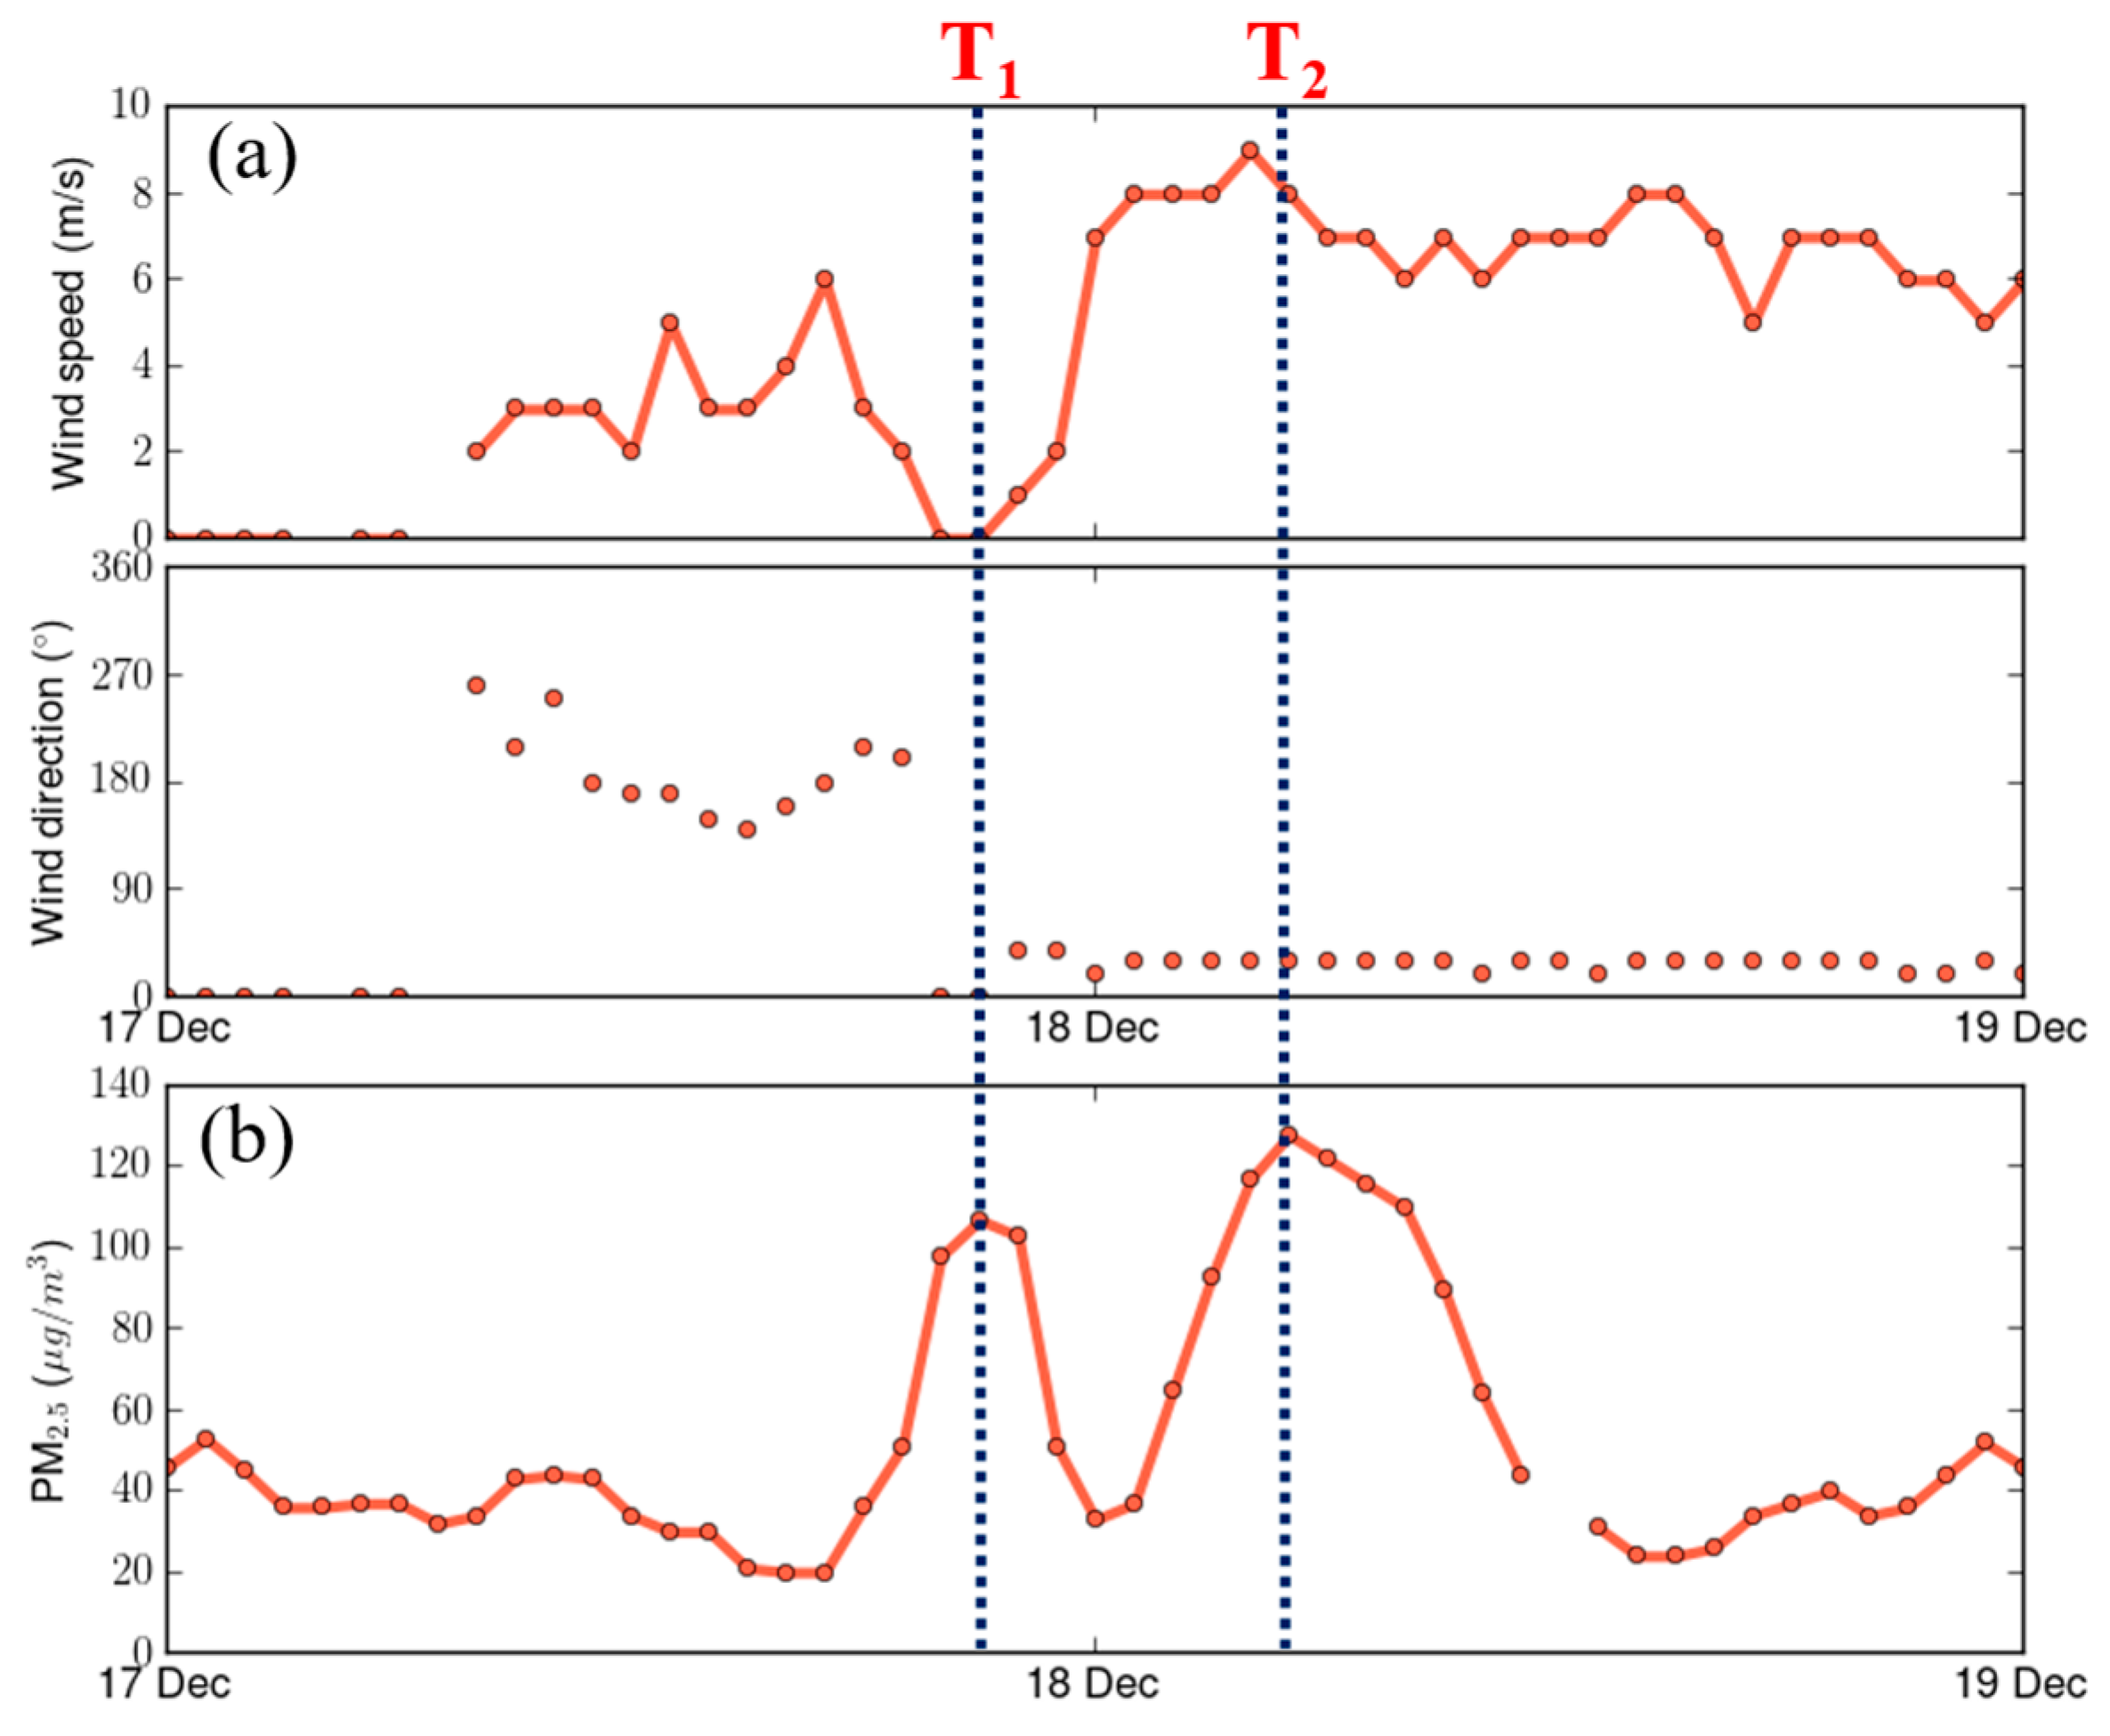
We now focus on the impacts of the cold front on PM2.5 variation in Fuzhou, a downwind city in southeastern China. Figure 6 compares the time series of (a) wind and (b) PM2.5 concentration in Fuzhou from 17 to 18 December 2019. The two PM2.5 peaks at 21:00 p.m. LST on 17 December and 5:00 a.m. LST on 18 December are marked as T1 and T2, respectively. T1 represents the time of the cold fontal passage. At T1, cold air from the north and warm air from the south converged in the frontal zone, resulting in a stagnant atmosphere with extremely low wind speeds. The convergence and stagnant air hindered the dispersion of pollutants and thus rapidly accumulated air pollutants. PM2.5 rapidly increased from 20 µg/m3 at 17:00 p.m. to 107 µg/m3 at 21:00 p.m. on 17 December. The effect of convergence can be explained very well by the convergence term in the equation of continuity. This convergence effect only occurred in the frontal zone and lasted for around 5 h. As the wind speeds increased behind the cold front, pollutant concentrations rapidly declined to 33 µg/m3 at 0:00 a.m. on 18 December. PM2.5 concentration reached another peak at T2. With steady northerly winds with wind speeds of 6–8 m/s, the advection process was the major cause of this pollution peak. PM2.5 reached the second peak of 128 µg/m3 at 5:00 a.m. on 18 December. This pollution peak can be explained very well by the advection term in the equation of continuity.
These results underscore the significant effects of both convergence and advection on the occurrence of the pollution episode during the cold frontal passage. Convergence plays a dominant role in the frontal region because wind patterns suddenly change during a short period of time. The advection effect plays a significant role when a concentration gradient exits in the upwind region. The effects of convergence and advection sometimes mix. As shown in Figure 4, the time series of PM2.5 in Shanghai and Ningbo exhibited only one significant peak, suggesting that the two effects mixed during the cold frontal passage in these regions.
3.3. Impact of the Cold Front on Health Risk
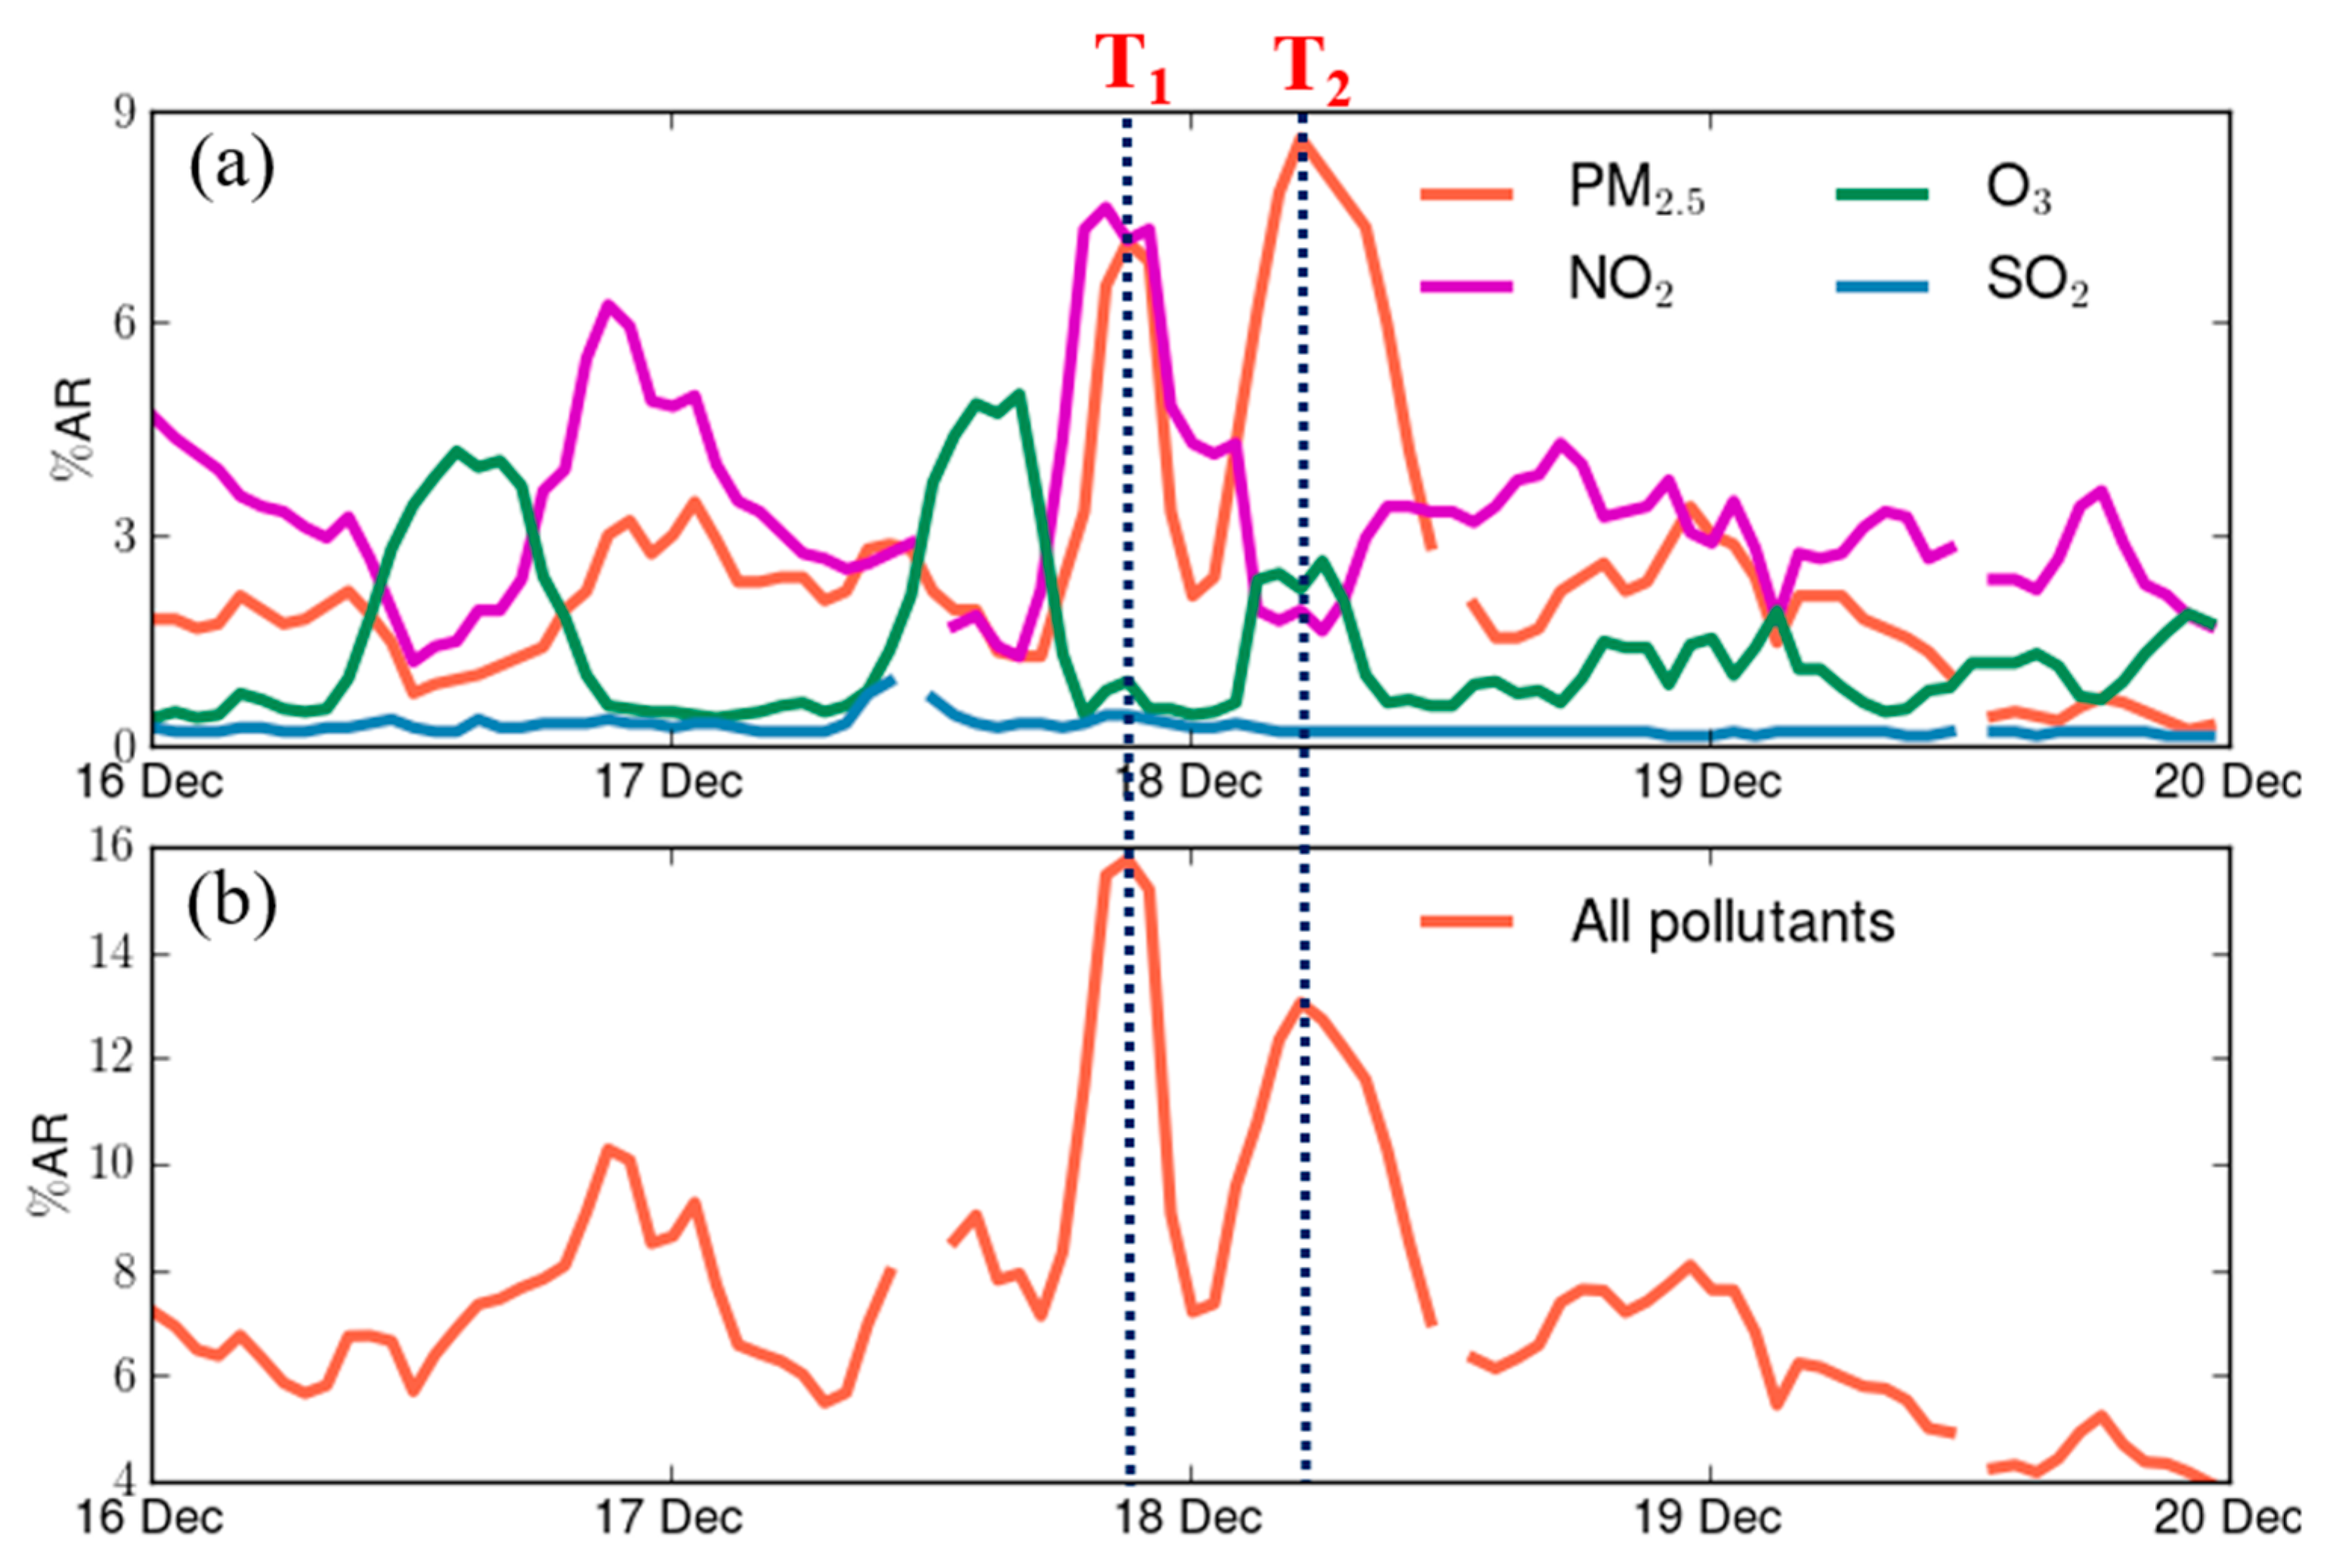
The pollution-to-risk model, together with the β coefficients of the global literature review, are now applied to evaluate the variations in the %AR of all-cause mortality that are associated with air pollutants. Figure 7a shows the time series of the %AR of all-cause mortality for PM2.5, NO2, O3, and SO2 in Fuzhou from 16 to 19 December 2019. The time series of the combined %AR for the four pollutants is shown in Figure 7b. Before the cold frontal passage (i.e., 16 December), the concentration levels of air pollutants exhibited significant diurnal cycles. O3 was the dominant pollutant that caused a significant level of short-term mortality risk during the daytime, with enhanced photochemical formations. During the nighttime with a shallow boundary layer, the dominant pollutant with short-term health risks was NO2, which was mainly produced in local combustion sources (e.g., local traffic).
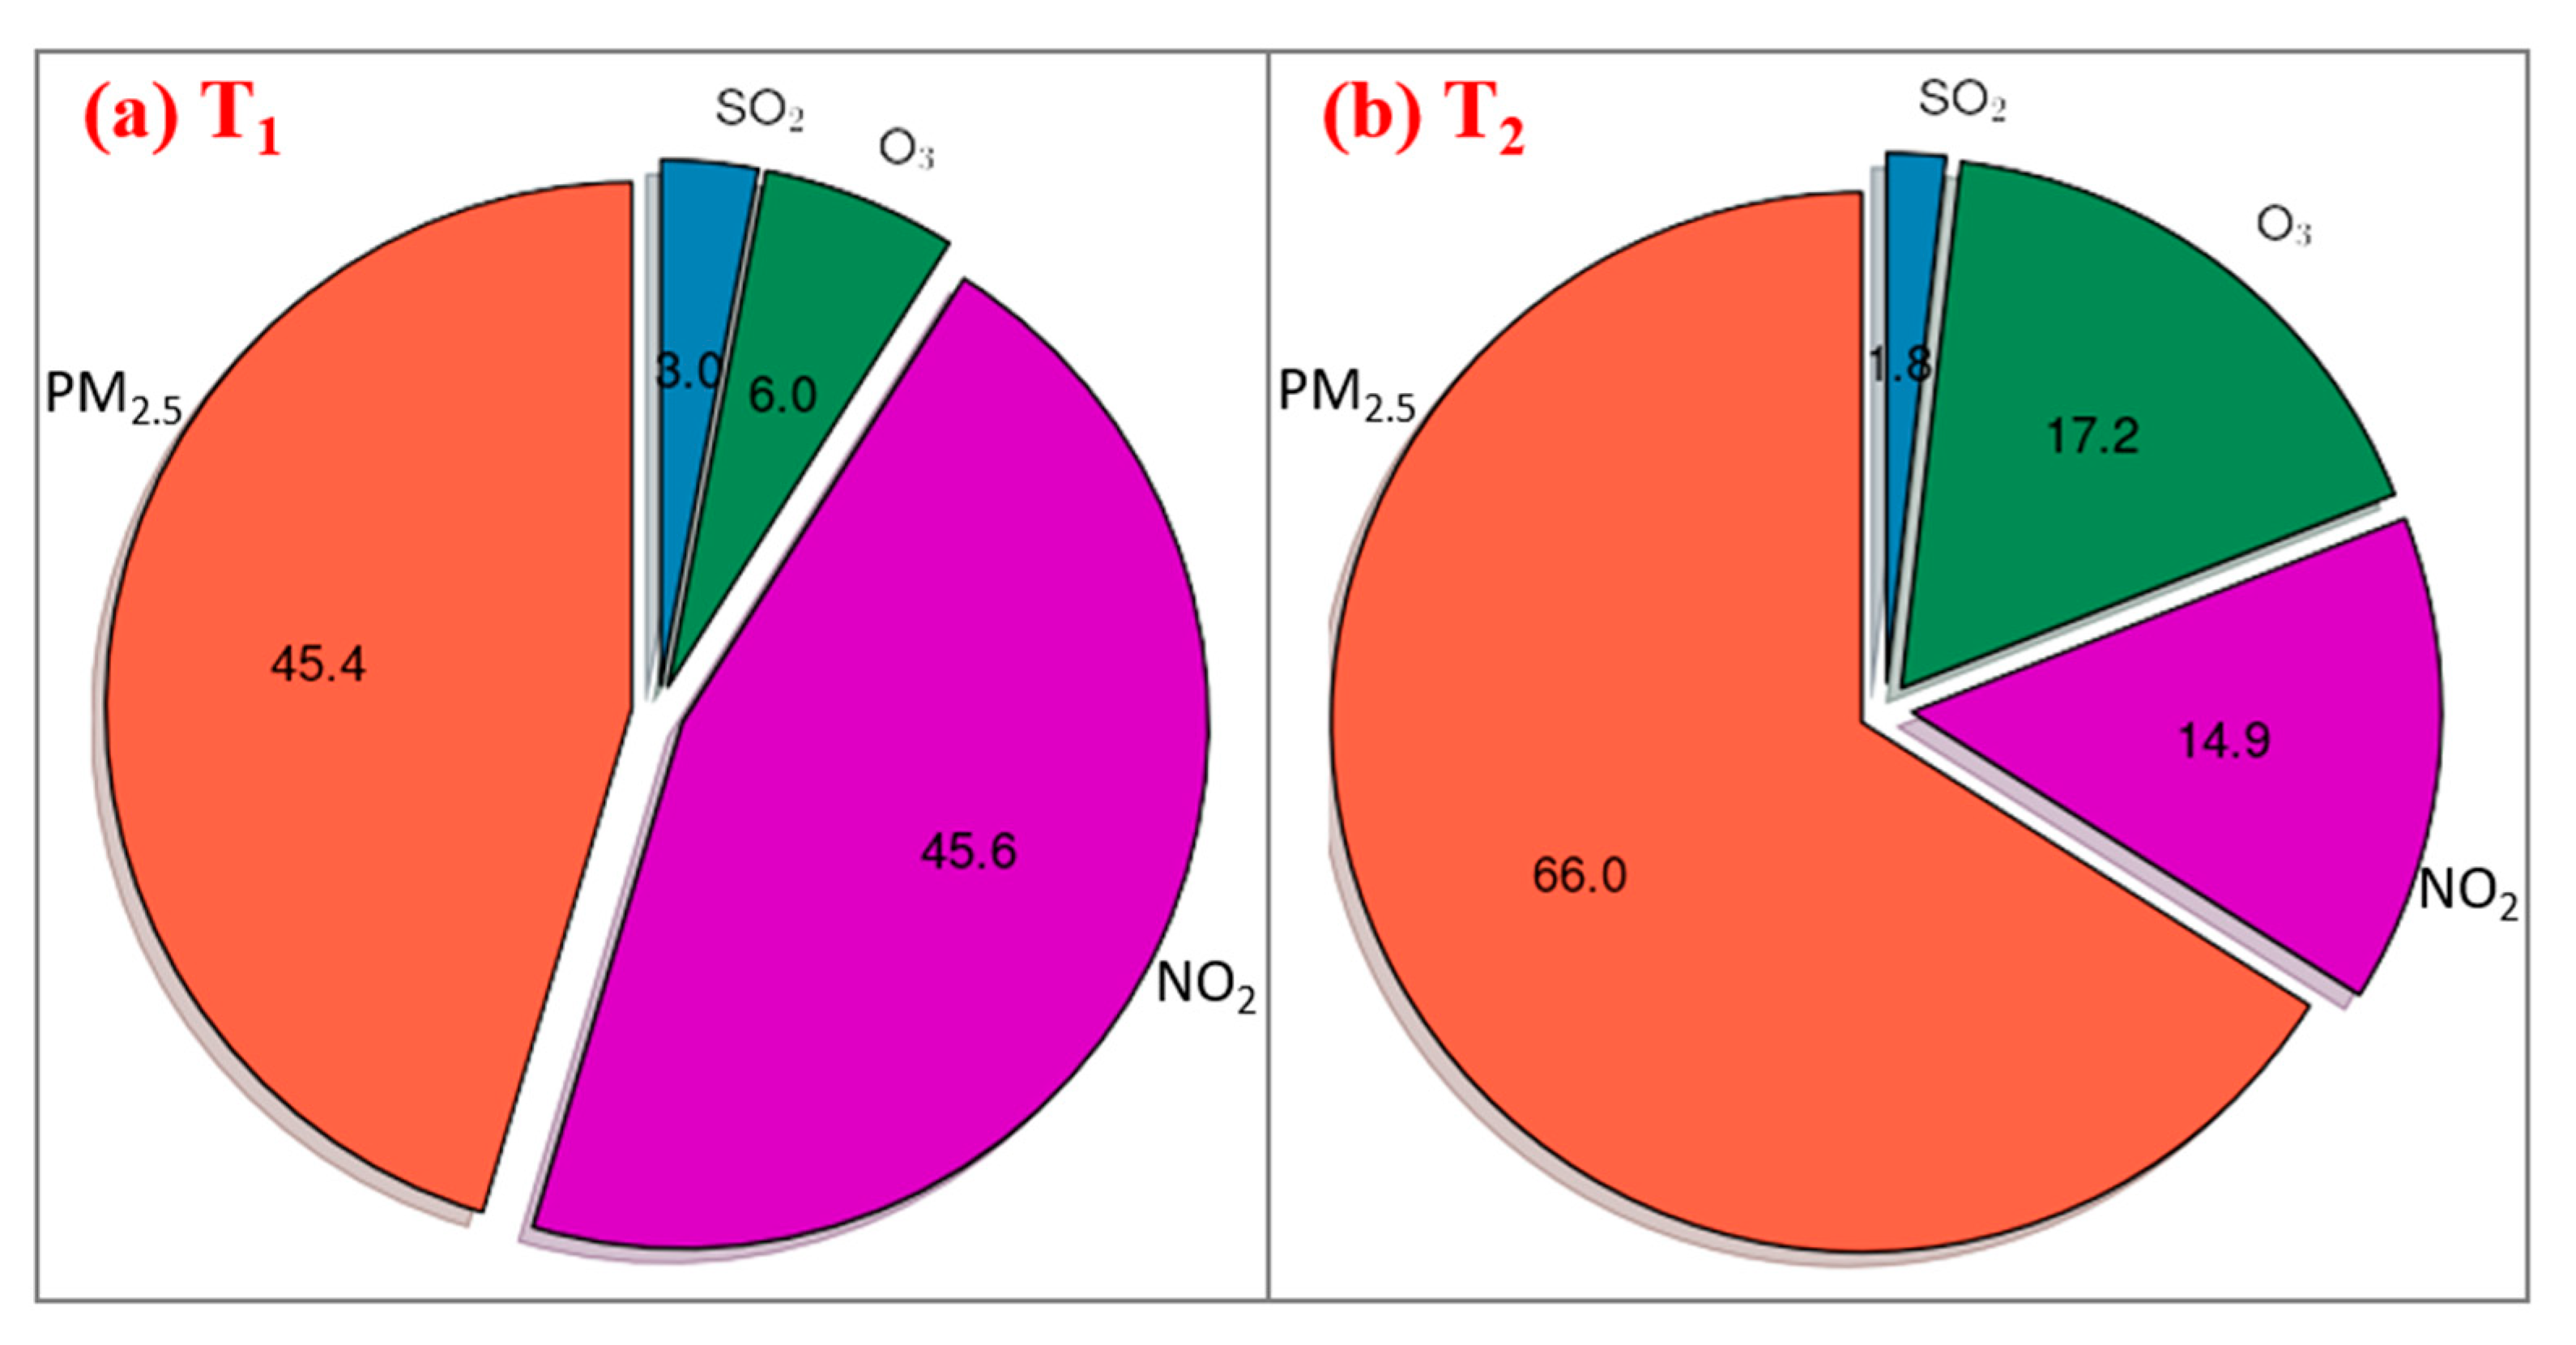
At pollution peak T1, the convergence and stagnant air rapidly accumulated local air pollutants, such as NO2 and PM2.5. As a result, the %AR of mortality for NO2 and PM2.5 rapidly increased. The combined %AR for the four pollutants rapidly increased from 7.2 at 17:00 p.m. to 15.8 at 21:00 p.m. on 17 December. Within these four hours, the %AR for PM2.5, NO2, O3, and SO2 changed by 5.9, 5.0, −2.4, and 0.1, respectively. These results indicate that the increase in the health risk at T1 was mainly caused by PM2.5 and NO2. Fractions of the %AR of mortality for the four air pollutants at the pollution peak T1 are illustrated in Figure 8a. The dominant pollutants that caused the health risks were NO2 and PM2.5, both of which contributed around 45% to the total short-term health risks. The three gaseous pollutants together contributed 55% to the total risk, a level higher than PM2.5.
At pollution peak T2, the advection process transported a large amount of secondary pollutants, such as particles and O3, from northern China and the YRD region into Fuzhou. As a result, the %AR of mortality for PM2.5 and O3 rapidly increased. The combined %AR for the four pollutants rapidly increased from 7.3 at 0:00 a.m. to 13.1 at 5:00 a.m. on December 18. Within these five hours, the %AR for PM2.5, NO2, O3, and SO2 changed by 6.4, −2.3, 1.8, and −0.1, respectively. These results indicate that the increase in health risk at T2 was mainly caused by PM2.5 and O3. Fractions of the %AR of mortality for the four air pollutants at the pollution peak T2 are illustrated in Figure 8b. The dominant pollutant that caused health risks was PM2.5, contributing 66% to total short-term mortality risk. After excluding the effects of PM2.5, the gaseous pollutants still significantly contributed to the total risk (e.g., O3: 17.2%, NO2: 14.9%, and SO2: 1.8%).
The causes of the two pollution peaks were different. The first pollution peak was mainly caused by the accumulation of local pollutants. NO2 is a typical local pollutant that is generated from combustion sources, such as traffic. Concentration levels of NO2 in urban areas, with a large amount of vehicles, are usually much higher than rural areas. As NO2 accumulated in the city, the combined health impacts of gaseous pollutants could overwhelm the impacts of particulate matter. The second pollution peak was caused by the transport of secondary pollutants. Particulate matter and O3 are common secondary pollutants that can be transported between cities. Because most cold fronts occur in the cold season, concentration levels of O3 are usually not that high. As a result, the health impacts of particulate matter are often dominant during such a pollutant transport episode in winter. The impacts of gaseous pollutants may increase if a large amount of O3 is produced and transported.
3.4. Uncertainty Analyses
To better understand the uncertainties of the estimations, we compared the fractions of the %AR for the four air pollutants at two pollution peaks (i.e., T1 and T2) using the three sets of β coefficients (i.e., from the global review and the AQHI systems of Canada and Hong Kong). The results are shown in Table 2. Although differences between the three sets of β coefficients exist, major results from the risk analyses using the β coefficients of the global review are consistent with those using the two AQHI systems. At the pollution peak T1, the dominant pollutants were still local pollutants, such as NO2 and PM2.5. At the pollution peak T2, the dominant pollutant was still PM2.5. The fraction of the risk of gaseous pollutants increased because the relative significance of the β coefficients for gases in these two AQHI systems was considerably higher than the global review.
4. Discussion
Assessments of the impacts of cold fronts in winter mainly use particulate matter as the proxy of air pollution. Although particulate matter is an important pollutant in the cold season, gaseous pollutants can still pose a significant level of short-term health risks on the population. Given the considerable health risk of gaseous pollutants, this study used the pollution-to-risk model from the AQHI systems of Canada and Hong Kong to systematically evaluate the impact of a cold front on the health risks of air pollution mixtures. In our risk analyses, the gaseous pollutants played a dominant role in increasing the short-term health risk. Our results indicate that the effects of gaseous pollutants should not be ignored in the assessment of pollution episodes in the winter.
A propagation of the pollution peak was detected in southeastern China during the cold frontal passage in December 2019. Pollution propagation is a common feature that is associated with cold fronts [11]. The strengthened airflows transport a large amount of pollutants from pollution source regions into downstream regions. Given the significant impacts of cold fronts on worsening air quality in downwind regions, this study targeted Fuzhou, a key downwind city in southeastern China and the WTS economic zone.
The impacts of synoptic patterns and meteorological conditions on the occurrence of pollution episodes are clear. Meteorological factors play significant roles in air pollution formation, transport, and dispersion [26,27]. Before the cold front arrived at Fuzhou, concentration levels of air pollutants exhibited significant diurnal cycles. For instance, O3 concentration reached its peak in the early afternoon because intense solar radiation enhanced photochemical reactions. In the frontal zone, convergence and stagnant atmosphere hindered the dispersion of air pollutants and thus rapidly accumulated local air pollutants near the ground. Behind the cold front, the steady northerly winds transported a significant amount of secondary pollutants from the surrounding polluted regions.
The effects of convergence and advection on the occurrence of air pollution episodes can be explained very well by the equation of continuity. After the local emission is assumed to be steady, the equation of continuity can be decomposed into two terms, representing the convergence and advection effects. The effect of convergence is caused by the change in wind velocity, while the effect of transport results from the concentration gradient. The convergence usually occurs in the frontal zone. The effect only lasts for a short period of time, which is likely to be within a few hours. As the frontal zone moves forward, the strengthened winds behind the cold front rapidly dilute air pollution. The duration of pollutant transport depends on the amount of pollutants in the upwind regions. Compared to the effect of convergence, the effect of advection can last for a much longer time. It is worth noting that the impacts of local emission change should be taken into account when there is a significant change in local emission (e.g., fire accident, biomass burning, or explosion).
Air pollutants pose a range of adverse health effects on humans. PM2.5, NO2, and O3 pollution issues are particularly severe in China, having considerably higher levels than in developed countries. Our risk analyses underscore the great health impacts of both particulate matter and gaseous pollutants. Given different characteristics of air pollutants (e.g., NO2 is a local pollutant, while O3 is largely affected by regional transport), an improved understanding of the dominant pollutants that cause health risks during pollution episodes will help provide sufficient air pollution warnings to the public in anticipation of extreme pollution events. These air pollution warnings are particularly important for individuals belonging to susceptible subgroups who will be able to take measures in advance and protect themselves from exposure to extreme air pollution.
β coefficients are key parameters in the identification of dominant air pollutants and the estimation of the combined health risk of air pollution mixtures. To minimize the uncertainty in the evaluations, three sets of β coefficients for all-cause mortality and cause-specific hospital admission from the global literature review and the official AQHI systems of Canada and Hong Kong were used in this study. Although differences between the three sets of β coefficients exist, the major results in the risk analyses using the β coefficients of the global review are consistent with those using the two AQHI systems. Results based on all three sets of β coefficients found that the dominant pollutants were NO2 and PM2.5 at the first pollution peak, while PM2.5 was the dominant pollutant at the second pollution peak in Fuzhou.
This study has some limitations. First, the pollution-to-risk model used in the AQHI systems of Canada and Hong Kong is an additive model based on the risks calculated for individual pollutants. Although the interactions between different air pollutants are not considered, this pollution-to-risk model is still extremely useful. In some recent studies, it was applied to evaluate variations in air quality and health burden [28] and examine the impact on the cardiovascular hospitalization of the elderly population in Hong Kong [29]. Second, this study was designed to evaluate the short-term health risks of air pollution exposure. It is worth noting that air pollution exposure is associated with a range of long-term health effects [30]. Therefore, future investigations are suggested to cover other health risks of air pollution.
5. Conclusions
Given the considerable short-term health risks of both particles and gaseous pollutants, this study used the pollution-to-risk model from the AQHI systems of Canada and Hong Kong to systematically evaluate the impacts of a cold front on the health risks of air pollution mixtures. The dominant pollutants that caused significant mortality risks during a cold frontal passage in December 2019 over Fuzhou, a downwind city in southeastern China, were examined. A highly polluted air mass propagated southwards from the YRD region to southeastern China. In particular, two pollution peaks were found in Fuzhou during the cold frontal passage. The potential impacts of advection and convergence were discussed. The short-term mortality risk caused by different air pollutants were then explicitly analysed. At the first pollution peak, the convergence in the frontal zone rapidly accumulated local air pollutants, such as NO2 and particles. Within four hours, the %AR for PM2.5, NO2, O3, and SO2 changed by 5.9, 5.0, −2.4, and 0.1, respectively. The dominant pollutants that caused the health risks were NO2 and PM2.5, both of which contributed around 45% to total short-term health risks. At the second peak, the advection process transported a significant amount of secondary pollutants (e.g., O3 and particles) from the upwind regions. Within five hours, the %AR for PM2.5, NO2, O3, and SO2 changed by 6.4, −2.3, 1.8, and −0.1, respectively. The dominant pollutant that caused health risk was PM2.5, contributing 66% to total short-term mortality risk. Our results underscore the importance of using a risk-based framework to assess the characteristics of pollution episodes. In addition, our risk analyses found that the health risks caused by gaseous pollutants during pollution episodes in winter can be comparable or even much higher than those caused by particles.
Author Contributions
Conceptualization, C.L.; methodology, C.L.; software, C.L.; validation, W.Z.; formal analysis, W.Z.; investigation, W.Z.; writing—original draft preparation, C.L.; writing—review and editing, W.Z. All authors have read and agreed to the published version of the manuscript.
Funding
This research received no external funding.
Institutional Review Board Statement
Not applicable.
Informed Consent Statement
Not applicable.
Data Availability Statement
Not applicable.
Acknowledgments
We thank the Institute for the Environment (IENV) and Environmental Central Facility (ENVF) of Hong Kong University of Science and Technology (HKUST) for providing atmospheric and environmental data.
Conflicts of Interest
The authors declare no conflict of interest.
References
- Lin, C.; Leung, K.K.M.; Yu, A.L.C.; Tsang, R.C.W.; Tsui, W.B.C.; Fung, J.C.H.; Ng, E.K.W.; Cheung, S.L.; Tang, A.W.Y.; Ning, Z.; et al. Effects of Synoptic Patterns on the Vertical Structure of Ozone in Hong Kong Using Lidar Measurement. Atmos. Environ. 2021, 257, 118490. [Google Scholar] [CrossRef]
- You, S.; Kang, Y.-H.; Kim, B.-U.; Kim, H.C.; Kim, S. The Role of a Distant Typhoon in Extending a High PM2.5 Episode over Northeast Asia. Atmos. Environ. 2021, 257, 118480. [Google Scholar] [CrossRef]
- Wu, X.; Xu, L.; Hong, Y.; Chen, J.; Qiu, Y.; Hu, B.; Hong, Z.; Zhang, Y.; Liu, T.; Chen, Y.; et al. The Air Pollution Governed by Subtropical High in a Coastal City in Southeast China: Formation Processes and Influencing Mechanisms. Sci. Total Environ. 2019, 692, 1135–1145. [Google Scholar] [CrossRef]
- Wang, J.; Qu, W.; Li, C.; Zhao, C.; Zhong, X. Spatial Distribution of Wintertime Air Pollution in Major Cities over Eastern China: Relationship with the Evolution of Trough, Ridge and Synoptic System over East Asia. Atmos. Res. 2018, 212, 186–201. [Google Scholar] [CrossRef]
- Hong, J.; Mao, F.; Chen, L.; Zhang, Y.; Gong, W. Rapid Extreme Particulate Pollution during Cold Frontal Passage over Central China. Atmos. Res. 2022, 280, 106453. [Google Scholar] [CrossRef]
- Hou, X.; Zhu, B.; Kumar, K.R.; de Leeuw, G.; Lu, W.; Huang, Q.; Zhu, X. Establishment of Conceptual Schemas of Surface Synoptic Meteorological Situations Affecting Fine Particulate Pollution Across Eastern China in the Winter. J. Geophys. Res. Atmos. 2020, 125, e2020JD033153. [Google Scholar] [CrossRef]
- Hu, Y.; Wang, S.; Ning, G.; Zhang, Y.; Wang, J.; Shang, Z. A Quantitative Assessment of the Air Pollution Purification Effect of a Super Strong Cold-Air Outbreak in January 2016 in China. Air Qual. Atmos. Health 2018, 11, 907–923. [Google Scholar] [CrossRef]
- Sulaymon, I.D.; Zhang, Y.; Hu, J.; Hopke, P.K.; Zhang, Y.; Zhao, B.; Xing, J.; Li, L.; Mei, X. Evaluation of Regional Transport of PM2.5 during Severe Atmospheric Pollution Episodes in the Western Yangtze River Delta, China. J. Environ. Manag. 2021, 293, 112827. [Google Scholar] [CrossRef]
- Zhang, W.; Li, W.; An, X.; Zhao, Y.; Sheng, L.; Hai, S.; Li, X.; Wang, F.; Zi, Z.; Chu, M. Numerical Study of the Amplification Effects of Cold-Front Passage on Air Pollution over the North China Plain. Sci. Total Environ. 2022, 833, 155231. [Google Scholar] [CrossRef]
- Hu, X.-M.; Hu, J.; Gao, L.; Cai, C.; Jiang, Y.; Xue, M.; Zhao, T.; Crowell, S.M.R. Multisensor and Multimodel Monitoring and Investigation of a Wintertime Air Pollution Event Ahead of a Cold Front Over Eastern China. J. Geophys. Res. Atmos. 2021, 126, e2020JD033538. [Google Scholar] [CrossRef]
- Kang, H.; Zhu, B.; Gao, J.; He, Y.; Wang, H.; Su, J.; Pan, C.; Zhu, T.; Yu, B. Potential Impacts of Cold Frontal Passage on Air Quality over the Yangtze River Delta, China. Atmos. Chem. Phys. 2019, 19, 3673–3685. [Google Scholar] [CrossRef] [Green Version]
- Marinov, E.; Petrova-Antonova, D.; Malinov, S. Time Series Forecasting of Air Quality: A Case Study of Sofia City. Atmosphere 2022, 13, 788. [Google Scholar] [CrossRef]
- Herrmann, M.; Gutheil, E. Simulation of the Air Quality in Southern California, USA in July and October of the Year 2018. Atmosphere 2022, 13, 548. [Google Scholar] [CrossRef]
- Orellano, P.; Reynoso, J.; Quaranta, N.; Bardach, A.; Ciapponi, A. Short-Term Exposure to Particulate Matter (PM10 and PM2.5), Nitrogen Dioxide (NO2), and Ozone (O3) and All-Cause and Cause-Specific Mortality: Systematic Review and Meta-Analysis. Environ. Int. 2020, 142, 105876. [Google Scholar] [CrossRef]
- Orellano, P.; Reynoso, J.; Quaranta, N. Short-Term Exposure to Sulphur Dioxide (SO2) and All-Cause and Respiratory Mortality: A Systematic Review and Meta-Analysis. Environ. Int. 2021, 150, 106434. [Google Scholar] [CrossRef]
- Wong, T.W.; Tam, W.W.S.; Yu, I.T.S.; Lau, A.K.H.; Pang, S.W.; Wong, A.H.S. Developing a Risk-Based Air Quality Health Index. Atmos. Environ. 2013, 76, 52–58. [Google Scholar] [CrossRef]
- Stieb, D.M.; Burnett, R.T.; Smith-Doiron, M.; Brion, O.; Shin, H.H.; Economou, V. A New Multipollutant, No-Threshold Air Quality Health Index Based on Short-Term Associations Observed in Daily Time-Series Analyses. J. Air Waste Manag. Assoc. 2008, 58, 435–450. [Google Scholar] [CrossRef] [PubMed] [Green Version]
- Yan, Y.; Wang, X.; Huang, Z.; Qu, K.; Shi, W.; Peng, Z.; Zeng, L.; Xie, S.; Zhang, Y. Impacts of Synoptic Circulation on Surface Ozone Pollution in a Coastal Eco-City in Southeastern China during 2014–2019. J. Environ. Sci. 2023, 127, 143–157. [Google Scholar] [CrossRef]
- Su, S.-H.; Chang, C.-W.; Chen, W.-T. The Temporal Evolution of PM2.5 Pollution Events in Taiwan: Clustering and the Association with Synoptic Weather. Atmosphere 2020, 11, 1265. [Google Scholar] [CrossRef]
- Wang, L.; Bi, J.; Meng, X.; Geng, G.; Huang, K.; Li, J.; Tang, L.; Liu, Y. Satellite-Based Assessment of the Long-Term Efficacy of PM2.5 Pollution Control Policies across the Taiwan Strait. Remote Sens. Environ. 2020, 251, 112067. [Google Scholar] [CrossRef]
- Lin, C.; Yang, K.; Chen, D.; Guyennon, N.; Balestrini, R.; Yang, X.; Acharya, S.; Ou, T.; Yao, T.; Tartari, G.; et al. Summer Afternoon Precipitation Associated with Wind Convergence near the Himalayan Glacier Fronts. Atmos. Res. 2021, 259, 105658. [Google Scholar] [CrossRef]
- West, T.K.; Steenburgh, W.J. Formation, Thermodynamic Structure, and Airflow of a Japan Sea Polar Airmass Convergence Zone. Mon. Weather Rev. 2022, 150, 157–174. [Google Scholar] [CrossRef]
- Zhu, W.; Xu, L.; Tang, L.; Xiang, X. Eco-Efficiency of the Western Taiwan Straits Economic Zone: An Evaluation Based on a Novel Eco-Efficiency Model and Empirical Analysis of Influencing Factors. J. Clean. Prod. 2019, 234, 638–652. [Google Scholar] [CrossRef]
- Zhang, M.; Shi, L.; Ma, X.; Zhao, Y.; Gao, L. Study on Comprehensive Assessment of Environmental Impact of Air Pollution. Sustainability 2021, 13, 476. [Google Scholar] [CrossRef]
- Zhang, X.; Fung, J.C.H.; Zhang, Y.; Lau, A.K.H.; Leung, K.K.M.; Huang, W. (Wayne) Assessing PM2.5 Emissions in 2020: The Impacts of Integrated Emission Control Policies in China. Environ. Pollut. 2020, 263, 114575. [Google Scholar] [CrossRef]
- Gao, X.; Ruan, Z.; Liu, J.; Chen, Q.; Yuan, Y. Analysis of Atmospheric Pollutants and Meteorological Factors on PM2.5 Concentration and Temporal Variations in Harbin. Atmosphere 2022, 13, 1426. [Google Scholar] [CrossRef]
- Li, Y.; An, X.; Wang, B.; Li, J.; Wang, C. Analysis of Synergistic Effects of Cold Source and East Asian Winter Wind on Air Pollution in Typical Regions of China in Winter. Atmosphere 2022, 13, 1162. [Google Scholar] [CrossRef]
- Tan, Y.; Han, S.; Chen, Y.; Wu, Z.; Lee, S. Long-Term Variation and Evaluation of Air Quality across Hong Kong. J. Environ. Sci. 2023, 127, 284–294. [Google Scholar] [CrossRef]
- Mason, T.G.; Mary Schooling, C.; Ran, J.; Chan, K.-P.; Tian, L. Does the AQHI Reduce Cardiovascular Hospitalization in Hong Kong’s Elderly Population? Environ. Int. 2020, 135, 105344. [Google Scholar] [CrossRef]
- Woo, K.-S.; Chan, S.-W.; Kwok, T.C.Y.; Yin, Y.-H.; Chook, P.; Lin, C.-Q.; Celermajer, D.S. The Different Impact of PM2.5 on Atherogenesis in Overseas vs. Native Chinese in the CATHAY Study. Atmosphere 2022, 13, 1236. [Google Scholar] [CrossRef]
Figure 1.
Red dot marks the location of Fuzhou in southeastern China. Green triangles mark the locations of three upwind cities: Shanghai, Ningbo, and Wenzhou.
Figure 1.
Red dot marks the location of Fuzhou in southeastern China. Green triangles mark the locations of three upwind cities: Shanghai, Ningbo, and Wenzhou.

Figure 2.
Panels (a,b) show the weather charts at 8:00 a.m. local standard time (LST) on 17 and 18 December 2019, respectively. Panels (c,d) show the spatial distributions of wind conditions (wind barbs) from ground weather stations over East Asia at 2:00 a.m. LST on 17 and 18 December 2019, respectively. Black straight lines represent the locations of the cold front.


Figure 3.
Time series of wind speed and direction at (a) Shanghai and (b) Fuzhou from 16 to 19 December 2019. Dotted lines mark the time when the cold front arrived at the cities.
Figure 3.
Time series of wind speed and direction at (a) Shanghai and (b) Fuzhou from 16 to 19 December 2019. Dotted lines mark the time when the cold front arrived at the cities.

Figure 4.
Time series of PM2.5 concentrations in (a) Shanghai, (b) Ningbo, (c) Wenzhou, and (d) Fuzhou from 16 to 19 December 2019.
Figure 4.
Time series of PM2.5 concentrations in (a) Shanghai, (b) Ningbo, (c) Wenzhou, and (d) Fuzhou from 16 to 19 December 2019.

Figure 5.
Spatial distributions of PM2.5 concentrations in China at 2:00 a.m. LST on 17 December (a) and 18 December 2019 (b), from the WRF-CMAQ model simulations.
Figure 5.
Spatial distributions of PM2.5 concentrations in China at 2:00 a.m. LST on 17 December (a) and 18 December 2019 (b), from the WRF-CMAQ model simulations.

Figure 6.
Time series of (a) wind and (b) PM2.5 concentration in Fuzhou from 17 to 18 December 2019. The two PM2.5 peaks at 21:00 p.m. LST on 17 December and 5:00 a.m. LST on 18 December are marked as T1 and T2, respectively.
Figure 6.
Time series of (a) wind and (b) PM2.5 concentration in Fuzhou from 17 to 18 December 2019. The two PM2.5 peaks at 21:00 p.m. LST on 17 December and 5:00 a.m. LST on 18 December are marked as T1 and T2, respectively.

Figure 7.
Time series of (a) %AR of mortality for the four pollutants and (b) their combined %AR in Fuzhou from 16 to 19 December 2019. Results were obtained using the β coefficients of the global review.
Figure 7.
Time series of (a) %AR of mortality for the four pollutants and (b) their combined %AR in Fuzhou from 16 to 19 December 2019. Results were obtained using the β coefficients of the global review.

Figure 8.
Fractions of the %AR of mortality for the four air pollutants at two pollution peaks: (a) T1 and (b) T2. Results were obtained using the β coefficients of the global review.
Figure 8.
Fractions of the %AR of mortality for the four air pollutants at two pollution peaks: (a) T1 and (b) T2. Results were obtained using the β coefficients of the global review.


Table 1.
β coefficients of PM2.5, NO2, O3, and SO2.
| Pollutants | Global Review [14,15] | AQHI of Canada [17] | AQHI of Hong Kong [16] |
|---|---|---|---|
| PM2.5 (per μg/m3) | 0.000648 | 0.000487 | 0.000218 |
| NO2 (per μg/m3) | 0.000717 | 0.000871 | 0.000446 |
| O3 (per μg/m3) | 0.000429 | 0.000537 | 0.000512 |
| SO2 (per μg/m3) | 0.000588 | - | 0.000139 |
Table 2.
A comparison of the fractions of the %AR for the four air pollutants at two pollution peaks (i.e., T1 and T2) using the three sets of β coefficients (i.e., from global review and the AQHI systems of Canada and Hong Kong).
Table 2.
A comparison of the fractions of the %AR for the four air pollutants at two pollution peaks (i.e., T1 and T2) using the three sets of β coefficients (i.e., from global review and the AQHI systems of Canada and Hong Kong).
| Pollutants | Global Review | AQHI in Canada | AQHI in Hong Kong | |||
|---|---|---|---|---|---|---|
| T1 | T2 | T1 | T2 | T1 | T2 | |
| PM2.5 (%) | 45.4 | 66.0 | 34.8 | 55.2 | 29.4 | 41.6 |
| NO2 (%) | 45.6 | 14.9 | 57.4 | 20.4 | 55.1 | 17.8 |
| O3 (%) | 6.0 | 17.2 | 7.7 | 24.3 | 14.1 | 39.7 |
| SO2 (%) | 3.0 | 1.8 | - | - | 1.4 | 0.8 |
| All gases (%) | 54.6 | 34 | 65.2 | 44.8 | 70.6 | 58.4 |
Publisher’s Note: MDPI stays neutral with regard to jurisdictional claims in published maps and institutional affiliations. |
© 2022 by the authors. Licensee MDPI, Basel, Switzerland. This article is an open access article distributed under the terms and conditions of the Creative Commons Attribution (CC BY) license (https://creativecommons.org/licenses/by/4.0/).
Share and Cite
MDPI and ACS Style
Lin, C.; Zhang, W. Using a Pollution-to-Risk Method to Evaluate the Impact of a Cold Front: A Case Study in a Downstream Region in Southeastern China. Atmosphere 2022, 13, 1944. https://doi.org/10.3390/atmos13121944
AMA Style
Lin C, Zhang W. Using a Pollution-to-Risk Method to Evaluate the Impact of a Cold Front: A Case Study in a Downstream Region in Southeastern China. Atmosphere. 2022; 13(12):1944. https://doi.org/10.3390/atmos13121944
Chicago/Turabian StyleLin, Changqing, and Wengwan Zhang. 2022. "Using a Pollution-to-Risk Method to Evaluate the Impact of a Cold Front: A Case Study in a Downstream Region in Southeastern China" Atmosphere 13, no. 12: 1944. https://doi.org/10.3390/atmos13121944
Note that from the first issue of 2016, this journal uses article numbers instead of page numbers. See further details here.