Article

Ultra-Fine Particle Emissions Characterization and Reduction Technologies in a NG Heavy Duty Engine

1
National Research Council—Institute of Sciences and Technologies for Sustainable Energy and Mobility (CNR-STEMS), 80125 Naples, Italy
2
Department of Engineering, University of Naples “Parthenope”, 80133 Napoli, Italy
3
FPT Industrial S.p.A., 10156 Torino, Italy
*
Author to whom correspondence should be addressed.
Atmosphere 2022, 13(11), 1919; https://doi.org/10.3390/atmos13111919
Submission received: 21 October 2022 / Revised: 10 November 2022 / Accepted: 14 November 2022 / Published: 18 November 2022
(This article belongs to the Special Issue Vehicle Emissions: New Challenges and Potential Solutions)

Abstract

:
This paper describes some strategies to deal with the arduous challenge of reducing emissions from the transport sector. Two different approaches in particle emissions reduction from natural gas (NG) heavy duty (HD) engines were evaluated. The focus was on reducing the ultra-fine sub 23 nm particles, a key aspect in the vehicles’ impact on human health and environment. To this end, an experimental research activity was carried out on a NG HD engine that was EURO VI regulation compliant. Lubricant oils characterized by different base compositions and ash contents were compared to provide a preferred path to develop formulations. The performed activity on world harmonized transient cycles (WHTCs) have demonstrated a high reduction potential (≈70%) that is reachable by acting on the lube formulation. A CNG particle filter (CPF), derived from the diesel and gasoline engines technology, was fully characterized in terms of its filtration efficiency. Three different types of tests were carried out: steady state, WHTCs, and several idle-to-load step maneuvers. The CPF was highly efficient in reducing solid particles over 10 nm diameter in all the different tests. During WHTCs, the mean abatement efficiency was about 85%. Both technologies provide interesting insights to make NG HD engines compliant with the upcoming Euro VII regulation.

1. Introduction

The European Union is facing a huge challenge, with the aim of reducing the impact of the transport sector on greenhouse gas emissions (GHG) in the coming years. The passenger sector is moving toward electrification since it is a very promising technology for reducing its environmental impact [1]. However, battery electric vehicles (BEVs) have some issues that have to be dealt with such as low availability of recharge stations, long recharging times, and limited range in comparison to the vehicles equipped with an internal combustion engine (ICE) [2]. These problems pose a limit for the diffusion of the electric powertrain technology in the heavy duty (HD) sector, considering the long distance usually covered by HD vehicles [3]. Some recent research activities are focusing on the characterizing of hydrogen (as a primary fuel [4,5], in dual fuel [6,7] or fuel cell systems [8]) to reach a sound understanding of the advantages and disadvantages of what might be a long-term solution to strongly reduce GHG emissions.
In the short-term framework, natural gas (NG) is an interesting alternative to diesel, with the intent of mitigating the carbon footprint of the freight transport and the off-road vehicles sectors: NG is widespread and can be derived from bio sources (bio-methane) while its combustion leads to low soot emissions compared to traditional fuels [9] and a low carbon content yields low CO2 production. As Lee et al. demonstrated on their activity in the natural gas/diesel dual-fuel combustion mode, the increase in natural gas percentage in the fuel mixture led to a decrease in the soot volume fraction [10]. Typically, HD traditional engines are compression ignition (CI) ones that are not suitable for NG; spark ignition (SI) engines are needed, which allow for the use of a three-way catalyst (TWC), optimizing the reduction of NOx, CO, and THC at the tailpipe [11,12].
The actual EURO VI regulation imposes strict limits (see Table 1) on the main pollutants, namely CO, NOx, HC (split in methane and non-methane hydrocarbons) and PM as well as on the number of solid particles with an equivalent diameter of more than 23 nm.
The HD vehicles will have to face a difficult challenge: the new EURO VII regulation.
The Euro VII, expected to become effective in 2025, will reduce the amount of pollutants and PN allowed at the tailpipe, extending the control of the solid particles to the over-10 nm ones, since the penetration potential of smaller particles into human lungs is higher [13,14]. The new limits will pose a challenge to HD NG engines, given the quantity of PN produced by these engines [15] and in this sense, the understanding of the phenomena behind the particle production and the study of PN after-treatment reduction systems will help reduce the pollution produced by NG engines.
The interest in solid particle control through the usage of alternative fuels is wide, even in the aviation sector. Zhang et al. provided a review on the positive effects of alternative fuels on non-volatile particulate matter, which underlined the capability of alternative/conventional fuel blends to reduce the particle number, mass, and size [16].
In this scenario, the experimental research activity presented in this article has been devoted to deeply take into account the contribution of the solid particle emission in the diameter range of 10–23 nm, even if the current regulation does not prescribe it.
Many studies have proven that the particle emissions from a NG engine is mainly due to lubricant oil consumption [17,18,19]. In particular, the oil combustion leads to the production of particles, therefore the more oil enters the combustion chamber, the more particles are produced [20]. The main phenomenon that causes the oil combustion is addressed as reverse blow-by: gas containing oil is pushed into the combustion chamber during idle phases when the pressure in the combustion chamber during the intake stroke is lower than the pressure in the crankcase, so that oil can pass through the gaps in the piston rings [21,22]. In a previous research activity, Guido et al. proved that an improvement in the ring design, acting on the reverse blow-by, led to a very important decrease in the PN production, thus confirming the importance of oil consumption in controlling the PN emission [22].
The lubricant oil characteristics play an important role in the consumption mechanisms and, thus, on the particles and their morphology [20,23,24]. A lubricant oil is made by a hydrocarbon base (which ranges between C5 and C200) whose properties change according to the composition and the production process. To improve the performance of the oils, additives such as viscosity modifiers, pour points depressants, etc., are added to the base formulation. The primary oil properties are the kinematic viscosity, defined by the SAE Viscosity Grade, which increases as the viscosity grows, the volatility, density, and ash content. NG engines usually employ SAE multi-grade oils (e.g., 10W – 40W) that optimize the viscosity characteristics to improve flow at low temperatures and its behavior at high temperatures [25].
Many studies have focused on the influence of oil viscosity on particle emissions for diesel engines. [19] proved the positive effect of low viscosity lubricants (LVLs) on fuel consumption and CO2 emissions by decreasing the dissipated energy through frictions; moreover, the authors asserted that, usually, LVLs are synthetic and are of higher quality than conventional oils. This means that fewer solid particles are reasonably expected, thanks also to the oil’s lower sulfur content [19]. Synthetic oils contain a great concentration of high molecular weight aliphatic compounds, characterized by carbon numbers C24–C29, and cycloalkanes, while conventional oils are characterized by low molecular weight compounds and branched alkanes [26]. Nevertheless, some researchers have highlighted higher oil consumption from diesel engines using LVLs [27,28].
Regarding the ash content, this refers to the lube oil inorganic incombustible part. Since NG is a dry fuel and it does not contribute to the valves’ lubrication (which might be affected by ash deposits, inducing valve burning, knock and reduced heat transfer), the lubricant oil needs to have a low ash content; lower than the oils utilized in diesel and gasoline engines [29].
Some studies have proven that higher ash content and higher volatility provoke higher PN emissions [30,31]. Moreover, the ash content seems to influence the after-treatment systems on diesel engines by affecting the oxidation of particles [32]. Various papers have analyzed the consequences of different oil compositions on tribological properties and on PN emissions [33,34,35].
The first part of this paper is focused on the experimental characterization of engine performance using three lubricant oils, with different base compositions and ash content, to widen the knowledge on the proper formulation of lube oils suitable for NG engines, and designed to minimize fuel consumption and particle emissions. The different compositions were compared to find a preferential route for the development of an oil formula that would reduce the PN emissions in the over-10 nm spectrum to properly face the future EURO VII regulation.
The second part of the work focused on the experimental characterization of an after-treatment system to directly abate the PN emitted by NG engines.
In both diesel and gasoline engines, PN abatement systems have been studied and developed in recent years. Diesel particulate filter (DPF) technology has been implemented on on-road and off-road application [36,37]. The DPFs can reach efficiencies up to 95–99% [38]. The filtration principle is based on the trapping of particles that pass through parallel channels delimited by porous walls [37]. The continuous particles flow through the DPF, causing their accumulation on the wall surface and producing the so-called “soot cake”. As the soot cake enlarges its thickness, the filtration efficiency grows until it reaches its maximum, after which the layer growth leads to higher back pressure and fuel consumption [16,39], which is the reason why it is necessary to periodically regenerate the filter. The regeneration consists in the oxidation of soot into CO2 [38]. This process leads to a considerable increase in particles and NOx emissions in a very short period of time [40]; up to 1000 times higher than normal driving conditions, with no negligible peaks of particulate emission [41,42].
The actual impact of regeneration on the total particle number was estimated by the authors in a previous paper: the total particle number, weighted on the covered distance between two subsequent regeneration events, was generally below the PN Euro 6 emission limit and far from the typical values of conventional diesel vehicles without DPF [43].
In the last years, gasoline direct injection engines (GDI) have become common in passenger car applications, thanks to their interesting results in terms of gaseous emissions, fuel consumption, and performance [44,45]. The main difference between GDIs and PFIs concerns the fuel–air mixture preparation before the combustion process. In PFI engines, the fuel is injected upstream of the intake valve or manifold, ensuring the optimal mixing of the air-fuel charge. In GDI engines, the fuel is injected directly into the combustion chamber, allowing for improved combustion phasing and the possibility of operating at higher compression ratios, in order to reduce fuel consumption. However, GDI engines have some drawbacks compared to PFI engines. They are related to the short mixture preparation time before ignition, which can result in wall wetting and a local fuel-rich charge that does not lead to complete combustion. This phenomenon results in a large increased number of small-diameter particles, which have a low impact in terms of mass [46,47,48]. Even if it is known that TWCs affect the particle emissions [49], the adoption of gasoline particle filters (GPFs) are needed as they represent one of the most effective technologies in controlling the particle emissions [50]. GPF works in different conditions from the DPF while, from a morphological point of view, the filtration system is the same. However, since the PM produced by a GDI engine is much lower than the PM produced by a diesel engine, a soot layer will not be formed, and the filter has to abate in a “deep bed” continuous regime, which can negatively impact the overall efficiency. The particles morphology in GDI engines is slightly different from those in diesel engines; and they are more sensitive to different backpressures, forcing the regeneration processes [51,52]. The GDFs’ filter microstructure is the object of further studies and optimizations. The particles’ abatement efficiency of this system is very variable, and it can go from 40% to 95% [53].
In this scenario, filtration systems for NG engines can represent a valid option for the abatement of sub-23 nm particles. As specified above, the second part of this work aimed at the experimental characterization at an engine test bench of a prototypal CNG particle filter (CPF), derived from GPF/DPF, to explore its capabilities in cutting down the PN emissions and provide a technology path to support the diffusion of NG HD vehicles. At present, the literature does not provide sufficient insights on the filtration technology applied to these propulsion systems. Furthermore, the results obtained might be also interesting in light of the strong potential in hydrogen diffusion as a future alternative fuel for ICEs, either mixed with methane or pure.

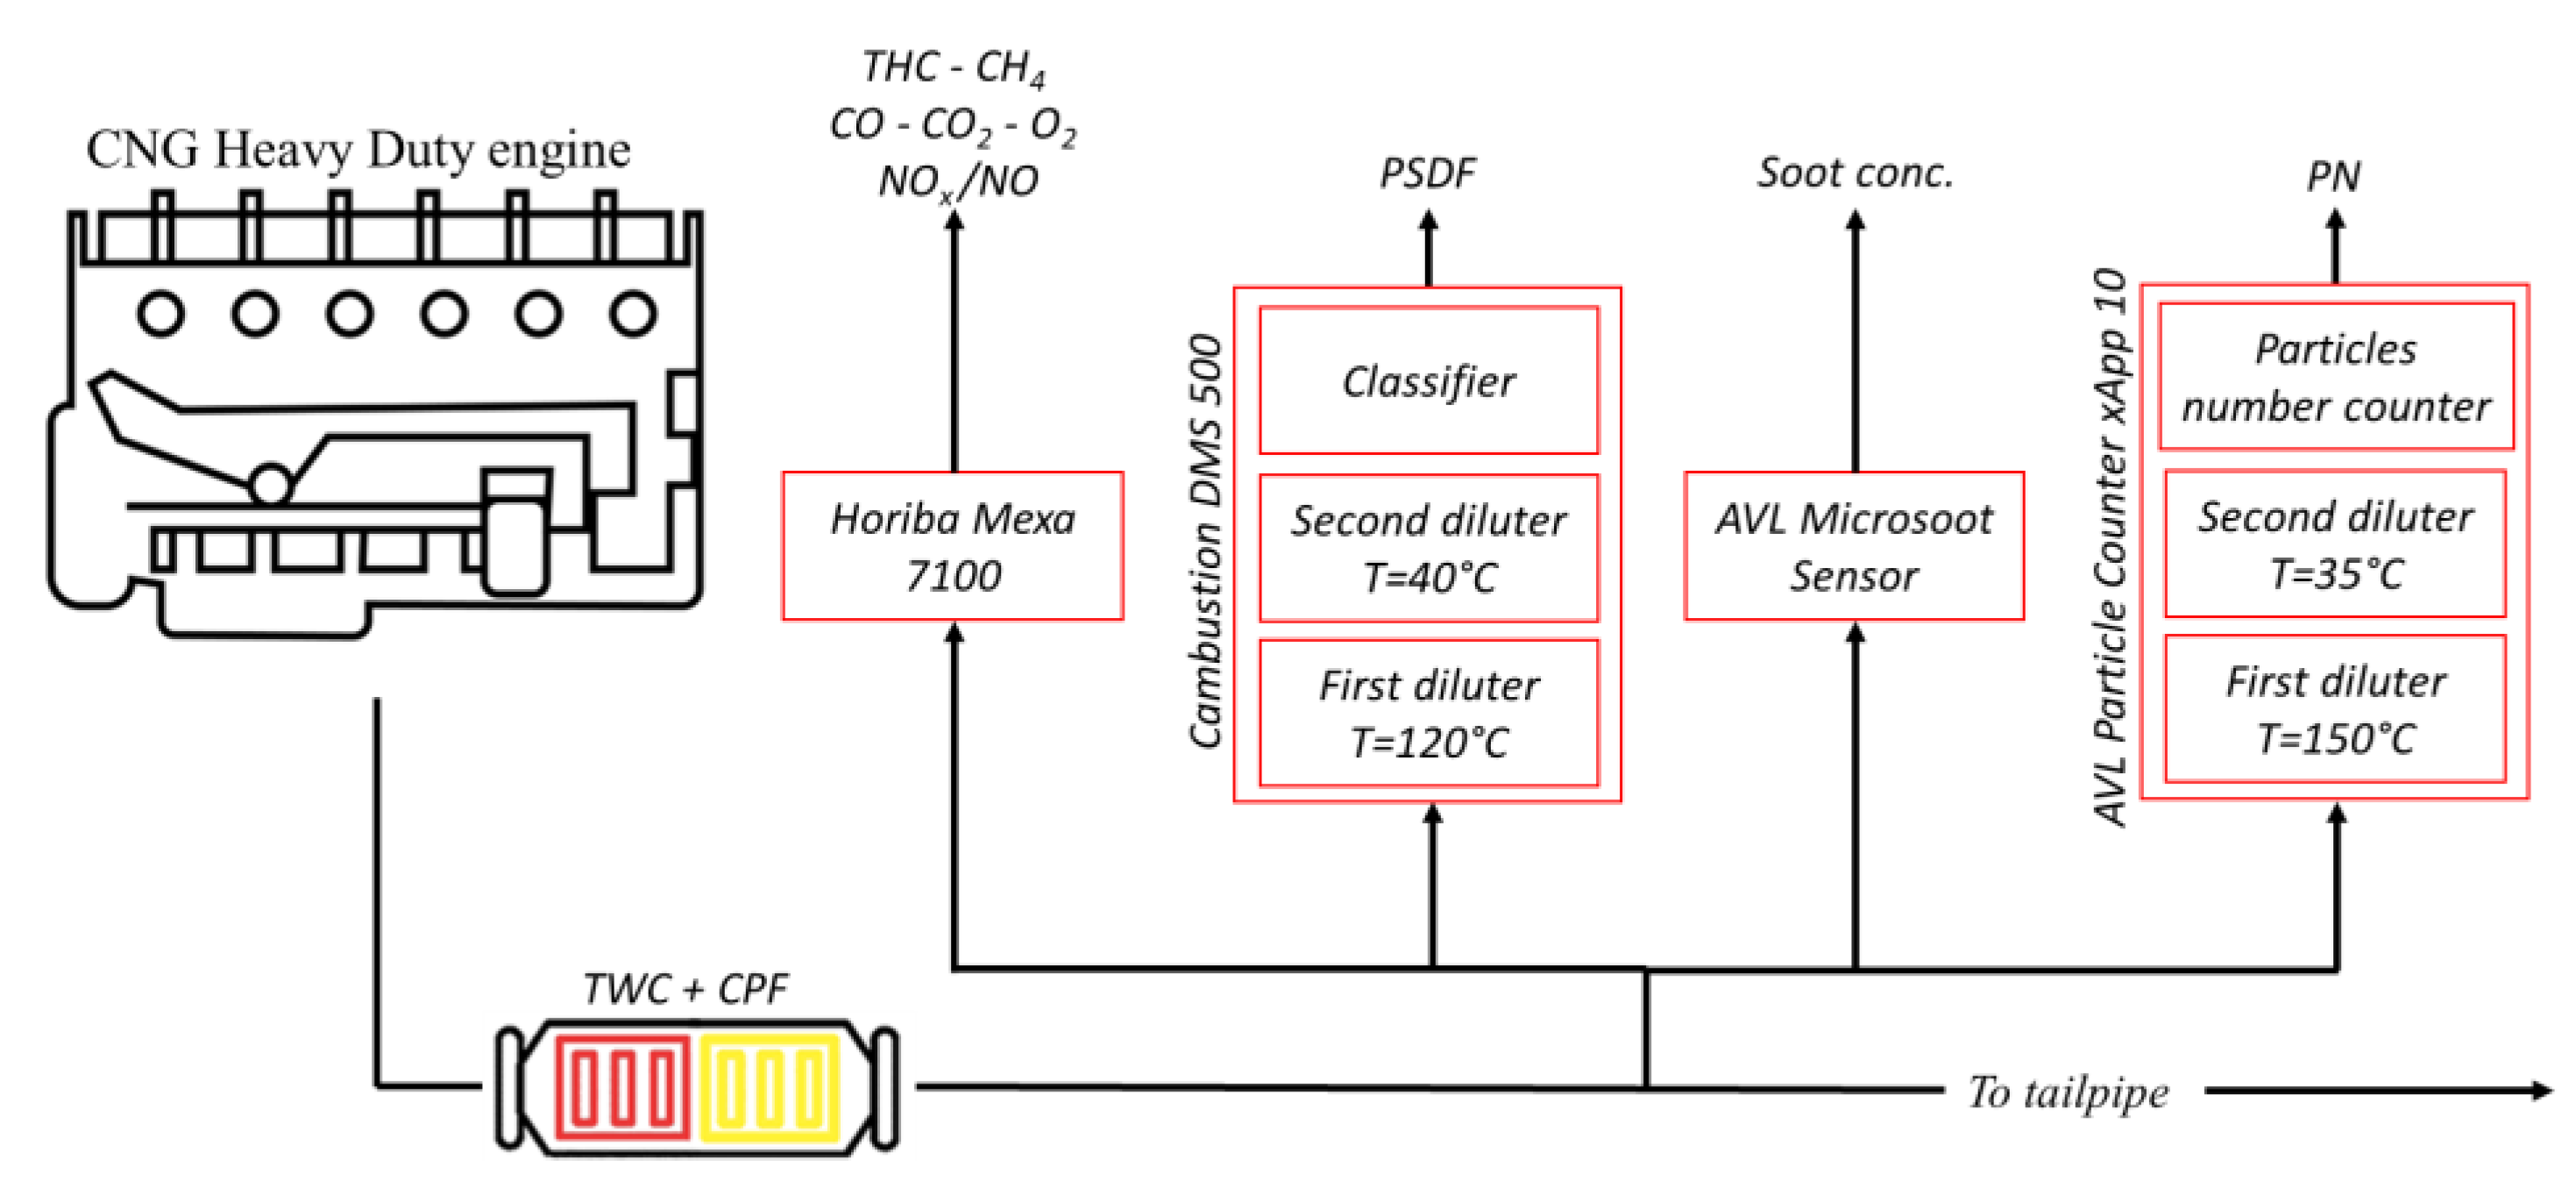
2. Materials and Methods

The experimental campaign was carried out on a NG HD SI PFI engine, compliant with the EURO VI regulation. Table 2 presents the characteristics.
The piston has a cylindrical bowl and is equipped with two compression rings and one oil ring. The engine is coupled with an AVL dynamometer (AVL Dynodur) capable of both dynamic and steady state tests. The fuel is CNG made of 99.5% methane. The engine exhaust line was arranged with a modular after treatment system (ATS) canning that easily allowed for the change in the components in the configuration. To carry out the characterization of the oils, a TWC was the only element installed in the ATS; while for the second experimental campaign, a CPF was set out downstream of the TWC (in this case, ATS = TWC + CPF). The experimental setup is shown in Figure 1.
Four different lines of sampling were set. The first one heads to the Horiba Mexa 7100 exhaust gas analysis system for the characterization of gaseous emissions (NOx, CO, CO2, THC, CH4, O2). The second line goes to the Cambustion Differential Mobility Spectrometer 500 (DMS 500), which provides the particle size distribution function (PSDF), linking the amount of solid plus volatile particles to their equivalent diameter. It can distinguish between the nucleation mode particles and the accumulation ones by their sizes, respectively, from about 5 nm to 50 nm and from 50 nm to 1000 nm. Nucleation particles are freshly formed solid particles while the accumulation ones are derived from the agglomeration of smaller particles together with each other. The instrument’s sensitivity referring to the particle sizes are shown in Table 3.
The third sample line feeds the AVL Microsoot sensor (MSS), a transient high sensitivity photo-acoustic sensor that provides the soot mass concentration.
The fourth sample line goes to the brand new AVL Advanced Particle Counter (APC), an n-butanol based condensation particle counter (CPC) that adopts the measurement principle prescribed by the EURO VI homologation procedure. The exhaust gases are diluted and sent through an evaporation tube (at 350 °C), which leads to the vaporization of the volatile particles; only the solid particles are analyzed by the instrument (after a second dilution). Furthermore, a catalytic stripper is present in the evaporation tube to ensure the complete removal of the volatile compound and ensure the high reproducibility of the measures; also the APC used in the test campaign was optimized to have a reliable measure of over 10 nm particles and the measuring range went from 0 to 50,000 particles/cm3; these last three features were compatible with the actual tentative prescription for PN measuring devices according to further EURO VII regulation. Both dilution factors can be set separately. In Table 4, the APC technical characteristics are reported.

3. Results

3.1. Experimental Tests Campaign—Oil Characterization

The tests were performed in transient conditions while monitoring the engine thanks to online diagnostics. The homologation test cycle, world harmonized transient cycle (WHTC), whose speed and torque profiles are shown in Figure 2, was selected for the characterization campaign.
Following the homologation procedure, cold and hot starting conditions were both tested, with a soak period of ten minutes.
The testing conditions were monitored by controlling the air temperature and humidity, fuel temperature, and pressure. The laboratory atmospheric factor fa range (0.93 ≤ fa ≤ 1.07) has been respected, as prescribed by the regulation [54].
In accordance with the manufacturer of the oils, two oils were tested and compared with a commercial oil (Reference, SAE 10W – 40W). The experimental campaign was carried out as per the highlights in Table 5. First, the Reference was thoroughly characterized by three days of tests (one cold and five hot cycles on each day). The candidate oils were tested for two days, performing one cold and five hot cycles during the first day, one cold and three hot cycles on the second day. After completing the tests for each oil, the oil sump was drained and the oil filter replaced.
Both continuous traces and average values were recorded in terms of power, fuel consumption, and emissions (both gaseous and solid). The test results were divided among cold, hot, and “combined” (the weighted results between the cold and hot tests, with weight factors, respectively, of 14% and 86%). Particular attention will be pointed toward the effect of different oils on the solid particle emissions.
As previously introduced, the oil characterization was aimed at the comprehension of the impact of different base oil compositions and ash content on the particle emissions. The oil matrix was developed in this direction, as shown in Table 6.
Due to confidentiality agreements, the table only reports some of the details on the tested oils; the different base formulations were appointed as “A” and “B”, while the ash content was dimensionless.
The “Reference” oil (Ref) is a commercial lubricant oil, available on the market. Oil 1 had the same viscosity and base oil as the Ref at half ash content. Oil 2 had same viscosity and ash content of the Ref, but was made with a different base composition.
The combined test results, in terms of PN and Soot, are shown in Figure 3, as mean values over all of the WHTC repetitions, weighting the WHTC-Cold and WHTC-Hot data as described above. The dimensionless values were calculated with respect to the Ref mean value and reported with their own uncertainty bar, calculated from the standard deviations.
There was an important gap between the reference oil and the two alternative formulations for both PN and Soot. Oil 2 showed the best performance with PN and Soot reductions of about 70% and 80%, respectively. Oil 1 did show a remarkable gain, reducing both PN and Soot of about 35%, but its reduction potential was lower than the other candidate. Even when the standard deviations were considered, there was no overlap, underlining the gap between the two candidates.
The emission reductions recorded separately during the cold and hot tests are displayed in Table 7.
The Oil 2 high reduction performance is highlighted for both engine conditions, providing similar behavior independently from the engine starting thermal status. Soot reduction was slightly higher than that of PN. The Oil 1 PN reduction was higher than Soot in cold conditions while a similar behavior was noticed during hot tests. The highlighted differences reported in Figure 4 did not change when running in cold or hot conditions.
The results show that the candidates can highly reduce the particles emitted in the over-10 nm spectrum. Nevertheless, there are important differences among the formulation effects. Halving the ash content provided remarkable PN and Soot reductions, in accordance with the study by Premnath et al., who showed a PN increase for oils at a higher ash content on a gasoline fueled vehicle [32]. However, acting on the base oil is more promising than modifying the oil additive content to reduce the particle emissions at constant viscosity, integrating the positive impact of LVLs recorded by Fontaras et al [19].
While the APC provides a reduction in the particles with a diameter larger than 10 nm, through the DMS 500, it was possible to deepen the characterization by separately analyzing the candidates’ reduction potentiality in the nucleation and agglomeration mode. In Figure 4, a comparison among the dimensionless particle size distribution functions (PSDFs), calculated over the whole WHTC cycles, is shown. Each curve in Figure 4 shows the mean PSDF recorded along the oil characterization campaign. The curves were normalized with respect to the Ref peak value.
The PSDF is a bi-modal shape curve, with the nucleation and accumulation mode peaks placed at about 23 nm and 100 nm, meaning that most of the nucleation mode particles showed a 23 nm equivalent diameter while most of the accumulation mode particles had a 100 nm equivalent diameter.
As underlined in Figure 4, Oil 2 homogeneously reduced the PN for both modes, while Oil 1 showed better results for the nucleation mode particles. Once more, Oil 2 confirmed the potential of modifying the base formulation in comparison with acting on additives; it emitted less particles for both modes.

3.2. Experimental Tests Campaign—CPF Steady State

The CPF was first characterized in stationary engine operating conditions (fixed speed and load), representing a more stable and controlled scenario. The PN was collected by the APC at the tailpipe with the CPF installed downstream of the TWC and compared to upstream emissions to calculate the abatement efficiency. Seven steady state points were considered and repeated several times each. Table 8 shows the chosen operating points and the recorded abatement efficiencies.
The test operating points, as low speed and low load conditions inside the engine working map, were selected as characterized by reliable and repeatable PN measurements. In each test point, the engine and exhaust line were carefully thermally stabilized before starting the particle sampling (lasting about 5 min). The gaseous emissions were also collected for an overall characterization of the exhaust emissions and to check the engine test-to-test repeatability.
Results revealed that the abatement efficiencies were very high, with a mean value over the engine points of about 97%, showing the potential of CPF technology in also controlling the PN emissions at the very low concentration level of NG HD engines.

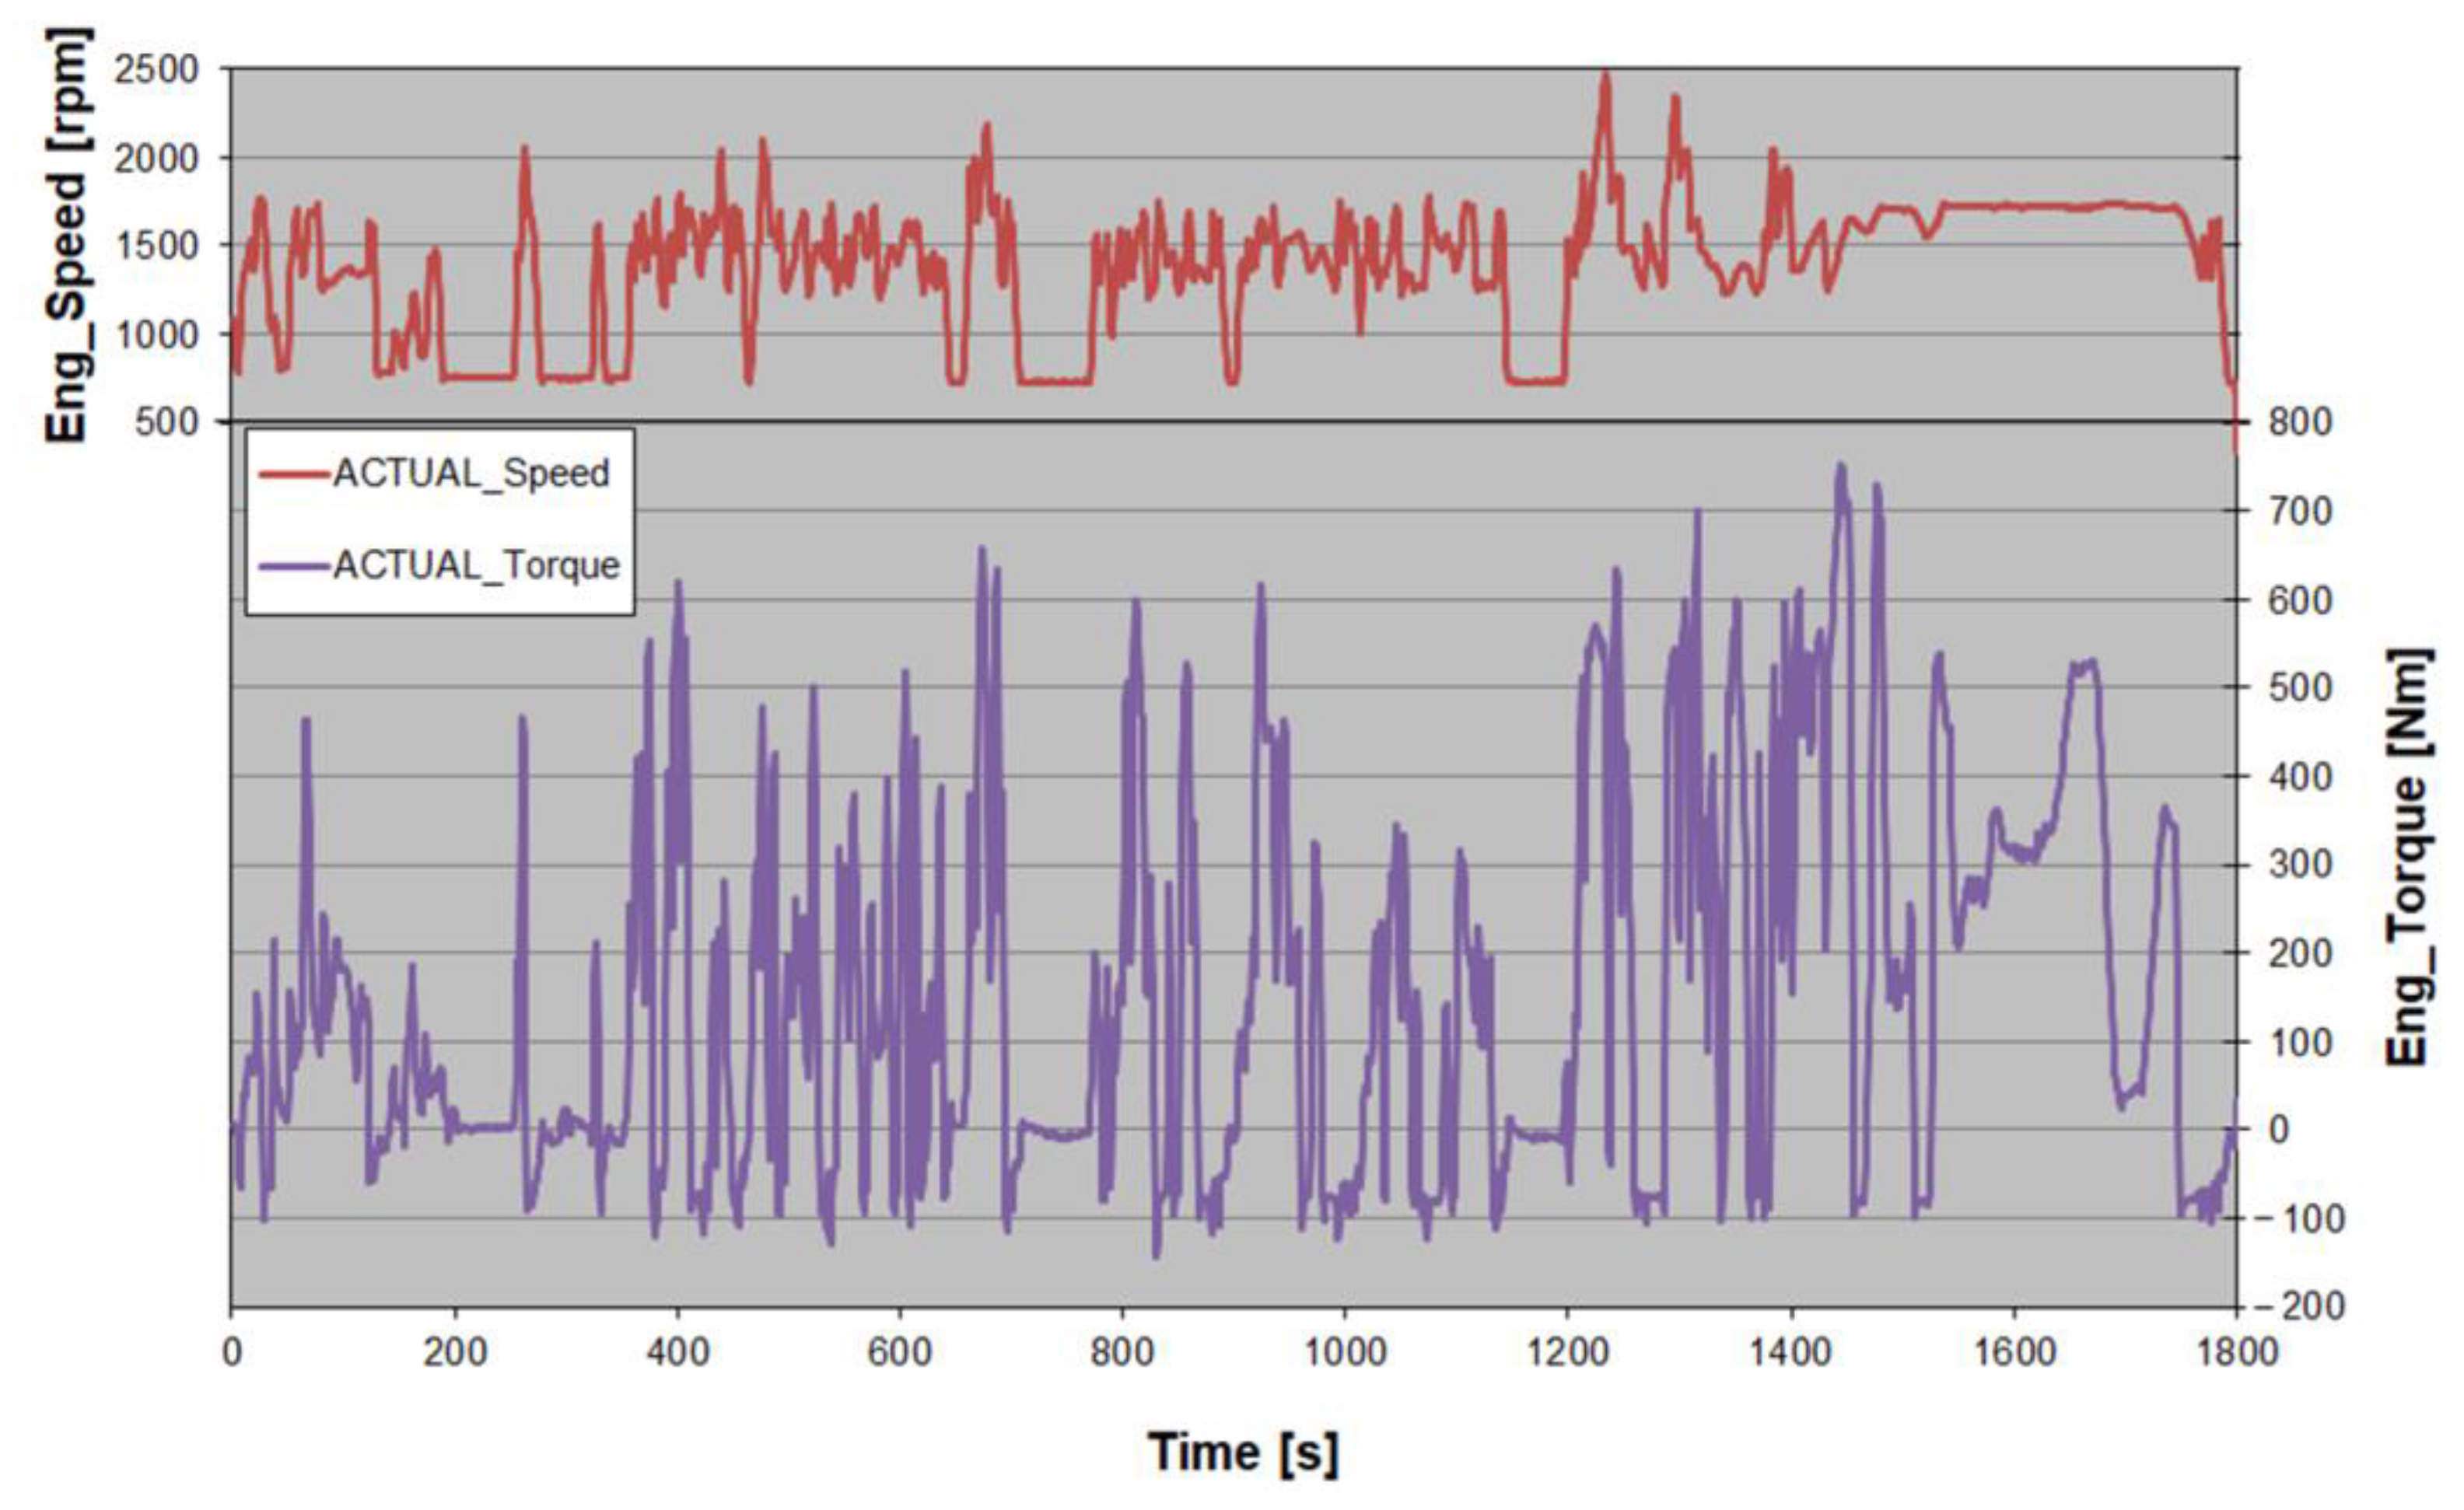
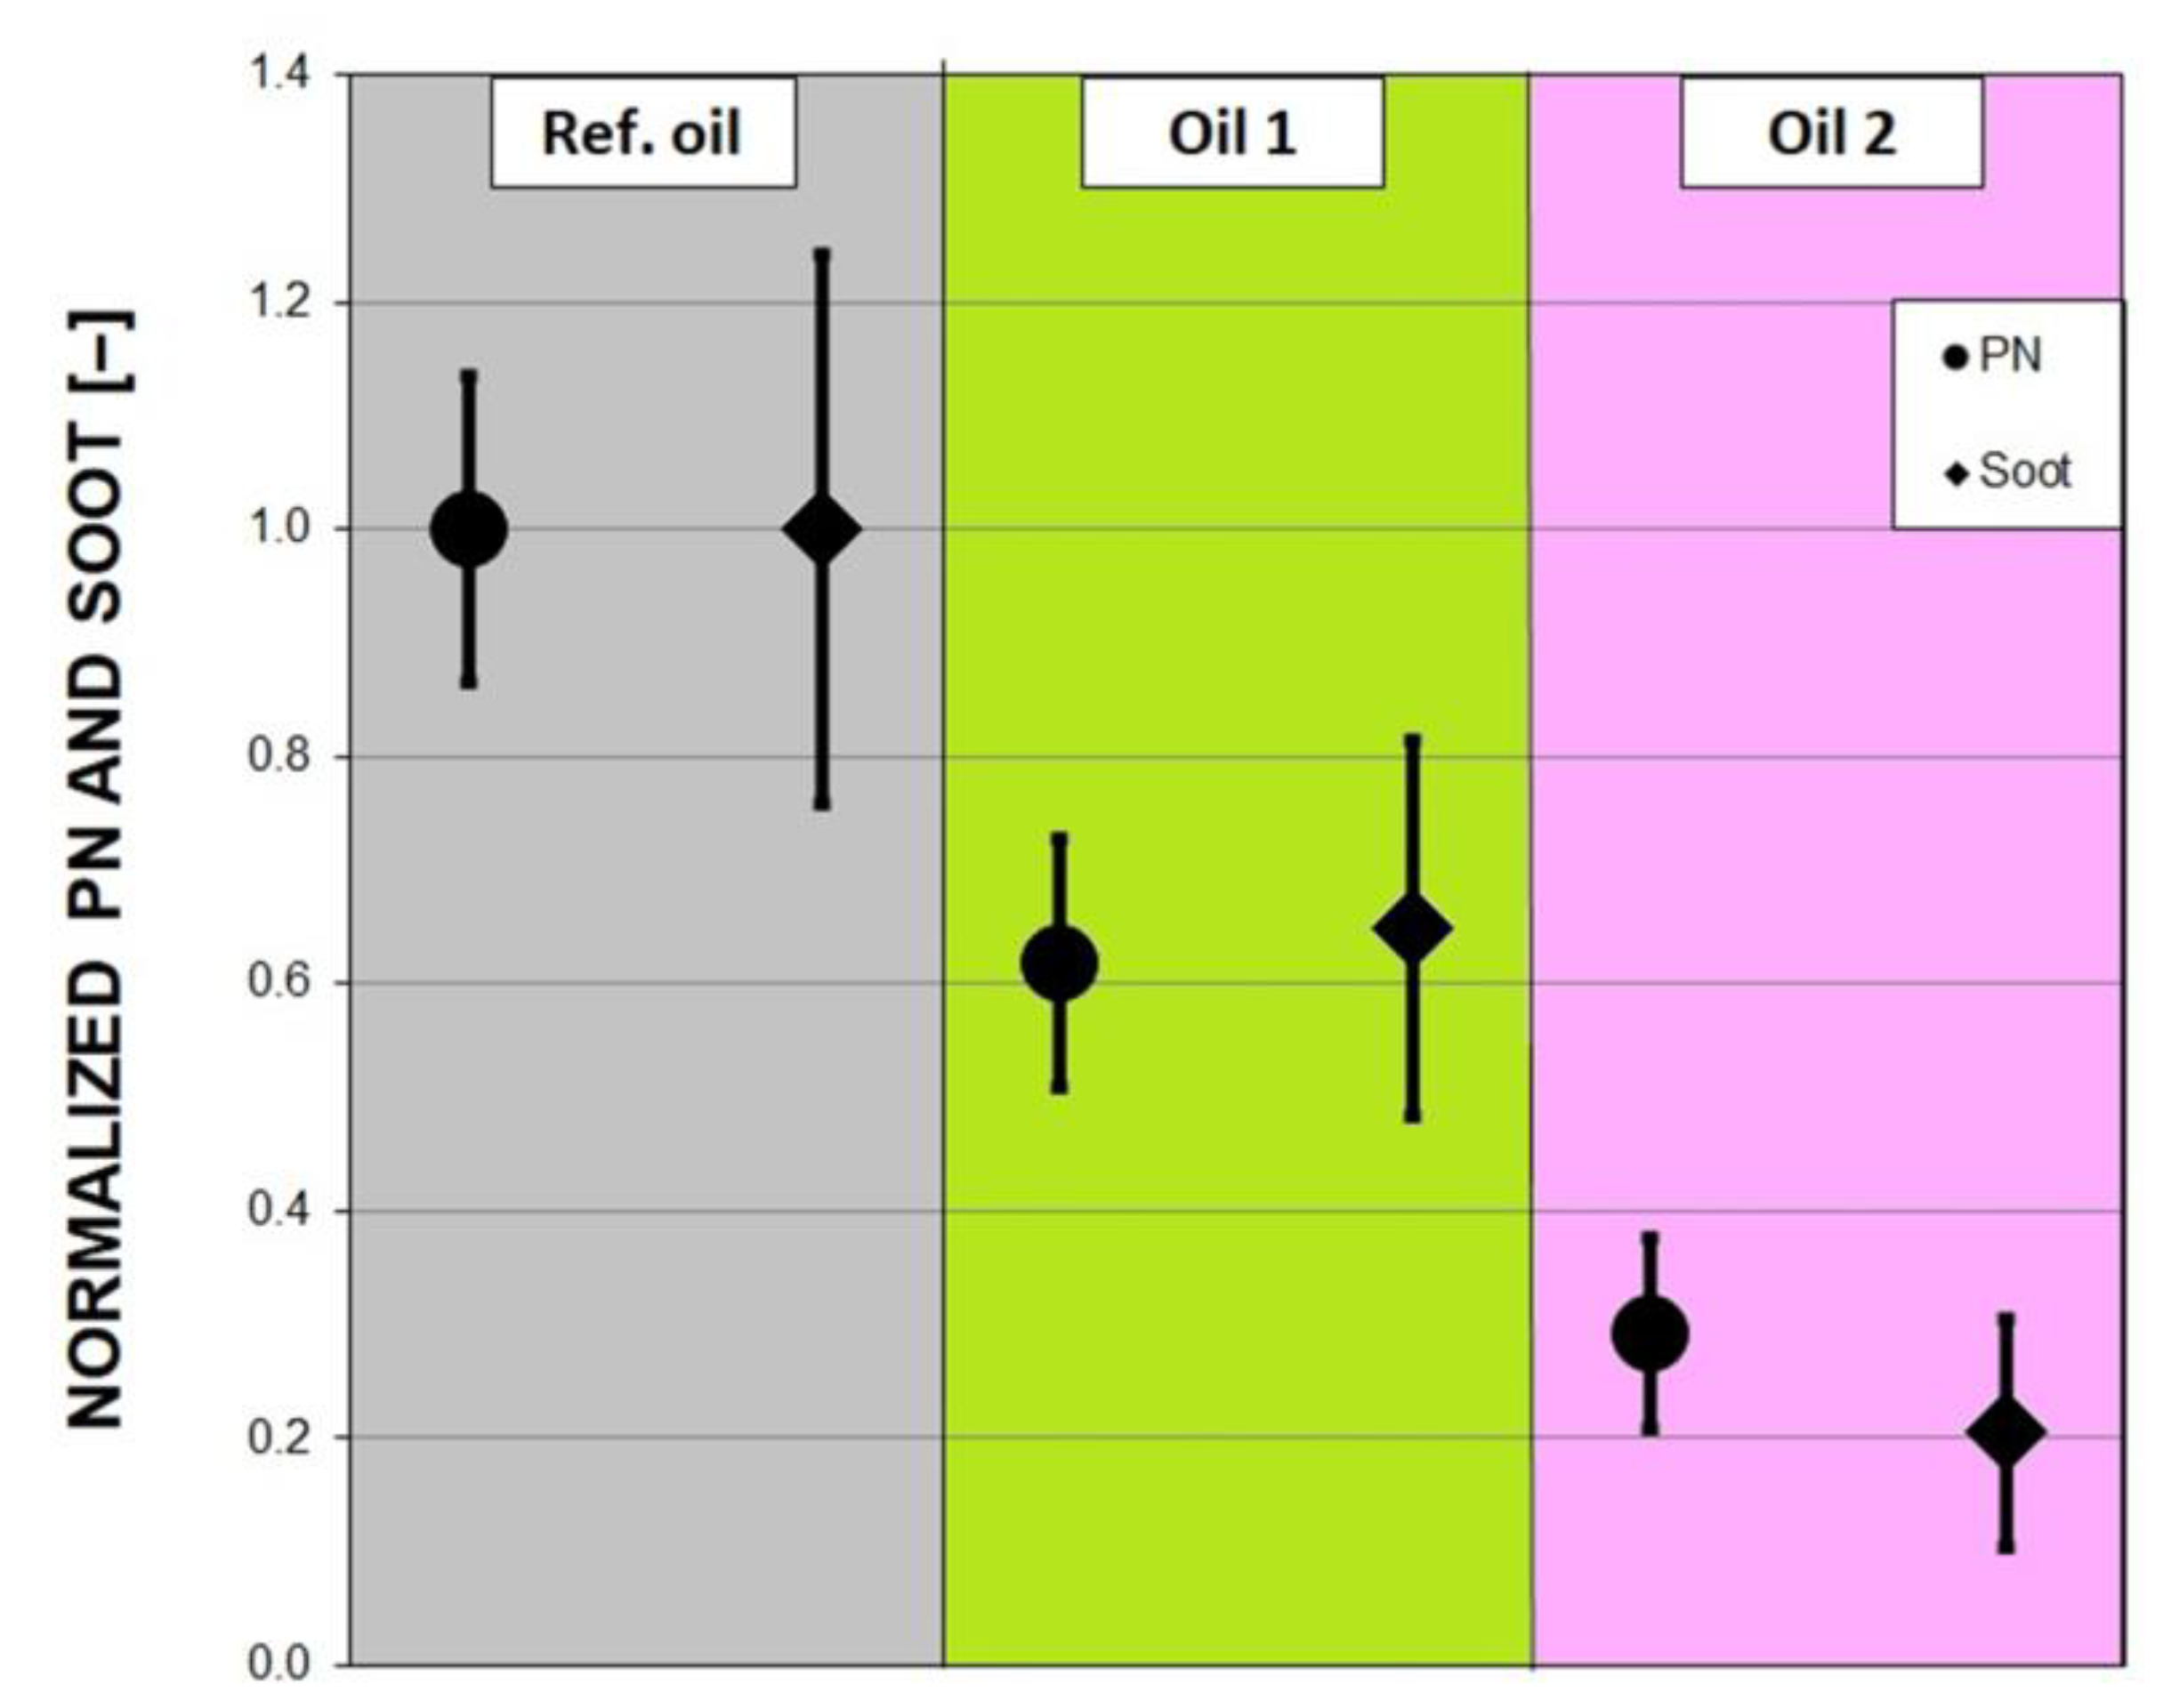
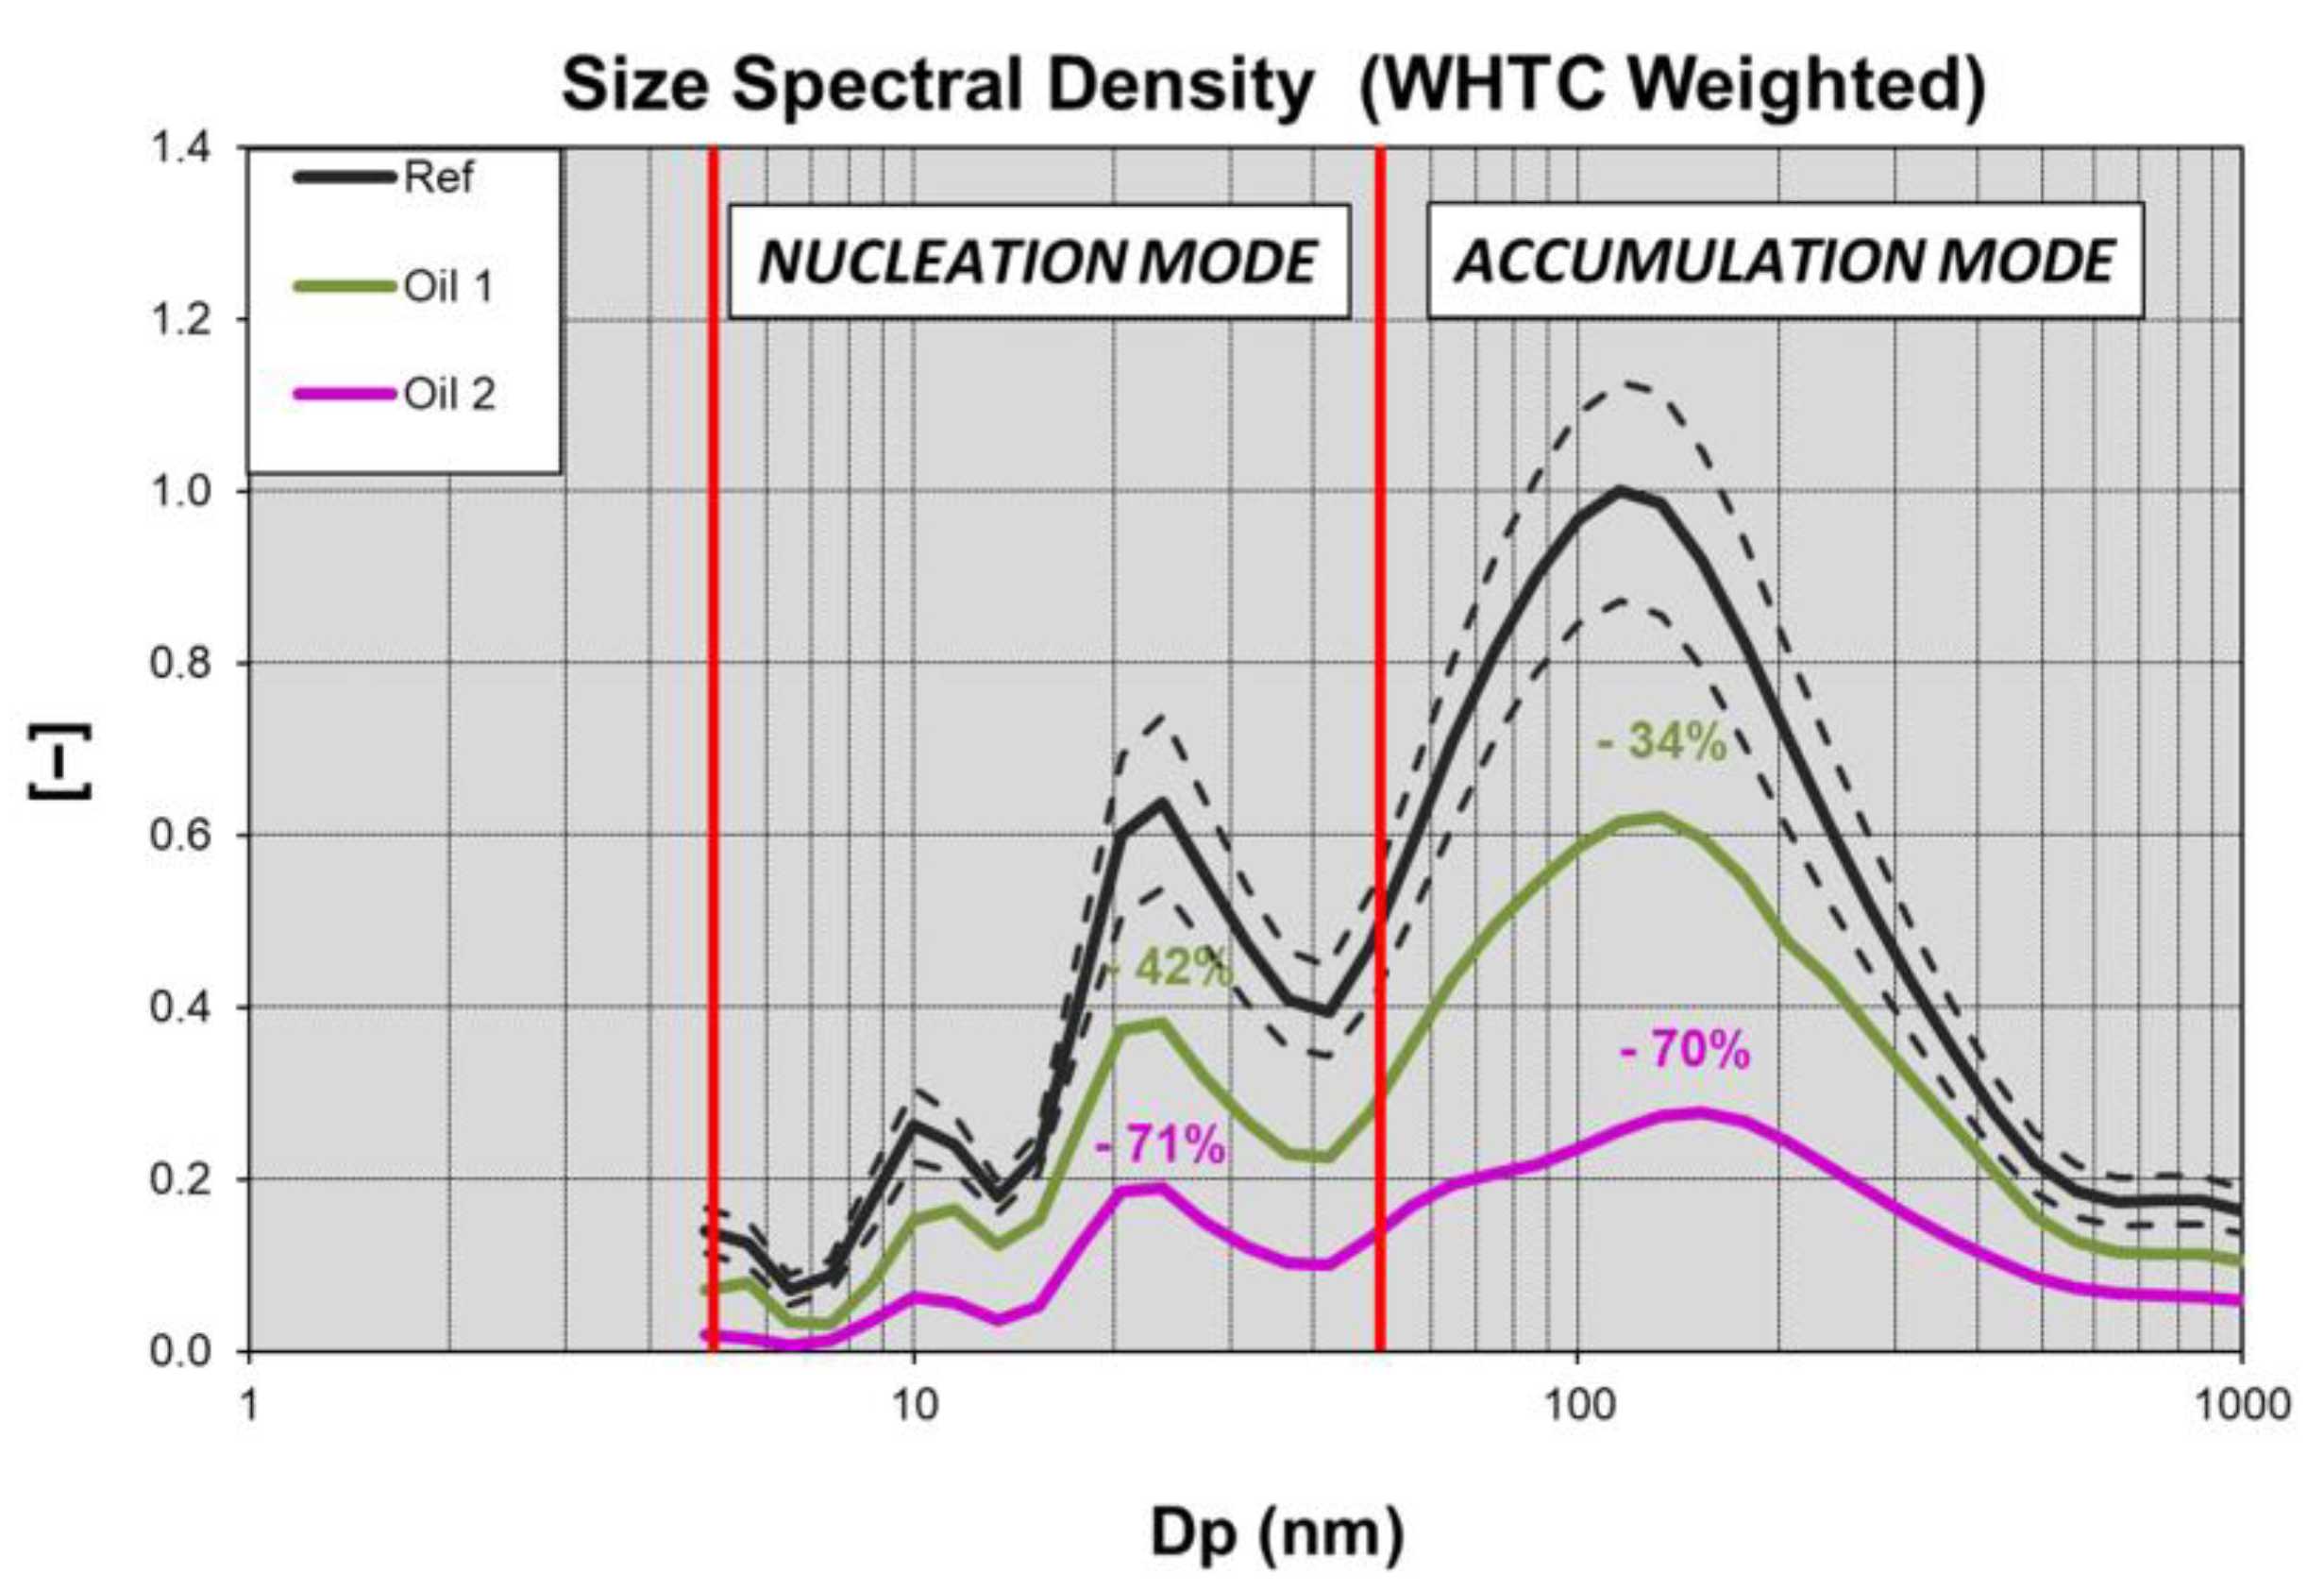
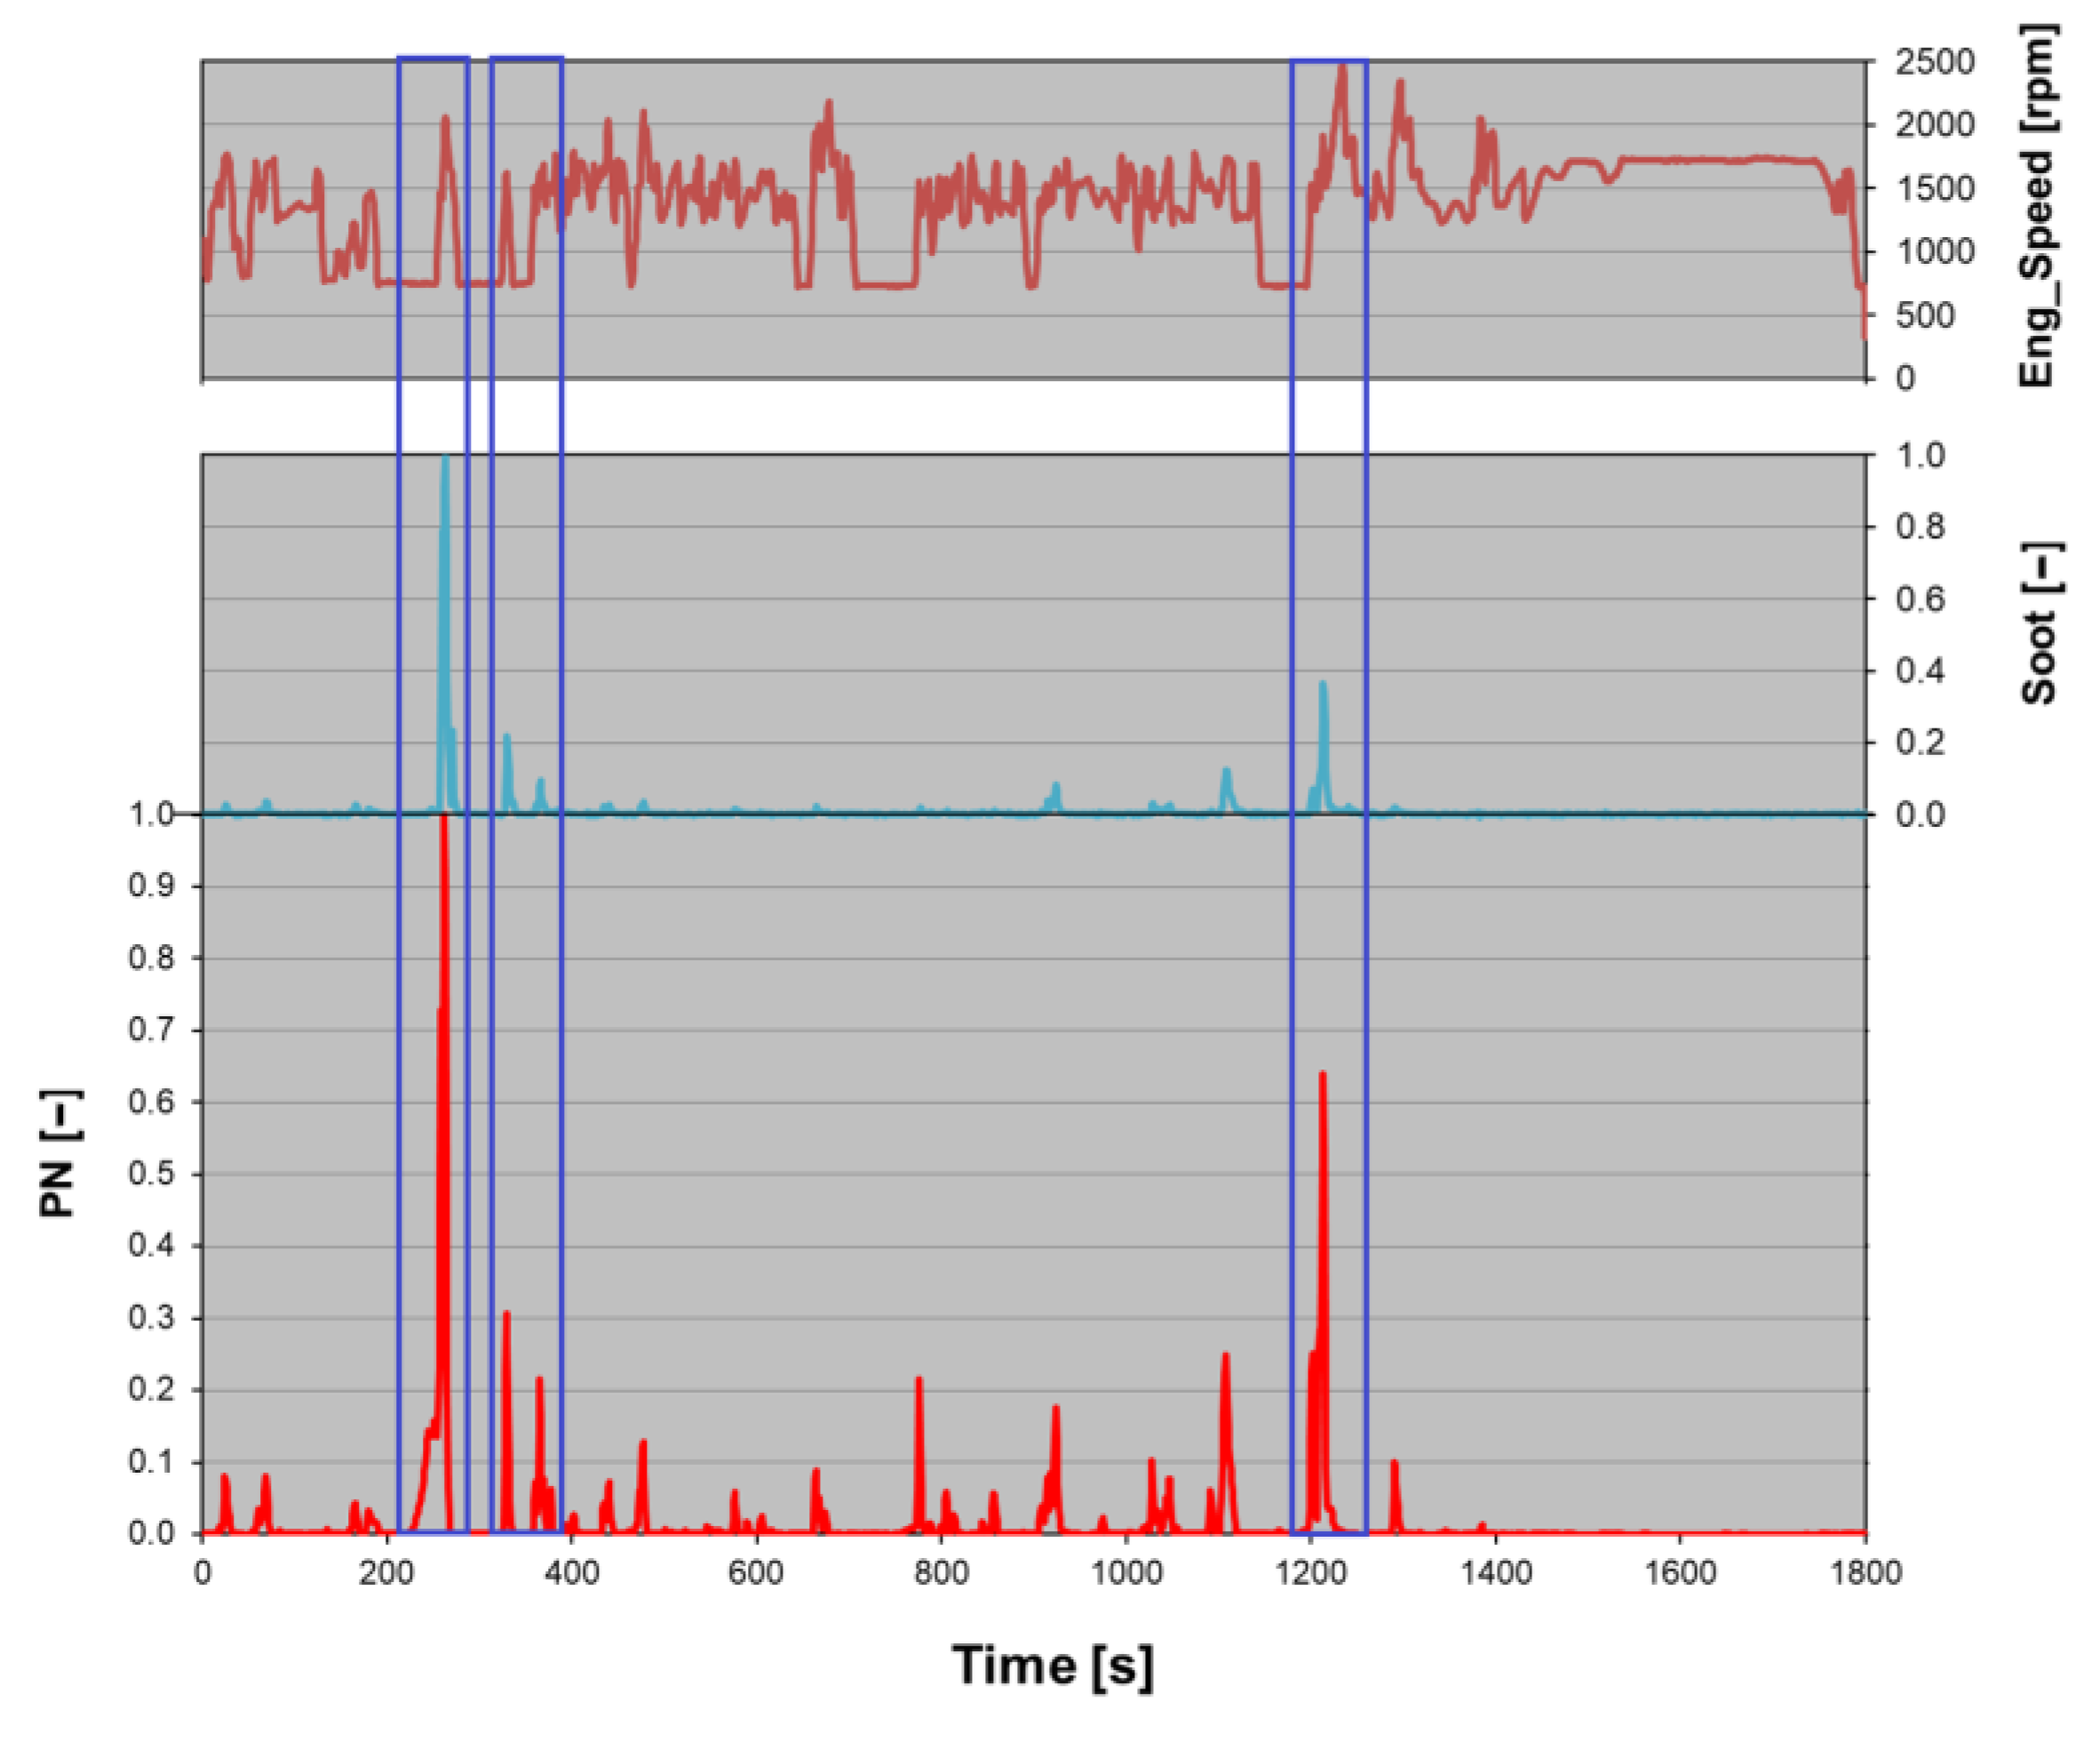
3.3. Experimental Tests Campaign—CPF WHTC Tests

The CPF was also characterized in transient conditions. The WHTC test cycle fits the aim as it better represents the actual engine operating working conditions of the aftertreatment. The testing conditions were treated as for the oil performance test campaign. The test matrix is shown in Table 9. First, a characterization of the emissions downstream the TWC was performed to establish the reference value. Then, the CPF was installed and the sample was collected again, this time downstream the CPF. The campaign matrix was conceived to ensure the repeatability of the tests and the reliability of the results.
The abatement efficiency was calculated by comparing the tests results without the CPF with the ones collected with the CPF equipped.
In Figure 5, a typical WHTC engine speed profile was compared with PN and Soot emitted with the “TWC” configuration. The curves were recorded during a representative test of the experimental campaign. The particle emissions are dimensionless due to confidentiality reasons. The highest values of PN and Soot were selected as the references for the respective dimensionless curves.
It is remarkable that the traces of both APC and MSS were strongly correlated, as highlighted by the blue boxes. Immediately after an idle phase, PN and Soot peaks usually take place, pointing out that there is a sudden increase in the number of particles, which leads to an increase in their total mass. On the other hand, it could be that after an idle phase, there is a PN peak that is not supported by a Soot peak (e.g., around 800 s in Figure 5), revealing conditions of the particle emissions with a very low diameter. However, these results support the theory that the reverse blow-by is the main source of oil entering the combustion chamber, increasing the engine-out PN.
In Figure 6, a comparison of the mean PN and mean Soot for “TWC” and “TWC + CPF” configurations is reported. The values were normalized with respect to the mean Ref values of PN and Soot.
The CPF allows for a huge reduction in both PN and Soot throughout the cycle; the calculated abatement efficiencies were equal to 82% and 73%, respectively. However, the difference between them might suggest that the smaller particles tend to be trapped inside the filter, enhancing the PN abatement efficiency in comparison to Soot. The study of this characteristic could be interesting in the optic of future regulations, with the attention shifting toward the small particles.

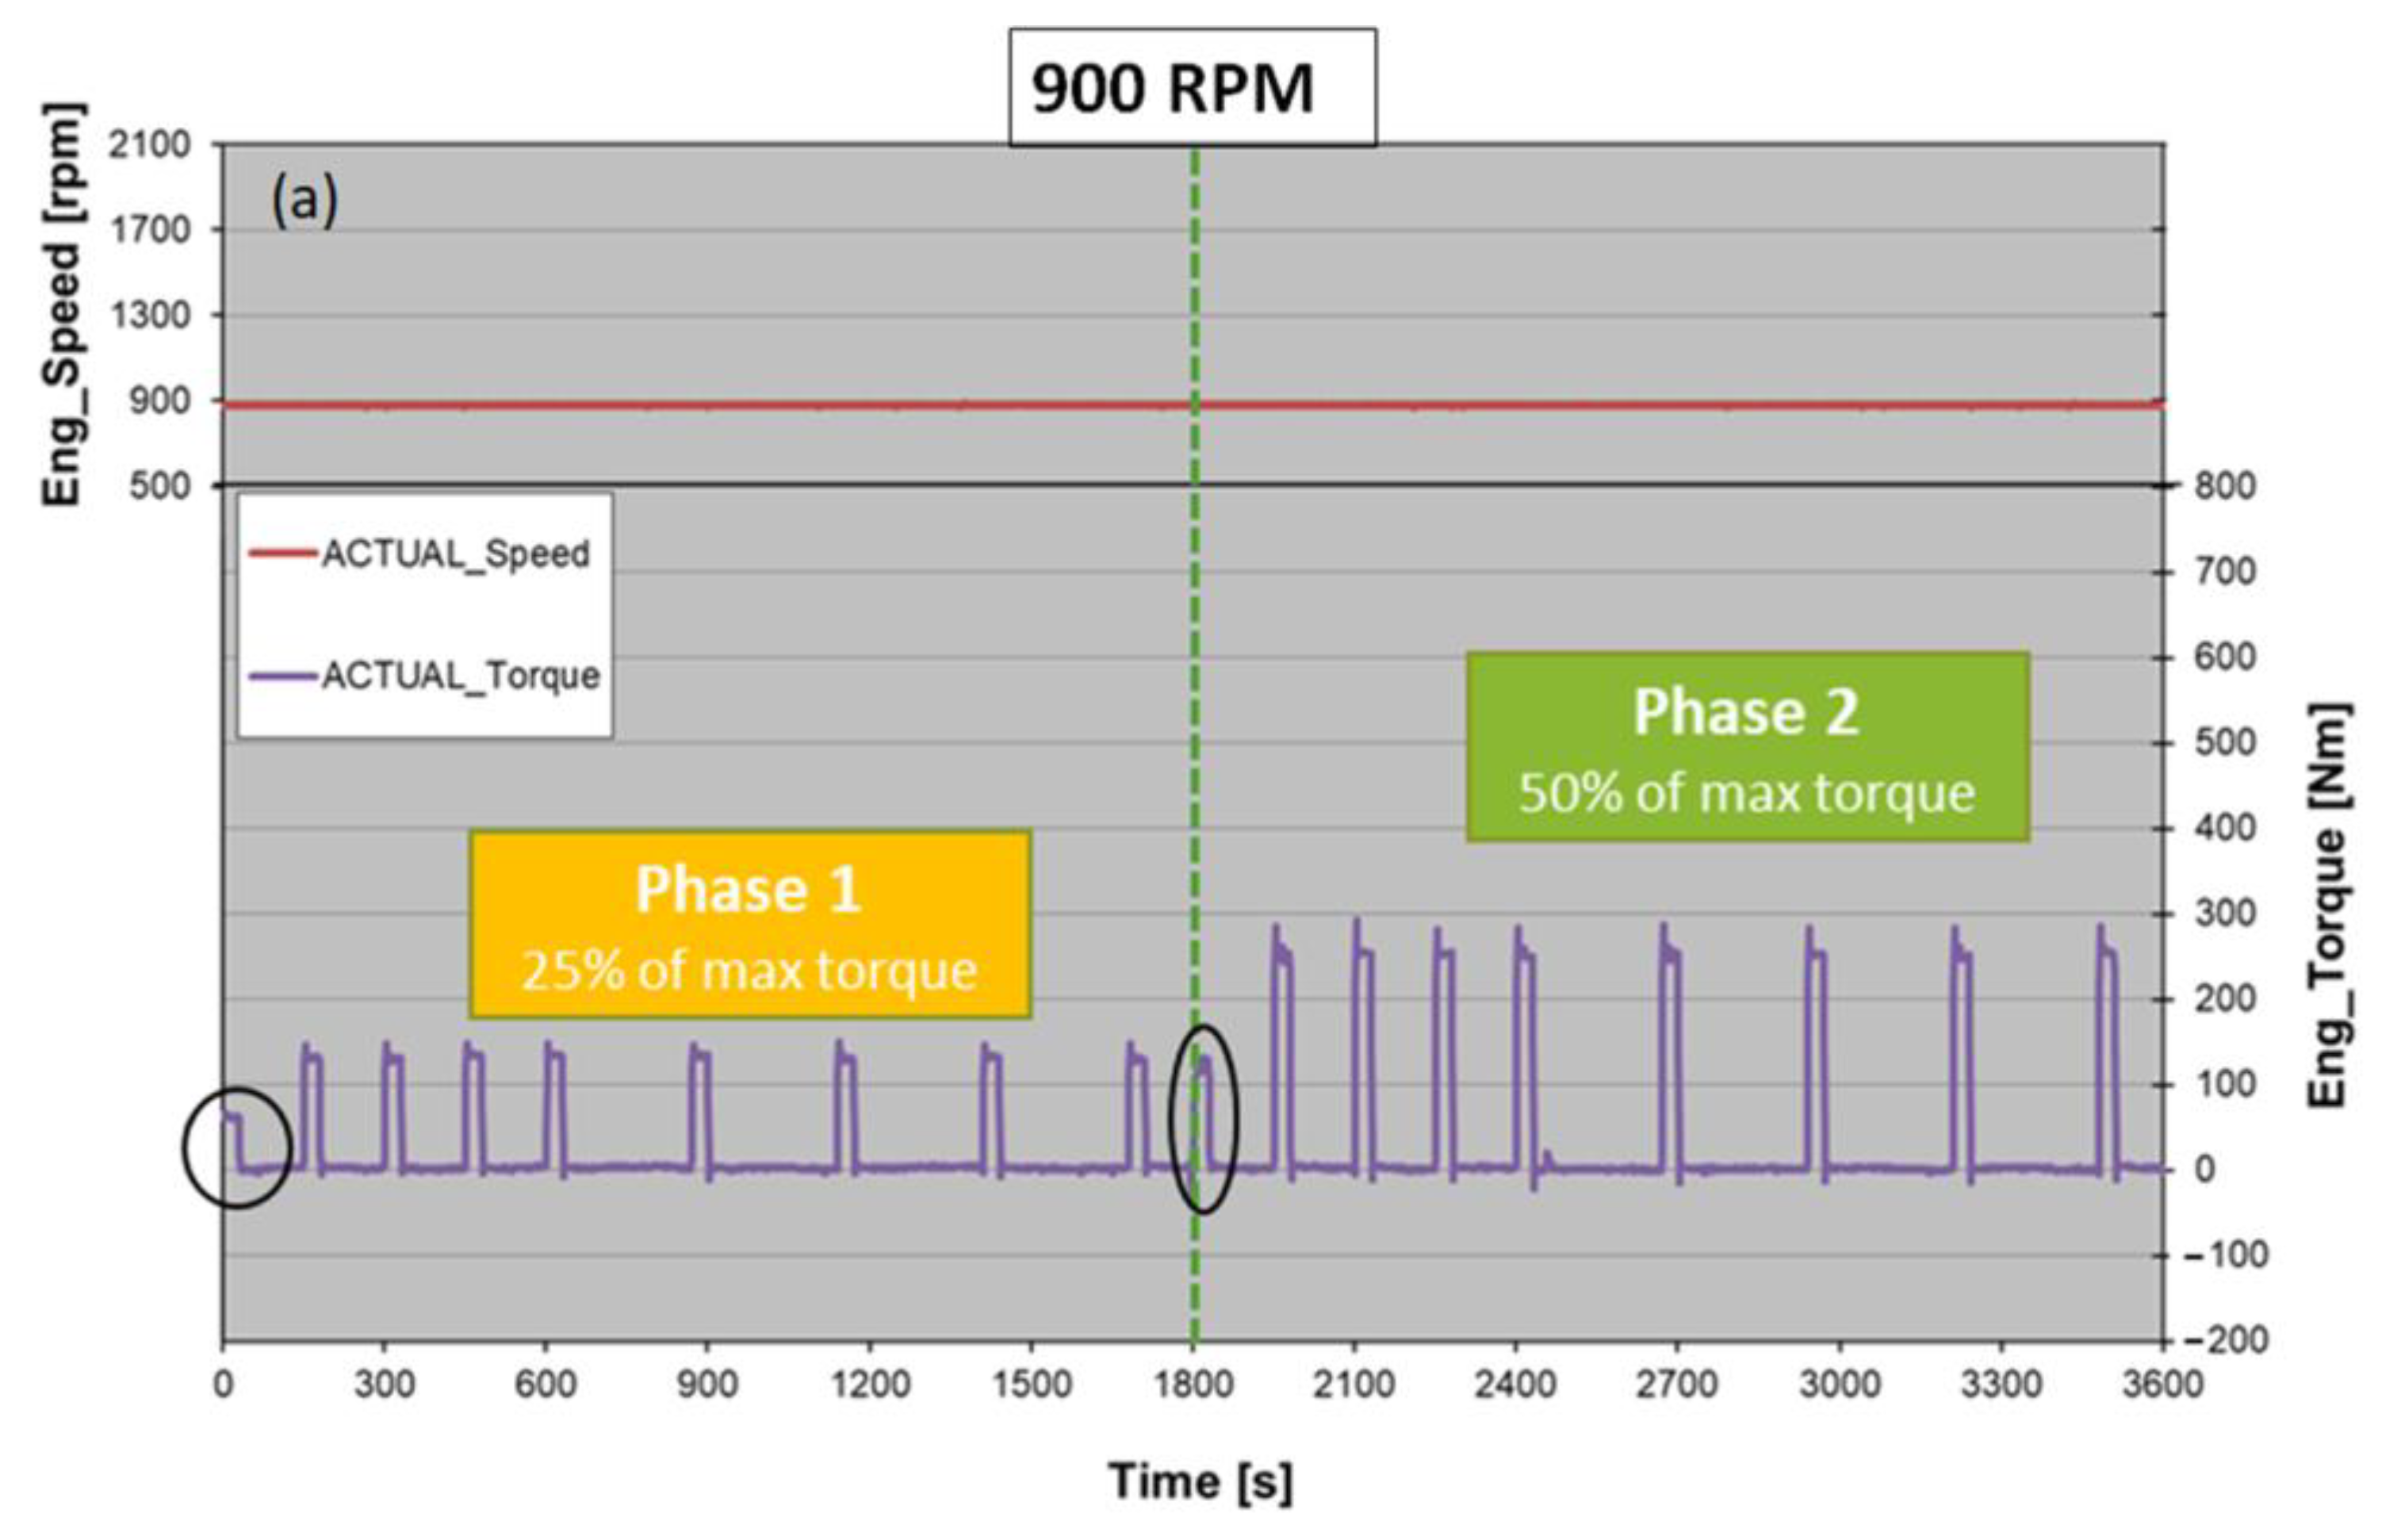
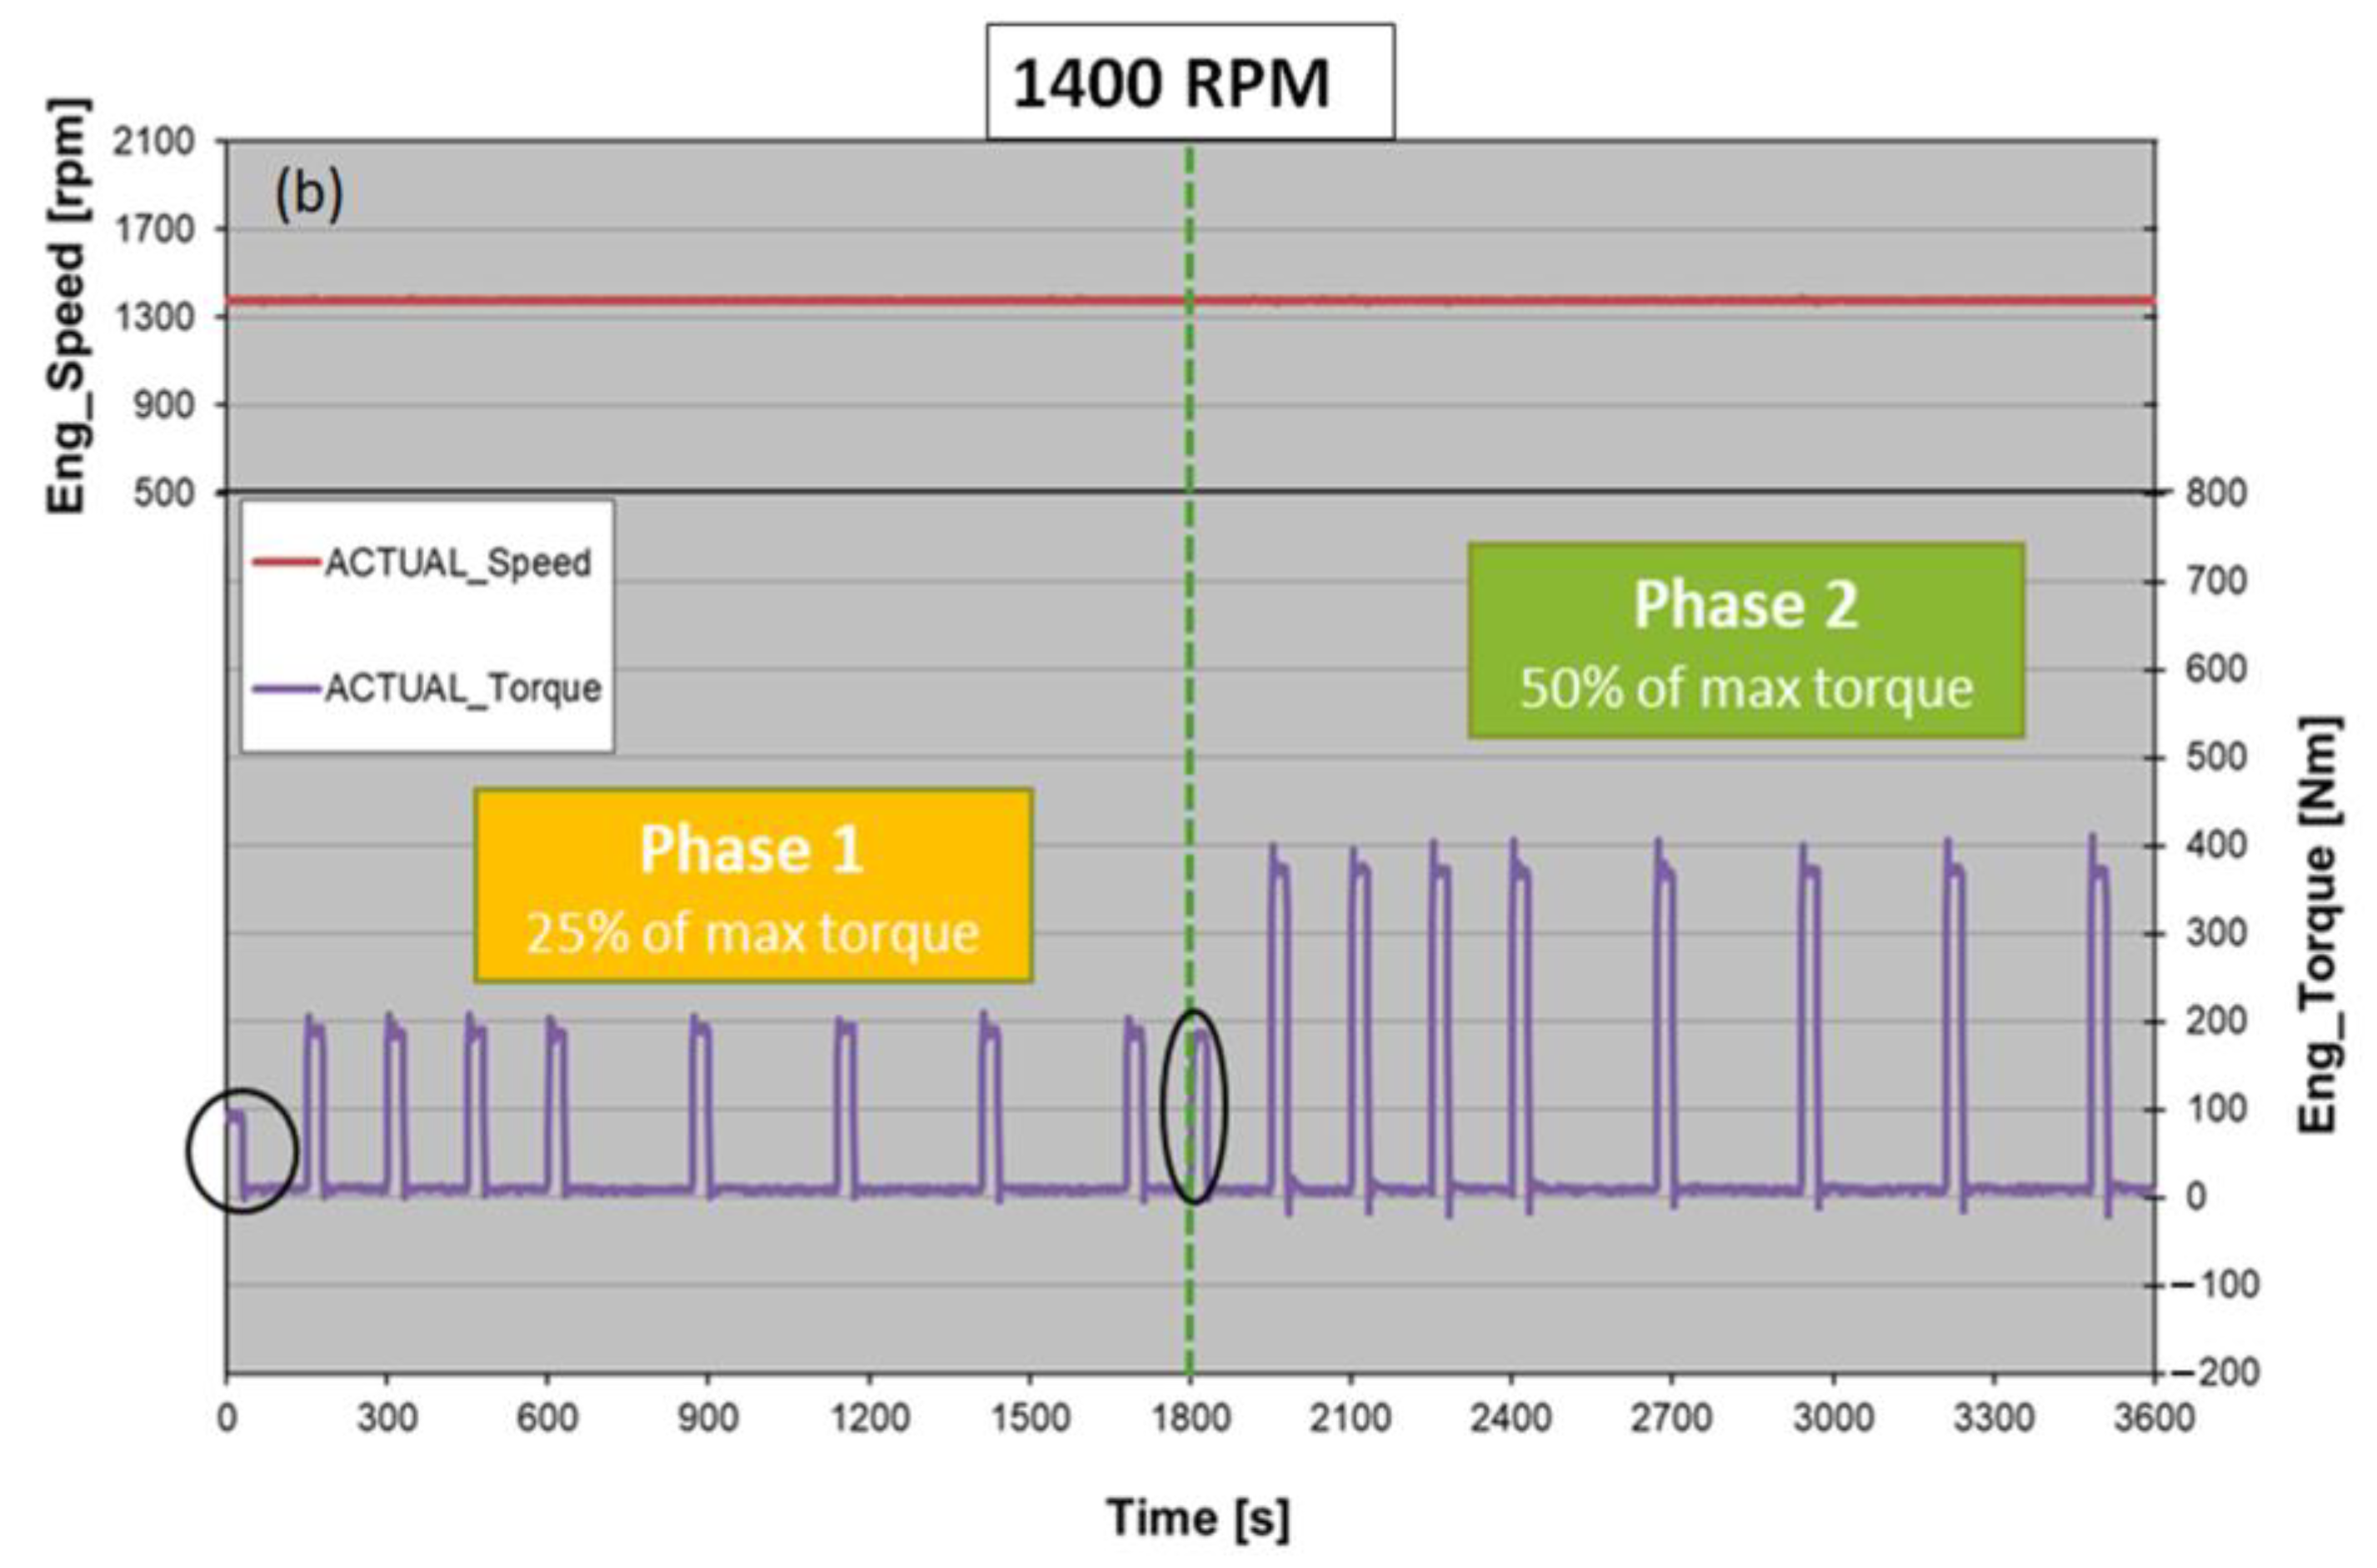
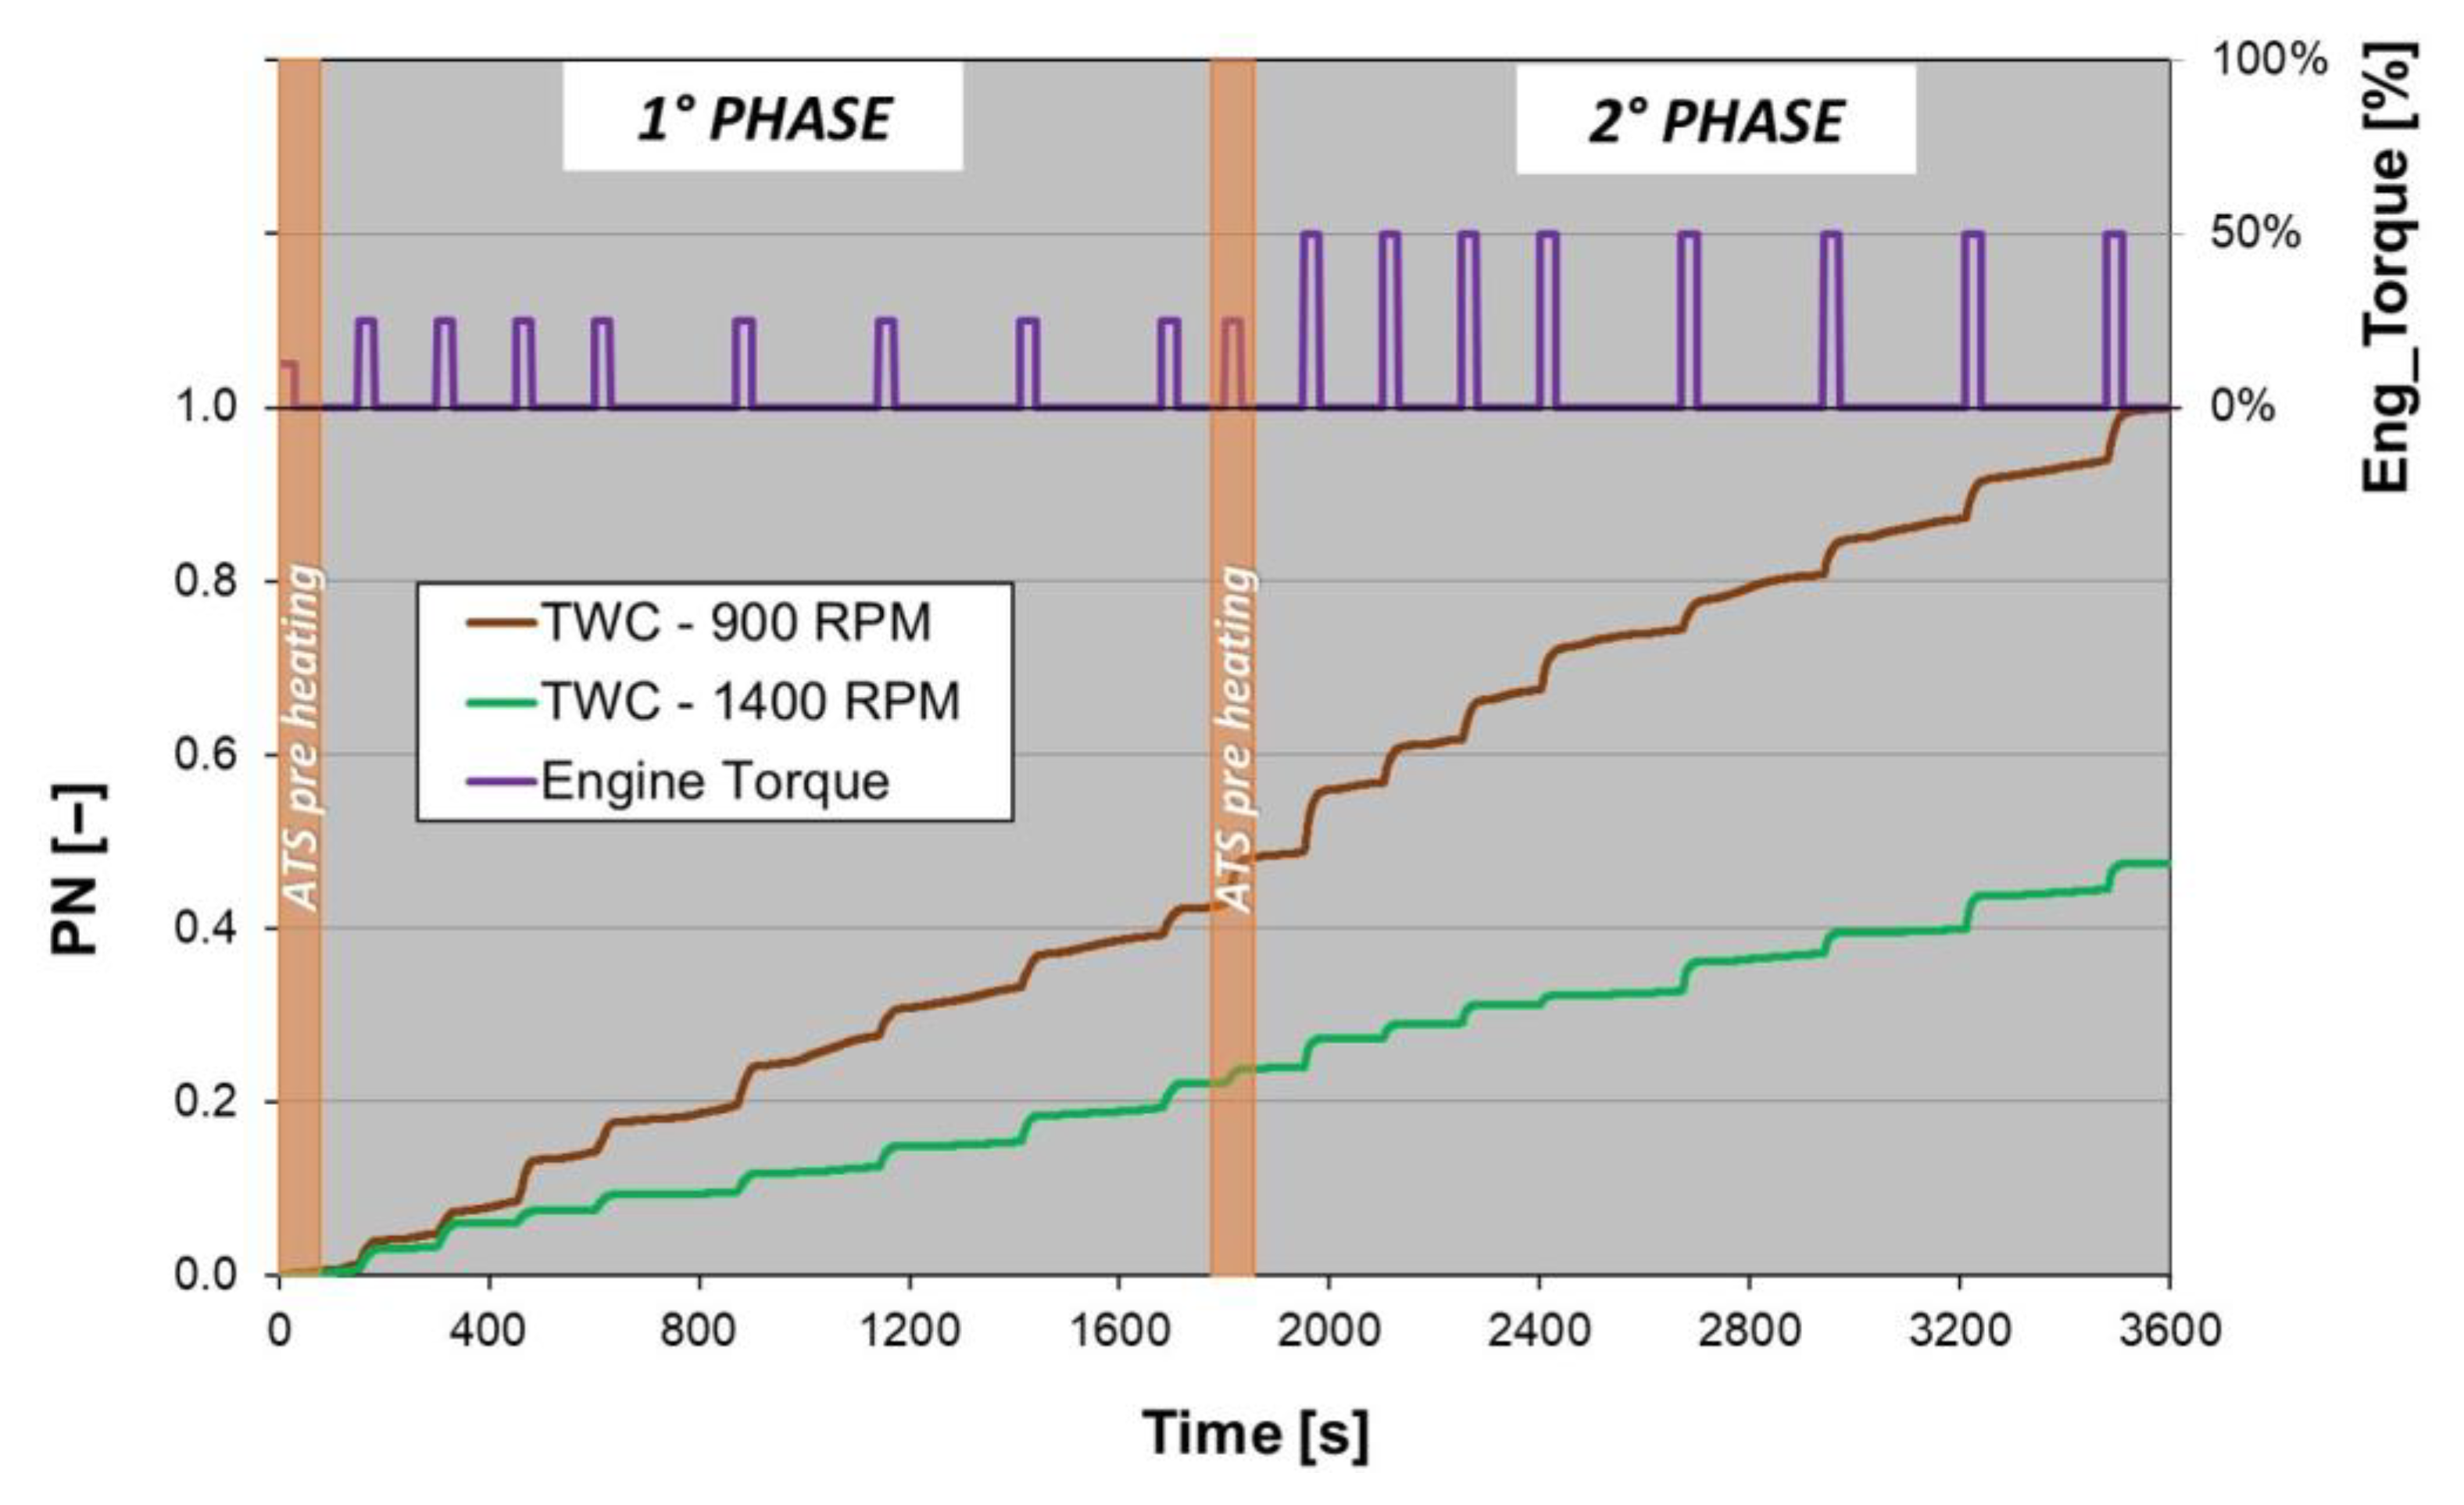
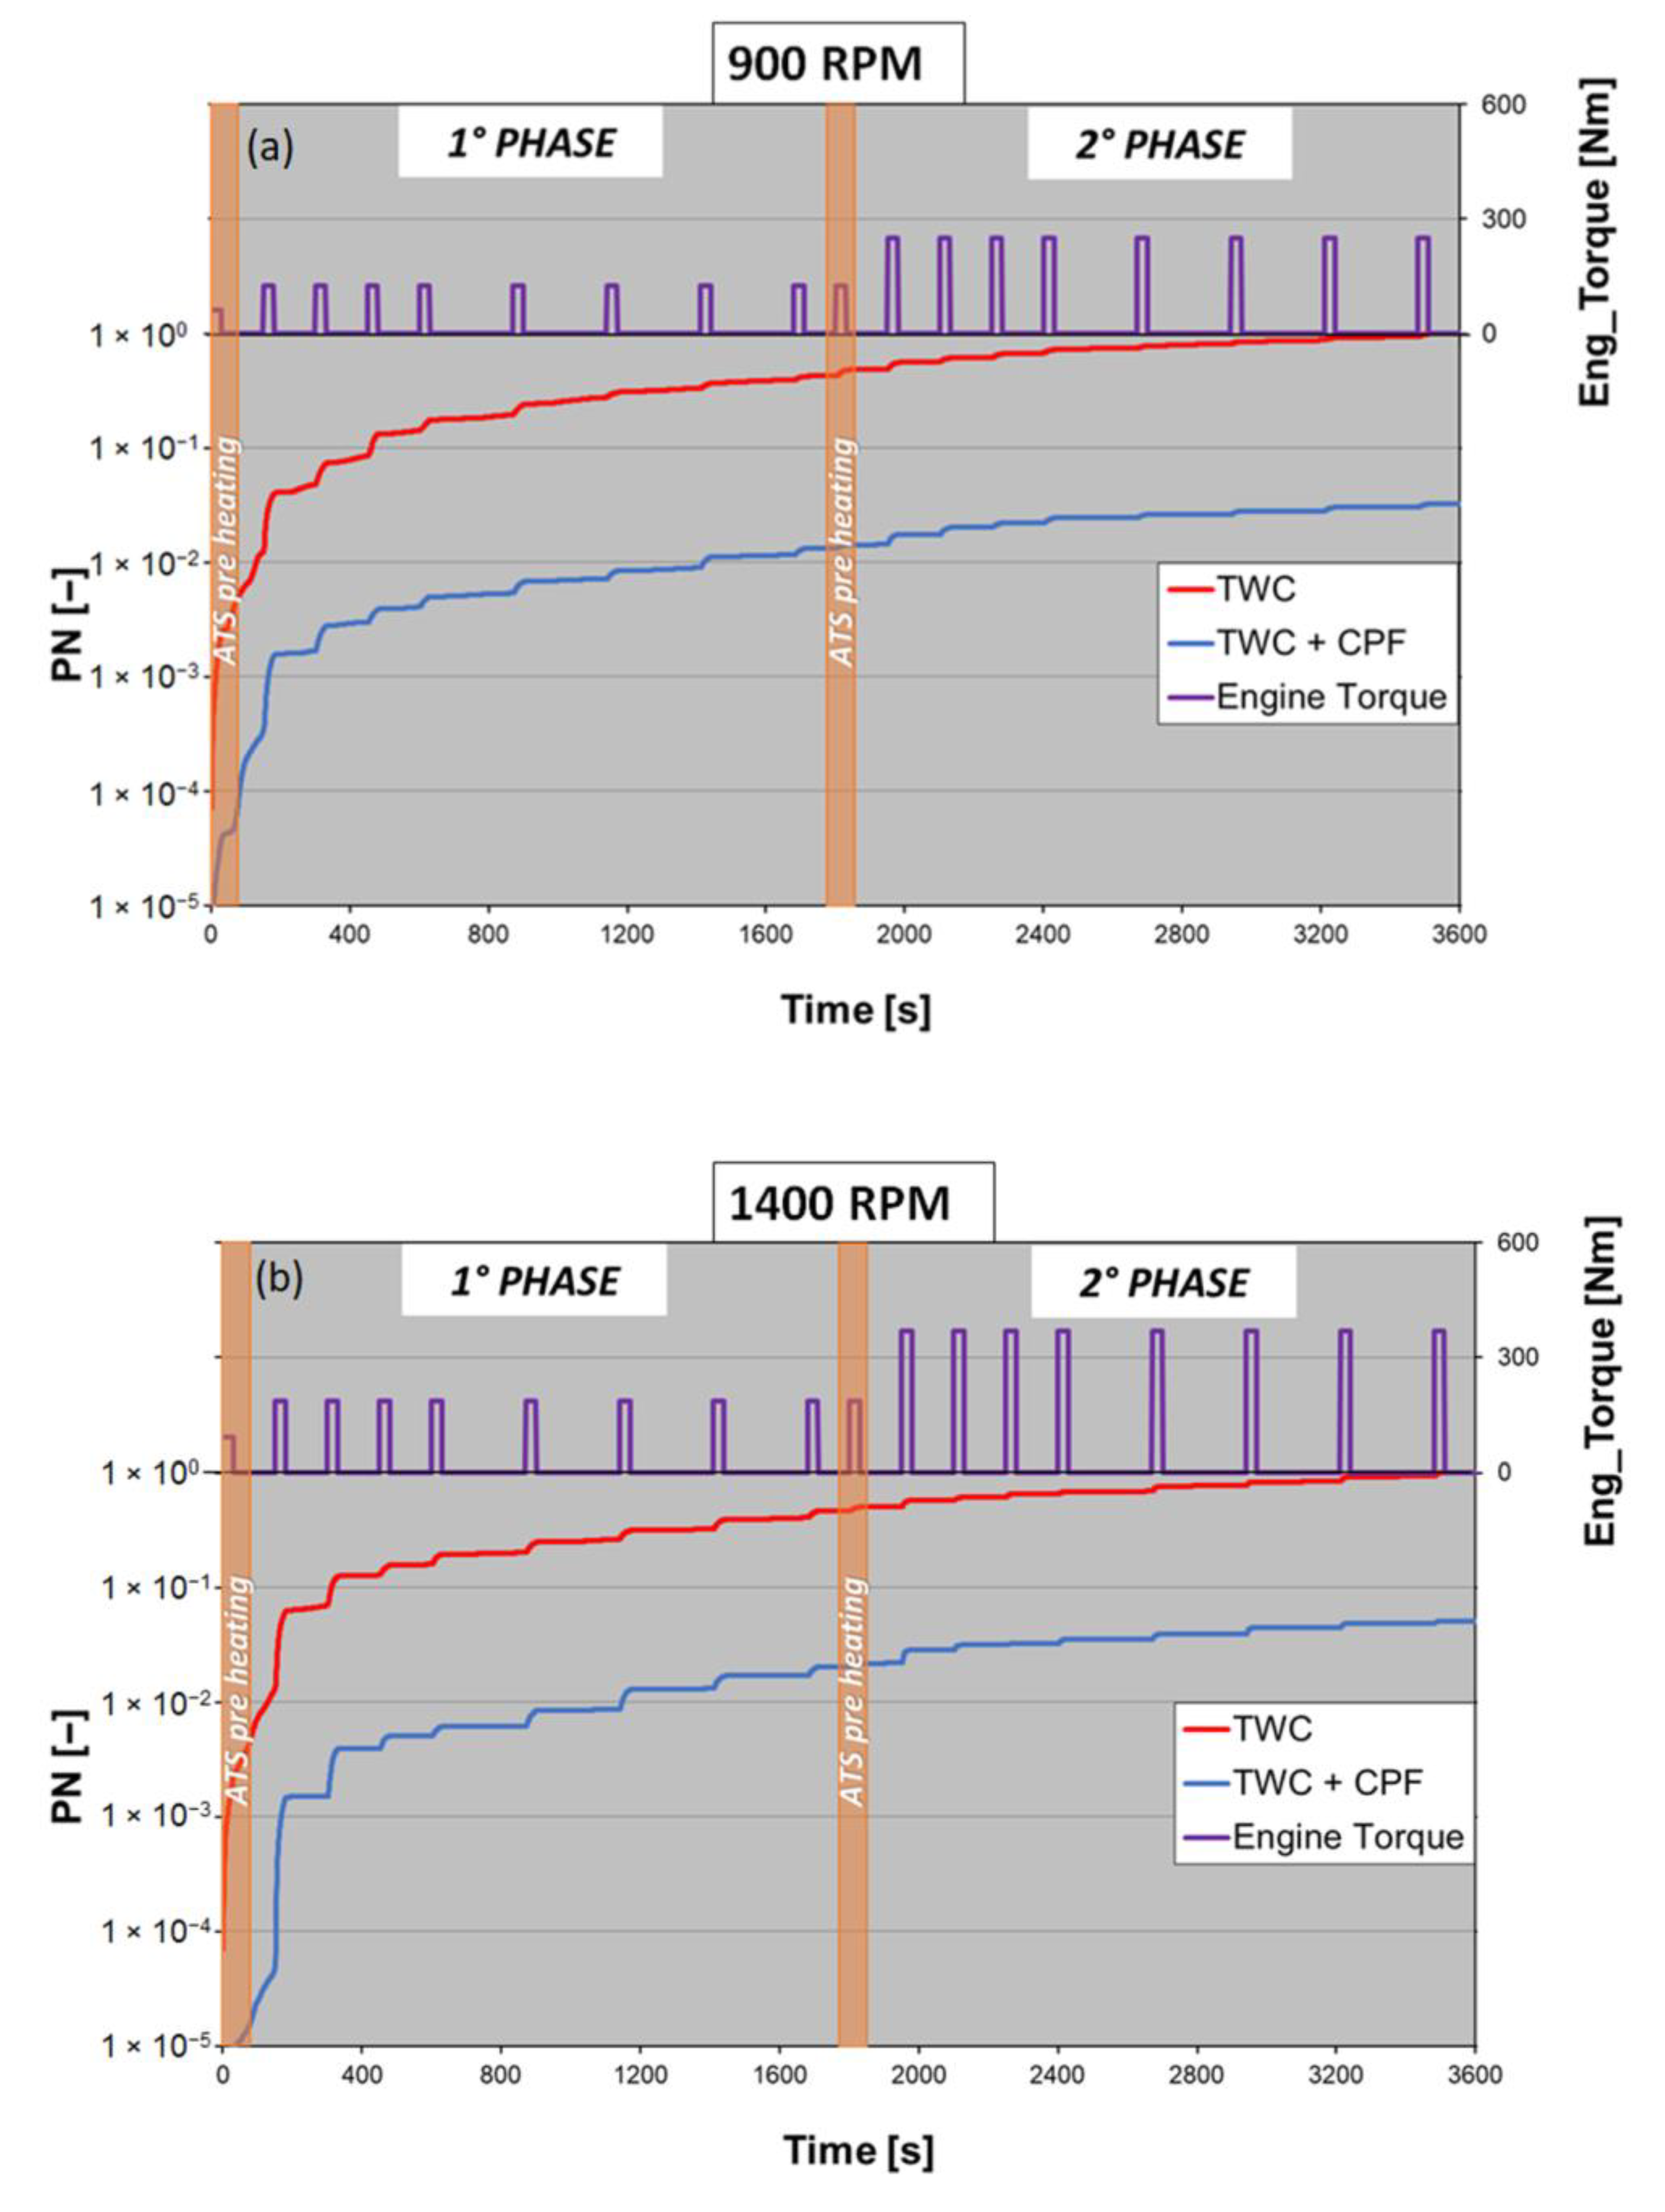
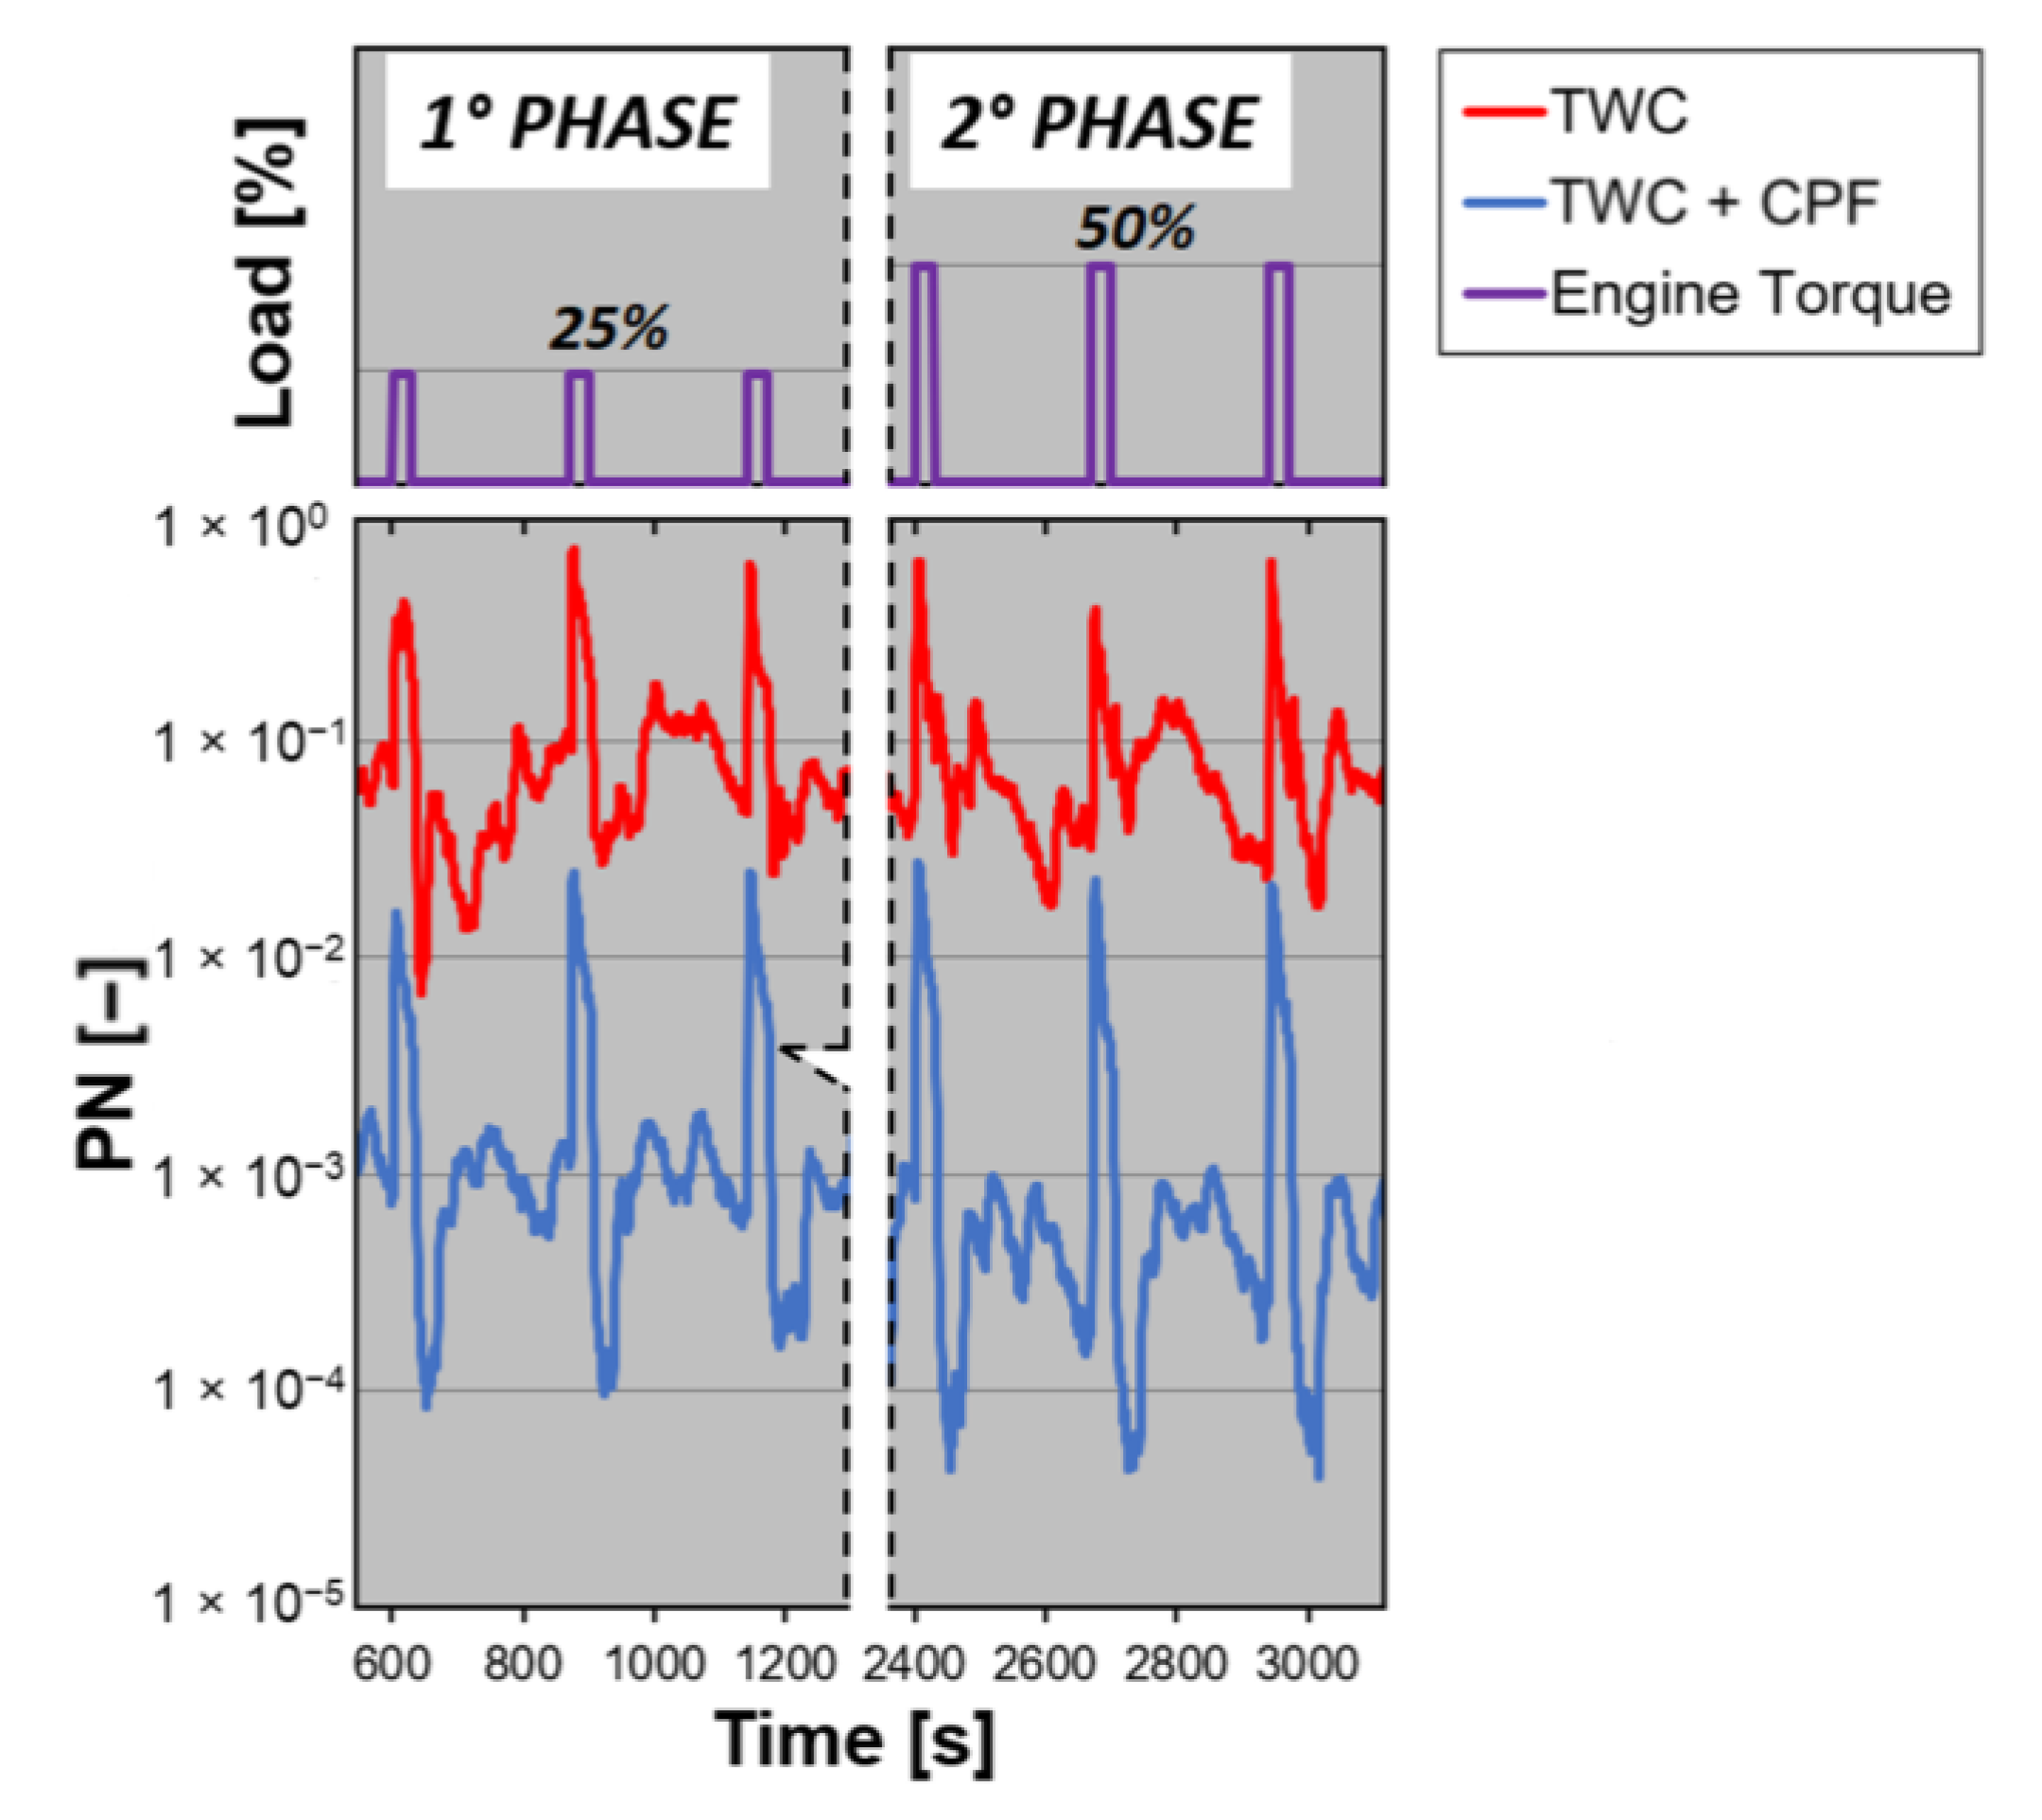
3.4. Experimental Tests Campaign—CPF Step Loads

As reported and demonstrated above, during a WHTC, the higher PN spikes usually occur in correspondence to a rapid increase in torque after long idle phases. The last step of the CPF test campaign has been expressly designed to characterize the PN abatement efficiency when the engine load is rapidly increased after idle phases of different duration. The CPF went through two different tests identified by different engine speeds (900 and 1400 rpm). Each test is composed of two phases: after a short period of pre-conditioning (made by imposing half the torque of the following phase), the first phase consists of four idle sections of 120 s and four idle sections of 240 s, each followed by a step load, equal to 25% of max load at that engine speed, of 30 s duration. After another short period of pre-conditioning, the test passes to phase two, which has the same scheme as the first phase, but in this case, the load ramps from 0% the 50% of max load (Figure 7). The tests were one hour long. Both 900 and 1400 rpm tests were repeated several times. To properly define the abatement efficiency, the same tests were conducted on the configuration without the CPF (“TWC”) and compared to the results obtained with the filter. Figure 8 and Table 10 provide a summary of the tests conducted.
The test and the data acquisition started after 20 minutes of waiting on the pre-conditioning operating point to stabilize the temperatures in the exhaust line.
This test scheme allows a picture of the impact of different idle duration, load, exhaust flow rates, and temperatures on the PN emitted and on the abatement efficiency of the CPF during working conditions, which provide the higher PN spikes (idle-load sequences).
The two test types (900–1400 rpm) showed different PN emissions in the “TWC” configuration. In Figure 8, a comparison between the cumulative PN is shown. Both curves are dimensionless with respect to the last value of the 900 rpm cumulative curve.
The 1400 rpm test produced about half the PN emissions at 900 rpm due to the higher temperatures that favor solid particle oxidation. Both configurations showed a similar trend. In correspondence to a step load, the PN started to noticeably grow while during idle phases, its increase was less marked.
Figure 9 illustrates the comparison between PN emissions measured with and without CPF. The 900 rpm curves (a) were normalized with respect to the latest value of the 900 rpm TWC cumulative curve. The 1400 rpm curves (b) were normalized with reference to the latest value of the 1400 rpm TWC cumulative curve. The 900 rpm TWC curve in Figure 9a corresponds to the 900 rpm curve (brown) in Figure 8, while the 1400 rpm TWC curve in Figure 9b matches the 1400 rpm curve (green) in Figure 8.
In Figure 9, a logarithmic scale was used on the y-axis. For both test modes, the CPF reduced the PN by more than one order of magnitude during the duration of the tests. The abatement was higher for the 900 rpm tests.
Figure 10 shows a zoom of the typical PN emission profiles recorded during the campaign.
The traces refer to different stages of a single test as indicated by the dashed black line. It is interesting to note that the filtration principle was different from the DPF, whose soot cake permits an almost constant PN emission [36]. The CPF was closer to a GPF in which the filtration is continuous throughout the cycle. By looking at the blue curves in Figure 10, they resembled the red curves for both the idle and load phases with, of course, much lower values.
The calculated mean efficiencies are presented in Table 11.
The CPF abatement was very high during the idle phases. When load was applied, the efficiency decreased by at least two percentage points for all combinations of engine speed and phases. This behavior is due to the sudden increase in the exhaust flow rate that negatively affects the CPF filtration (the space velocity grows) [11], overcoming the positive effects that could be brought by the higher ATS temperatures. Furthermore, it is interesting to underline that, consistently, at idle, the CPF efficiency was higher with higher mean ATS temperatures, whose values were higher in phase 2 and at 1400 rpm. In contrast, during the load period, the efficiency was reduced either in the incrementing engine speed than moving from phase 1 to phase 2; this last was the effect of the increment of the exhaust gas speed across CPF.
In general, the CPF PN abatement performance was very high for all the conditions tested, in particular during the low-load phases. The rapid maneuvers caused an efficiency reduction, but the results were more than satisfactory.

4. Conclusions

This research activity offers two interesting approaches to reduce sub-23 nm particle emissions from a heavy-duty engine fueled by natural gas. Although these engines have reduced particle emissions in terms of mass compared to the traditional diesel HD engines, in light of the future EURO VII regulation, which will set a stringent limit for the number of particles emitted, it is necessary to consider appropriate strategies to reduce their amount in the atmosphere. The authors started from the assumption, widely established from previous study, that the lubricant oil combustion is the main cause of particle emissions in NG engines.
In this sense, the impact of different lube oil formulations in terms of both the base composition and ash content on the PN production was discussed. On the other hand, the abatement potential of a particulate filter derived from diesel and gasoline technologies was evaluated as a further component of the ATS developed for heavy duty ICE fed with gaseous fuel in a larger scenario of the decarbonization of this sector in the mid-term with the consolidation of the use of NG, and in the long-term, with the diffusion of hydrogen.
The oil characterization suggests that reformulating the base oil would bring positive results on the PN emissions, more than acting on the ash content: the change in the base composition could lead to a PN reduction of −70% during a WHTC for both cold and hot start conditions.
In-cylinder oil pyrolysis and related particle formation due to the interaction between lube oil and gas flame during the combustion process is one of the main topics to control PN emissions from a NG engine, especially toward the adoption of hydrogen or hydrogen–methane blends. To this aim, an in-depth analysis on the chemical–physical interaction linked to particle formation should be performed, even with dedicated 1D/3D simulations.
The wide experimental campaign related to the use of a particle filter for a NG engine clearly proved the high potential of this device in the abatement of the over-10 nm solid particles. In steady-state conditions, the use of this device has achieved a particle filtration percentage of more than 97%. These high values were also encountered in the proposed additional experimental protocol, consisting of alternating idle and load phases, characterized by several peaks of particle emissions. It has also been pointed out that the use of such technology results in a reduction in the emitted particles of more than 85% during WHTC homologation cycles. Despite the high benefits of the use of this filter in the control of particle emissions, a further dedicated assessment on the trapping and oxidation processes occurring in the CPF, together with a proper analysis linked to the behavior of TWC, is necessary.
Both WHTC and step load campaigns highlighted the fact that the filter continuous abatement principle is different from that of the DPF. The PN emission curve shape upstream CPF repeated themselves in the downstream CPF, the amplitude reduction being equal to the abatement efficiency.
The results of this analysis are very promising, especially in light of the combined implementation of both investigated strategies.
Optimized lube oil formulations might be coupled with a CPF at the tailpipe to minimize the emitted PN, thus reducing the filter load and guaranteeing the competitiveness of NG HD engines in the future in a low–mid-term decarbonization scenario.

Author Contributions

Conceptualization, P.N., C.G. and S.G.; Methodology, P.N. and C.G.; Validation, P.N. and C.G.; Investigation, P.N., D.D.M., C.G. and D.D.D.; Data curation, D.D.M. and D.D.D.; Writing—original draft preparation, D.D.D. and D.D.M.; Supervision, C.G. and S.G. All authors have read and agreed to the published version of the manuscript.

Funding

This research received no external funding.

Institutional Review Board Statement

Not Applicable.

Informed Consent Statement

Not Applicable.

Acknowledgments

The authors kindly acknowledge Bruno Griffaton and Modestino De Feo for their valuable contribution in the research activity design. Alessio Schiavone (CNR, Italy), Augusto Piccolo (CNR, Italy), and Salvatore Alfuso (CNR, Italy) are kindly acknowledged for their valuable technical support in setting up the test cell and in carrying out the experimental test campaign.

Conflicts of Interest

The authors declare no conflict of interest.

References

  1. Zheng, J.; Sun, X.; Jia, L.; Zhou, Y. Electric passenger vehicles sales and carbon dioxide emission reduction potential in China’s leading markets. J. Clean. Prod. 2020, 243, 118607. [Google Scholar] [CrossRef]
  2. Kucukoglu, I.; Dewil, R.; Cattrysse, D. The electric vehicle routing problem and its variations: A literature review. Comput. Ind. Eng. 2021, 161, 107650. [Google Scholar] [CrossRef]
  3. Arora, S.; Abkenar, A.T.; Jayasinghe, S.G.; Tammi, K. Chapter 1—Heavy-duty Electric Vehicles and Society; Butterworth-Heinemann: Oxford, UK, 2021. [Google Scholar]
  4. Mogi, Y.; Oikawa, M.; Kichima, T.; Horiguchi, M.; Goma, K.; Takagi, Y.; Mihara, Y. Effect of high compression ratio on improving thermal efficiency and NOx formation in jet plume controlled direct-injection near-zero emission hydrogen engines. Int. J. Hydrogen Energy 2022, 47, 31459–31467. [Google Scholar] [CrossRef]
  5. Yang, Z.; Wu, J.; Yun, H.; Zhang, H.; Xu, J. Diagnosis and control of abnormal combustion of hydrogen internal combustion engine based on the hydrogen injection parameters. Int. J. Hydrogen Energy 2022, 47, 15887–15895. [Google Scholar] [CrossRef]
  6. Bakar, R.A.; Kadirgama, K.; Ramasamy, D.; Yusaf, T.; Kamarulzaman, M.K.; Aslfattahi, N.; Samylingam, L.; Alwayzy, S.H. Experimental analysis on the performance, combustion/emission characteristics of a DI diesel engine using hydrogen in dual fuel mode. Int. J. Hydrogen Energy, 2022; in press. [Google Scholar] [CrossRef]
  7. Kumar, M.; Bhowmik, S.; Paul, A. Effect of pilot fuel injection pressure and injection timing on combustion, performance and emission of hydrogen-biodiesel dual fuel engine. Int. J. Hydrogen Energy 2022, 47, 29554–29567. [Google Scholar] [CrossRef]
  8. de las Nieves Camacho, M.; Jurburg, D.; Tanco, M. Hydrogen fuel cell heavy-duty trucks: Review of main research topics. Int. J. Hydrogen Energy 2022, 47, 29505–29525. [Google Scholar] [CrossRef]
  9. Jiaqiang, E.; Xu, W.; Ma, Y.; Tan, D.; Peng, Q.; Tan, Y.; Chen, L. Soot formation mechanism of modern automobile engines and methods of reducing soot emissions: A review. Fuel Process. Technol. 2022, 235, 107373. [Google Scholar]
  10. Lee, C.F.; Pang, Y.; Wu, H.; Nithyanandan, K.; Liu, F. An optical investigation of substitution rates on natural gas/diesel dual-fuel combustion in a diesel engine. Appl. Energy 2020, 261, 114455. [Google Scholar] [CrossRef]
  11. Di Maio, D.; Beatrice, C.; Fraioli, V.; Napolitano, P.; Golini, S.; Rutigliano, F.G. Modeling of three-way catalyst dynamics for a compressed natural gas engine during lean–rich transitions. Appl. Sci. 2019, 9, 4610. [Google Scholar] [CrossRef] [Green Version]
  12. Di Maio, D.; Beatrice, C.; Guido, C.; Fraioli, V.; Napolitano, P.; Kannepalli, S.; Golini, S.; Tsinoglou, D. Methane Conversion and Ammonia Formation Model over a Pd-Rh Three-Way Catalyst for CNG Heavy-Duty Engines; SAE Technical Paper; SAE: Warrendale, PA, USA, 2021. [Google Scholar]
  13. Grigoratos, T.; Fontaras, G.; Giechaskiel, B.; Zacharof, N. Real world emissions performance of heavy-duty Euro VI diesel vehicles. Atmos. Environ. 2019, 201, 348–359. [Google Scholar] [CrossRef]
  14. Giechaskiel, B.; Lähde, T.; Drossinos, Y. Regulating particle number measurements from the tailpipe of light-duty vehicles: The next step? Environ. Res. 2019, 172, 1–9. [Google Scholar] [CrossRef] [PubMed]
  15. Lähde, T.; Giechaskiel, B. Particle number emissions of gasoline, compressed natural gas (CNG) and liquefied petroleum gas (LPG) fueled vehicles at different ambient temperatures. Atmosphere 2021, 12, 893. [Google Scholar] [CrossRef]
  16. Zhang, C.; Chen, L.; Ding, S.; Zhou, X.; Chen, R.; Zhang, X.; Yu, Z.; Wang, J. Mitigation effects of alternative aviation fuels on non-volatile particulate matter emissions from aircraft gas turbine engines: A review. Sci. Total Environ. 2022, 820, 153233. [Google Scholar] [CrossRef]
  17. Thiruvengadam, A.; Besch, M.C.; Yoon, S.; Collins, J.; Kappanna, H.; Carder, D.K.; Ayala, A.; Herner, J.; Gautam, M. Characterization of particulate matter emissions from a current technology natural gas engine. Environ. Sci. Technol. 2014, 48, 8235–8242. [Google Scholar] [CrossRef]
  18. Distaso, E.; Amirante, R.; Tamburrano, P.; Reitz, R.D. Steady-state characterization of particle number emissions from a heavy-duty Euro VI engine fueled with compressed natural gas. Energy Procedia 2018, 148, 671–678. [Google Scholar] [CrossRef]
  19. Fontaras, G.; Vouitsis, E.; Samaras, Z. Experimental Evaluation of the Fuel Consumption and Emissions Reduction Potential of Low Viscosity Lubricants; SAE Technical Paper; SAE: Warrendale, PA, USA, 2009. [Google Scholar]
  20. Lue, K.H. PN Emissions from Heavy Duty CNG Engine and CNG PEMS PN Issue; ACEA: Brussels, Belgium, 2018. [Google Scholar]
  21. Inoue, T.; Maeda, Y.; Takeda, M.; Nakada, M. Study of transient oil consumption of automotive engine. SAE Trans. 1989, 98, 1039–1045. [Google Scholar]
  22. Guido, C.; Napolitano, P.; Alfuso, S.; Corsetti, C.; Beatrice, C. How engine design improvement impacts on particle emissions from an HD SI natural gas engine. Energy 2021, 231, 120748. [Google Scholar] [CrossRef]
  23. Lähde, T.; Giechaskiel, B.; Martini, G.; Howard, K.; Jones, J.; Ubhi, S. Effect of lubricating oil characteristics on solid particle number and CO2 emissions of a Euro 6 light-duty compressed natural gas fuelled vehicle. Fuel 2022, 324, 124763. [Google Scholar] [CrossRef]
  24. Tan, P.; Li, Y.; Shen, H. Effect of lubricant sulfur on the morphology and elemental composition of diesel exhaust particles. J. Environ. Sci. 2017, 55, 354–362. [Google Scholar] [CrossRef]
  25. American Automobile Association. AAA Engine oil Research: AAA Proprietary Research into the Differences between Conventional and Synthetic Engine Oil; AAA: Heathrow, FL, USA, 2017. [Google Scholar]
  26. Liang, Z.; Chen, L.; Alam, M.S.; Rezaei, S.Z.; Stark, C.; Xu, H.; Harrison, R.M. Comprehensive chemical characterization of lubricating oils used in modern vehicular engines utilizing GC× GC-TOFMS. Fuel 2018, 220, 792–799. [Google Scholar] [CrossRef]
  27. Wang, Y.; Liang, X.; Wang, Y.; Yu, H. Effects of viscosity index improver on morphology and graphitization degree of diesel particulate matter. Energy Procedia 2017, 105, 4236–4241. [Google Scholar] [CrossRef]
  28. Laurence, R.B.; Wong, V.W.; Brown, A.J. Effects of lubrication system parameters on diesel particulate emission characteristics. SAE Trans. 1996, 105, 157–164. [Google Scholar]
  29. Khan, M.I.; Yasmin, T.; Shakoor, A. Technical overview of compressed natural gas (CNG) as a transportation fuel. Renew. Sustain. Energy Rev. 2015, 51, 785–797. [Google Scholar] [CrossRef]
  30. Macian, V.; Tormos, B.; Ruiz, S.; Miro, G. Low viscosity engine oils: Study of wear effects and oil key parameters in a heavy duty engine fleet test. Tribol. Int. 2016, 94, 240–248. [Google Scholar] [CrossRef]
  31. Premnath, V.; Khalek, I.; Morgan, P.; Michlberger, A.; Sutton, M.; Vincent, P. Effect of Lubricant Oil on Particle Emissions from a Gasoline Direct Injection Light-Duty Vehicle; SAE Technical Paper; SAE: Warrendale, PA, USA, 2018. [Google Scholar]
  32. Jung, H.; Kittelson, D.B.; Zachariah, M.R. The Influence of Engine Lubricating Oil on Diesel Nanoparticle Emissions and Kinetics of Oxidation; SAE Technical Paper; SAE: Warrendale, PA, USA, 2003. [Google Scholar]
  33. Kajdas, C.; Majzner, M. Effectiveness of selected CHO compounds as antiwear additives to white mineral oils. Tribol. Trans. 2005, 48, 93–99. [Google Scholar] [CrossRef]
  34. Vipper, A.; Zadko, I.; Karaulov, A.; Ermolaev, M. Antifriction action of engine oil additives. Lubr. Sci. 2001, 14, 43–56. [Google Scholar] [CrossRef]
  35. Kang, Y. Role of selected dispersants in gasoline particulate emissions under lubricant formulations in the presence of commercial package and dispersant additives: Its effect on emissions, viscosity, and soot morphology. Fuel 2020, 281, 118444. [Google Scholar] [CrossRef]
  36. Stamatellou, A.M.; Stamatelos, A. Overview of Diesel particulate filter systems sizing approaches. Appl. Therm. Eng. 2017, 121, 537–546. [Google Scholar] [CrossRef]
  37. Ou, J.; Meng, Z.; Hu, Y.; Du, Y. Experimental investigation on the variation characteristics of soot layer thickness and pressure drop during DPF/CDPF active regeneration. Chem. Eng. Sci. 2021, 241, 116682. [Google Scholar] [CrossRef]
  38. Hansen, B.B.; Jensen, A.D.; Jensen, P.A. Performance of diesel particulate filter catalysts in the presence of biodiesel ash species. Fuel 2013, 106, 234–240. [Google Scholar] [CrossRef] [Green Version]
  39. Mokhri, M.A.; Abdullah, N.R.; Abdullah, S.A.; Kasalong, S.; Mamat, R. Soot filtration recent simulation analysis in diesel particulate filter (DPF). Procedia Eng. 2012, 41, 1750–1755. [Google Scholar] [CrossRef] [Green Version]
  40. Toumasatos, Z.; Raptopoulos-Chatzistefanou, A.; Kolokotronis, D.; Pistikopoulos, P.; Samaras, Z.; Ntziachristos, L. The role of the driving dynamics beyond RDE limits and DPF regeneration events on pollutant emissions of a Euro 6d-temp passenger vehicle. J. Aerosol Sci. 2022, 161, 105947. [Google Scholar] [CrossRef]
  41. Meng, Z.; Zeng, B.; Tan, J.; Chen, Z.; Ou, J. Study of gas and particulate emission characteristics during the fast regeneration period of DPF. Fuel 2022, 317, 123353. [Google Scholar] [CrossRef]
  42. Beatrice, C.; Di Iorio, S.; Guido, C.; Napolitano, P. Detailed characterization of particulate emissions of an automotive catalyzed DPF using actual regeneration strategies. Exp. Therm. Fluid Sci. 2012, 39, 45–53. [Google Scholar] [CrossRef]
  43. Beatrice, C.; Costagliola, M.A.; Guido, C.; Napolitano, P.; Prati, M.V. How Much Regeneration Events Influence Particle Emissions of DPF-Equipped Vehicles? SAE Technical Paper; SAE: Warrendale, PA, USA, 2017. [Google Scholar]
  44. Gong, C.; Si, X.; Liu, F. Combustion and emissions behaviors of a stoichiometric GDI engine with simulated EGR (CO2) at low load and different spark timings. Fuel 2021, 295, 120614. [Google Scholar] [CrossRef]
  45. Raza, M.; Chen, L.; Leach, F.; Ding, S. A review of particulate number (PN) emissions from gasoline direct injection (GDI) engines and their control techniques. Energies 2018, 11, 1417. [Google Scholar] [CrossRef] [Green Version]
  46. Jeon, J. Spatiotemporal flame propagations, combustion and solid particle emissions from lean and stoichiometric gasoline direct injection engine operation. Energy 2020, 210, 118652. [Google Scholar] [CrossRef]
  47. Chen, L.; Liang, Z.; Zhang, X.; Shuai, S. Characterizing particulate matter emissions from GDI and PFI vehicles under transient and cold start conditions. Fuel 2017, 189, 131–140. [Google Scholar] [CrossRef]
  48. Joshi, A.; Johnson, T.V. Gasoline particulate filters—A review. Emiss. Control Sci. Technol. 2018, 4, 219–239. [Google Scholar] [CrossRef]
  49. Chen, L.; Stone, R.; Richardson, D. Effect of the valve timing and the coolant temperature on particulate emissions from a gasoline direct-injection engine fuelled with gasoline and with a gasoline–ethanol blend. Proc. Inst. Mech. Eng. Part D J. Automob. Eng. 2012, 226, 1419–1430. [Google Scholar] [CrossRef]
  50. Zuo, Q.; Zhu, X.; Zhang, J.; Zhang, B.; Tang, Y.; Xie, Y.; Zhang, X.; Zhu, G.; Wang, Z. Effects of exhaust parameters on temperature and pressure drop of the gasoline particulate filter in the regeneration equilibrium state. Fuel 2019, 257, 116019. [Google Scholar] [CrossRef]
  51. Lambert, C.; Chanko, T.; Dobson, D.; Liu, X.; Pakko, J. Gasoline particle filter development. Emiss. Control Sci. Technol. 2017, 3, 105–111. [Google Scholar] [CrossRef]
  52. Gong, J.; Stewart, M.L.; Zelenyuk, A.; Strzelec, A.; Viswanathan, S.; Rothamer, D.A.; Foster, D.E.; Rutland, C.J. Importance of filter’s microstructure in dynamic filtration modeling of gasoline particulate filters (GPFs): Inhomogeneous porosity and pore size distribution. Chem. Eng. J. 2018, 338, 15–26. [Google Scholar] [CrossRef]
  53. McCaffery, C.; Zhu, H.; Li, C.; Durbin, T.D.; Johnson, K.C.; Jung, H.; Brezny, R.; Geller, M.; Karavalakis, G. On-road gaseous and particulate emissions from GDI vehicles with and without gasoline particulate filters (GPFs) using portable emissions measurement systems (PEMS). Sci. Total Environ. 2020, 710, 136366. [Google Scholar] [CrossRef]
  54. EU. Uniform provisions concerning the measures to be taken against the emission of gaseous and particulate pollutants from compression-ignition engines for use in vehicles, and the emission of gaseous pollutants from positive-ignition engines fuelled with natural gas or liquefied petroleum gas for use in vehicles. Off. J. Eur. Union 2011, 84, 3–19. [Google Scholar]
Figure 1. Engine test bench the experimental layout.
Atmosphere 13 01919 g001
Figure 2. WHTC test cycle: engine speed and torque profiles.
Atmosphere 13 01919 g002
Figure 3. Combined mean dimensionless PN and Soot results.
Atmosphere 13 01919 g003
Figure 4. Mean dimensionless PSDFs provided by the tested engine in the WHTC cycle (solid lines). Ref oil standard deviation during the tests (dotted lines).
Atmosphere 13 01919 g004
Figure 5. WHTC engine speed profile, PN, and Soot emitted engine-out in a typical test. PN and Soot are dimensionless.
Atmosphere 13 01919 g005
Figure 6. Combined dimensionless mean PN and Soot values collected in the “TWC” and “TWC + CPF” configurations and their corresponding standard deviations (orange vertical lines).
Atmosphere 13 01919 g006
Figure 7. The 900 rpm (a) and 1400 rpm (b) tests with torque variation over time. The black high-lighted steps refer to the pre-conditioning sections. The green dashed line divides phase 1 from phase 2.
Atmosphere 13 01919 g007aAtmosphere 13 01919 g007b
Figure 8. The 900 and 1400 rpm test dimensionless mean PN emissions for the “TWC” configuration related to the engine torque profile.
Atmosphere 13 01919 g008
Figure 9. The cumulative profile of the mean PN emissions over step load cycle, with and without the CPF; dimensionless values. At 900 rpm (a) and at 1400 rpm (b).
Atmosphere 13 01919 g009
Figure 10. Zoom of the typical PN emission profiles recorded during the step loads campaign at different phases.
Atmosphere 13 01919 g010
Table 1. The EURO VI pollutant emission limits for NG HD engines.
Carbon monoxide—CO [g/kWh]4.0
Non-methane hydrocarbons—NMHC [g/kWh]0.16
Methane—CH4 [g/kWh]0.5
Nitrogen oxides—NOx [g/kWh]0.46
Particulate matter—PM [g/kWh]0.01
Number of solid particles—PN [#/kWh]6.0 × 1011
Table 2. Main characteristics of the EURO VI NG HD experimental engine.
Engine TypeSix Cylinders in Line
Emission homologationEuro VI
Displacement5883 cm3
Bore102 mm
Stroke120 mm
Valves per cylinder2
Rated power and torque150 kW @ 2700 rpm
750 Nm @ 1500 rpm
Compression ratio10:1
Weight520 kg
Table 3. DMS 500 sensitivity (RMS at 1 Hz) according to the particle diameters.
10 nm1.0 × 103 (dN/dlogDp/cc)
30 nm4.0 × 102
100 nm1.7 × 102
300 nm8 × 101
Sensitivity to typical diesel
accumulation mode
(80 nm, σg = 1.8)
Number: ~170 N/cc
Mass: ~0.5 µg/m3
Indicates typical level at which lognormal mode falls below the detection threshold
Table 4. AVL Advanced Particle Counter technical characteristics and features.
Confirmed standardsUN/ECE-GRPE-PMP for sub-23 nm solid particle counting
Measuring range0–30,000 p/cm3 (single count mode)
Linear (R2 > 0.95) up to 50,000 p/cm3
Lower particle size limit10 nm (>50%)|15 nm (>90%)
Mean instrument response time (t90)4.5 s
Mean CPC sensor response time (t90)2.0 s
CPC readability0.1 p/cm3
CPC data reporting frequency10 Hz
Ambient temperature operation
conditions
5–25 °C
Ambient relative humidity conditions0–90% non-condensing
Table 5. Oil test matrix.
Tested OilsEngine ConditionDAY 1DAY 2DAY 3
Reference OilCold, Hot666
Oil 1Cold, Hot64/
Oil 2Cold, Hot64/
Table 6. Oil properties.
Features“Reference” OilOil 1Oil 2
SAE viscosity grade10W – 40W10W – 40W10W – 40W
Viscosity [mm2/s] @ 100 °C13.4913.813.53
Base oilAAB
Ash content10.51
Table 7. Candidates’ PN/Soot percentage reduction vs. the Reference oil.
CandidatesEngine ConditionPN Reduction [%]Soot Reduction [%]
Oil 1Hot3841
Cold2719
Oil 2Hot7178
Cold7084
Table 8. Steady state engine points for CPF characterization and the abatement efficiencies recorded.
Engine Speed (rpm)Torque (Nm)Load (%)Efficiency (%)
1000751598.1
10001503098.0
120030595.3
1200901598.8
12001803094.9
12002404097.6
Table 9. CPF WHTC test matrix.
ATS Config.Engine ConditionDAY 1DAY 2DAY 3
TWC Cold, Hot444
TWC + CPFCold, Hot444
Table 10. The CPF test characteristics valid for both 900 and 1400 rpm.
MagnitudePhase 1Phase 2
Load [%]2550
Load step length [s]3030
Tot. steps [#]88
Idle lengths [s]120; 240120; 240
Tot. length [s]18001800
Table 11. The CPF mean PN reductions for both phases of each test type.
TestPhasePN Reduction—Idle [%]PN Reduction—Load [%]
900 rpm198.496.6
299.195.2
1400 rpm198.995.8
299.694.6
Publisher’s Note: MDPI stays neutral with regard to jurisdictional claims in published maps and institutional affiliations.

