

A Climatological and Synoptic Analysis of Winter Cold Spells over the Balkan Peninsula

1
Department of Meteorology and Climatology, School of Geology, Faculty of Sciences, Aristotle University of Thessaloniki, 54124 Thessaloniki, Greece
2
Department of Geography, University of the Aegean, 81100 Mytilene, Greece
*
Author to whom correspondence should be addressed.
Atmosphere 2022, 13(11), 1851; https://doi.org/10.3390/atmos13111851
Submission received: 5 October 2022
/
Revised: 30 October 2022
/
Accepted: 31 October 2022
/
Published: 7 November 2022
(This article belongs to the Special Issue Climate Change and Climate Variability, and Their Impact on Extreme Events)
Abstract
:An extensive climatological and synoptic analysis of the winter cold spells that occurred in the Balkan Peninsula over a 59-year study period (1961–2019) is the aim of the present study. Winter cold spells (WCSPs hereafter) are defined as periods of at least three consecutive days when the daily minimum temperature is below the 5% of the empirical winter distributions. This diagnostic index is used to detect the occurrence of cold events during the study period, while the duration, frequency, and intensity of these extreme climate events are further analyzed. Moreover, in order to investigate the relation of the WCSPs with the atmospheric circulation, two daily circulation type calendars, derived from an advanced automatic flexible classification, were utilized. The automatic daily circulation type calendars were used, aiming at identifying the atmospheric conditions that prevail before or during WCSPs. The climatological analysis showed that the spatial distribution of the extreme minimum temperatures in the Balkan Peninsula presents a positive gradient from north to south, whereas coastal areas present more moderate minimum temperatures than inland areas of the region. In terms of WCSPs, the winter of 1962–1963 was the one with the longest WCSPs, for most of the stations under study. In general, a decreasing trend in the frequency of WCSP occurrence has been found towards the end of the study period. The circulation type investigation revealed that, during WCSPs in the Balkan region, the associated circulation at the 500 hPa is the Cne (cyclonic northeastern) and at the 1000 hPa is the Anw (anticyclonic northwest).
1. Introduction
In an ever-changing climate, understanding the natural processes that affect the occurrence of extreme temperature periods can be substantial, since these events can have serious effects, with a high impact for both society and natural environment [1,2]. In particular, winter extreme events can be related to cold spells or cold waves in some regions. A cold spell (CSP) is generally defined as a meteorological phenomenon with consecutive days of extremely low temperatures (NOAA). During the cold season of the year, the cold winter spells (WCSPs) are associated with severe weather events, such as snowfall and freezing temperatures. Difficulties in public health services, mortality of people and animals, natural disasters, and other socioeconomic impacts (transport, energy, agriculture, etc.) are some of the consequences of cold spells [3,4,5,6,7]. Therefore, the study of cold spell variability is of great importance. Moreover, the IPCC [8] reports that there are relatively few studies available that investigated the changes in the characteristics of CSPs.
In the second half of the 20th century, the northern hemisphere has been warmer than any other 50-year period in the last 500 years, with the highest warming observed in winter and spring [9]. Although the global warming shows a geographical diversity, studies have shown a generally negative trend in extreme cold temperatures and a positive trend in the warm ones, and [10,11,12,13] studied extreme temperatures in Europe and China, showing that the days with extreme cold temperatures decreased at a rate of at least 7% per century, while the days with warm extreme temperatures increased at a rate larger than 10%/century. Studies have shown that extreme events, such as cold spells, have declined significantly in recent decades [14,15] and are expected to be less severe in the future. This is attributed to global warming, due to the enhancement of the greenhouse effect [8]. In contrast, some studies show that, even though cold spells will be less frequent in the future, they remain equally intense [4,16]. According to previous studies, this is due to the fact that, although climate change is directly linked to more frequent and stronger extreme climate events, they will not necessarily lead into serious impacts [8], since the systems may be naturally resilient [17,18].
Southeastern Europe and, in particular, the Balkan Peninsula often experiences particularly low temperatures during winter [6]. According to Frich et al. [19], a global decrease in the occurrence of frost days (Tmin < 0 °C) is observed during the second half of the 20th century. Conversely, several studies showed that the days with Tmin < 0 °C in the Balkan’s peninsula presented significant positive trends from 1950 to 2000 [19,20]. Kostopoulou and Jones [20] estimated the annual and seasonal maximum number of cold days in the Eastern Mediterranean, indicating a decrease in the cold winter days by 4–6 days per decade in the western Balkan Peninsula, towards the end of the 20th century.
In the mid-latitudes, atmospheric circulation constitutes one of the determining factors of climate variability and most of the near-surface meteorological variables, e.g., of extreme temperatures [21,22]. Based on the literature, the occurrence of severe cold spells in Europe are mainly associated with persistent and repetitive circulations patterns that affect an area for extended periods of time, causing positive or negative anomalies in surface climate conditions [5,23]. Studies have shown an increase in the persistence of atmospheric circulation types over Europe since the mid-1980s [24]. As a result, many attempts have been made worldwide to investigate the relationship between atmospheric circulation and the occurrence of cold extreme events [5,7,21]. Previous research has shown that the circulation types that favor the cold spells are usually those with east and/or north flows, while both the anticyclonic and cyclonic types may prevail before the onset of a cold spell [7].
In the region of Europe, the processes driving extreme temperatures differ for summer (local processes) and winter (advection of cold air) [25]. During the winter, the climate is occasionally driven by the large-scale atmospheric circulation changes, resulting in colder conditions with northern flow from Scandinavia or northeasterly flow from Siberia [6]. These quasi-stationary larger scale circulation patterns are often referred to as “weather regimes” and can persist a few days or even a few weeks [26]. In addition, other studies have shown that extremely low temperatures are associated with atmospheric blocking over the Atlantic or Europe [27,28] or with cold air outbreaks (a displacement of polar or arctic air) over the northern [29] or southern hemispheres [30].
In this work, winter cold spells (WCSPs) in 25 Balkan stations were detected and studied for a period of 59 years (1961–2019). The main goal of this work is to study the spatio-temporal variability of WCSPs and to determine the types of atmospheric circulation that may contribute to their occurrence. In conclusion, the effect of the various types of atmospheric circulation on the occurrence of WCSPs in the Balkan region will be investigated, as well as whether there is a specific circulation type that is related to the above.
2. Data and Methodology
2.1. Study Area
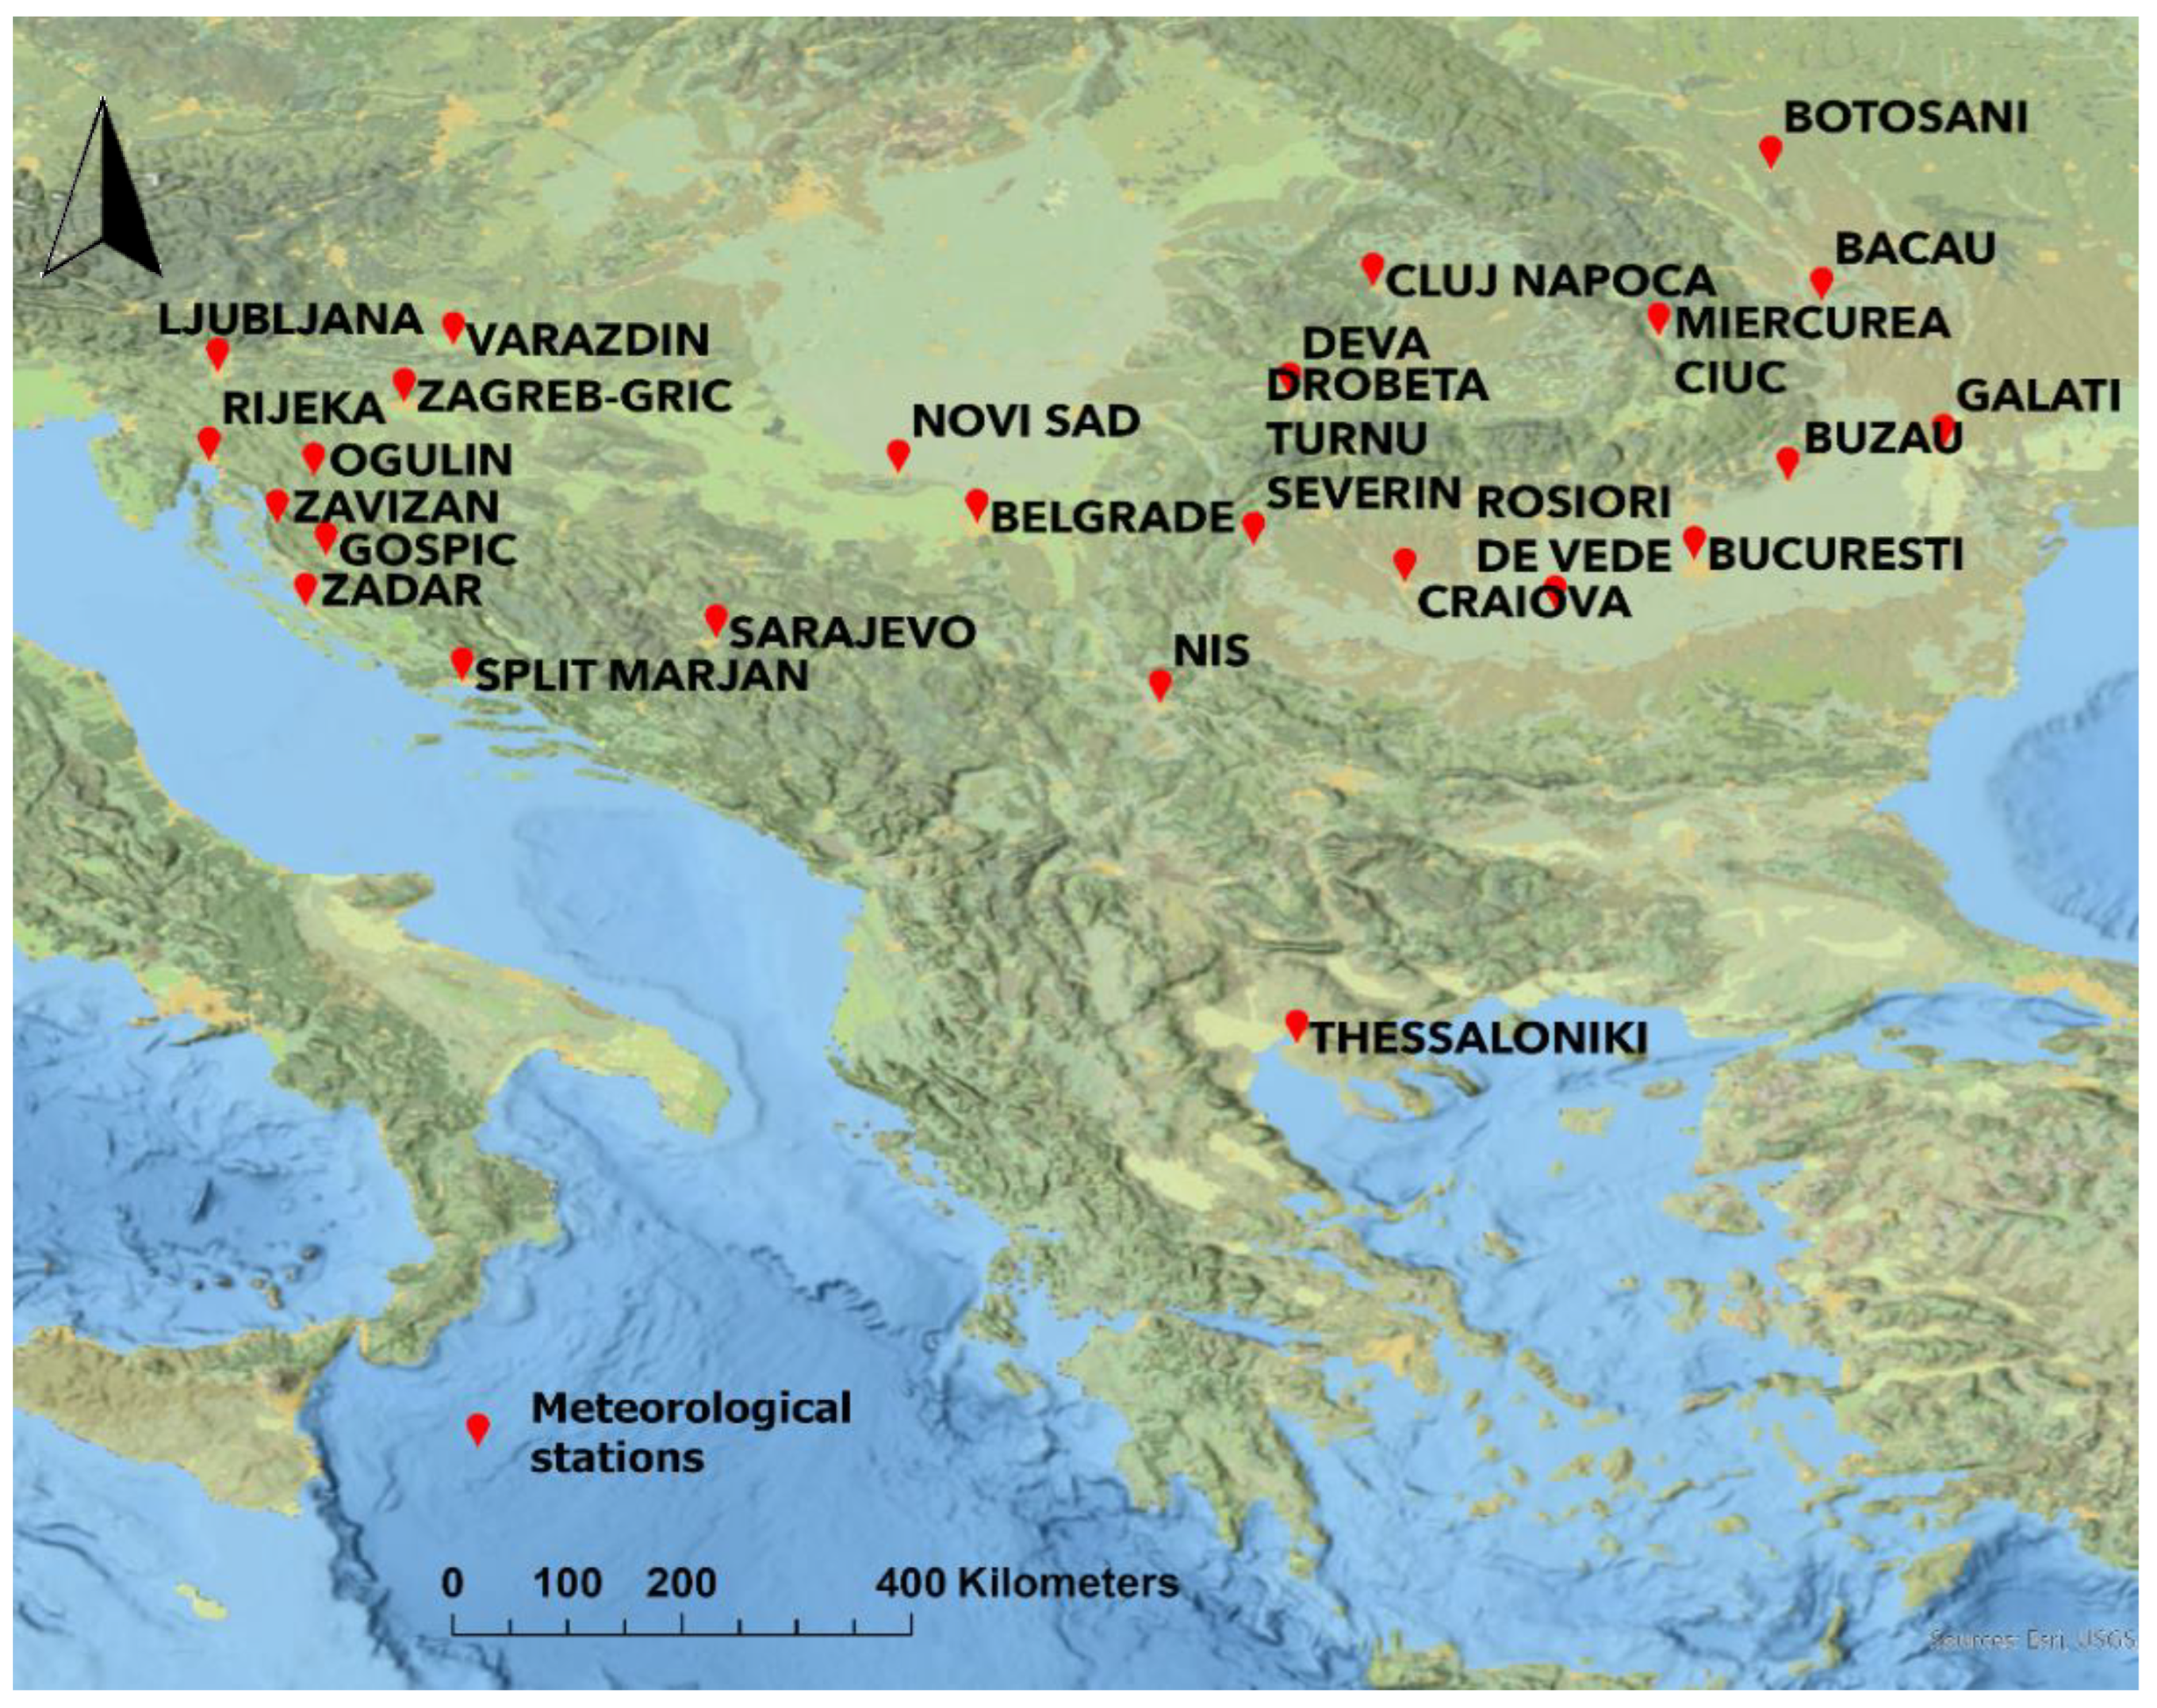
Southeastern Europe comprises the spatial domain of interest in this work, focusing on the Balkan Peninsula. Geographically, the Balkan Peninsula is bordered by the Adriatic Sea in the northwest, the Mediterranean Sea (including the Ionian and Aegean seas) and the Marmara Sea in the south, and the Black Sea in the east. In terms of climate, the coasts (Adriatic and Aegean coasts) are characterized as Mediterranean, while a mild continental climate is found mainly in the inland parts of the domain. In the northern mountainous part of peninsula, the winter is frosty and snowy, while in the southern part, the winter is usually milder. Summer is quite hot in all Balkan countries and can reach up to +40 °C. The selection of the stations was based on the availability of the ECAD database. The station network utilized in this study consists of 25 Balkan meteorological stations (Figure 1, Table 1): one (1) station from Bosnia and Herzegovina, one (1) station from Greece, eight (8) stations from Croatia, eleven (11) stations from Romania, three (3) stations from Serbia, and one (1) station from Slovenia.
2.2. Data
The World Meteorological Organization (WMO) has set the period of 30-years as the minimum study period to determine the climate of each region. In the present study, a long reference period of 59 years (1961–2019) (hereafter study period) was selected for the climatological analysis. To conduct the research daily minimum temperature (Tmin), daily maximum temperature (Tmax), and daily mean temperature (Tmean), datasets recorded at 25 stations under study were collected and processed. Data were freely downloaded from the European Climate Assessment and Database (ECAD, https://www.ecad.eu/, accessed on 10 December 2021) project database and the Aristotle University of Thessaloniki (AUTH).
2.3. Definition of Winter Cold Spells
The term cold spell is a widely used term in climatology, although there is no universal definition applicable to all regions of the planet. This is because CSPs depend directly on the characteristics of each geographical region, as well as the time of year. The World Meteorological Organization (WMO) underlines that CSP is generally a period during which temperatures are significantly lower than normal conditions. According to Tomczyk et al. [31], in contemporary climatological studies, CSPs are defined as a continuous sequence of several days, when air temperature is lower than a certain threshold value. The percentile value is considered the most popular method of determining the thresholds above or below which air temperature is considered extremely high or low [32,33]. These temperature thresholds provide an objective temperature criterion for different geographic regions and the time of year, too [34]. As for their minimum duration, in some studies around the world, this was defined as the period of at least three 3 consecutive days [5,7,31], and in others, the periods of 5 days [35], 6 days [36], and 11 days [37]. Their minimum duration of CSPs is different, depending on the geographical regions and on the objective of a given paper, too [31].
In the present study, the definitions were based on the percentages of empirical temperature distributions for the cold period of the year. The cold period of the year was considered as the 5-month period from November to March (NDJFM). WCSPs are defined as periods of at least three (3) consecutive days where the daily minimum temperature (Tmin) is below 5% (5th percentile) of the empirical cold period distributions (Tmin5th). The values of the percentile thresholds were determined from the observed Tmin series in the climatological 59-year period (1961–2019). By using the definition of Plavcová and Kyselý [7], it was considered that, while the first two (2) days of a WCSP should be cold days (i.e., two consecutive cold days), all subsequent cold days constitute a WCSP, as long as there is no break longer than one (1) day with Tmin below the threshold [7]. The next WCSP must begin at least two (2) days after the end of the previous WCSP. According to the authors of this study, this definition allows for a better distinction between the days before a WCSP and the first day of that WCSP.
This section may be divided by subheadings. It should provide a concise and precise description of the experimental results, their interpretation, and the experimental conclusions that can be drawn.
2.4. Characteristics of Winter Cold Spells
The main characteristics that define the cold spells, in general, are the following:
- Duration: the number of days between the beginning and the end of the WCSP.
- Intensity: the average anomaly of the minimum temperature during the WCSP.
- Frequency: the percentage of occurrence of WCSP during our long period.
- Seriousness: a measure that incorporates the intensity and persistence (duration) of the event, as well as their effects on both human society (public health, socio-economic impact) and the natural environment.
2.5. Characteristics of Atmospheric Circulation Types
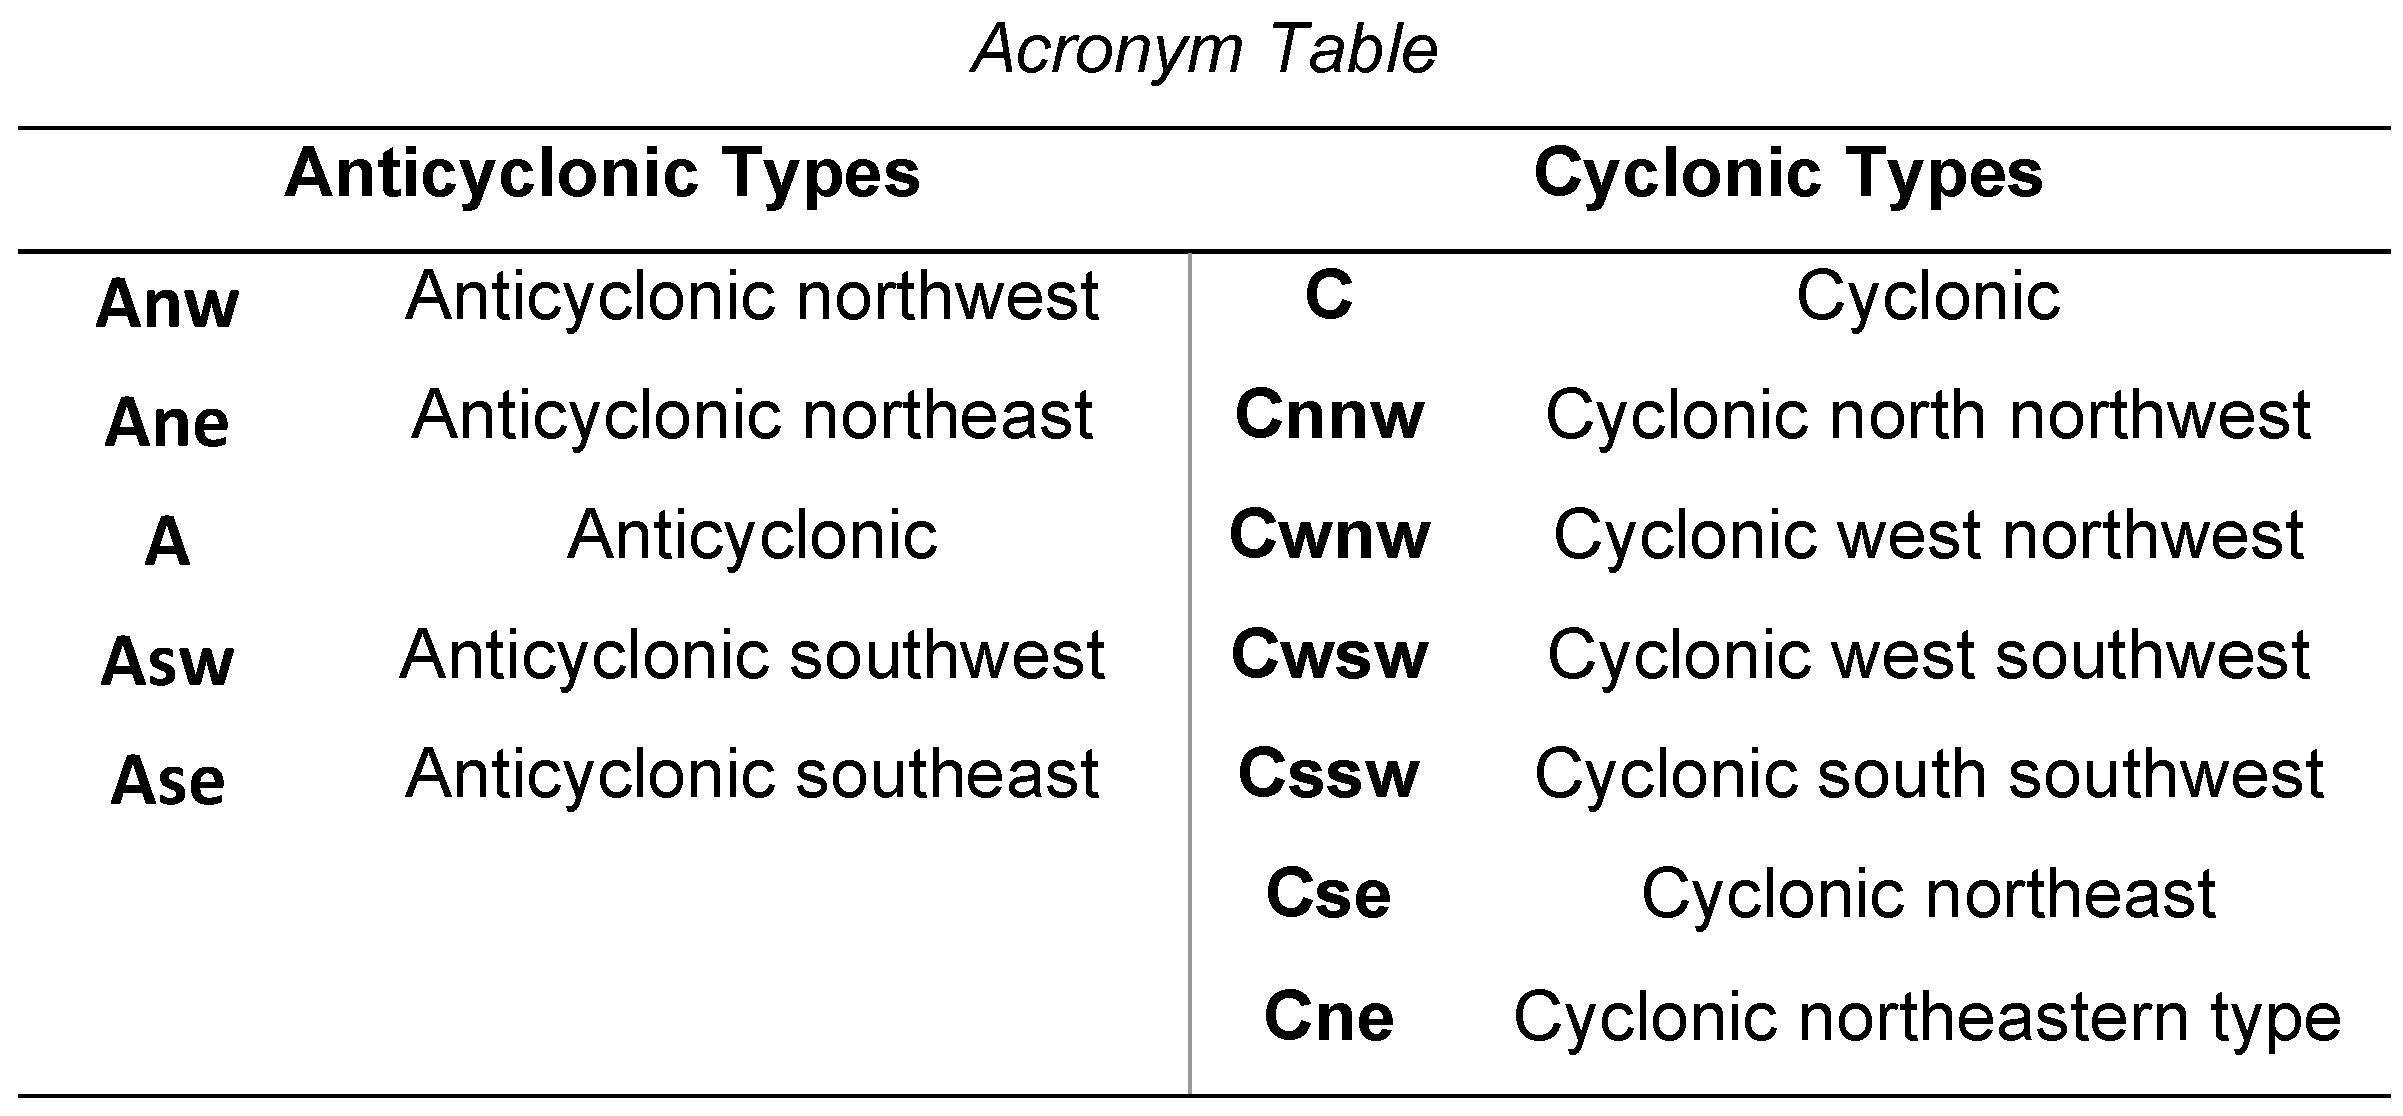
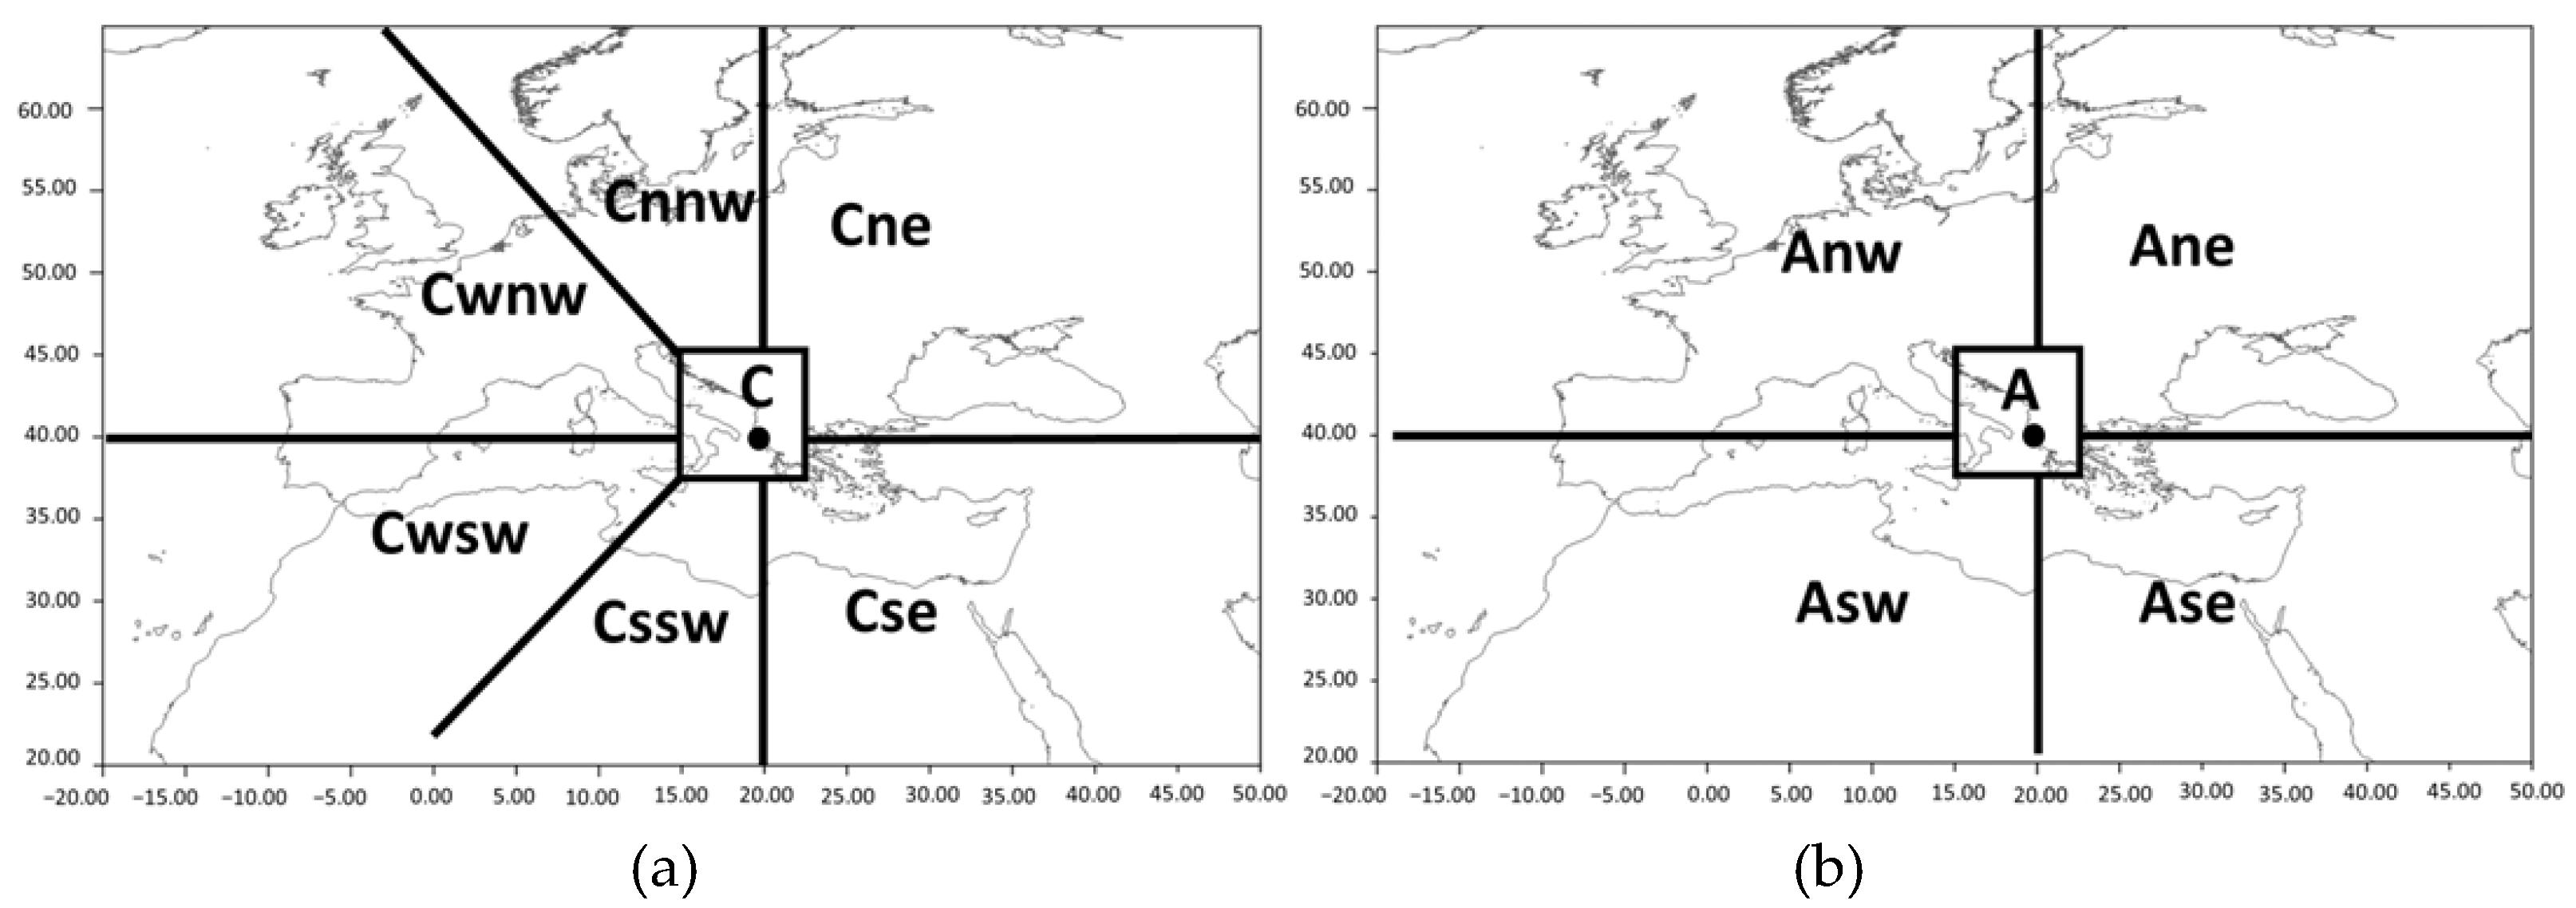
To investigate the relation of WCSPs with the atmospheric circulation, two daily circulation type calendars have been utilized. The circulation types have been derived from an automatic classification scheme, flexible over the areas of interest [38]. The automatic classification provides 12 circulation types, 5 anticyclonic circulation types (Anw, Ane, A, Asw, Ase), and 7 cyclonic circulation types (C, Cnnw, Cwnw, Cwsw, Cssw, Cse, Cne) (Figure A1). Based on the above automatic classification, two daily circulation type calendars were used, one for the area of Thessaloniki, which was located further south with a center of 25–37.5° (Figure A2), and one for the other stations centered at 22.5–42.5°. The circulation types that favor the WCSPs during the cold period for the reference period (1961–2019) were calculated based on their frequency of occurrence during the WCSPs. Respectively, the circulation types that favor the start of the WCSPs were calculated based on their frequency of occurrence, one and two days (day-1, day-2), before the start of each WCSP.
3. Results
3.1. Climatology
3.1.1. Extreme Minimum Temperatures for the Study Period 1961–2019
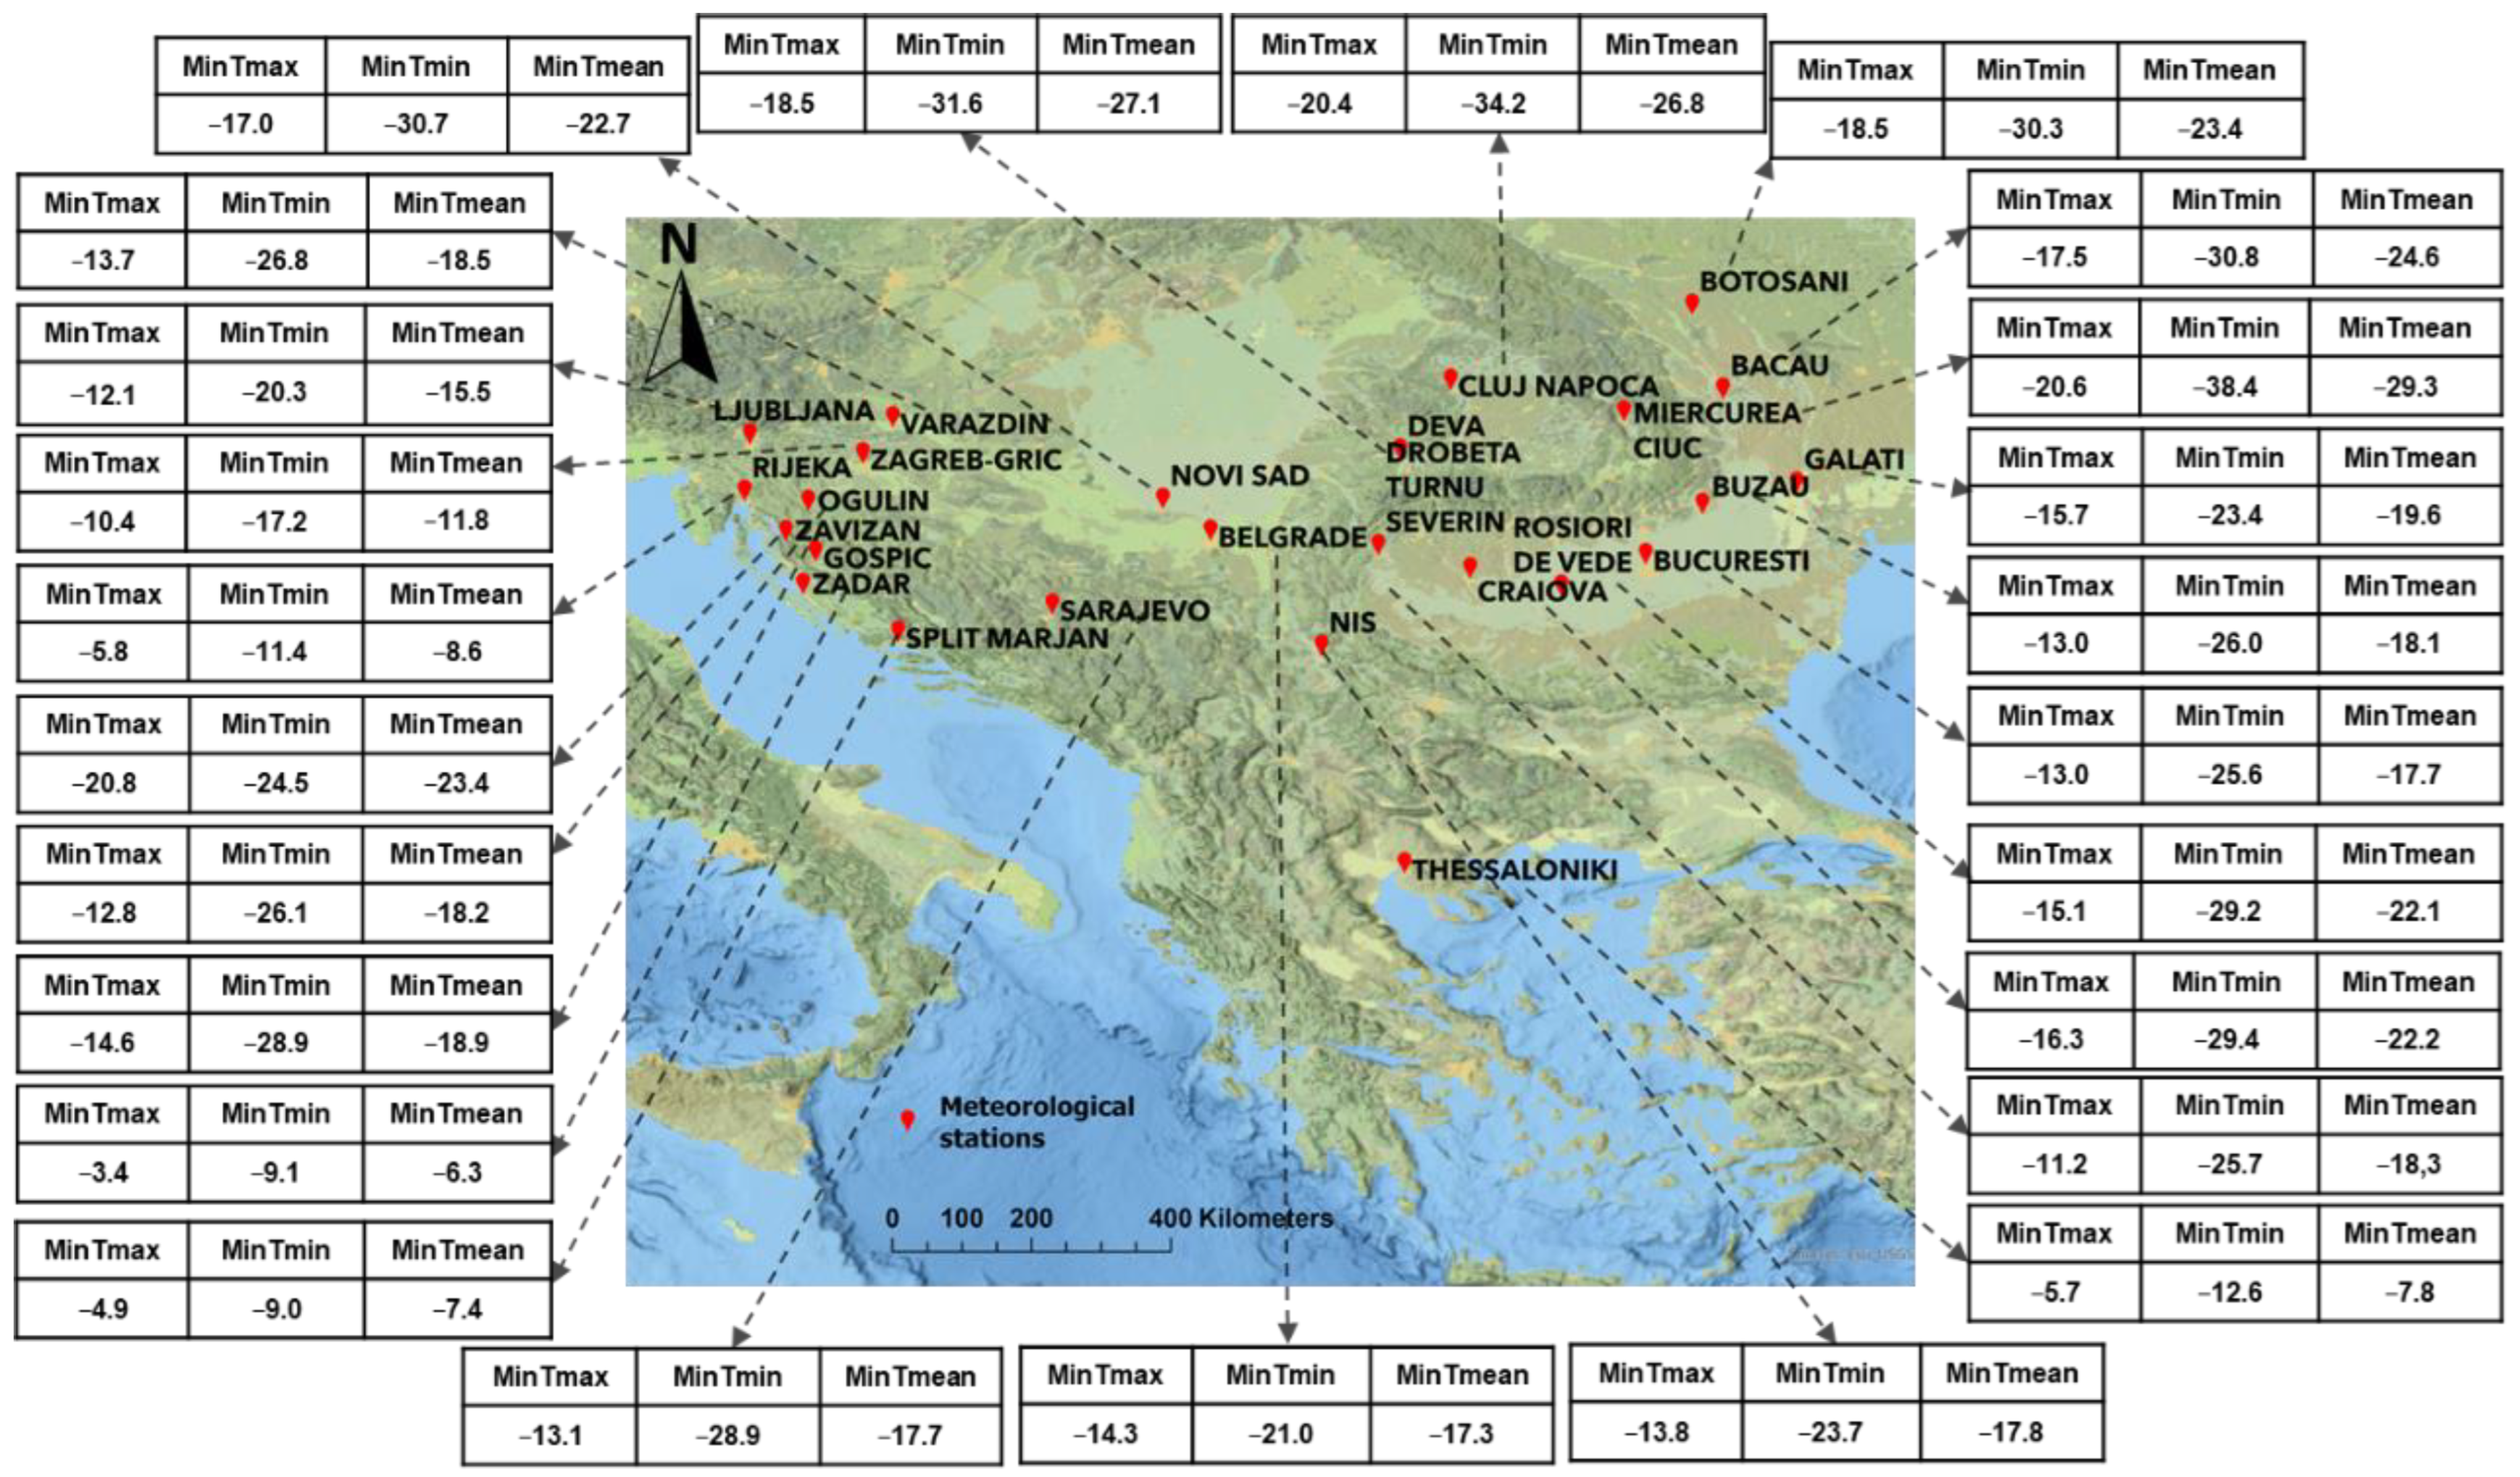
In this section, temperature daily data were used for the analysis of the extreme minimum temperatures of the 25 Balkan stations for the reference period. Figure 2 shows the most extreme minimum temperatures values recorded at the stations during the cold period of the year (NDJFM). Initially, it was observed that the northern stations have recorded the lowest temperatures. Zavizan station (Croatia, 1594 m) recorded the most extreme MinTmax, with a value of −20.8 °C. The most extreme MinTmin and MinTmean were recorded at Miercurea (Romania, 661 m) station, with values −38.4 °C and −29.3 °C, respectively. On the contrary, the least extreme minimum temperatures were recorded at Zadar station, with MinTmax −3.4 °C and MinTmean −6.3 °C, and at Split station, with MinTmin −9.0 °C. The spatial distribution of the extreme minimum temperatures in the Balkan Peninsula shows a positive gradient from north to south and from the peninsula’s center to its coastlines.
The extreme temperature values indicate the range in temperature in a region, but they cannot give clear insight into the climate conditions that prevail during that time. This is due to the fact that an extreme value may have resulted from a random meteorological phenomenon and does not represent the predominant atmospheric conditions over this area. For this reason, in this section, seventy-five diagrams were created (three for each station), illustrating the extreme minimum temperatures (MinTmax, MinTmin, MinTmean) recorded by each station per year (calendar year) for the cold period of the year in the reference period 1961–2019.
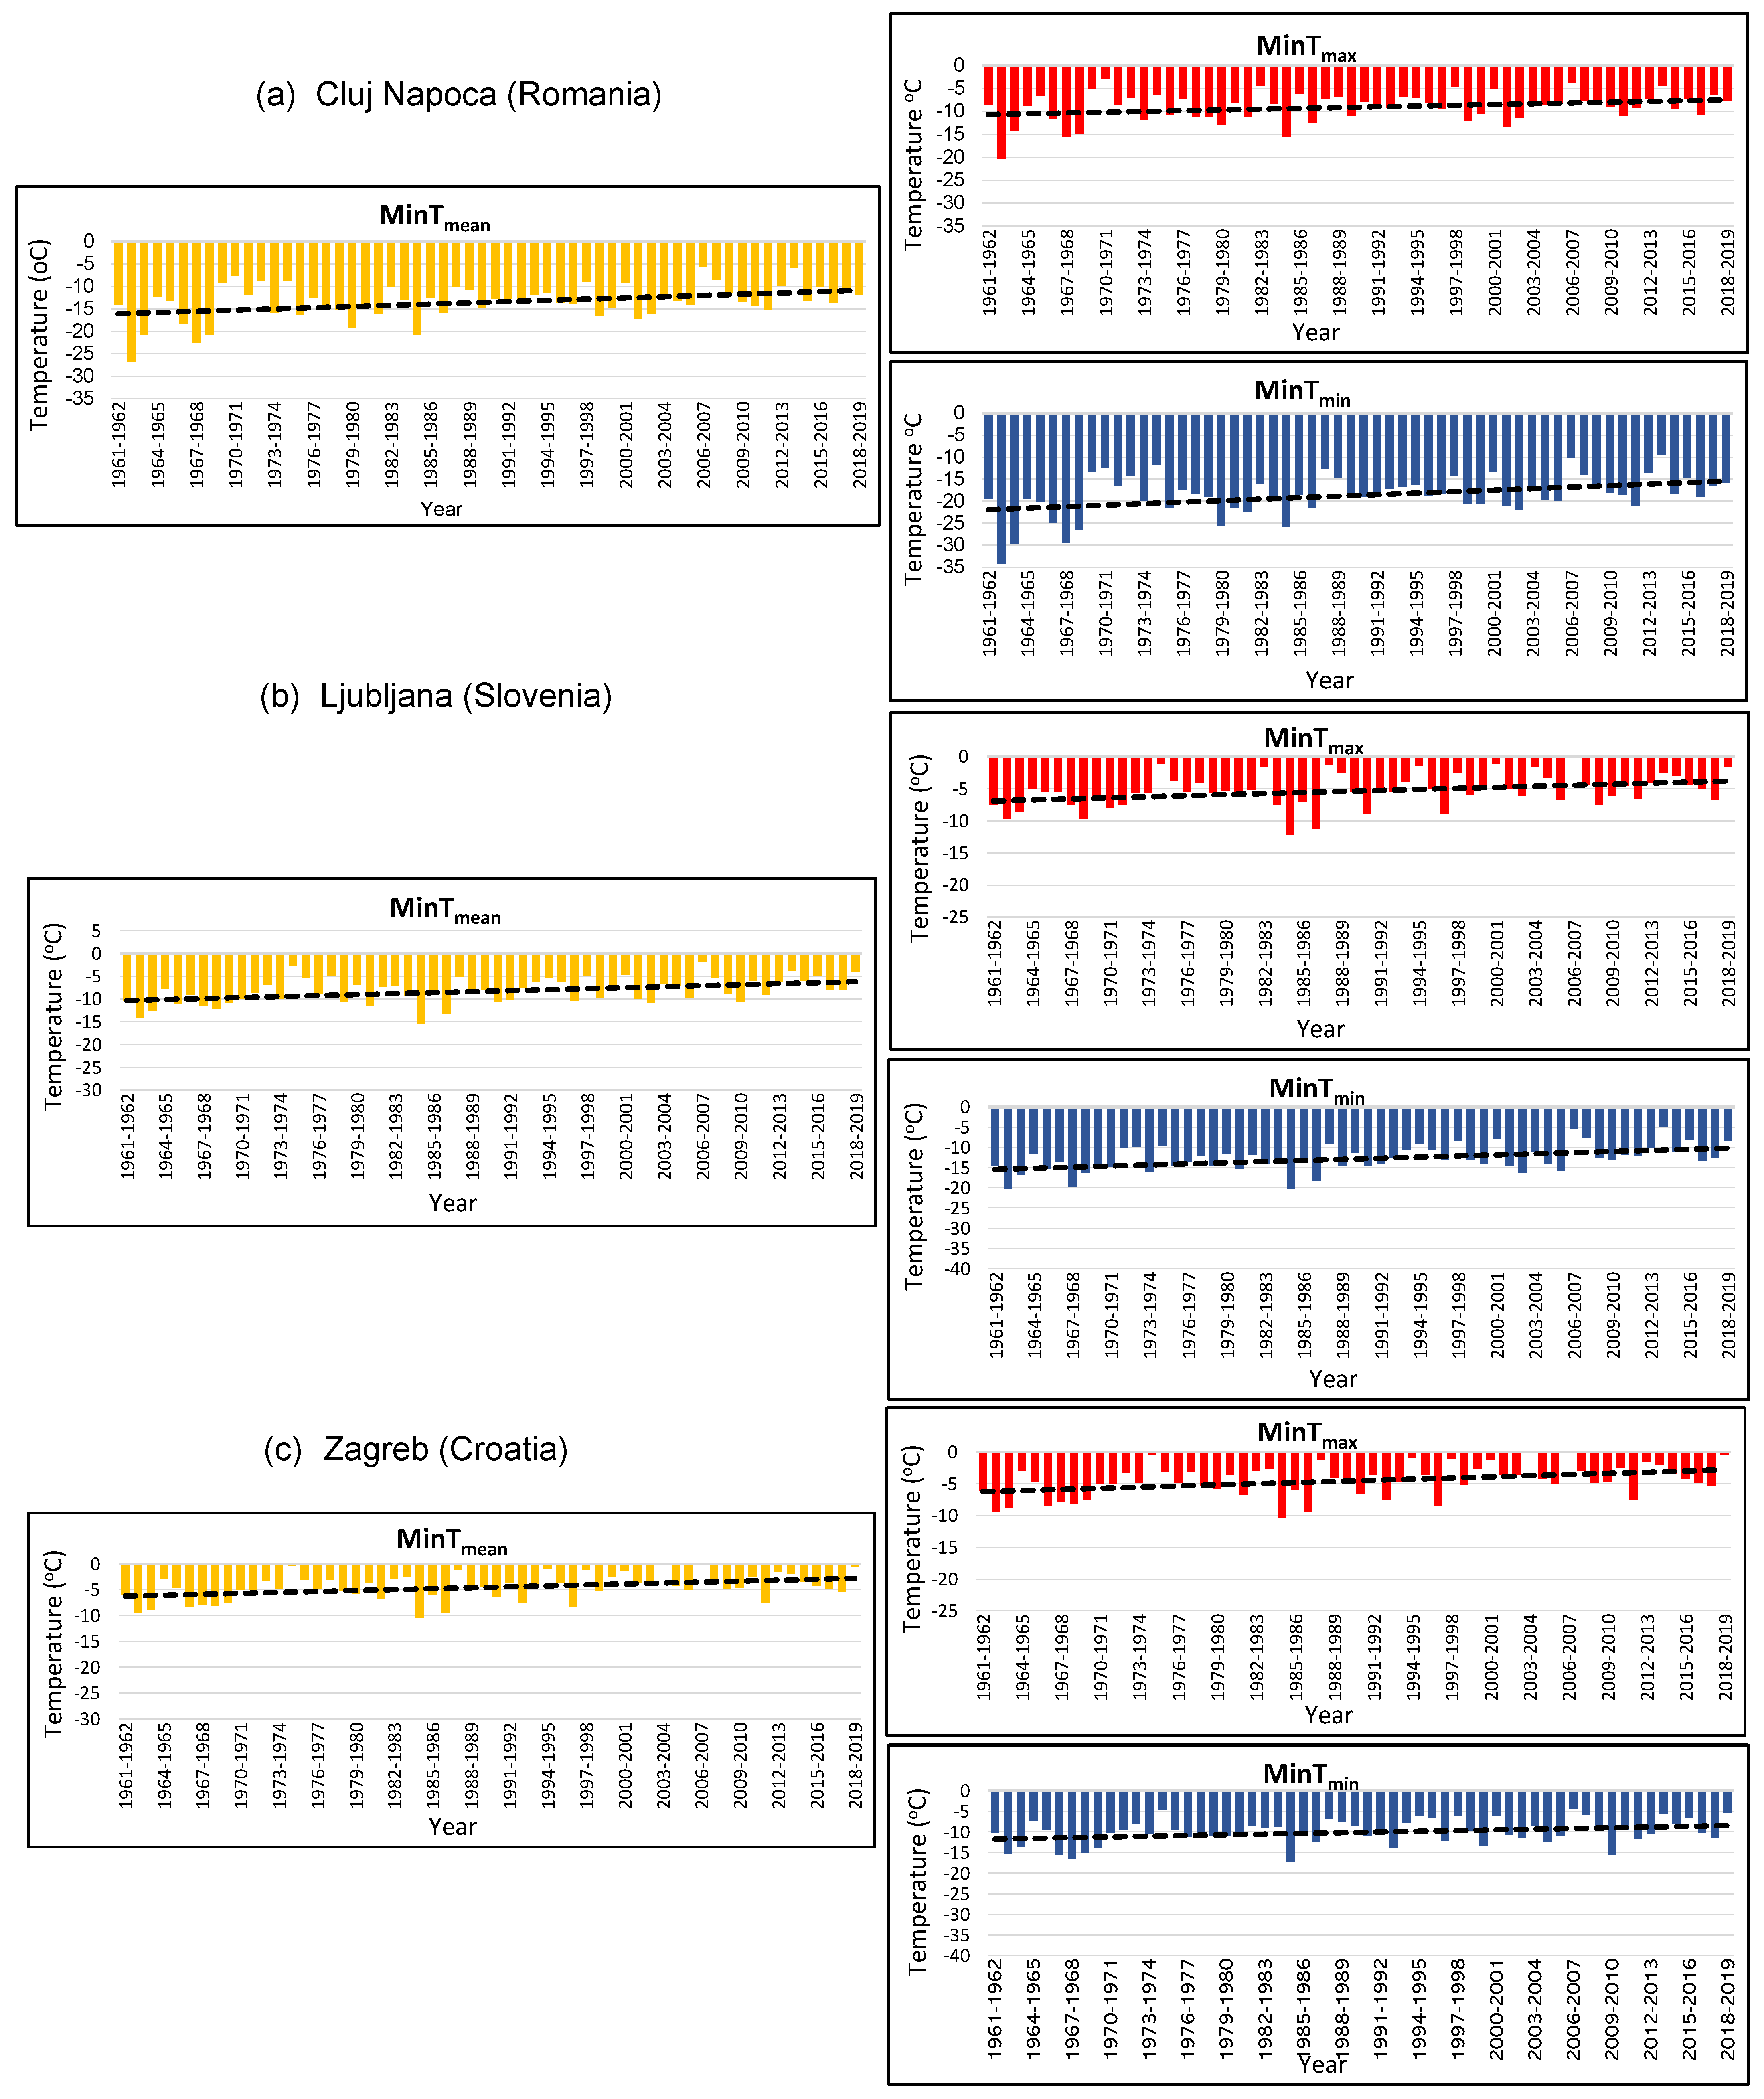
Generally, it was observed that, in the majority of the stations, the extreme minimum temperatures were higher, resulting in less extreme meteorological phenomena that were not so extreme. However, in order to analyze the linear trend of the most extreme minimum temperatures per year (MinTmax, MinTmin, MinTmean), the nonparametric Mann–Kendall test [39] was applied. The results showed that not all stations are characterized by a statistically significant trend. Figure 3 presented the temporal analysis of the most extreme minimum temperatures per year for the stations with a statistically significant trend, as revealed by the Mann–Kendall test. Three of the twenty-five stations show a statistically significant positive trend. These stations are: the Napoca, the Ljubljana, and the Zagreb station. Yan et al. (2002) and Klein Tank and Können [13,36] who analyzed the changes in extreme temperatures over long time series in European stations had found similar results and concluded that cold extremes have been decreasing and warm extremes have been increasing during recent decades. These indications are due, in part, to climate change causing less serious and persistent cold events, or even to a diminution of their occurrence.
More specifically, in the multi-annual course, the most extreme MinTmax was recorded at the station of Zavizan (Croatia, 1594 m) in the year 2011–2012 (4 February 2012), with a temperature value of −20.8 °C (not shown). On the other hand, the least extreme MinTmax was recorded during the year of 2006–2007 at Split (Croatia, 122 m) (not shown), with a temperature value of 8.1 °C. Regarding the most extreme MinTmin and MinTmean, these were recorded at the Miercurea station in the winter of 1984–1985 (14 January 1985), with temperature values of −38.4 °C and −29.3 °C, respectively. The least extreme MinTmin was recorded, as in the case of MinTmax, in the year 2006–2007, but this time at Zadar station (Croatia, 5 m) (2.2 °C). Respectively, in the same year, the least extreme MinTmean was also recorded at the Croatian stations (Split and Zadar), with 5.3 °C.
3.1.2. Days of Partial and Total Frost
Additionally, the days with Tmin ≤ 0 and the days with Tmax ≤ 0 were calculated for each station for the 59-year period. Table 2 shows the average number of days, with Tmin ≤ 0 and Tmax ≤ 0 per year for each station. In total, for all stations, the range of days with Tmin ≤ 0 per year varied from 7 to 135 days, while the days with Tmax ≤ 0 varied from 0 to 63 days, respectively. In specific, the station with the lowest number of days with Tmin ≤ 0 was the station of Split (7 days), while the station with the highest number of days was the station of Miercurea (135 days). Respectively, the stations without days with Tmax ≤ 0 were mainly the stations of Split and Zadar, while the station with the highest number of days was the station of Zavizan (63 days).
3.2. Winter Cold Spells
WCSPs lasting at least three consecutive days were computed and analyzed in this section. The threshold that would distinguish the days with extreme minimum temperatures from the rest was an important factor in determining the WCSPs. As mentioned above, the fifth percentile was selected for this determination. The results found, as well as some statistical characteristics of WCSPs, are presented in Table 3. The station with the most extreme Tmin5th was Miercurea (Tmin5th = −22.5 °C), which indicates the very cold temperatures that prevail in this area during the cold period of the year. All the other stations were characterized by higher Tmin5th values (−22.5 °C < Tmin5th ≤ 0.3 °C). Consequently, having determined the Tmin5th of each station, the WCSPs were detected. The results show that the number of WCSPs during the reference period varied from 46 WCSPs at Ogulin to 66 WCSPs at Miercurea station. The mean duration of the WCSPs ranged from 4.1 days (Varazdin) to 5.6 days (Belgrade). The longest WCSP lasted 24 days and took place at the Belgrade station in 1962–1963. In the same year, the majority of the stations recorded the longest WCSPs.
Temporal Analysis of WCSPs
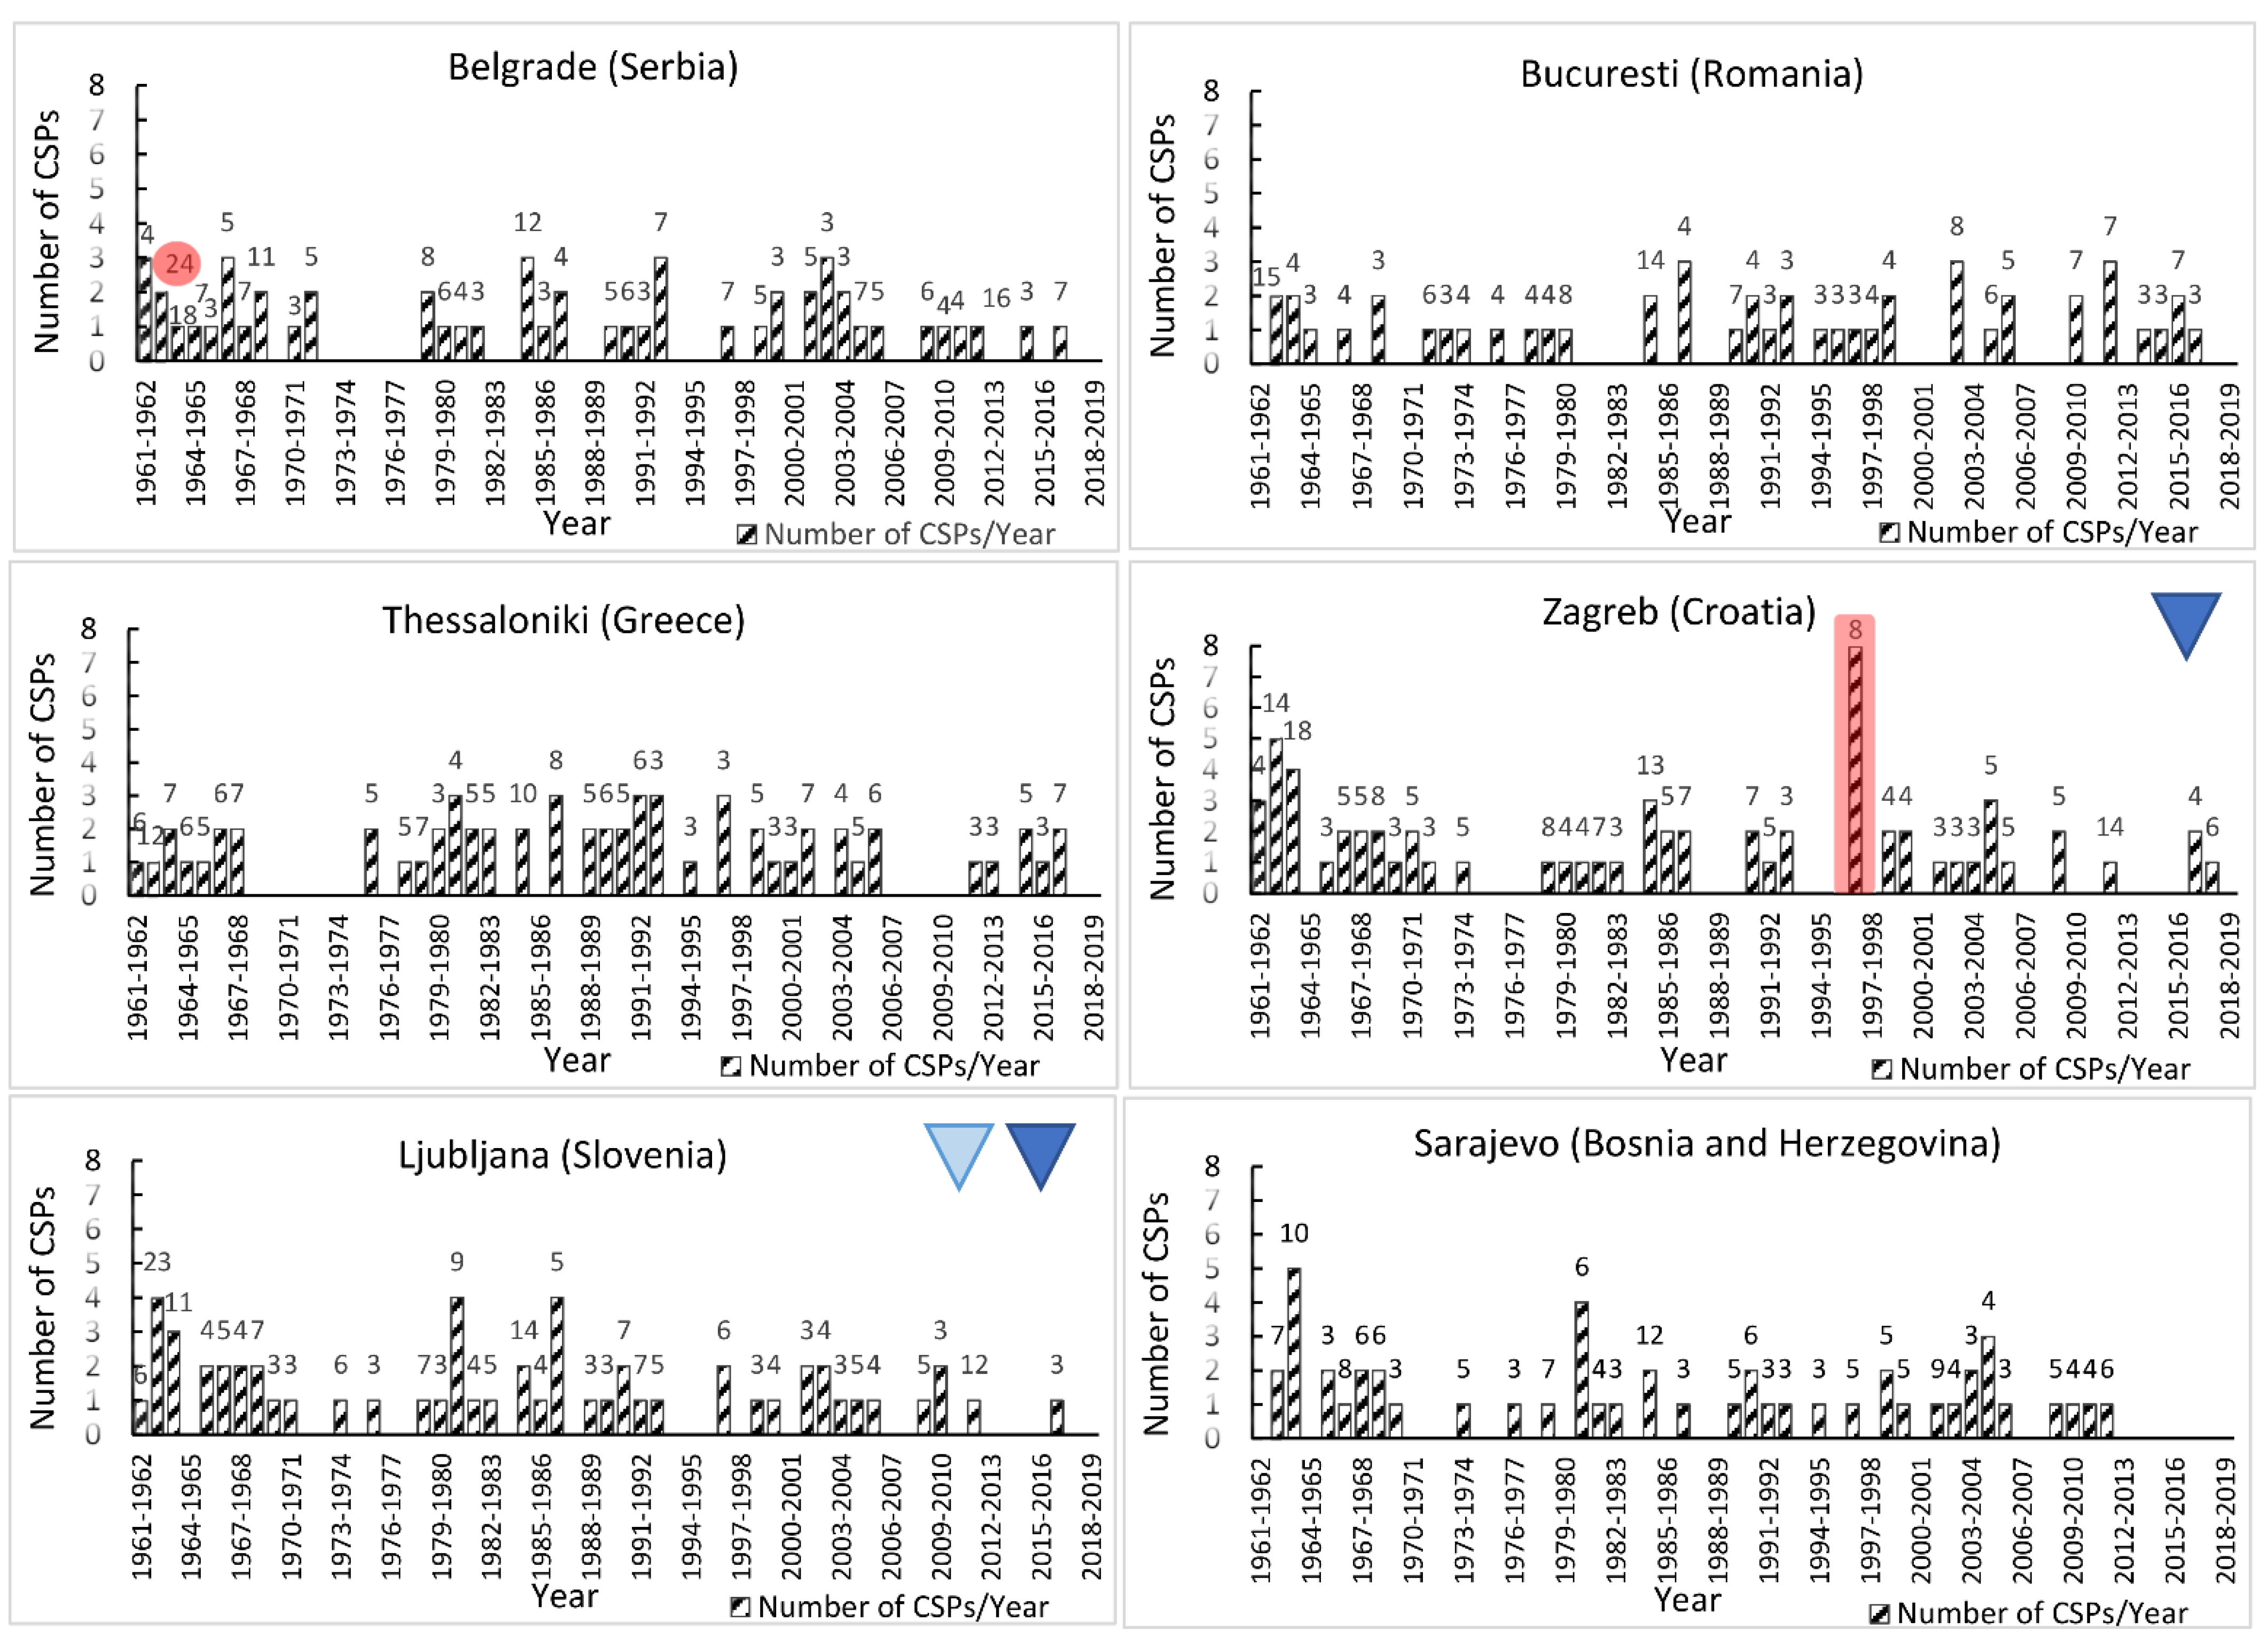
In the next step, diagrams (one for each meteorological station) were created to illustrate the number of detected WCSPs per year and the duration of the longest WCSPs per year for the reference period. Six representative stations were selected: the capital of each Balkan County and the station of Thessaloniki from Greece. Figure 4 shows the temporal analysis of WCSPs for the six representative stations. Each bar represents the number of WCSPs that took place in that year. Respectively, the numbers above the bars indicate the number of days of the longest WCSP of the respective year. Additionally, statistically significant decreasing trends, as they emerged from the non-parametric Mann–Kendall test, are represented by downward triangles.
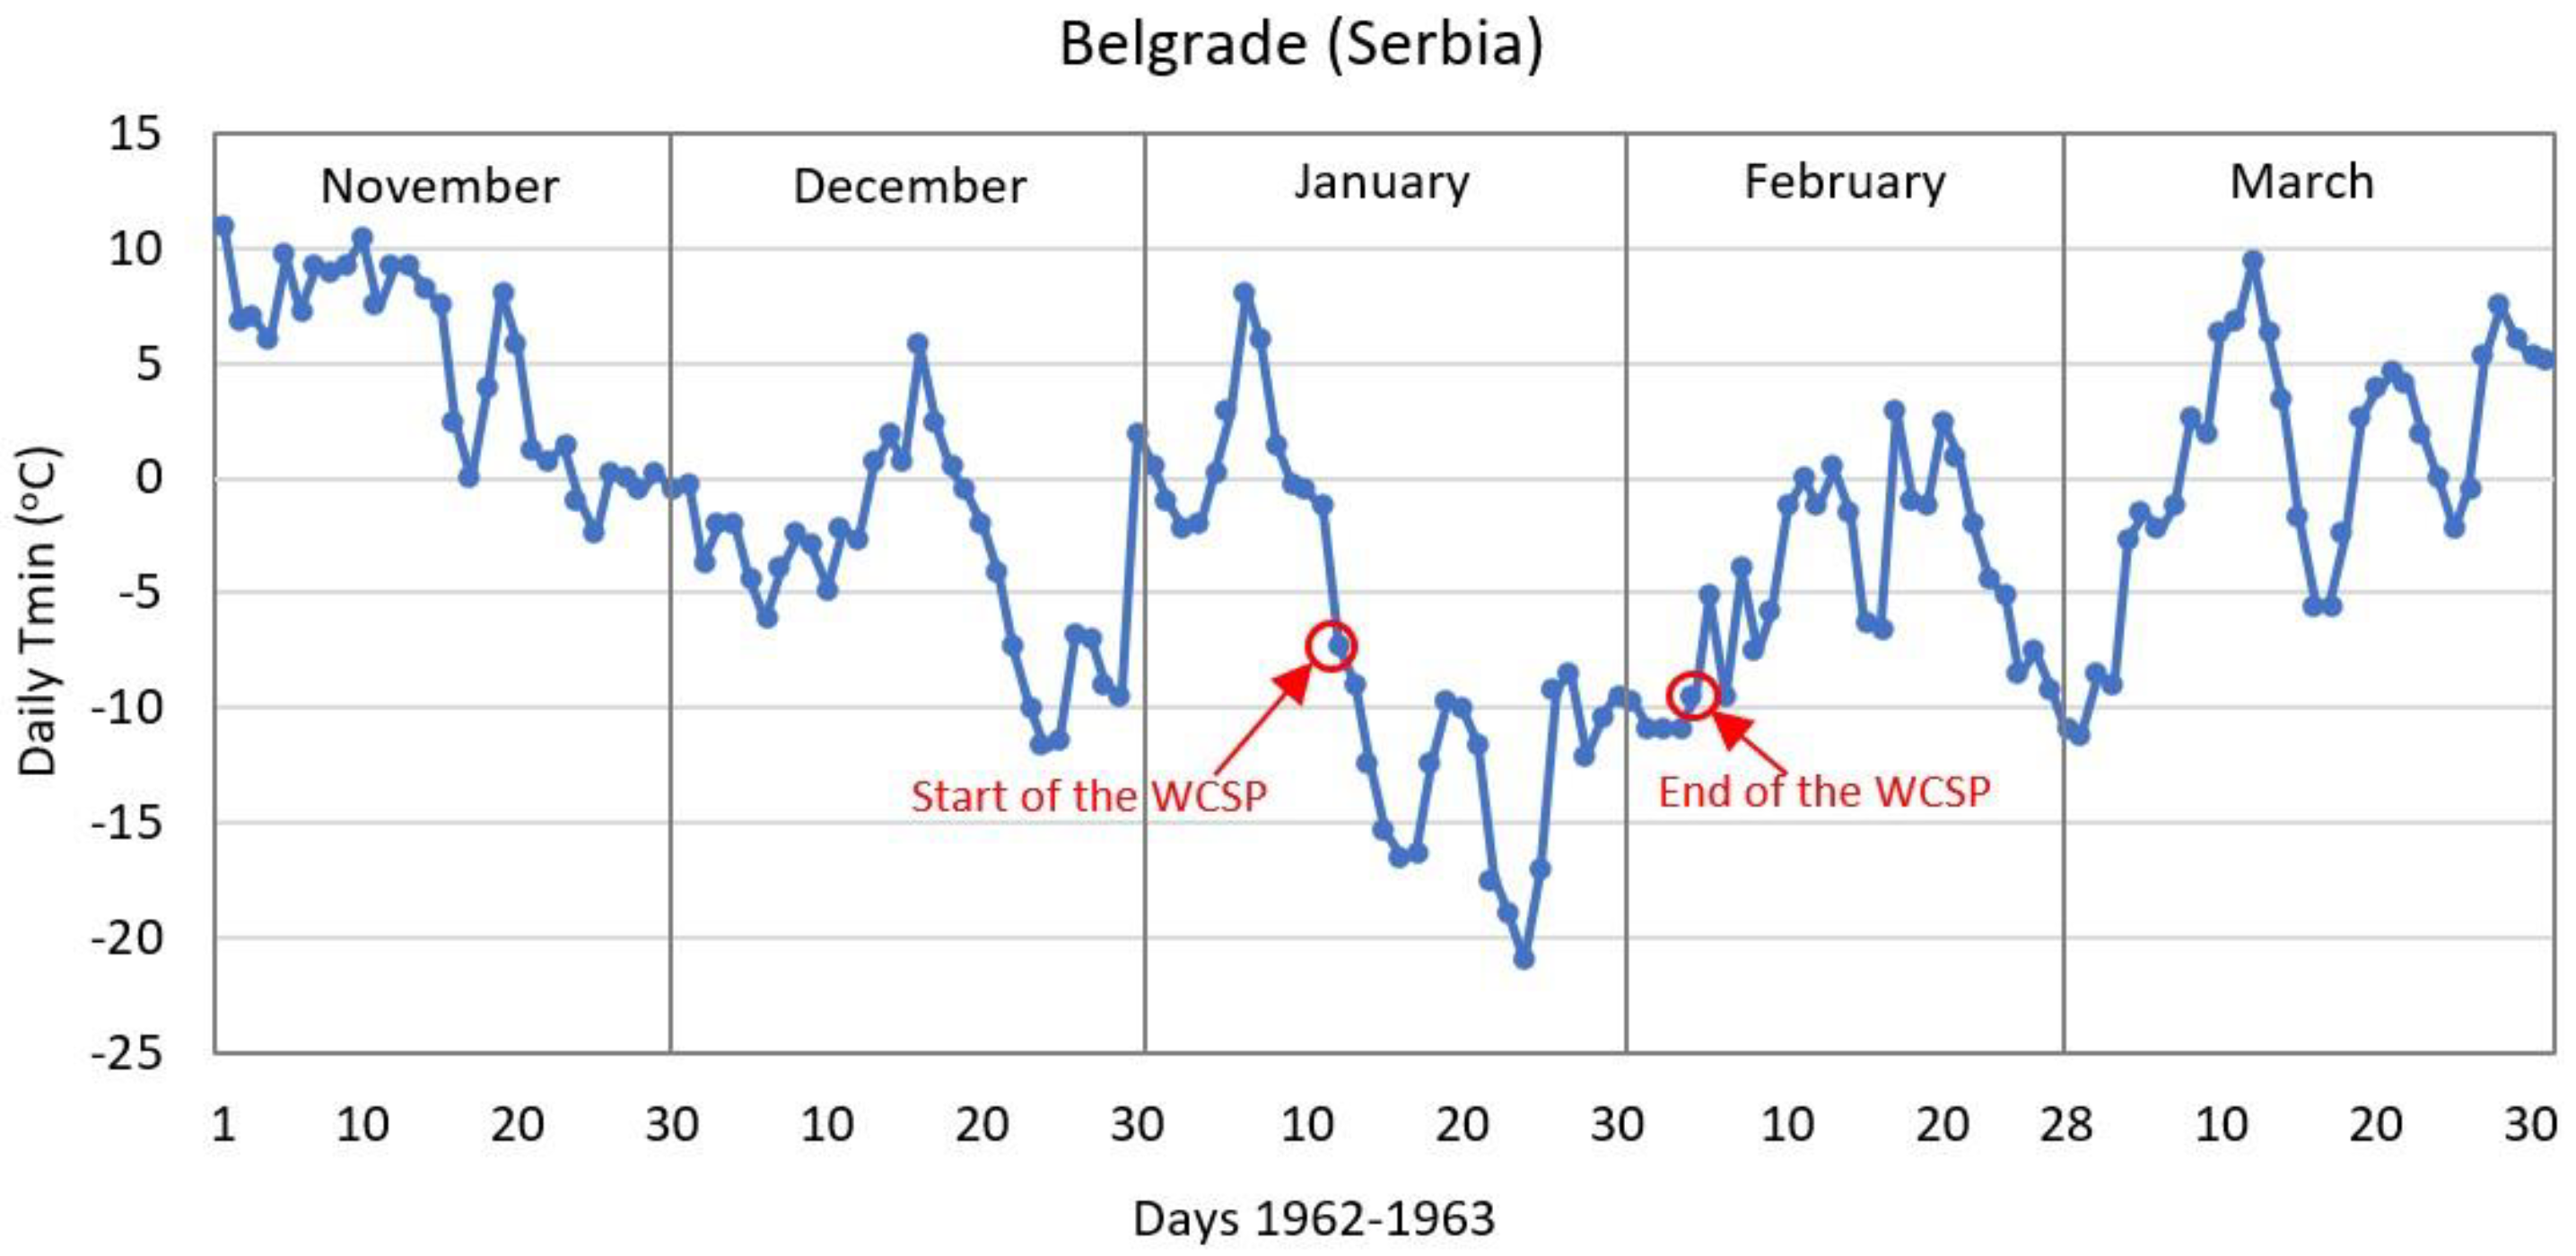
The temporal analysis of WCSPs for the 59-period showed that the range of WCSPs per year varies from 0 to 8 WCSPs/year. The station that presented eight WCSPs in one year is the northwest station of Zagreb (Croatia, 156 m) (right panel), in the year 1996–1997. As mentioned in the previous paragraph, the longest and most intense WCSP was recorded in Belgrade (Serbia, 132 m) (left panel), with 24 days of extreme temperatures, in the year 1962–1963. Figure 5 shows that this WCSP began on 12 January 1963 and ended on 4 February 1963. During this WCSP, the Belgrade station recorded its most extreme minimum temperatures, with the values illustrated in Figure 2: MinTmax −14.3 °C, MinTmin −21.0 °C, and MinTmean −17.3 °C. Unkašević and Tošić [35], in their own study on the seasonal analysis of cold and heat waves in 15 meteorological stations of Serbia during the period 1949–2012, showed that the longest cold waves were observed in 1956 (duration < 22 days) and in 1954 (duration > 220 days), while the most severe cold waves were registered in 1956.
Generally, there was a decreasing number of cold spells and their duration in most stations (Figure 4), as can be expected from the ongoing warming of the climate. However, the non-parametric Mann–Kendall test was applied to both the characteristics of cold spells and the results shown: (1) a statistically significant negative trend in the number of cold spells per year at the stations: Ljubljana, Split, Zadar, Zagreb, and Zavizan, and (2) a statistically significant negative trend in the duration of cold spells at the stations: Cluj Napoca, Ljubljana, and Varazdin. Malinovic-Milicevic et al. [40], in their study on changes in climate extreme indices in Serbia from 1961 to 2010, showed that the time periods of extremely hot weather lasted longer, while the periods of extremely cold weather decreased.
On the other hand, the Bucharest station (Figure 4) has an increasing number of cold spells, but without being statistically significant. However, the increase of temperature in the region of Romania during the winter was most evident in the western Romanian Carpathian Mountains and in northeastern Romania during the period 1961–2000 [41], 1961–2003 [42], and 1961–2010 [43]. A more recent study of 150 meteorological stations in Romania showed that the duration of cold spells (CSDI) significantly decreased, but only over limited areas in the central part of Romania [44].
3.3. Atmospheric Circulation Characteristics: The Prevailing Circulation Type
The Prevailing Circulation Types during and before the WCSPs
The relationship between WCSPs and the atmospheric circulation types was investigated using two circulation type calendars derived from an automatic flexible classification, according to Anagnostopoulou et al., 2009 [38] (an example of the location of centers in Figure A2). The percentage of days (%) of occurrence of the circulation types per station during the WCSPs at 500 hPa and 1000 hPa are presented in Table 4.
Circulation types that favor the WCSPs were detected based on the frequency of a given type before (day-1, day-2) or during the WCSPs at both of the geopotential heights (500 hPa, 1000 hPa). Table 4 summarizes the frequencies of the circulation types only for the most prevalent circulation types. Additionally, Table 5 summarizes the percentage of stations with the most prevalent circulation types. The results showed four circulation types that seem to predominantly cause the WCSPs of the Balkans (Table 4). During the WCSPs at 500 hPa, it is obvious that WCSPs are associated with the predominance of two cyclonic circulation types. A total of 56% of stations attribute the WCSPs to Cne type, while 44% of stations attribute the WCSPs to Cse type. These two types recorded high percentages of days (%) of occurrence, such as the Cse type at the Cluj Napoca station with a rate of 29.5%. (Table 4). The other 10 circulation types recorded a percentage of days less than 11.4% at 500 hPa. In contrast to 500 hPa at 1000 hPa, the WCSPs were associated with the predominance of two anticyclonic circulation types and less with a cyclonic type. Moreover, 48% of stations were attributed the WCSPs types to the Anw type, while 32% of stations were attributed to the Ane type, and the remaining percentage corresponded to the Cse type. Regarding the circulation types that prevailed 1 and 2 days before the start of WCSPs and seemed to favor their appearance, the results show that, at 500 hPa for day-1 and day-2 in 68% and in 76% of the stations, respectively, the type that prevailed is the Cne type, while the second most prevalent was the Cse type. In fact, the percentage of days of occurrence of this type was quite high, reaching 40.7%, as seen in the case of day-1 at Rijeka station. Respectively, at 1000 hPa, day-1 and day-2, before the start of WCSP in 64% of the stations (day-1) and in 68% of the stations (day-2), the cyclonic southeastern type (Cse) had the highest incidence.
Additionally, for the types that seem to cause the WCSPs in the Balkans, their frequency was studied during the period under study. The results from the non-parametric Mann–Kendall test showed that at 500 hPa the Cse and Cne types most associated with WCSPs show a statistically significant negative trend. This could partly explain the decrease in the number of WCSPs over time, as discussed in the previous paragraph. However, at 1000 hPa, the Anw type showed a statistically positive trend, while the Ane type does not show any statistically significant trend.
3.4. Synoptic Analysis
The anomalies of the geopotential heights of the prevailing circulation types during the WCSPs at both of heights (500 hPa, 1000 hPa) were examined. The analysis was performed for the types with the highest frequency of occurrence, i.e., the cyclonic Cne type at 500 hPa and the anticyclonic Anw type at 1000 hPa. Primarily, the geopotential anomalies (500 hPa and 1000 hPa) of the predominant circulation types during the cold days of WCSPs were studied and compared with the anomalies in the mean synoptic situation of these types (average map of anomalies) (for all stations) (Figure 6 and Figure 7). The differences that arose, in relation to the anomalies in the mean synoptic situation at 500 hPa, are presented for some indicative stations in Figure 8.
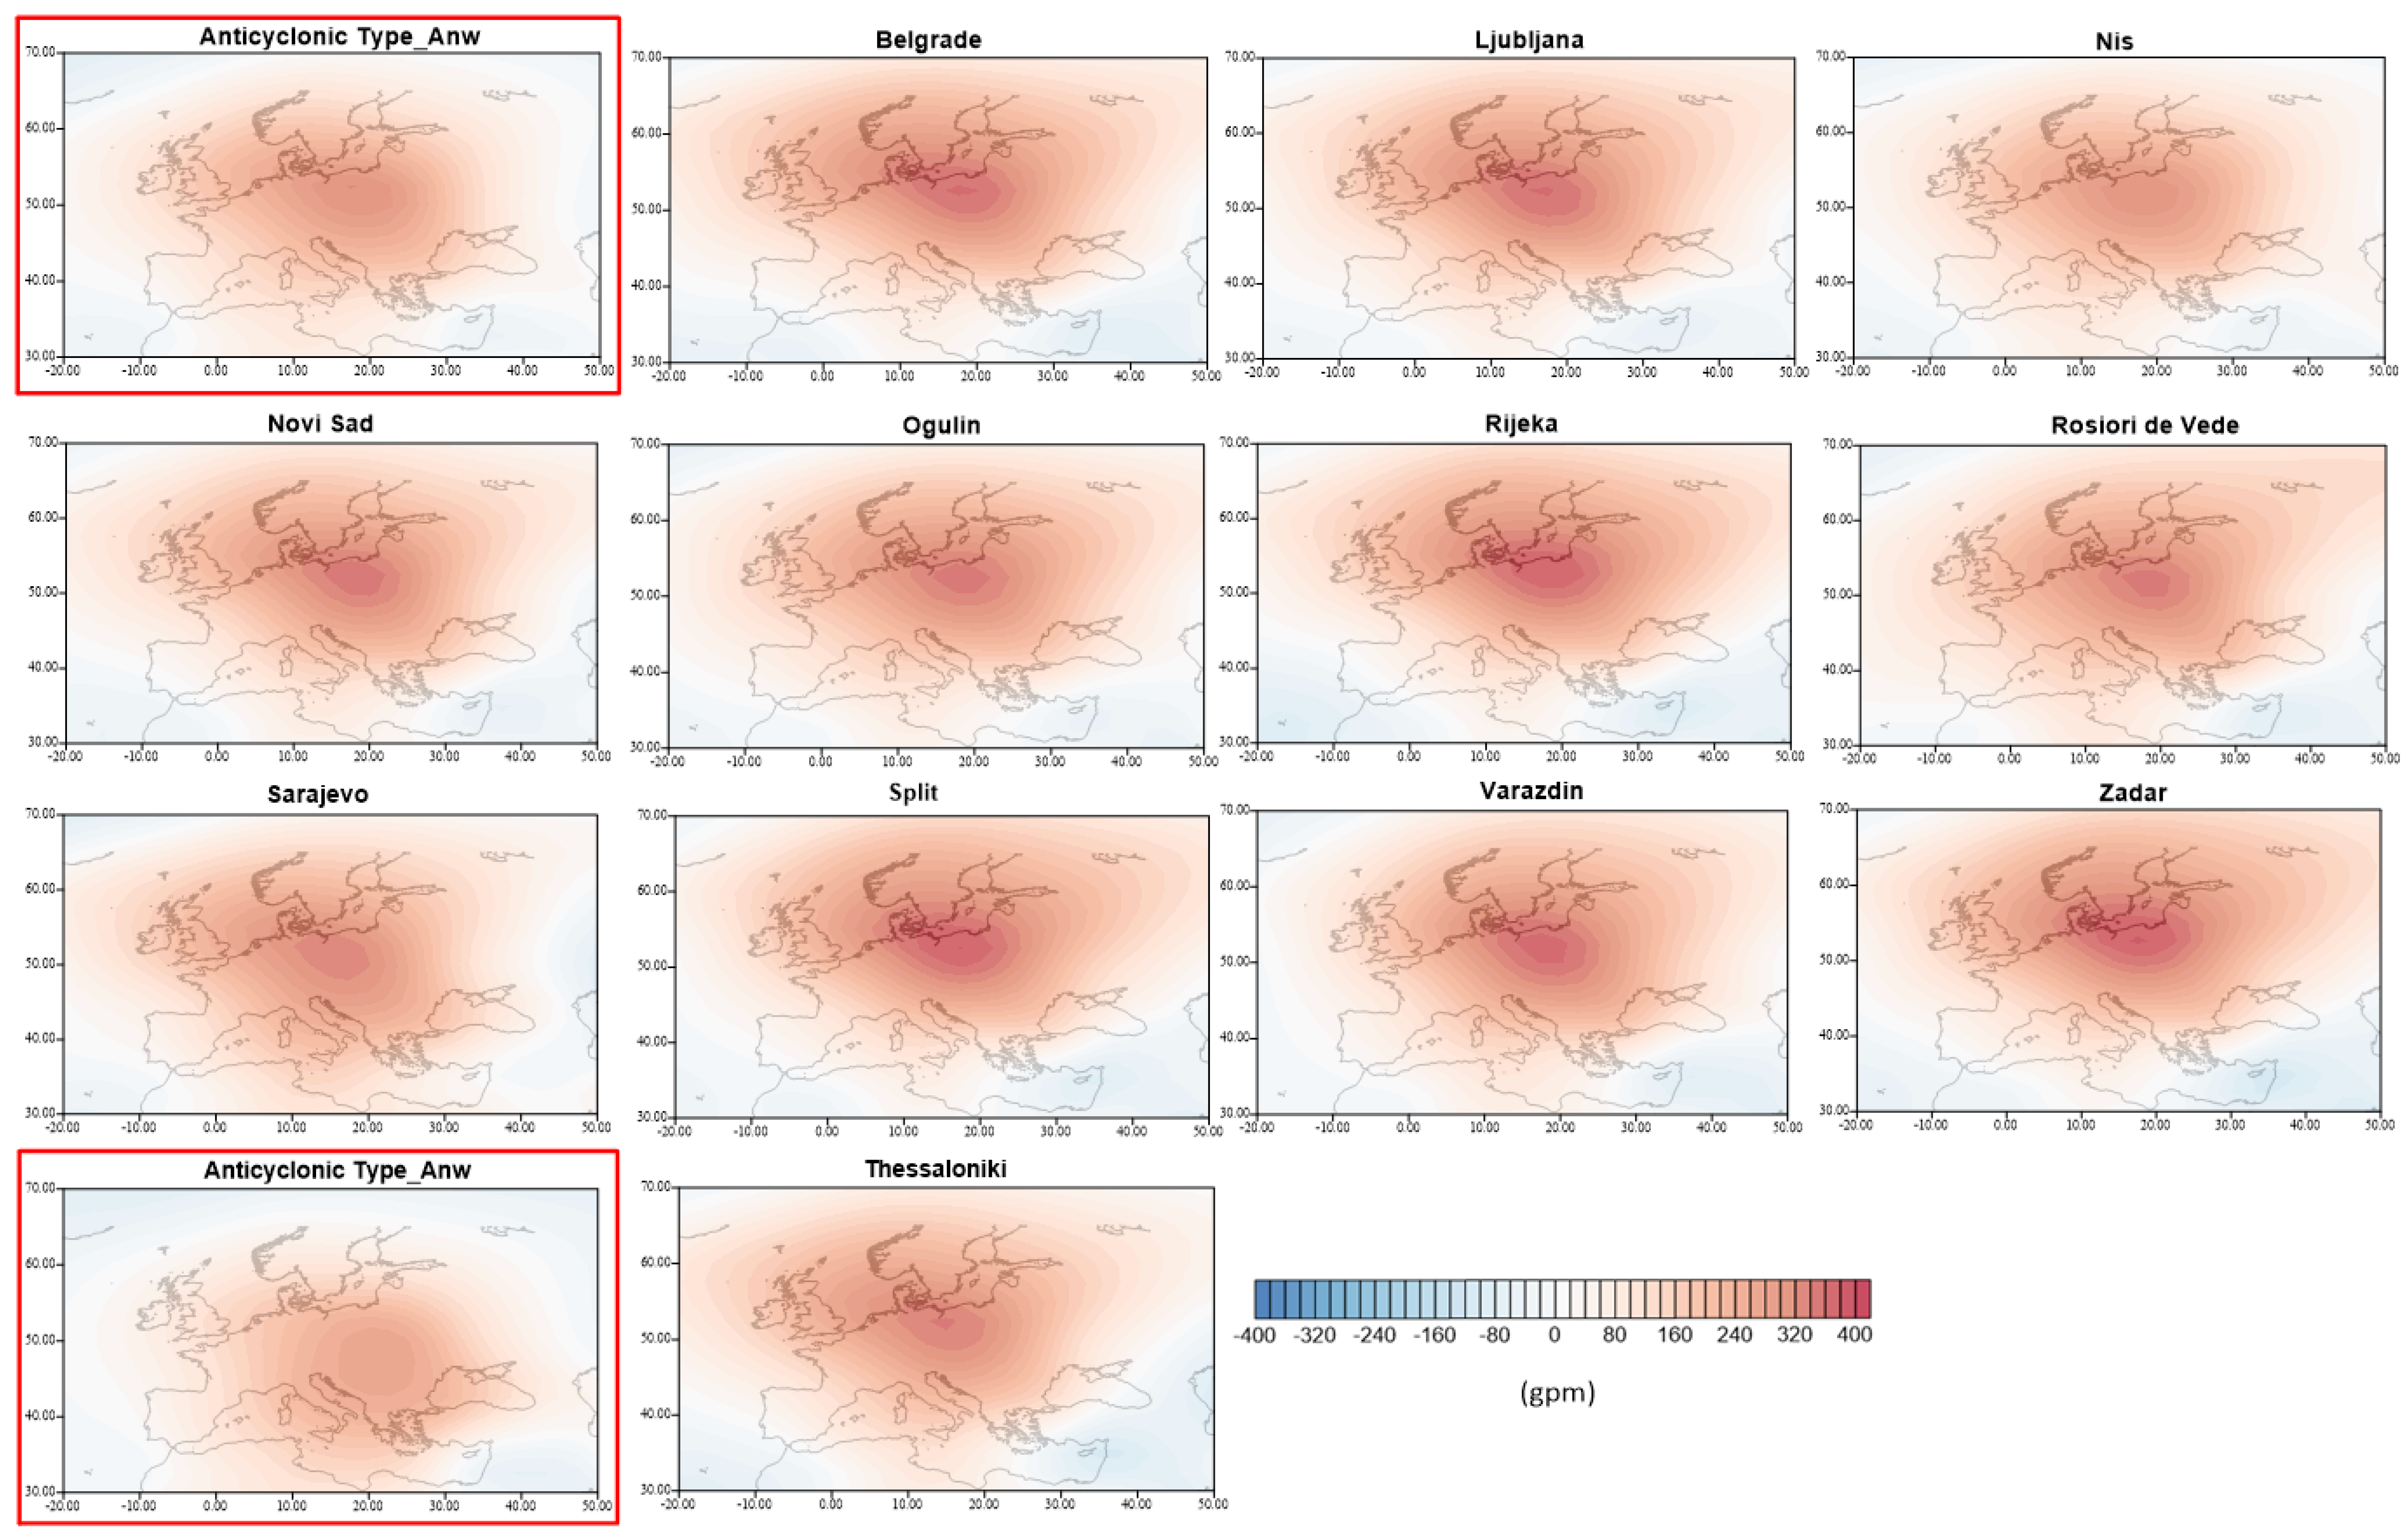
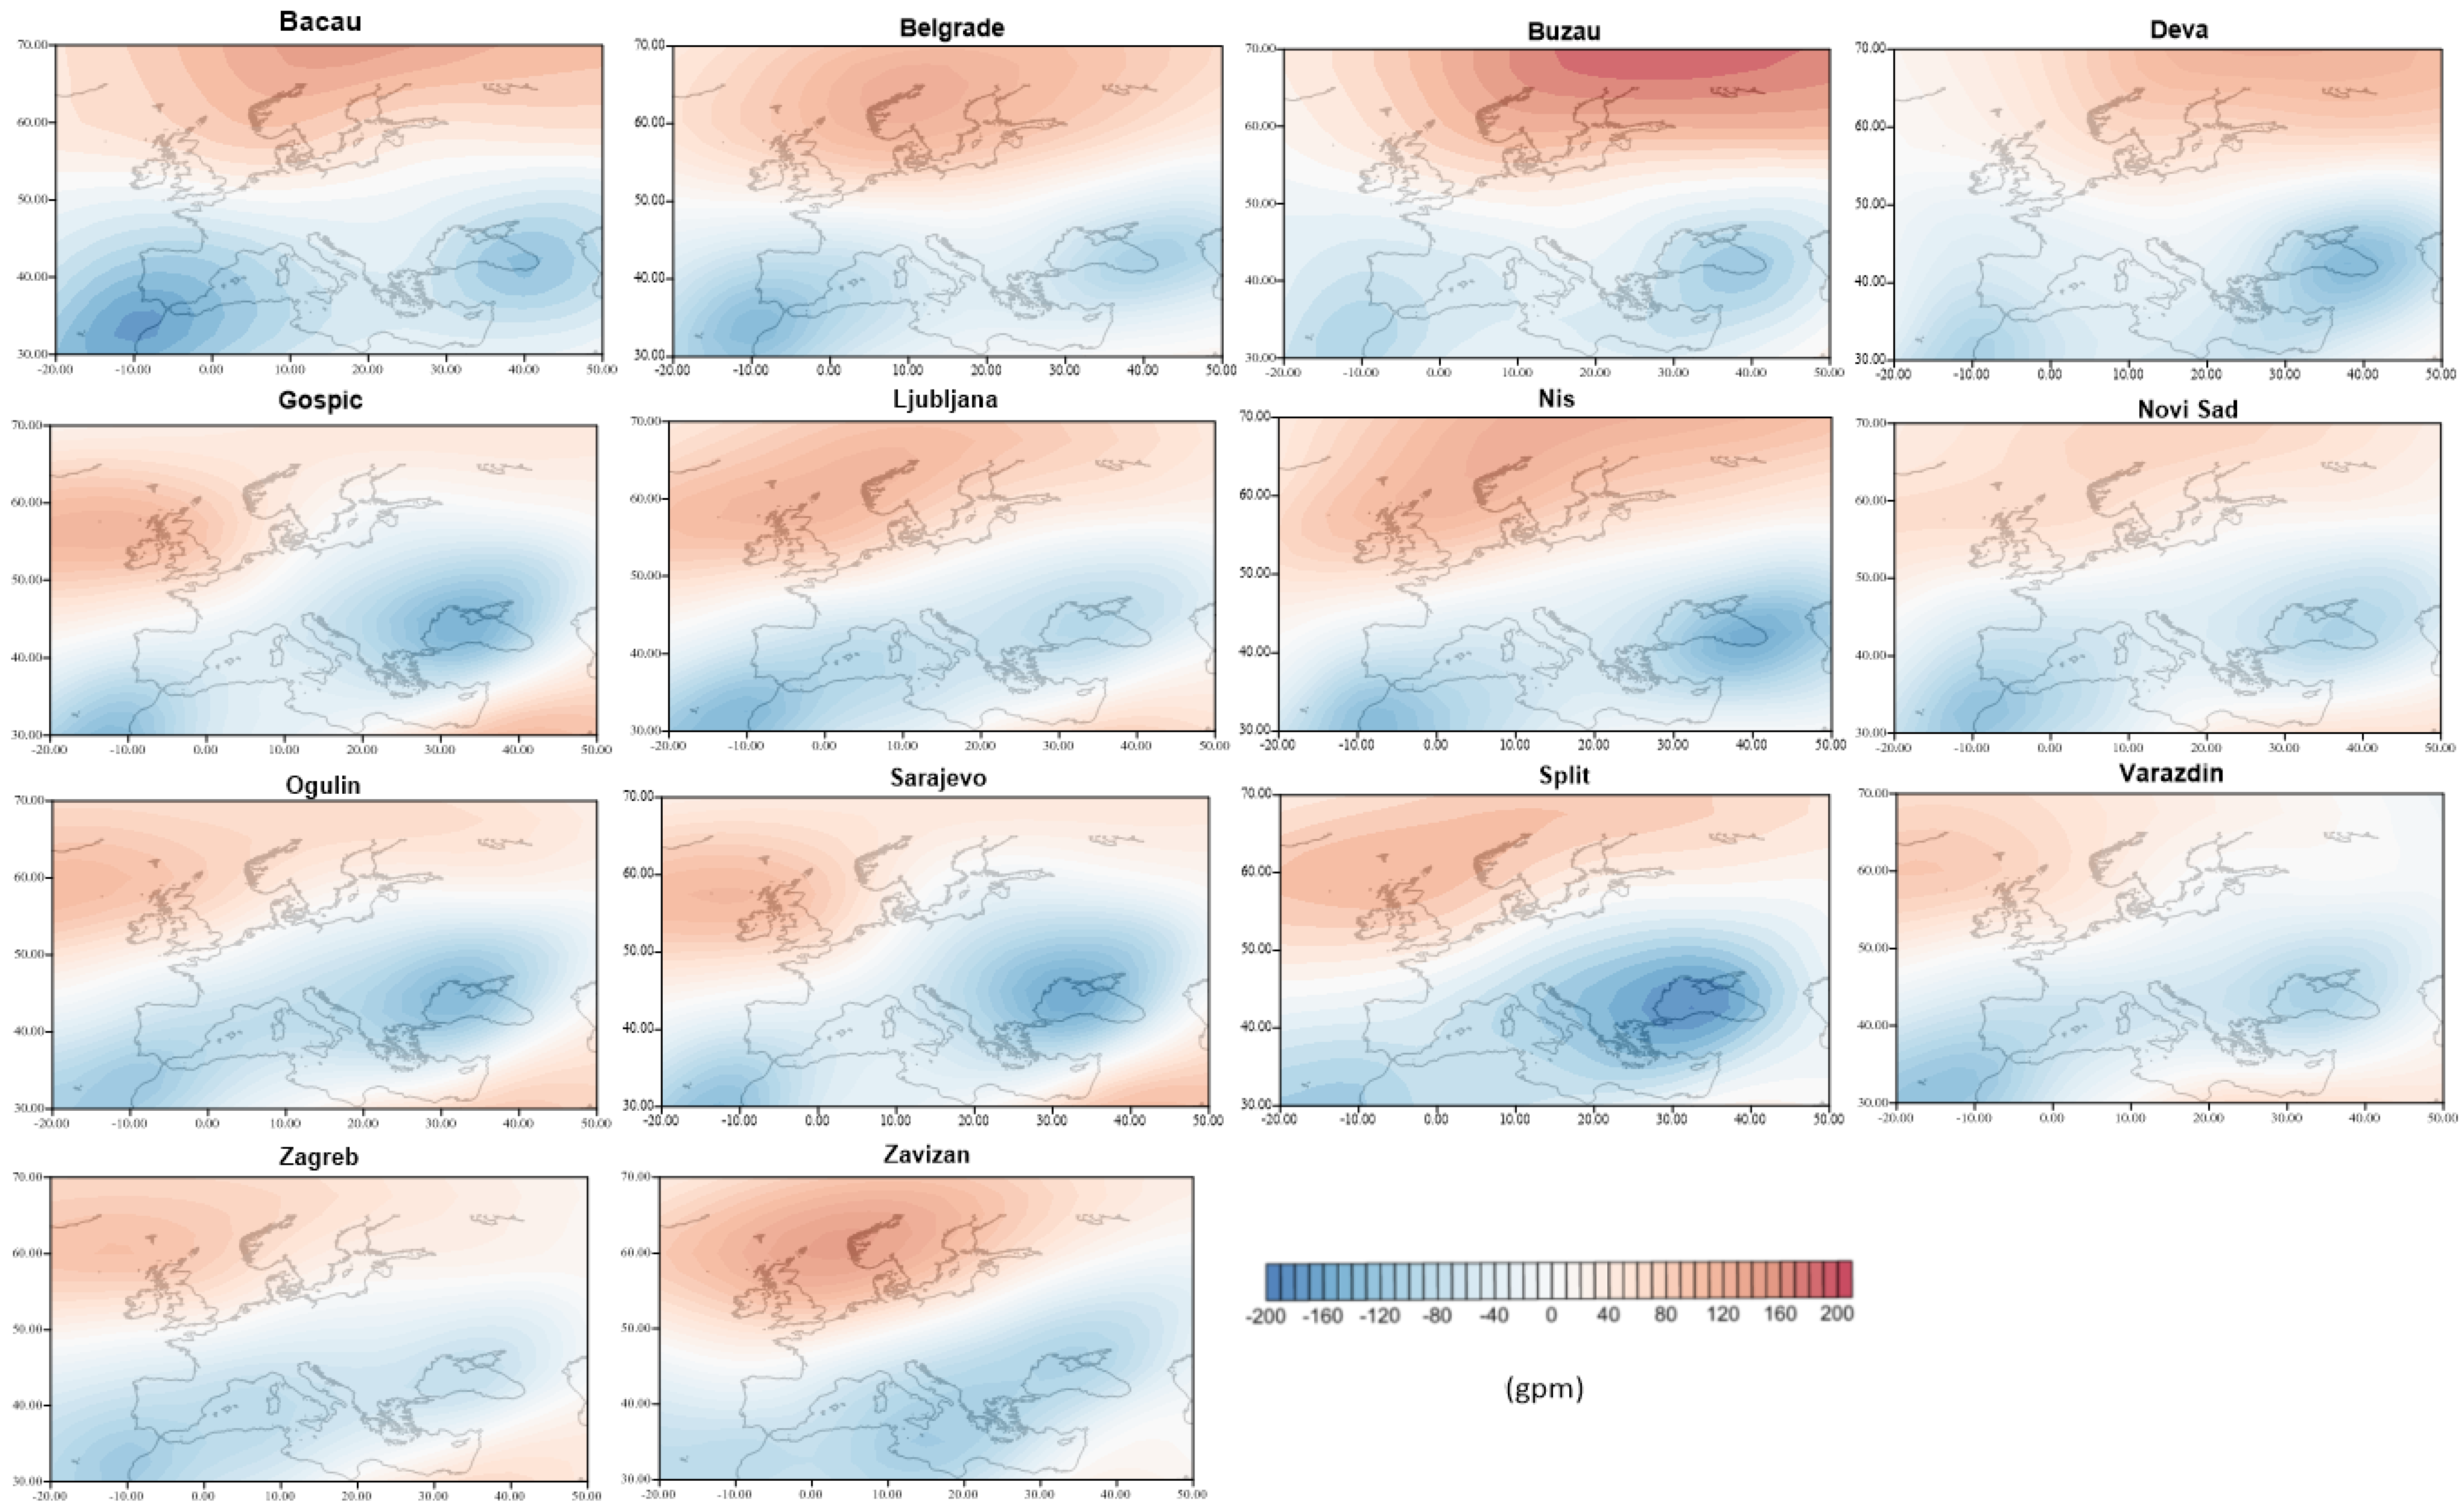
Figure 6 shows the mean 500 hPa anomalies for the cyclonic type Cne over the period 1961–2019 (red border) and the 500 hPa anomalies maps for the cyclonic type Cne during the WCSPs for the stations in which they were most prevalent. According to Figure 6, the cyclonic center of the Cne type was located over the northern part of Black Sea. However, during the WCSPs, the cyclonic center was deeper for almost all stations, and the negative center moved to the south. Split and Gospic presented the highest negative anomalies. Respectively, Figure 7 presented the results for the prevailing circulation type at 1000 hPa, i.e., the anticyclone Anw. In this case, there are two maps with red borders. There is an average map of anomalies for the station of Thessaloniki and one for the other stations. In this case, the mean 1000 hPa anomalies maps (red border) for the anticyclonic type Anw over the period 1961–2019 are two, due to the two classifications applied to the data. The anticyclonic center of the Anw type was located to the northwest of the Balkan Peninsula. During the WCSPs, the majority of the stations the anomalies maps at 1000 hPa indicated that the Anw centers remained in the same location, but the positive anomaly centers were stronger. The maps of differences at 500 hPa (Figure 8) showed positive anomalies in northern Europe and negative anomalies in the western Atlantic, meaning that, during the WCPs, both the Icelandic low and the Subtropical High (Azores), were weakened.
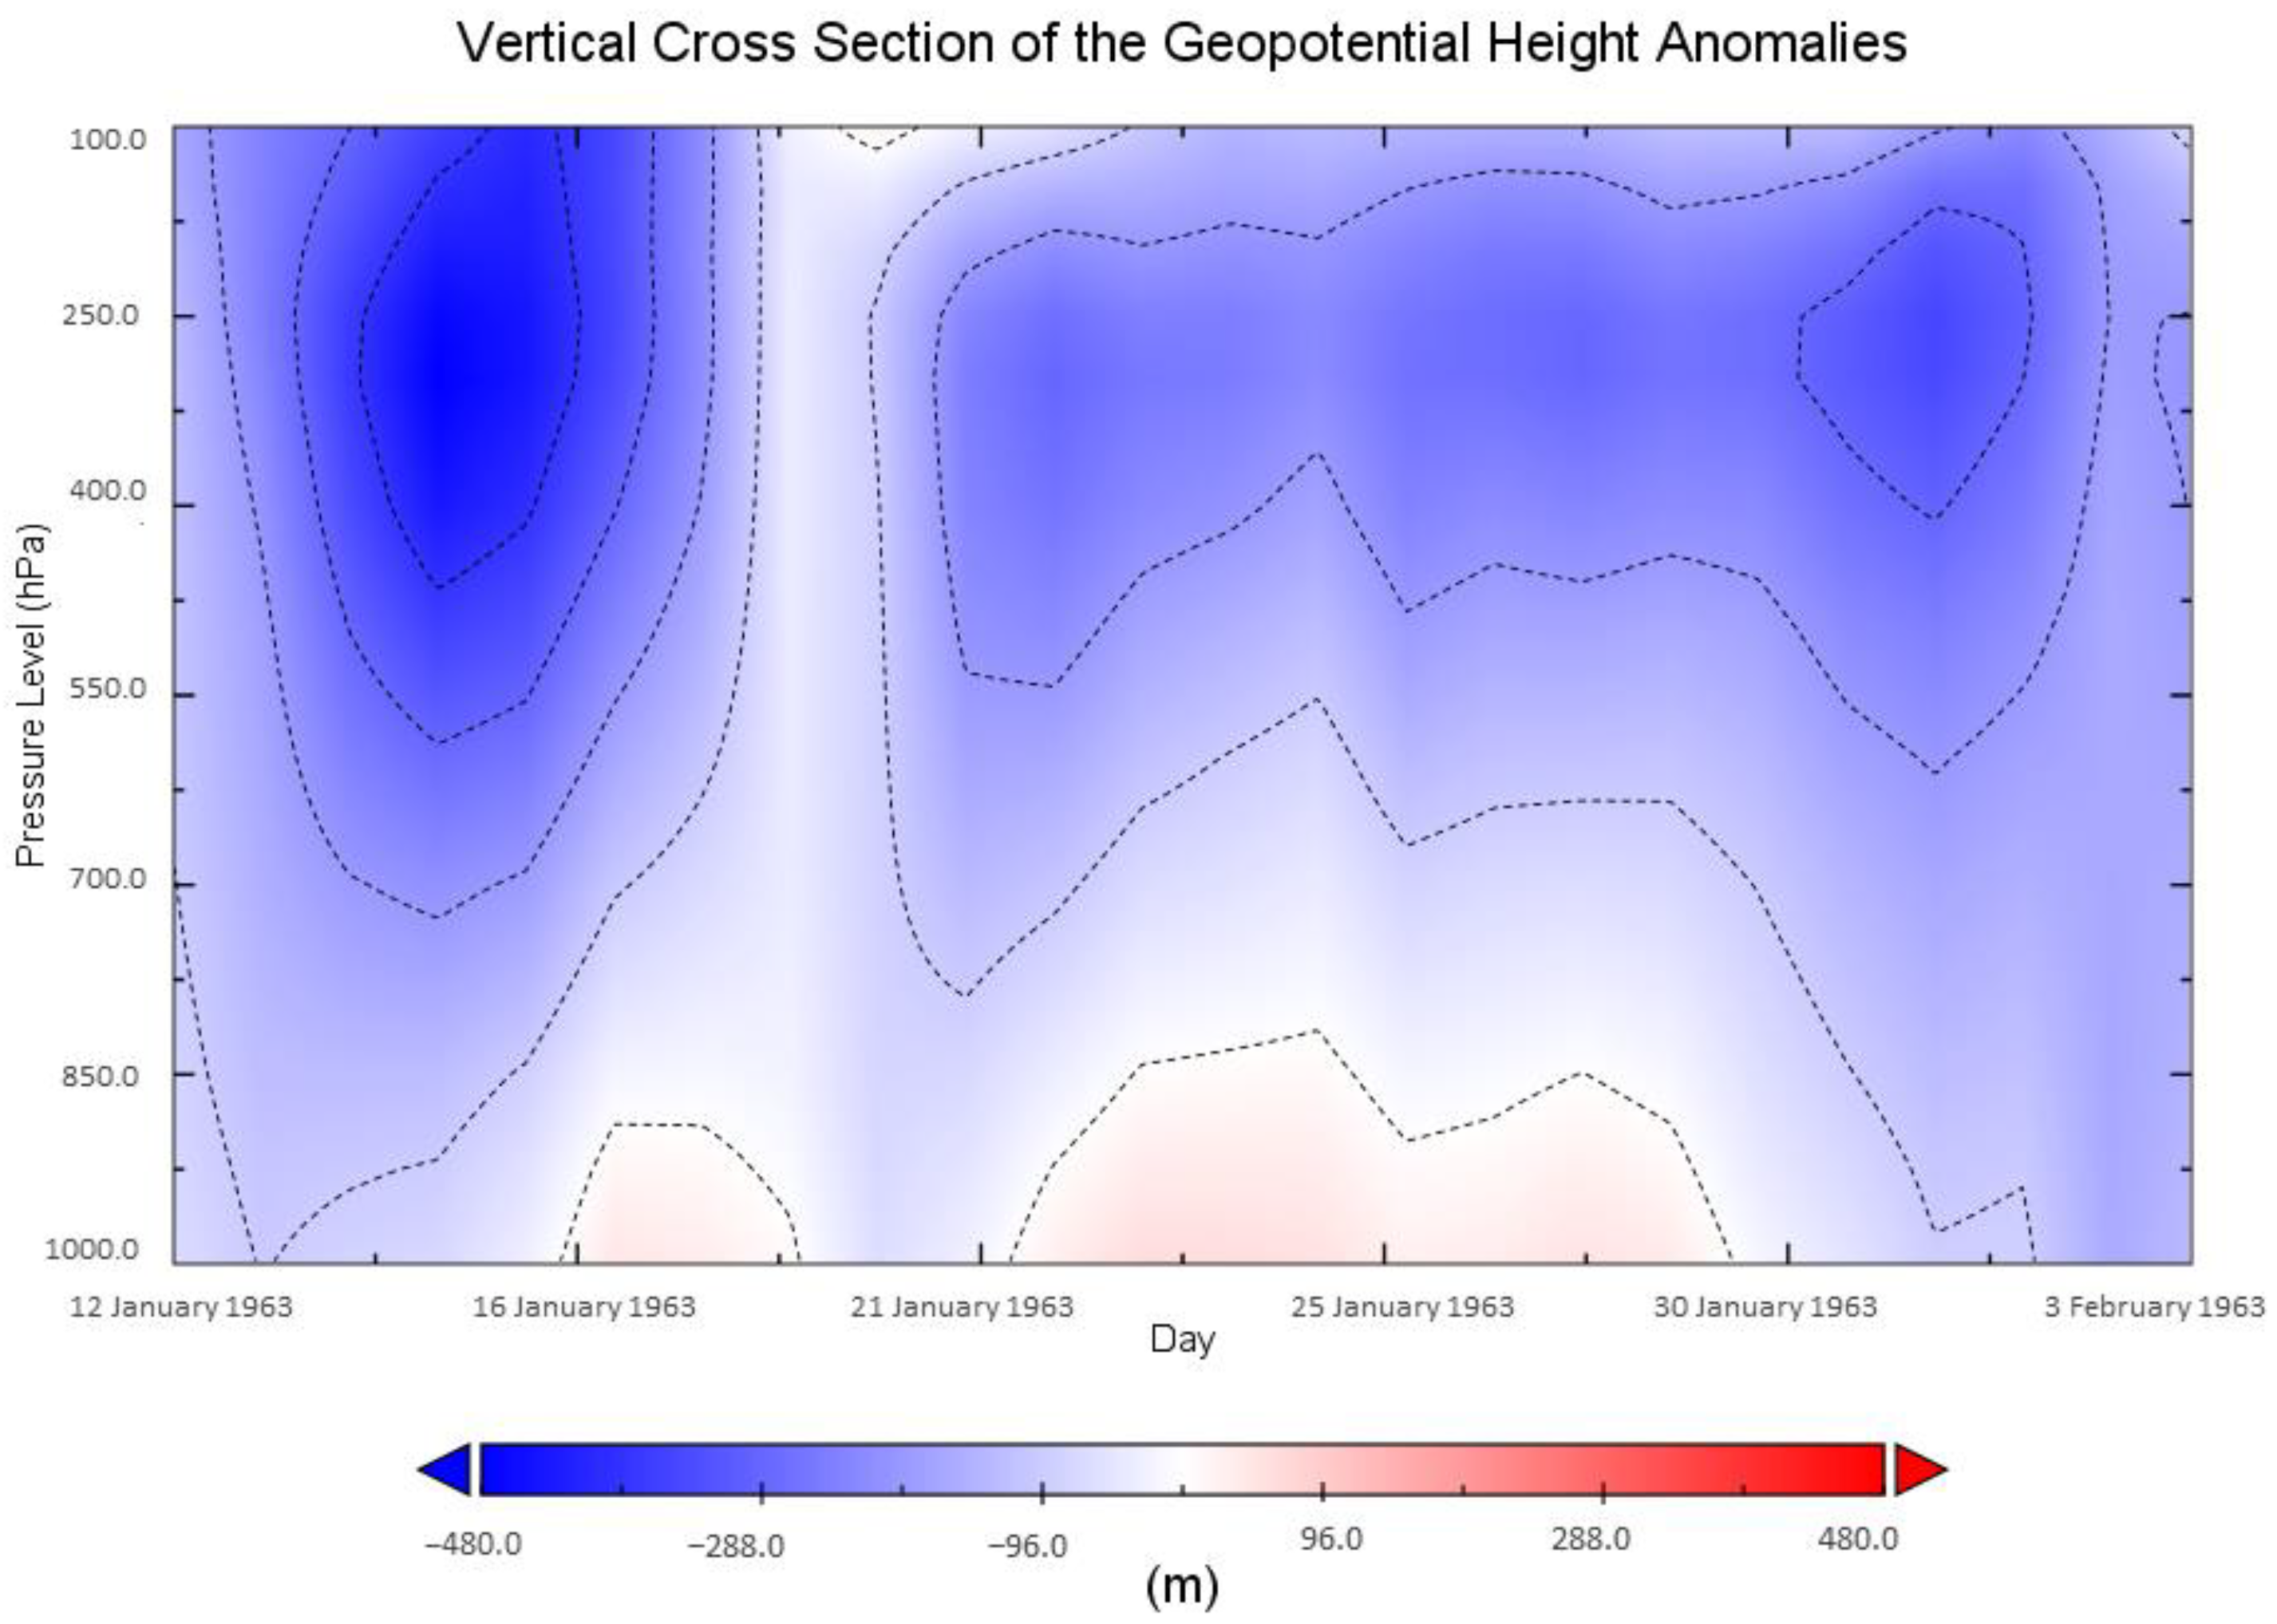
The vertical cross-section of the geopotential height anomalies for the 24 days of the longest WCSP (Figure 9), which took place in Belgrade (Serbia), in the period 12 January 1963–4 February 1963, were created to complete the synoptic analysis. The data for creating this figure were collected from the NOAA (https://psl.noaa.gov/, accessed on 25 November 2021), using 1981–2010 base period. At 1000 hPa, from 16 January 1963 to 19 January 1963 and from 21 February 1963 to 29 February 1963, positive values of anomalies prevailed at 1000 hPa. At 500 hPa, during this WCSP, the negative values of anomalies prevailed, with the most intense being the first days of the WCSPs. The vertical cross-section of the geopotential height anomalies showed that the longest WCSP was an alternation between cyclones and anticyclones. It was observed that a cold air mass at 500 hPa caused high pressure at the surface (1000 hPa), resulting in the loss of energy by longwave radiative cooling. Consequently, longwave radiative cooling was responsible for an ongoing local production of cold air, which, in turn, enhanced the high pressure at the surface.
3.5. Conclusions and Discussion
In the present work, the winter cold spells (WCSPs) of 25 Balkan stations for a 59-year period (1961–2019) were exploited, in order to understand their spatio-temporal variability, as well as their individual dynamic and synoptic characteristics. The aim was to determine the atmospheric conditions that contribute to the appearance of WCSPs, with the overarching goal of identifying the circulation types that favor their creation. The main findings of the study can be summarized as follows:
- As expected, the highest temperatures of the year occurred in mid-summer (July), while the lowest occurred in mid-winter (January). Regarding the geographical distribution of the temperature, the stations with the higher altitude recorded the lowest temperatures, while a gradual temperature increase was observed from the central to the coastal and southern stations of Balkan Peninsula. According to the literature, the Mediterranean Sea contributes to this distribution from north to south to a large extent, which has a beneficial effect on the climate and winters that are milder in the coastal areas. In general, the Balkan Peninsula receives mild moist Mediterranean air, which is transported by the westerly winds. On the other hand, occasionally, large-scale atmospheric circulation changes result in colder conditions, with a northerly flow from Scandinavia [45] or a northeast flow from Siberia [46]. As for the extreme minimum temperatures in the Balkans (Belgrade) during the winter, Unkašević and Tošić [47] showed that they are highly linked with the NAO index.
- A positive trend was observed regarding extreme minimum and maximum temperatures. This fact indicates that the minimum temperatures over the years became less extreme. On the global scale, most studies agree on the increasing trend of extreme minimum temperatures [17,19], while an increasing trend is observed at extreme maximum temperatures, but not with the same significance as the increases of extreme minimums. On a smaller scale, [48] analyzed climatic extremes in northern and central Europe, and their findings showed that both the maximum and minimum daily temperatures have increased. However, they reported that the minimum temperatures rose faster than the maximum temperatures, causing a reduction in the diurnal temperature range. Studies from central/eastern Europe [49] or in extra-Carpathian regions of Romania [50] have shown corresponding results, i.e., that the daily maximum temperature became more extreme, while the daily minimum temperature became less extreme. Focusing on southeastern Europe, and specifically the central and eastern Mediterranean, Efthymiadis et al. (2011) [51], outlined that, on an annual basis, the minimum temperatures during the winter increase more than the equivalent maximum ones. On a smaller scale, specifically for the region of Serbia, Unkašević and Tošić [47] showed that extreme temperatures in Belgrade have increased, noting that the climate in Serbia generally tends to become warmer in the future. Nevertheless, the overall tendency toward milder winters appeared in the temperature data for much of Europe, and this tendency was at least partially attributable to the predominance of the positive phase of the North Atlantic oscillation (NAO) during the 1980s and 1990s [52,53].
- The station with the highest average of frost days (Tmin ≤ 0) per year is that of Miercurea (Romania), with 135 days/year, while with the lowest is the station of Split (Croatia), with 7 days/year. On the other hand, the station with the highest average days of total frost (Tmax ≤ 0) per year is that of Zavizan (Croatia), with 63 days/year, while the stations Split and Zadar do not record total frost days. According to Frich et al. [19], on a global scale, a uniform decrease in the number of frost days occurred during the second half of the 20th century, but for the Balkan Peninsula region, there were a few increases. Karl et al. [54] have shown similar findings, reporting that, in many areas of the world, the number of frost days has decreased, but many areas of eastern Mediterranean showed a significant increase trend in the frost index on the annual scale. Additionally, a few positive trends of total number of frost days on an annual basis were found in western and southern Greece by Kostopoulou and Jones [20]. Contrarily, Unkašević and Tošić [35], in their study of the region of Serbia, found negative trends in the number of frost days for the period 1949–2012. In fact, they reported that the warming in Serbia was more related to increases in the frequency of heat waves than to the reduction in cold days.
- The frequency of the occurrence of WCSPs during the cold period of the year ranges from zero to eight WCSPs/year. The station in Zagreb (Croatia) was the one characterized by eight WCSPs during the cold year 1996–1997. The longest WCSP was recorded at Belgrade station (Serbia), with 24 days of cold temperatures from 12 January 1963 to 4 February 1963. During this long WCSP, Belgrade recorded its most extreme minimum temperatures (MinTmax −14.3 °C, MinTmin −21.0 °C, and MinTmean −17.3 °C. It is obvious that there was a statistically significant negative trend in the number of cold spells per year at the stations: Ljubljana, Split, Zadar, Zagreb, and Zavizan and 2) a statistically significant negative trend in the duration of cold spells at the stations: Cluj Napoca, Ljubljana, and Varazdin. Boccolari and Malmusi [55], in their study of the Moderna region in Italy, found that the duration index of cold spells diminished (−4.8 days per decade for 1989 to 2010). In general, for the region of Europe, Klein et al. [36] reported an increase in cold spell days during 1976–1999, in contrast to the regional warming trend during this period. Nevertheless, an overall trend towards milder winters appeared in the temperature data for much of Europe. The natural mechanisms standing behind the decreasing trend of cold spells vary. According to the present study, it is important information that the types that favor the development of WCSPs (Cne or Cse at 500 hPa) showed a decrease over time. Previous research has shown that this trend is at least partially attributable to the predominance of the positive phase of the North Atlantic oscillation (NAO+) during the 1980s and 1990s [52,53]. It is known that the negative phase of the North Atlantic Oscillation (NAO-) is associated with anomalously cold and dry winters in most of Europe, whereas the positive phase of NAO is often associated with anomalously warm and moist winters [52,56,57]. However, the NAO phase alone does not explain all aspects of the influence of atmospheric circulation over the North Atlantic on Europe [58]. According to Serreze et al. [59] and Screen [60], a direct effect is that winter extreme events in the middle latitudes that have cold air outbreaks originating from the Arctic are not as cold as they were in the past. However, atmospheric circulation is not the only explanation. According to the literature, in recent years, the water vapor content has increased in many stations, mainly in Southern Europe, rather than in Northern Europe [61,62]. As a result, longwave cooling has been reduced, raising the temperature and possibility inhibiting the formation of cold spells more frequently [61,62,63]. Finally, we acknowledge that European winter temperatures are also affected by other factors than those explicitly discussed above. Such factors include atmosphere–ocean coupling in the tropics and subtropics; shifting large-scale ocean temperature patterns; radiative forcings by greenhouse gases, aerosols, and ozone; and internal variability [64].
- During the WCSPs in the Balkans, the most important prerequisite for cold spells is the cyclonic northeastern type (Cne) or cyclonic southeastern type (Cse) at 500 hPa. At the surface, the anticyclonic northwest type (Anw) or anticyclonic northeastern type (Ane) present, in general, greater frequencies. This means more or less strong northerly advection in any case at the surface. According to Maheras et al. [65], the cyclonic type Cne presents an eastern flow and is responsible for the prevalence of low temperatures in the study region. In this circulation type, the wind blows mainly from the northerly, northwesterly sector results in colder conditions in the Balkans, with the transport of cold air masses from Scandinavia [38]. On the other hand, in most stations, the duration of WCSPs at 1000 hPa is associated with a shallow cold anticyclone (Anw). In this type, the wind over the study region prevails from the northerly sector, with higher intensity during the cold period. Plavcová and Kyselý [7] showed that, during the WCSPs, the frequency of anticyclonic types increases, while the western types do not favor the WCSPs. The same results were carried out from their subsequent study [7]. On the contrary, they also reported that the probability of extreme temperatures events reduced significantly with the prevalence of zonal westerly flow. This is probably explained by the fact that, generally, westerly winds transport mild moisture and make the climate milder.
- The start of WCSPs appears to be favored by the prevalence of the cyclonic northeastern type (Cne) at 500 hPa, 1 and 2 days before the start of WCSPs, while it is favored with the predominance of the cyclonic southeastern type (Cse) 1 and 2 days before the start of WCSPs at 1000 hPa. These results are in line with those of Plavcová and Kyselý [7], who showed that only the eastern and/or northern cyclonic types favor the start of CSPs.
- During the WCSPs at 500 hPa, both the cyclonic center at 500 hPa and the anticyclonic center at 1000 hPa are stronger, compared to the mean synoptic situation. The maps of the differences at 500 hPa showed that WCSPs relate to the negative phase of NAO, due to the weakening of the Icelandic low and the subtropical Azores high. The negative phase of NAO is associated with the cold conditions in northern Europe [47,66].
In conclusion, the pattern that causes the WCSPs in the Balkan region is characterized by cyclonic systems before the start of WCPs (day-1, day-2) (at 500 hPa and 1000 hPa), which cause extreme low temperatures. Then, during the WCSPs, a cold anticyclonic system keeps the temperatures low, while in the upper atmosphere, cyclonic systems prevail. There are few studies focusing on the connection of cold spells with atmospheric circulation types for the Balkan region. This connection was studied in the present work. From the above conclusions, it seems that atmospheric circulation somehow prepares the appearance of WCSPs. It turns out that there are specific circulation types that are related to their start, but also to their duration. We would like to mention that, when some stations develop a longer or colder cold spell, local modifications additionally play an important role. These local modifications would be interesting to study in a further study. Finally, we believe that the conclusions of this research can be used in the future to predict similar cold events.
Author Contributions
All authors contributed equally to the study conception and design, material preparation, data collection, and analysis. All authors have read and agreed to the published version of the manuscript.
Funding
This research received no external funding.
Institutional Review Board Statement
Not applicable.
Informed Consent Statement
Not applicable.
Data Availability Statement
The ECA&D dataset is available online at https://www.ecad.eu/dailydata/predefinedseries.php (accessed on 10 November 2021). The dataset derived from Aristotle University of Thessaloniki (AUTH) are available on request from the corresponding author.
Acknowledgments
The authors would like to thank the European Climate Assessment and Database (ECAD) for enabling access to database.
Conflicts of Interest
The authors declare no conflict of interest.
Appendix A
Figure A1.
The 5 anticyclonic and 7 cyclonic types and their abbreviations.

Figure A2.
The location of the anticyclonic (a) and cyclonic (b) circulation type center. An example for Greece.
Figure A2.
The location of the anticyclonic (a) and cyclonic (b) circulation type center. An example for Greece.

References
- McMichael, A.J.; Campbell-Lendrum, D.H.; Corvalan, C.F.; Ebi, K.L.; Githelo, A.; Scheraga, J.D.; Woodward, A. Climate Change and Human Health: Risks and Responses; World Health Organization: Geneva, Switzerland, 2003. [Google Scholar]
- McGregor, G.R.; Ferro, C.A.T.; Stephenson, D.B. Projected Changes in Extreme Weather and Climate Events in Europe. In Extreme Weather Events and Public Health Responses; Kirch, W., Bertollini, R., Menne, B., Eds.; Springer: Berlin/Heidelberg, Germany, 2005; pp. 13–23. ISBN 978-3-540-24417-2. [Google Scholar]
- Beniston, M.; Stephenson, D.B. Extreme Climatic Events and Their Evolution under Changing Climatic Conditions. Glob. Planet. Chang. 2004, 44, 1–9. [Google Scholar] [CrossRef] [Green Version]
- Vavrus, S.; Walsh, J.E.; Chapman, W.L.; Portis, D. The Behavior of Extreme Cold Air Outbreaks under Greenhouse Warming. Int. J. Climatol. 2006, 26, 1133–1147. [Google Scholar] [CrossRef]
- Kyselý, J. Influence of the Persistence of Circulation Patterns on Warm and Cold Temperature Anomalies in Europe: Analysis over the 20th Century. Glob. Planet. Chang. 2008, 62, 147–163. [Google Scholar] [CrossRef]
- Anagnostopoulou, C.; Tolika, K.; Lazoglou, G.; Maheras, P. The Exceptionally Cold January of 2017 over the Balkan Peninsula: A Climatological and Synoptic Analysis. Atmosphere 2017, 8, 252. [Google Scholar] [CrossRef] [Green Version]
- Plavcová, E.; Kyselý, J. Temporal Characteristics of Heat Waves and Cold Spells and Their Links to Atmospheric Circulation in EURO-CORDEX RCMs. Adv. Meteorol. 2019, 2019, 2178321. [Google Scholar] [CrossRef] [Green Version]
- Solomon, S.; Qin, D.; Manning, M.; Marquis, M.; Averyt, K.; Tignor, M.; Miller, H.L.; Chen, Z. IPCC Limate Change: The Physical Science Basis. In Contribution of Working Group I to the Fourth Assessment Report of the Intergov-Ernmental Panel in Climate Change; Cambridge University Press: Cambridge, UK; New York, NY, USA, 2007; p. 996. [Google Scholar]
- Trenberth, K.E.; Jones, P.D. Observations: Surface and Atmospheric Climate Change. In Contribution of Working Group I to the Fourth Assessment Report of the Intergovernmental Panel on Climate Change; Cambridge University Press: Cambridge, UK; New York, NY, USA, 2007. [Google Scholar]
- Moberg, A.; Jones, P.D.; Lister, D.; Walther, A.; Brunet, M.; Jacobeit, J.; Alexander, L.V.; Della-Marta, P.M.; Luterbacher, J.; Yiou, P.; et al. Indices for Daily Temperature and Precipitation Extremes in Europe Analyzed for the Period 1901–2000. J. Geophys. Res. 2006, 111, D22106. [Google Scholar] [CrossRef] [Green Version]
- Peterson, T.C.; Zhang, X.; Brunet-India, M.; Vázquez-Aguirre, J.L. Changes in North American Extremes Derived from Daily Weather Data. J. Geophys. Res. 2008, 113, D07113. [Google Scholar] [CrossRef] [Green Version]
- Dash, S.K.; Mamgain, A. Changes in the Frequency of Different Categories of Temperature Extremes in India. J. Appl. Meteorol. Climatol. 2011, 50, 1842–1858. [Google Scholar] [CrossRef]
- Yan, Z.; Jones, P.D.; Davies, T.D.; Moberg, A.; Bergström, H.; Camuffo, D.; Cocheo, C.; Maugeri, M.; Demarée, G.R.; Verhoeve, T.; et al. Trends of Extreme Temperatures in Europe and China Based on Daily Observations. Clim. Chang. 2002, 53, 355–392. [Google Scholar] [CrossRef]
- Christidis, N. Detection of Changes in Temperature Extremes during the Second Half of the 20th Century. Geophys. Res. Lett. 2005, 32, L20716. [Google Scholar] [CrossRef]
- Brown, S.J.; Caesar, J.; Ferro, C.A.T. Global Changes in Extreme Daily Temperature since 1950. J. Geophys. Res. 2008. [CrossRef] [Green Version]
- Kodra, E.; Steinhaeuser, K.; Ganguly, A.R. Persisting Cold Extremes under 21st-Century Warming Scenarios. Geophys. Res. Lett. 2011, 38. [Google Scholar] [CrossRef] [Green Version]
- Easterling, D.R.; Evans, J.L.; Groisman, P.Y.; Karl, T.R.; Kunkel, K.E.; Ambenje, P. Observed Variability and Trends in Extreme Climate Events: A Brief Review. Bull. Amer. Meteor. Soc. 2000, 81, 417–425. [Google Scholar] [CrossRef]
- Chau, P.H.; Chan, K.C.; Woo, J. Hot Weather Warning Might Help to Reduce Elderly Mortality in Hong Kong. Int. J. Biometeorol. 2009, 53, 461–468. [Google Scholar] [CrossRef] [PubMed]
- Frich, P.; Alexander, L.; Della-Marta, P.; Gleason, B.; Haylock, M.; Klein Tank, A.; Peterson, T. Observed Coherent Changes in Climatic Extremes during the Second Half of the Twentieth Century. Clim. Res. 2002, 19, 193–212. [Google Scholar] [CrossRef] [Green Version]
- Kostopoulou, E.; Jones, P.D. Assessment of Climate Extremes in the Eastern Mediterranean. Meteorol. Atmos. Phys. 2005, 89, 69–85. [Google Scholar] [CrossRef]
- Domonkos, P.; Kyselý, J.; Piotrowicz, K.; Petrovic, P.; Likso, T. Variability of Extreme Temperature Events in South-Central Europe during the 20th Century and Its Relationship with Large-Scale Circulation. Int. J. Climatol. 2003, 23, 987–1010. [Google Scholar] [CrossRef]
- Yiou, P.; Nogaj, M. Extreme Climatic Events and Weather Regimes over the North Atlantic: When and Where? Geophys. Res. Lett. 2004, 31. [Google Scholar] [CrossRef]
- Parker, D.E. Effects of Changing Exposure of Thermometers at Land Stations. Int. J. Climatol. 1994, 14, 1–31. [Google Scholar] [CrossRef]
- Kyselý, J.; Domonkos, P. Recent Increase in Persistence of Atmospheric Circulation over Europe: Comparison with Long-Term Variations since 1881. Int. J. Climatol. 2006, 26, 461–483. [Google Scholar] [CrossRef]
- Pfahl, S.; Wernli, H. Quantifying the Relevance of Atmospheric Blocking for Co-Located Temperature Extremes in the Northern Hemisphere on (Sub-)Daily Time Scales. Geophys. Res. Lett. 2012, 39. [Google Scholar] [CrossRef]
- Reinhold, B.B.; Pierrehumbert, R.T. Dynamics of Weather Regimes: Quasi-Stationary Waves and Blocking. Mon. Wea. Rev. 1982, 110, 1105–1145. [Google Scholar] [CrossRef]
- Sillmann, J.; Croci-Maspoli, M.; Kallache, M.; Katz, R.W. Extreme Cold Winter Temperatures in Europe under the Influence of North Atlantic Atmospheric Blocking. J. Clim. 2011, 24, 5899–5913. [Google Scholar] [CrossRef]
- Whan, K.; Zwiers, F.; Sillmann, J. The Influence of Atmospheric Blocking on Extreme Winter Minimum Temperatures in North America. J. Clim. 2016, 29, 4361–4381. [Google Scholar] [CrossRef] [Green Version]
- Wheeler, D.D.; Harvey, V.L.; Atkinson, D.E.; Collins, R.L.; Mills, M.J. A Climatology of Cold Air Outbreaks over North America: WACCM and ERA-40 Comparison and Analysis. J. Geophys. Res. 2011, 116, D12107. [Google Scholar] [CrossRef]
- Fortune, M.A.; Kousky, V.E. Two Severe Freezes in Brazil: Precursors and Synoptic Evolution. Mon. Wea. Rev. 1983, 111, 181–196. [Google Scholar] [CrossRef]
- Tomczyk, A.M.; Bednorz, E.; Półrolniczak, M.; Kolendowicz, L. Strong Heat and Cold Waves in Poland in Relation with the Large-Scale Atmospheric Circulation. Theor. Appl. Climatol. 2019, 137, 1909–1923. [Google Scholar] [CrossRef] [Green Version]
- Barnett, A.G.; Hajat, S.; Gasparrini, A.; Rocklöv, J. Cold and Heat Waves in the United States. Environ. Res. 2012, 112, 218–224. [Google Scholar] [CrossRef] [PubMed] [Green Version]
- Lavaysse, C.; Cammalleri, C.; Dosio, A.; van der Schrier, G.; Toreti, A.; Vogt, J. Towards a Monitoring System of Temperature Extremes in Europe. Nat. Hazards Earth Syst. Sci. 2018, 18, 91–104. [Google Scholar] [CrossRef] [Green Version]
- Perkins, S.E. A Review on the Scientific Understanding of Heatwaves—Their Measurement, Driving Mechanisms, and Changes at the Global Scale. Atmos. Res. 2015, 164–165, 242–267. [Google Scholar] [CrossRef]
- Unkašević, M.; Tošić, I. Seasonal Analysis of Cold and Heat Waves in Serbia during the Period 1949–2012. Theor. Appl. Climatol. 2015, 120, 29–40. [Google Scholar] [CrossRef]
- Klein Tank, A.M.G.; Können, G.P. Trends in Indices of Daily Temperature and Precipitation Extremes in Europe, 1946–1999. J. Clim. 2003, 16, 3665–3680. [Google Scholar] [CrossRef]
- Satyamurty, P.; da Silva Teixeira, M.; Klug Padilha, C. Warm and Dry Spells (WDS) in Austral Winter over Central South America. Ann. Geophys. 2007, 25, 1049–1069. [Google Scholar] [CrossRef] [Green Version]
- Anagnostopoulou, C.; Tolika, K.; Maheras, P. Classification of Circulation Types: A New Flexible Automated Approach Applicable to NCEP and GCM Datasets. Theor. Appl. Climatol. 2009, 96, 3–15. [Google Scholar] [CrossRef]
- Kendall, M.G. Rank Correlation Methods; Charles Griffin: London, UK, 1975; ISBN 978-0-85264-199-6. [Google Scholar]
- Malinovic-Milicevic, S.; Radovanovic, M.M.; Stanojevic, G.; Milovanovic, B. Recent Changes in Serbian Climate Extreme Indices from 1961 to 2010. Theor. Appl. Climatol. 2016, 124, 1089–1098. [Google Scholar] [CrossRef]
- Bojariu, R.; Dinu, M. Snow Variability and Change in Romania. In Proceedings of the Alpine Snow Workshop, Munich, Germany, 5–6 October 2006. [Google Scholar]
- Micu, D. Snow Pack in the Romanian Carpathians under Changing Climatic Conditions. Meteorol. Atmos. Phys. 2009, 105, 1–16. [Google Scholar] [CrossRef]
- Birsan, M.-V.; Dumitrescu, A. Snow Variability in Romania in Connection to Large-Scale Atmospheric Circulation. Int. J. Climatol. 2014, 34, 134–144. [Google Scholar] [CrossRef]
- Marin, L.; Birsan, M.-V.; Bojariu, R.; Dumitrescu, A.; Micu, D.M.; Manea, A. An Overview of Annual Climatic Changes in Romania: Trends in Air Temperature, Precipitation, Sunshine Hours, Cloud Cover, Relative Humidity and Wind Speed during the 1961–2013 Period. Carpathian J. Earth Environ. Sci. 2014, 9, 253–258. [Google Scholar]
- Tolika, K.; Maheras, P.; Pytharoulis, I.; Anagnostopoulou, C. The Anomalous Low and High Temperatures of 2012 over Greece—An Explanation from a Meteorological and Climatological Perspective. Nat. Hazards Earth Syst. Sci. 2014, 14, 501–507. [Google Scholar] [CrossRef] [Green Version]
- Makorgiannis, T.J.; Giles, B.D.; Flocas, A.A. The Problem of the Extension of the Siberian Anticyclone towards Southeast Europe, and Its Relation to Atmospheric Circulation Anomalies over the Northern Hemisphere. Arch. Meteorol. Geophys. Bioclimatol. Ser. A 1981, 30, 185–196. [Google Scholar] [CrossRef]
- Unkašević, M.; Tošić, I. Changes in Extreme Daily Winter and Summer Temperatures in Belgrade. Theor. Appl. Climatol. 2009, 95, 27–38. [Google Scholar] [CrossRef]
- Heino, J.; Virkkala, R.; Toivonen, H. Climate Change and Freshwater Biodiversity: Detected Patterns, Future Trends and Adaptations in Northern Regions. Biol. Rev. 2009, 84, 39–54. [Google Scholar] [CrossRef]
- Bartholy, J.; Pongracz, R. Regional Analysis of Extreme Temperature and Precipitation Indices for the Carpathian Basin from 1946 to 2001. Glob. Planet. Chang. 2007, 57, 83–95. [Google Scholar] [CrossRef]
- Croitoru, A.-E.; Piticar, A. Changes in Daily Extreme Temperatures in the Extra-Carpathians Regions of Romania: Extreme Temperature Changes in Extra-Carpathians Areas of Romania. Int. J. Climatol. 2013, 33, 1987–2001. [Google Scholar] [CrossRef]
- Efthymiadis, D.; Goodess, C.M.; Jones, P.D. Trends in Mediterranean Gridded Temperature Extremes and Large-Scale Circulation Influences. Nat. Hazards Earth Syst. Sci. 2011, 11, 2199–2214. [Google Scholar] [CrossRef]
- Hurrell, J.W.; Kushnir, Y.; Ottersen, G.; Visbeck, M. An Overview of the North Atlantic Oscillation. In Geophysical Monograph Series; Hurrell, J.W., Kushnir, Y., Ottersen, G., Visbeck, M., Eds.; American Geophysical Union: Washington, DC, USA, 2003; Volume 134, pp. 1–35. ISBN 978-0-87590-994-3. [Google Scholar]
- Thompson, D.W.J.; Wallace, J.M. The Arctic Oscillation Signature in the Wintertime Geopotential Height and Temperature Fields. Geophys. Res. Lett. 1998, 25, 1297–1300. [Google Scholar] [CrossRef] [Green Version]
- Karl, T.R.; Nicholls, N.; Ghazi, A. Clivar/GCOS/WMO Workshop on Indices and Indicators for Climate Extremes Workshop Summary. Clim. Chang. 1999, 42, 3–7. [Google Scholar] [CrossRef]
- Boccolari, M.; Malmusi, S. Changes in Temperature and Precipitation Extremes Observed in Modena, Italy. Atmos. Res. 2013, 122, 16–31. [Google Scholar] [CrossRef]
- Marshall, J.; Johnson, H.; Goodman, J. A Study of the Interaction of the North Atlantic Oscillation with Ocean Circulation. J. Clim. 2001, 14, 1399–1421. [Google Scholar] [CrossRef]
- Hanna, E.; Hall, R.J.; Overland, J.E. Can Arctic Warming Influence UK Extreme Weather? Weather 2017, 72, 346–352. [Google Scholar] [CrossRef]
- Vautard, R. Multiple Weather Regimes over the North Atlantic: Analysis of Precursors and Successors. Mon. Wea. Rev. 1990, 118, 2056–2081. [Google Scholar] [CrossRef]
- Serreze, M.C.; Barrett, A.P.; Cassano, J.J. Circulation and Surface Controls on the Lower Tropospheric Air Temperature Field of the Arctic. J. Geophys. Res. 2011, 116, D07104. [Google Scholar] [CrossRef]
- Screen, J.A.; Deser, C.; Simmonds, I.; Tomas, R. Atmospheric Impacts of Arctic Sea-Ice Loss, 1979–2009: Separating Forced Change from Atmospheric Internal Variability. Clim. Dyn. 2014, 43, 333–344. [Google Scholar] [CrossRef] [Green Version]
- Mattar, C.; Sobrino, J.A.; Julien, Y.; Morales, L. Trends in Column Integrated Water Vapour over Europe from 1973 to 2003. Int. J. Climatol. 2011, 31, 1749–1757. [Google Scholar] [CrossRef]
- Yuan, P.; Van Malderen, R.; Yin, X.; Vogelmann, H.; Awange, J.; Heck, B.; Kutterer, H. Characterizations of Europe’s Integrated Water Vapor and Assessments of Atmospheric Reanalyses Using More than Two Decades of Ground-Based GPS. Atmos. Chem. Phys. Discuss. 2021, 1–38. [Google Scholar] [CrossRef]
- Philipona, R.; Dürr, B.; Ohmura, A.; Ruckstuhl, C. Anthropogenic Greenhouse Forcing and Strong Water Vapor Feedback Increase Temperature in Europe. Geophys. Res. Lett. 2005, 32. [Google Scholar] [CrossRef]
- Vihma, T.; Graversen, R.; Chen, L.; Handorf, D.; Skific, N.; Francis, J.A.; Tyrrell, N.; Hall, R.; Hanna, E.; Uotila, P.; et al. Effects of the Tropospheric Large-scale Circulation on European Winter Temperatures during the Period of Amplified Arctic Warming. Int. J. Climatol. 2020, 40, 509–529. [Google Scholar] [CrossRef] [Green Version]
- Maheras, P.; Patrikas, I.; Karacostas, T.H.; Anagnostopoulou, C.H.R. Automatic Classification of Circulation Types in Greece: Methodology, Description, Frequency, Variability and Trend Analysis. Theor. Appl. Climatol. 2000, 67, 205–223. [Google Scholar] [CrossRef]
- Cattiaux, J.; Vautard, R.; Cassou, C.; Yiou, P.; Masson-Delmotte, V.; Codron, F. Winter 2010 in Europe: A Cold Extreme in a Warming Climate. Geophys. Res. Lett. 2010, 37. [Google Scholar] [CrossRef]
Figure 1.
The Location of Balkans in Europe and the meteorological stations in Balkans used in this study.
Figure 1.
The Location of Balkans in Europe and the meteorological stations in Balkans used in this study.

Figure 2.
The most extreme minimum temperatures (MinTmax, MinTmin, MinTmean) of the cold period (NDJFM) for the years 1961–2019 for the 25 under study stations.
Figure 2.
The most extreme minimum temperatures (MinTmax, MinTmin, MinTmean) of the cold period (NDJFM) for the years 1961–2019 for the 25 under study stations.

Figure 3.
Extreme minimum Tmean (MinTmean) (yellow color), extreme minimum Tmax (MinTmax) (red color), and extreme minimum Tmin (MinTmin) per year for the cold period (NDJFM) for the years 1961–2019. The results for the stations with a statistically significant trend, as revealed by the Mann–Kendall test: (a) Cluj Napoca (Romania) (up), (b) Ljubljana (Slovenia) (in the middle), and (c) the Zagreb (Croatia) (down) station.

Figure 4.
On the y axis, the number of detected WCSPs per year from 1961–2019, and above each bar, the duration of the longest WCSP for the respective year. Significant decreasing trends are represented by downward triangles. With a dark blue triangle, the statistically significant negative trend for the number of cold spells per year, and with a light blue triangle, the statistically significant negative trend for the duration of cold spells.

Figure 5.
The longest WCSP. It took place in Belgrade (Serbia), in the period 12 January 1963–4 February 1963. The vertical axis shows the DailyTmin in °C and the horizontal axis the days.
Figure 5.
The longest WCSP. It took place in Belgrade (Serbia), in the period 12 January 1963–4 February 1963. The vertical axis shows the DailyTmin in °C and the horizontal axis the days.

Figure 6.
The mean 500 hPa anomalies for the cyclonic type Cne during the WCSPs for the climatological period 1961–2019 (red border), and the anomaly maps during WCSPs at 500 hPa (the other maps).
Figure 6.
The mean 500 hPa anomalies for the cyclonic type Cne during the WCSPs for the climatological period 1961–2019 (red border), and the anomaly maps during WCSPs at 500 hPa (the other maps).

Figure 7.
The mean 1000 hPa anomalies for the anticyclonic type Anw during the WCSPs for the climatological period 1961–2019 (red border), and the anomaly maps during WCSPs at 1000 hPa (the other maps).
Figure 7.
The mean 1000 hPa anomalies for the anticyclonic type Anw during the WCSPs for the climatological period 1961–2019 (red border), and the anomaly maps during WCSPs at 1000 hPa (the other maps).

Figure 8.
The differences that arose between the anomaly maps during WCSPs, and the mean synoptic situation at 500 hPa.
Figure 8.
The differences that arose between the anomaly maps during WCSPs, and the mean synoptic situation at 500 hPa.

Figure 9.
Vertical cross-section of the geopotential height anomalies. The daily geopotential height anomalies at 12 pressure levels are shown for the 24 days of the longest WCSP at Belgrade station using 1981–2010 base period (https://psl.noaa.gov/, accessed on 25 November 2021). The blue (red) colors represent negative (positive) values of anomalies.


Table 1.
The geographical characteristics of the stations used in the study.
| Stations | Country | Longitude (°) | Latitude (°) | Altitude (m) | |
|---|---|---|---|---|---|
| 1 | Bacau | Romania | 27.08 | 46.65 | 184 |
| 2 | Belgrade | Serbia | 20.46 | 44.82 | 132 |
| 3 | Botosani | Romania | 2.668 | 47.73 | 133 |
| 4 | Bucuresti | Romania | 26.08 | 44.52 | 90 |
| 5 | Buzau | Romania | 26.81 | 45.16 | 97 |
| 6 | Cluj Napoca | Romania | 23.57 | 46.78 | 18 |
| 7 | Craiova | Romania | 23.81 | 44.33 | 116 |
| 8 | Deva | Romania | 22.91 | 45.87 | 209 |
| 9 | Drobeta | Romania | 22.63 | 44.63 | 410 |
| 10 | Galati | Romania | 28.03 | 45.43 | 53 |
| 11 | Gospic | Croatia | 15.37 | 44.55 | 564 |
| 12 | Ljubljana | Slovenia | 14.52 | 46.07 | 299 |
| 13 | Miercurea | Romania | 25.80 | 46.38 | 661 |
| 14 | Nis | Serbia | 21.9 | 43.33 | 201 |
| 15 | Novi Sad | Serbia | 19.85 | 43.33 | 84 |
| 16 | Ogulin | Croatia | 15.27 | 45.2 | 326 |
| 17 | Rijeka | Croatia | 14.45 | 45.33 | 120 |
| 18 | Rosiori de Vede | Romania | 24.99 | 44.10 | 102 |
| 19 | Sarajevo | Bosnia and Herzegovina | 18.42 | 43.87 | 630 |
| 20 | Split | Croatia | 16.43 | 43.52 | 122 |
| 21 | Thessaloniki | Greece | 22.95 | 40.62 | 2 |
| 22 | Varazdin | Croatia | 14.98 | 44.82 | 167 |
| 23 | Zadar | Croatia | 15.21 | 44.13 | 5 |
| 24 | Zagreb | Croatia | 15.98 | 45.82 | 156 |
| 25 | Zavizan | Croatia | 14.98 | 44.82 | 1594 |
Table 2.
The average number of days with Tmin ≤ 0 and Tmax ≤ 0 per year. In blue, the highest value, and in red, the lowest value.
Table 2.
The average number of days with Tmin ≤ 0 and Tmax ≤ 0 per year. In blue, the highest value, and in red, the lowest value.
| Stations | Country | Days with Tmin ≤ 0 | Days with Tmax ≤ 0 |
|---|---|---|---|
| Bacau | Romania | 94 | 22 |
| Belgrade | Serbia | 59 | 16 |
| Botosani | Romania | 120 | 36 |
| Bucharest | Romania | 98 | 22 |
| Buzau | Romania | 94 | 22 |
| Cluj Napoca | Romania | 107 | 34 |
| Craiova | Romania | 109 | 24 |
| Deva | Romania | 95 | 21 |
| Drobeta | Romania | 77 | 14 |
| Galati | Romania | 107 | 27 |
| Gospic | Croatia | 102 | 23 |
| Ljubljana | Slovenia | 80 | 18 |
| Miercurea | Romania | 135 | 21 |
| Nis | Serbia | 75 | 15 |
| Novi Sad | Serbia | 80 | 20 |
| Ogulin | Croatia | 84 | 21 |
| Rijeka | Croatia | 19 | 1 |
| Rosiori de Vede | Romania | 94 | 27 |
| Sarajevo | Bosnia and Herzegovina | 101 | 23 |
| Split | Croatia | 7 | 0 |
| Thessaloniki | Greece | 17 | 1 |
| Varazdin | Croatia | 88 | 20 |
| Zadar | Croatia | 11 | 0 |
| Zagreb | Croatia | 55 | 14 |
| Zavizan | Croatia | 126 | 63 |
Table 3.
The 5th percentile in the empirical winter minimum temperature distributions (Tmin5th (°C)), total number of WCSPs, the mean duration for the period 1961–2019, the duration and the year of the longest WCSPs. In blue, the lowest values, and in red, the highest values.
Table 3.
The 5th percentile in the empirical winter minimum temperature distributions (Tmin5th (°C)), total number of WCSPs, the mean duration for the period 1961–2019, the duration and the year of the longest WCSPs. In blue, the lowest values, and in red, the highest values.
| Stations | Country | Tmin5th (°C) | Total Number of WCSPs | Mean Duration of WCSPs (Days) | Duration of the Longest WCSPs (Days) | The Year of the Longest WCSPs |
|---|---|---|---|---|---|---|
| Bacau | Romania | −14.0 | 48 | 5.1 | 18 | 1962–1963 |
| Belgrade | Serbia | −7.2 | 53 | 5.6 | 24 | 1962–1963 |
| Botosani | Romania | −14.4 | 53 | 4.6 | 14 | 1984–1985 |
| Bucharest | Romania | −11.9 | 48 | 4.7 | 15 | 1962–1963 |
| Buzau | Romania | −11.2 | 48 | 5 | 16 | 1961–1962 |
| Cluj Napoca | Romania | −13.9 | 54 | 5.2 | 17 | 1962–1963 |
| Craiova | Romania | −10.5 | 56 | 4.7 | 20 | 1962–1963 |
| Deva | Romania | −11.8 | 42 | 5.5 | 14 | 1981–1982 |
| Drobeta | Romania | −8.9 | 56 | 5.1 | 20 | 1962–1963 |
| Galati | Romania | −10.9 | 51 | 4.8 | 18 | 1962–1963 |
| Gospic | Croatia | −13.3 | 49 | 4.5 | 12 | 1984–1985 |
| Ljubljana | Slovenia | −8.8 | 56 | 5.2 | 23 | 1962–1963 |
| Miercurea | Romania | −22.5 | 47 | 4.3 | 13 | 1962–1963 |
| Nis | Serbia | −8.9 | 45 | 5.3 | 18 | 1962–1963 2011–2012 |
| Novi Sad | Serbia | −10.7 | 49 | 5.2 | 21 | 1962–1963 |
| Ogulin | Croatia | −11.1 | 47 | 4.9 | 13 | 1962–1963 |
| Rijeka | Croatia | −2.2 | 54 | 4.9 | 15 | 2011–2012 |
| Rosiori de Vede | Romania | −12.5 | 51 | 4.6 | 15 | 1962–1963 |
| Sarajevo | Bosnia and Herzegovina | −13.3 | 49 | 4.7 | 12 | 1984–1985 |
| Split | Croatia | 0.3 | 57 | 4.9 | 13 | 2011–2012 |
| Thessaloniki | Greece | −1.6 | 60 | 4.5 | 12 | 1962–1963 |
| Varazdin | Croatia | −11 | 60 | 4.1 | 12 | 1962–1963 1963–1964 |
| Zadar | Croatia | −0.7 | 59 | 5.0 | 20 | 1962–1963 |
| Zagreb | Croatia | −6.1 | 58 | 4.8 | 18 | 1963–1964 |
| Zavizan | Croatia | −14.6 | 62 | 4.7 | 17 | 2011–2012 |
Table 4.
The percentage of days (%) of occurrence of the circulation types per station during and before (day-1, day-2) the start of WCSPs at both of geopotential heights (500 hPa, 1000 hPa). The highest percentage of circulation type per station is shown in red color.
Table 4.
The percentage of days (%) of occurrence of the circulation types per station during and before (day-1, day-2) the start of WCSPs at both of geopotential heights (500 hPa, 1000 hPa). The highest percentage of circulation type per station is shown in red color.
| During WCSPs 500 hPa | During WCSPs 1000 hPa | Day-1 500 hPa | Day-1 1000 hPa | Day-2 500 hPa | Day-2 1000 hPa | ||||||||
|---|---|---|---|---|---|---|---|---|---|---|---|---|---|
| Station | Country | Cse | Cne | Anw | Ane | Cse | Cne | Anw | Cse | Cse | Cne | Cse | Cne |
| Bacau | Romania | 23.9 | 26.3 | 12.1 | 17.8 | 35.4 | 27.1 | 12.5 | 27.1 | 25.0 | 33.3 | 20.8 | 16.7 |
| Belgrade | Serbia | 23.7 | 27.8 | 19.3 | 10.5 | 26.4 | 35.8 | 15.1 | 15.1 | 18.9 | 35.8 | 22.6 | 20.8 |
| Botosani | Romania | 22.4 | 20.7 | 10.6 | 20.3 | 18.9 | 28.3 | 11.3 | 32.1 | 22.6 | 34.0 | 17.0 | 11.3 |
| Bucharest | Romania | 27.4 | 25.7 | 13.3 | 14.2 | 28.0 | 22.0 | 18.0 | 26.0 | 24.0 | 26.0 | 26.0 | 10.0 |
| Buzau | Romania | 26.8 | 277 | 14.9 | 12.8 | 37.5 | 16.7 | 16.7 | 27.1 | 33.3 | 22.9 | 33.3 | 8.3 |
| Cluj Napoca | Romania | 29.5 | 24.0 | 13.8 | 16.9 | 21.8 | 25.5 | 20.0 | 20.0 | 27.3 | 34.5 | 23.6 | 16.4 |
| Craiova | Romania | 26.8 | 22.5 | 13.6 | 18.6 | 37.9 | 17.2 | 19.0 | 25.9 | 20.7 | 29.3 | 25.9 | 3.4 |
| Deva | Romania | 26.5 | 27.0 | 13.5 | 13.5 | 26.2 | 21.4 | 16.7 | 28.6 | 11.9 | 45.2 | 21.4 | 16.7 |
| Drobeta | Romania | 24.0 | 22.6 | 16.6 | 17.3 | 33.9 | 21.4 | 19.6 | 25.0 | 19.6 | 30.4 | 25.0 | 5.4 |
| Galati | Romania | 27.4 | 25.8 | 17.1 | 18.7 | 26.9 | 30.8 | 19.2 | 23.1 | 23.1 | 30.8 | 15.4 | 9.6 |
| Gospic | Croatia | 17.4 | 25.6 | 14.2 | 7.8 | 16.3 | 18.4 | 20.4 | 18.4 | 18.4 | 26.5 | 12.2 | 18.4 |
| Ljubljana | Slovenia | 18.9 | 23.4 | 19.2 | 6.9 | 25.0 | 28.6 | 19.6 | 16.1 | 25.0 | 30.4 | 19.6 | 12.5 |
| Miercurea | Romania | 22.6 | 16.1 | 15.1 | 23.6 | 18.2 | 27.3 | 27.3 | 11.4 | 31.8 | 22.7 | 11.4 | 13.6 |
| Nis | Serbia | 21.7 | 25.4 | 19.2 | 8.8 | 24.4 | 26.7 | 20.0 | 17.8 | 31.1 | 24.4 | 15.6 | 11.1 |
| Novi Sad | Serbia | 18.0 | 26.1 | 16.4 | 13.4 | 14.3 | 26.5 | 20.4 | 12.2 | 14.3 | 38.8 | 10.2 | 18.4 |
| Ogulin | Croatia | 15.7 | 27.6 | 18.4 | 5.5 | 14.9 | 31.9 | 12.8 | 17.0 | 23.4 | 31.9 | 17.0 | 12.8 |
| Rijeka | Croatia | 23.6 | 23.2 | 22.1 | 6.8 | 22.2 | 40.7 | 11.1 | 27.8 | 27.8 | 35.2 | 27.8 | 18.5 |
| Rosiori de Vede | Romania | 27.5 | 21.5 | 15.9 | 15.0 | 33.3 | 23.5 | 17.6 | 31.4 | 19.6 | 33.3 | 29.4 | 3.9 |
| Sarajevo | Bosnia and Herzegovina | 17.9 | 24.5 | 14.9 | 8.3 | 12.2 | 14.3 | 10.2 | 18.4 | 16.3 | 12.2 | 20.4 | 14.3 |
| Split | Croatia | 20.9 | 23.4 | 20.9 | 5.3 | 19.3 | 38.6 | 10.5 | 19.3 | 19.3 | 31.6 | 21.1 | 24.6 |
| Thessaloniki | Greece | 37.9 | 18.2 | 20.7 | 7.1 | 20.0 | 33.3 | 20.0 | 23.3 | 21.7 | 51.7 | 11.7 | 21.7 |
| Varazdin | Croatia | 19.8 | 26.5 | 17.9 | 9.3 | 23.0 | 18.0 | 16.4 | 18.0 | 19.7 | 23.0 | 29.5 | 11.5 |
| Zadar | Croatia | 25.3 | 21.9 | 22.6 | 7.7 | 21.7 | 36.7 | 11.7 | 18.3 | 26.7 | 28.3 | 25.0 | 18.3 |
| Zagreb | Croatia | 14.6 | 27.2 | 13.9 | 11.7 | 22.4 | 27.6 | 13.8 | 22.4 | 24.1 | 31.0 | 19.0 | 17.2 |
| Zavizan | Croatia | 19.7 | 22.1 | 18.6 | 7.1 | 21.0 | 32.3 | 8.1 | 25.8 | 27.4 | 29.0 | 21.0 | 14.5 |
Table 5.
The percentage of stations with the most prevalent circulation types during and before the start (day-1 and day-2) of WCSPs at 500 hPa and 1000 hPa.
Table 5.
The percentage of stations with the most prevalent circulation types during and before the start (day-1 and day-2) of WCSPs at 500 hPa and 1000 hPa.
| 500 hPa | 1000 hPa | ||
|---|---|---|---|
| During WCSPs | During WCSPs | During WCSPs | During WCSPs |
| 56% of the stations → Cne | 44% of the stations → Cse | 48% of the stations → Anw | 32% of the stations → Ane |
| day−1 | day−2 | day−1 | day−2 |
| 68% of the stations → Cne | 76% of the stations → Cne | 64% of the stations → Cse | 68% of the stations → Cse |
Publisher’s Note: MDPI stays neutral with regard to jurisdictional claims in published maps and institutional affiliations. |
© 2022 by the authors. Licensee MDPI, Basel, Switzerland. This article is an open access article distributed under the terms and conditions of the Creative Commons Attribution (CC BY) license (https://creativecommons.org/licenses/by/4.0/).
Share and Cite
MDPI and ACS Style
Tringa, E.; Tolika, K.; Anagnostopoulou, C.; Kostopoulou, E. A Climatological and Synoptic Analysis of Winter Cold Spells over the Balkan Peninsula. Atmosphere 2022, 13, 1851. https://doi.org/10.3390/atmos13111851
AMA Style
Tringa E, Tolika K, Anagnostopoulou C, Kostopoulou E. A Climatological and Synoptic Analysis of Winter Cold Spells over the Balkan Peninsula. Atmosphere. 2022; 13(11):1851. https://doi.org/10.3390/atmos13111851
Chicago/Turabian StyleTringa, Efstathia, Konstantia Tolika, Christina Anagnostopoulou, and Effie Kostopoulou. 2022. "A Climatological and Synoptic Analysis of Winter Cold Spells over the Balkan Peninsula" Atmosphere 13, no. 11: 1851. https://doi.org/10.3390/atmos13111851
Note that from the first issue of 2016, this journal uses article numbers instead of page numbers. See further details here.