
Variation Characteristics and Source Analysis of Pollutants in Jinghong before and after the COVID-19 Pandemic
1
Xishuangbanna State Ecological Environment Research Institute, Jinghong 666100, China
2
Faculty of Environmental Science and Engineering, Kunming University of Science and Technology, Kunming 650500, China
3
Xishuangbanna Jinrun Environmental Technology Co., Ltd., Jinghong 666100, China
4
Ecological Environment Monitoring Station of Xishuangbanna State, Jinghong 666100, China
*
Author to whom correspondence should be addressed.
Atmosphere 2022, 13(11), 1846; https://doi.org/10.3390/atmos13111846
Submission received: 28 September 2022
/
Revised: 31 October 2022
/
Accepted: 1 November 2022
/
Published: 7 November 2022
(This article belongs to the Special Issue Air Pollution in China (2nd Edition))
Abstract
:With the outbreak of COVID-19 in early 2020, China’s urban epidemic prevention and control policies have caused significant changes in air pollution sources. In order to clarify the change characteristics of urban air pollution in Yunnan Province before and after the epidemic, using statistics and correlation analysis methods, Jinghong city was selected as the research object, and based on the ambient air quality monitoring data (SO2, NO2, CO, O3, PM2.5, and PM10) and meteorological data from 2017 to 2021, the concentration characteristics of air pollutants in Jinghong in the past five years were analyzed, and the sources of air pollutants were analyzed using the local emission source inventory and HYSPLIT model. The results show that: ① The air quality in Jinghong was the worst in 2019 before the outbreak of the epidemic, and then gradually improved, with an average 5-year excellent and good rate of 91.8%. The pollutants are mainly particulate matter and O3. ② Except for SO2, the concentrations of other pollutants have similar seasonal changes, with the highest in spring and the lowest in summer. ③ The air quality in Jinghong is mainly affected by the combined effects of local emissions and external transportation. According to the local emission inventory, biomass combustion sources have the largest contribution to CO, PM2.5, and PM10, mobile sources have the highest share rate of NOx, and industrial enterprises are the largest emission sources of SO2. Air mass backward trajectory research shows that the westward and southerly airflow are the main transport direction of pollutants entering Jinghong, especially in spring, which significantly affects the local pollutant concentration level. In addition, meteorological conditions such as temperature, precipitation, and wind speed also have a great impact on the dilution, diffusion, and transfer of air pollutants in Jinghong. The results of this study further improve the characteristics of the spatial and temporal distribution of air pollutants and pollutant sources in the border areas of China and before and after the epidemic, and also provide a theoretical basis for air environment management in the border areas.
1. Introduction
The rapid development of urbanization and industrialization not only brings convenience to human life but also causes a series of pollution to the environment, especially the serious deterioration of urban air quality. Air pollutants, including gaseous pollutants and particulate matter, have important impacts on climate, the atmospheric environment, and human health [1,2]. Long-term exposure to airborne PM2.5 and PM10 can result in cancer, early death, weakened immune systems, chronic respiratory and cardiovascular disorders, impaired lung function, and lung tissue damage [3]. O3 can cause urban photochemical haze pollution, damage locals’ health, and interfere with plants’ normal physiological processes, which can stunt plant growth and significantly lower crop yields [3,4]. Chronically high levels of CO, SO2, and NO2 can exacerbate cardiovascular conditions, lead to respiratory conditions, change the pulmonary defense system, and potentially harm the central nervous system [5]. Therefore, the research on air pollutants has been highly valued by the public and government departments.
In recent years, a large number of researches on air pollution have been carried out both domestically and overseas. Su Hanxiao et al. used ambient PM2.5 samples collected in the spring and winter of 2015 from Beijing and Tangshan city to analyze the pollution characteristics and sources of PM2.5 [6]. They found that dust sources, mobile sources, coal combustion sources, and biomass burning were the primary sources of PM2.5 at each sampling location. By using a backward trajectory model, Zemmer et al. investigated the invasion of ragweed pollen in Istanbul, Turkey [7]. Three time scales—annual, quarterly, and monthly—were utilized by Xiao Yue et al. to study the spatial and temporal distribution characteristics of air quality in China over the previous ten years [8]. He et al.’s analysis and quantification of the influence of weather and regional meteorological variables on variations in urban particulate matter concentrations used a variety of statistical techniques [9]. Wang Shiqiang et al. [10] conducted a study on the transport channel characteristics of atmospheric pollutants in the Guangzhou area. The southwestern region has received less attention than the eastern and southeastern regions, which have had significant economic growth and frequent human activities.
There are four national ports of entry in Jinghong: the Kunman International Corridor, the Pan-Asian Railway Central Line, and the Lancang River–Mekong River, which connects six nations (China, Myanmar, Lao, Thailand, Cambodia, Vietnam). Due to its special location, it serves as a crucial hub for the national “Belt and Road” strategy, the Lancang–Mekong cooperation mechanism, and the front of Yunnan Province’s radiation center facing Southeast Asia. Home to China’s only tropical rainforest nature reserve, which has won such awards as one of the world’s 12 hottest tourist destinations, Jinghong’s pillar industry is tourism, but in spring, there are consecutive days of heavy pollution. The study of air pollution and environmental regulation is, therefore, very important. The most recent investigations about air pollution in Mengla County, Xishuangbanna Prefecture [11], and studies on a variety of contaminants in Jinghong’s capital city are few. Therefore, using data from SO2, NO2, CO, O3, PM2.5, and PM10 concentrations from 2017 to 2021 from two environmental monitoring stations in Jinghong, as well as meteorological data from the same period, this paper analyzed the characteristics of temporal changes in atmospheric pollutant concentrations in Jinghong and their relationship with meteorological elements and explored the causes of pollutant sources and concentration changes in an effort to improve the atmospheric environment. The objective was to establish a scientific foundation for enhancing Jinghong City’s atmospheric conditions and developing workable air pollution management strategies.
2. Materials and Methods
2.1. Overview of the Research Area and the Monitoring Locations
Jinghong City, which is a part of the Xishuangbanna Dai Autonomous Prefecture of Yunnan Province, is situated between 100°25′ and 101°31′ East longitude, 21°27′ and 22°36′ North latitude. It is in the southern part of Yunnan Province. It has a national boundary that is 112.39 km long and a land area of 6867 square kilometers. It is bordered by Jiangcheng County and Mengla County in the east, Menghai County and Lancang County in the west, Pu’er City in the north, Myanmar in the south, and Laos and Thailand close by. At 2196.6 m above sea level, Nanlejiaomei, the major peak of Lunan Mountain, is the highest point. The lowest point is 485 m above sea level at the confluence of the Nan’a and Lancang rivers, while the urban area is 552.7 m above sea level. The year-round heat is divided into a rainy season and a dry season; the rainy season lasts for five months (May–October), and the dry season lasts for seven months (October–May), with rainfall accounting for more than 80% of the annual precipitation. Jiangbei Station (100°48′06″ E, 22°01′21″ N) and Jiangnan Station (100°47′38″ E, 22°00′07″ N) are two monitoring stations.
2.2. Data Sources and Processing Methods
This study utilized the urban 24 h daily average and hourly data of six air pollutant concentrations (SO2, NO2, CO, O3, PM2.5, and PM10) from two environmental monitoring stations in Jinghong from 2017 to 2021. The National Environmental Monitoring Center of China (http://106.37.208.233:20035/ (accessed on 27 September 2022)) provided the pollution data. The Global Data Assimilation System (GDAS) data from NCEP (National Center for Environmental Prediction) for the years 2017–2021 are the information used in the backward trajectory model. The National Weather Science Data Sharing Service (http://data.cma.cn/ (accessed on 12 March 2022)) was used to obtain the meteorological data. The air pollutant emission inventory data come from the survey results of the local environmental protection department.
According to the Technical Provisions of Ambient Air Quality Index (AQI) (Trial) (HJ633-2012), the primary pollutant refers to the air pollutant with the largest IAQI when AQI is greater than 50. The AQI was divided into 6 grades: 0–50, 51–100, 101–150, 151–200, 201–300, and more than 300, which corresponded to 6 grades of excellent, good, mild, moderate, severe, and severe air quality, respectively. In China’s new Ambient Air Quality Standards (GB3095-2012) issued in 2012, PM2.5, O3, and CO were added as air pollution assessment factors, and the upper limit of the allowable concentration of fine particulate matter in the atmosphere was established for the first time, and the emission thresholds of other pollutants were adjusted. Based on the technical provisions of the ambient air quality index (HJ633-2012) (2012) and ambient air quality standard (GB3095-2012) (2012), the pollutant data and AQI (air quality index) were statistically calculated, and the primary pollutants were determined. While using TrajStat software to look into the transport sources of pollutants, the correlation study between AQI and contaminants was also carried out.
2.3. HYSPLIT Model
The Australian Bureau of Meteorology and the National Oceanic and Atmospheric Center (NOAA) developed the integrated model system known as the HYSPLIT model (BOM). Processes such as airflow movement, deposition, atmospheric pollution transport, and dispersion trajectories may all be calculated and analyzed using this technology [12,13]. It has been extensively utilized to research the sources and transportation routes of air pollution [14,15,16].
In this study, Jinghong’s backward trajectory was analyzed and studied using TrajStat follow-up software [17]. The simulated height was set at 500 m because the wind field at that height can more closely reflect the mean flow characteristics of the boundary layer [18]. The simulated reception location was chosen to be Jinghong (100°47′ E, 22°00′ N), and the reverse trajectory was computed four times per day at 00:00, 06:00, 12:00, and 18:00 UTC for a simulated length of 72 h. For each day of arrival at the receiving point in 2020, the 72 h backward trajectory was estimated to account for the airflow characteristics.
3. Results and Analyses
3.1. The Present State of Jinghong’s Air Quality
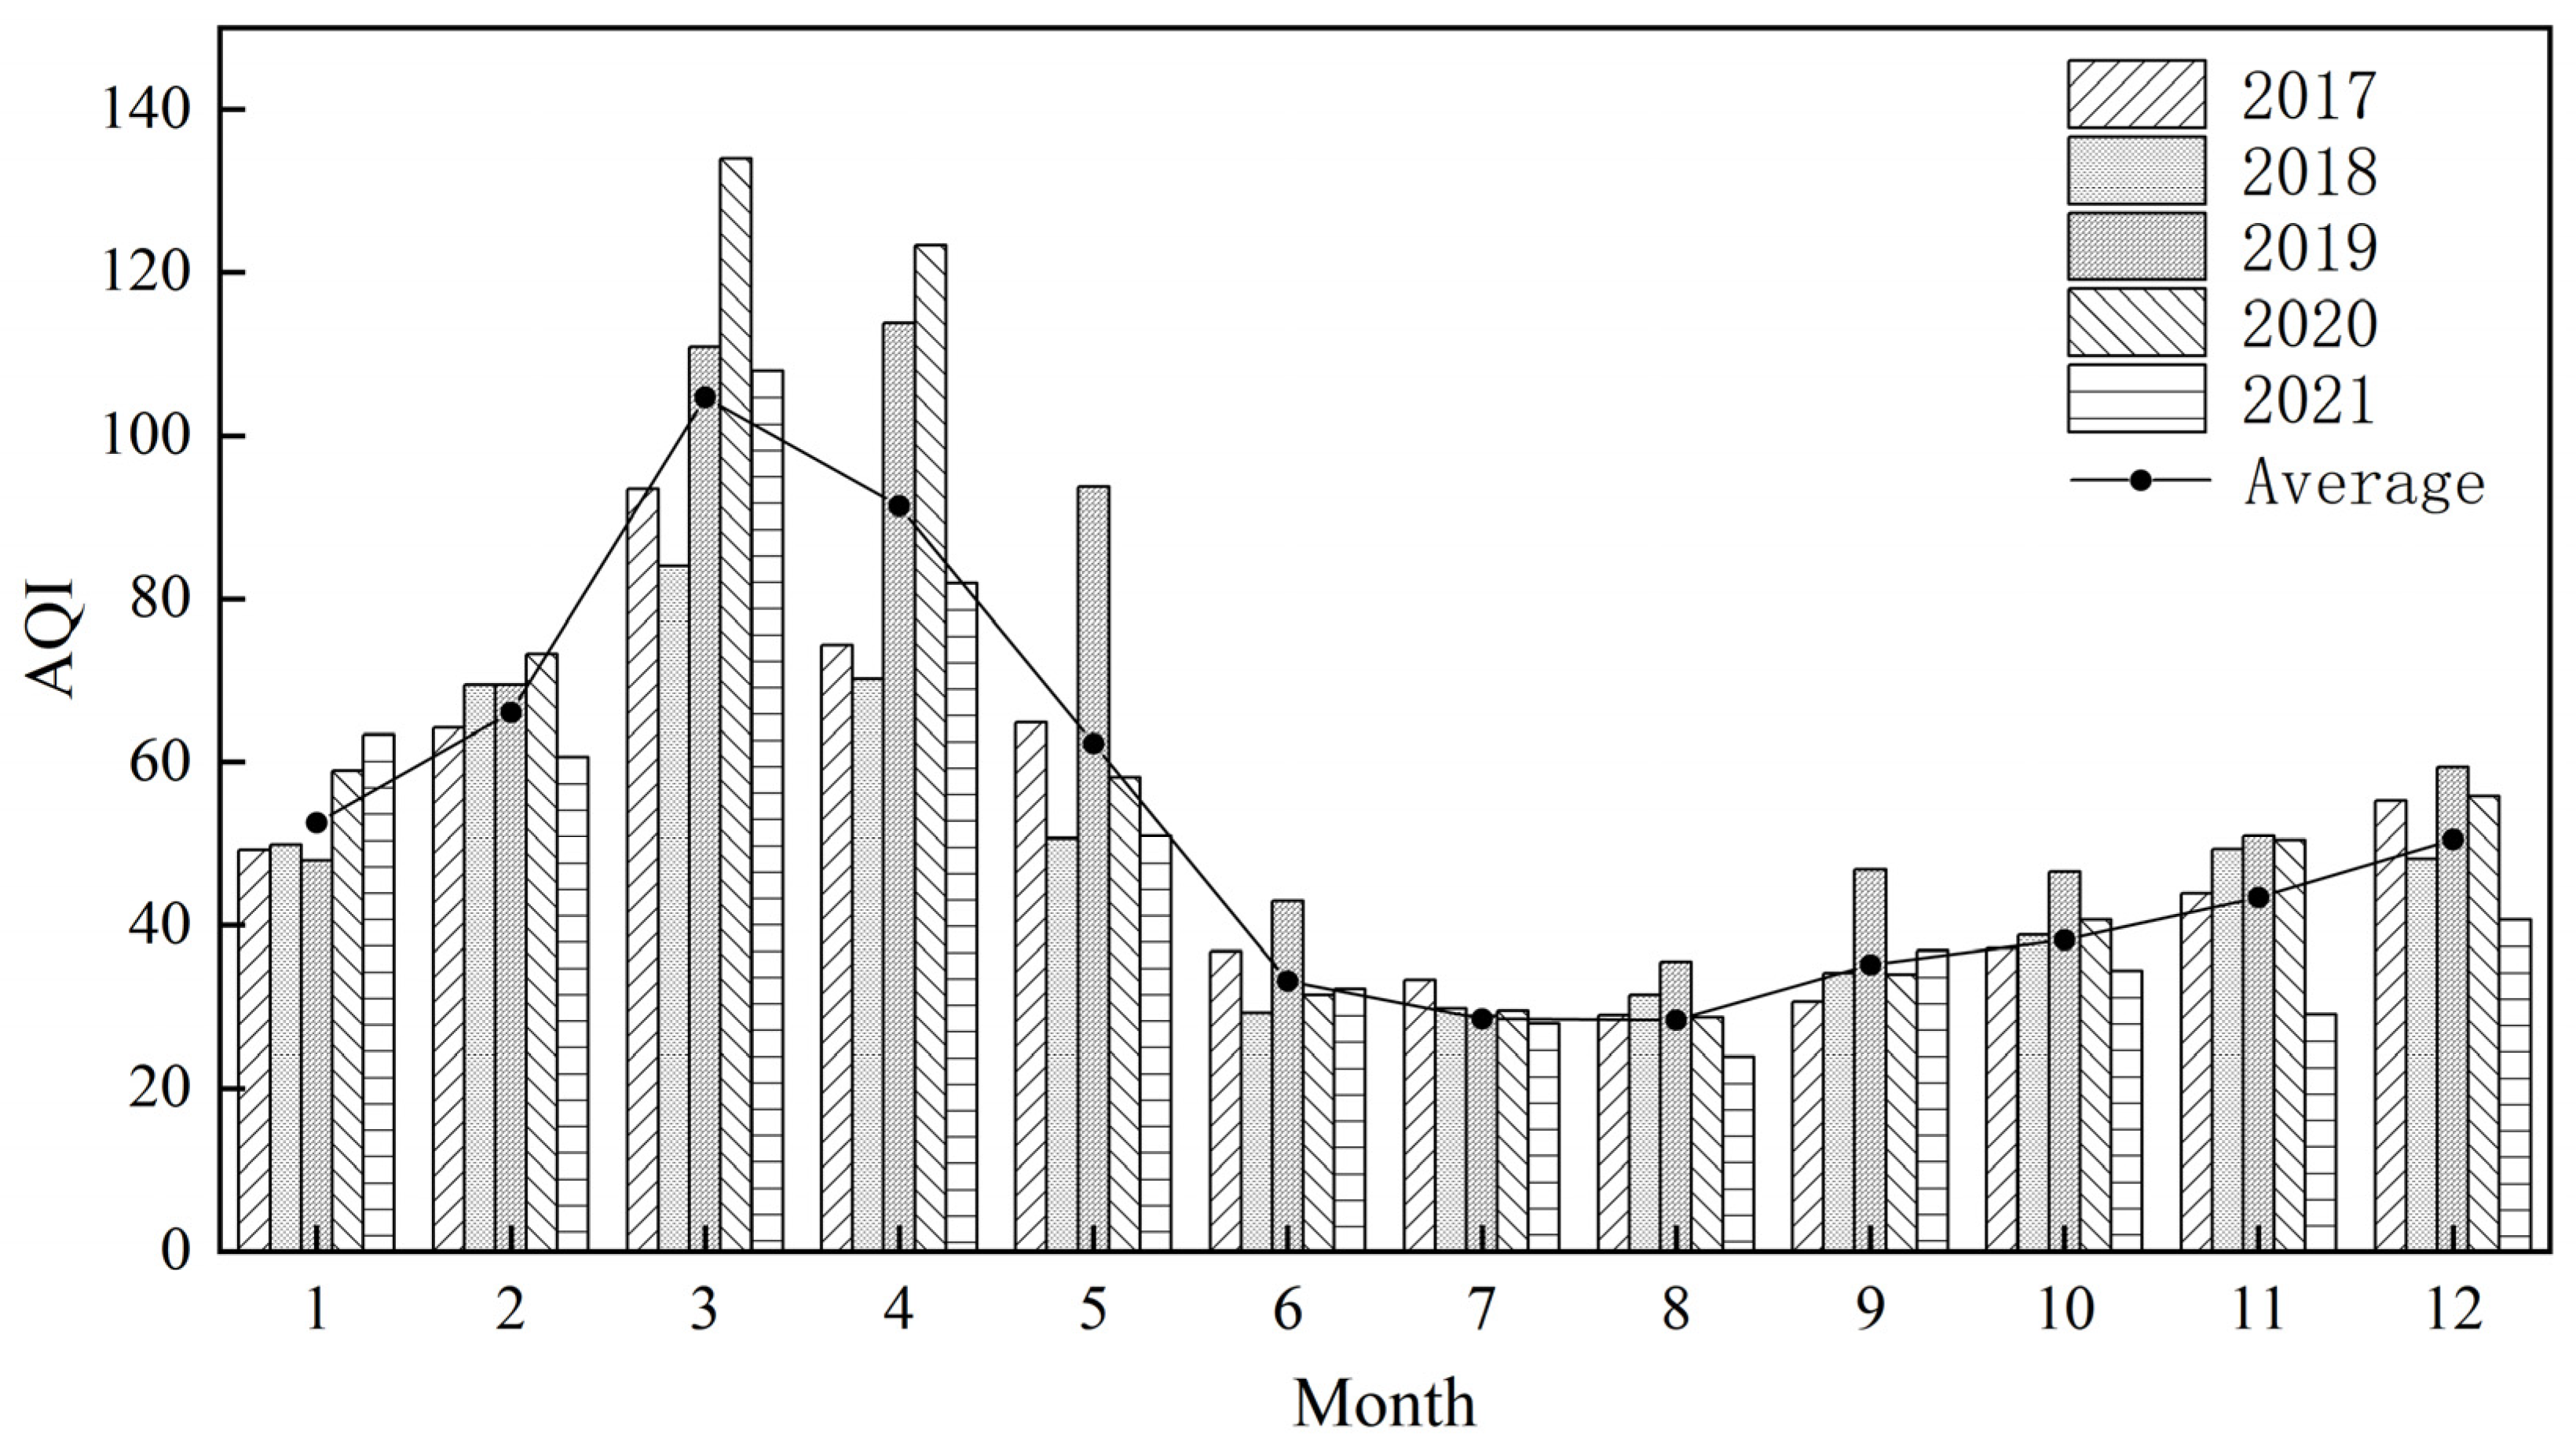
The total effective monitoring days of daily AQI in Jinghong from 2017 to 2021 were 1784 d (Table 1). the average value of AQI was 54.23, and the air quality was mainly excellent and good, with 1638 d of good days and 91.8% of meeting the standard. The number of days with mild pollution and above was 146 d, the exceedance rate was 8.2%, and there was no level 6 (severe pollution) level. Between 2017 and 2021, the good air quality rate in Jinghong was 94.07%, 97.69%, 85.87%, 88.64%, and 92.27%, of which the highest good rate was in 2018, and the air quality in 2021 was level 1. For the highest number of days, 239 days, in 2019 and 2020, the good rate was lower, and there was heavy pollution. This is due to the fact that COVID-19 began to spread rapidly in the whole province and cities in late 2019. Most areas of China have implemented traffic control, factory shutdowns, banning of gatherings, school closures, and company closures [19] since 2020, and the duration and scale of impact are previously incomparable. The development of epidemic prevention work reduced the 2020 annual emissions of air pollutants. It shows that the air quality in Jinghong decreased and then increased in the past 5 years, and the air quality reached its lowest before the COVID-19 pandemic, and the air quality is better overall.
In the previous five years, the monthly average of AQI patterns has been very consistent, all of which exhibit a single-peak cycle type (Figure 1). The periods of rapid increase and fall are January–March and March–June, respectively, and the period from June to December exhibits a steady ascending tendency. The highest value of AQI in other months typically occurs in 2020, which may be related to interannual emission of pollutants, ambient air pollution prevention and control measures of government departments, and weather conditions in that year. The AQI in March and April of spring is significantly larger than that in other months and reaches the highest in 2019. PM2.5 and O3 make up the majority of the defining pollutants in Jinghong, each accounting for 96.47% of the total monitoring days. PM10 was also the main pollutant for 7 days. In terms of season, the frequency of primary pollutants PM2.5 and O3 is high in spring, and the pollution characteristics are light in summer and autumn. In terms of inter-annual variation, the number of days with PM2.5 as the primary pollutant decreased year by year, which may be related to the air pollution control measures taken by Jinghong in the past two years. However, there was a considerable increase in the number of days with O3 as the main pollutant, which may have been caused by the ozone photochemical reaction in the spring, biomass burning, and bad weather in the area.
3.2. Characteristics of Air Pollution
3.2.1. Levels of Pollutant Concentration
The ranges of AQI, SO2, NO2, CO, O3, PM2.5, and PM10 concentrations in Jinghong from 2017 to 2021 were AQI (10 to 295.5), SO2 (1.5 to 47.5 μg∙m−3), NO2 (4 to 58 μg∙m−3), CO (0.2 to 1.8 mg∙m−3 ), O3 (9 to 221 μg∙m−3), PM2.5 (2 to 247.5 μg∙m−3), and PM10 (9 to 230 μg∙m−3) (Table 2). Each pollutant’s concentration values vary greatly throughout the year. Seasons and weather play a role in how pollutants are dispersed, but there may also be significant correlations between boundary layer dispersion, dust from nearby biomass burning [18], and that burning, which significantly raises particulate matter concentration [20]. During the 5-year period, the average concentrations of SO2, NO2, CO, O3, PM2.5, and PM10 were ( 7.38 ± 2.70) μg·m−3, (19.26 ± 9.01) μg·m−3, (0.64 ± 0.22) mg·m−3, (79.03 ± 38.19) μg·m−3, (29.47± 26.65) μg·m−3, and (52.53 ± 36.15) μg·m−3, respectively. The concentrations of SO2, NO2, and CO all met the norm, and O3 concentration values peaked in 2019 before gradually declining over the following years. In 2019, PM2.5 surpassed the annual average limit of the secondary concentration, and PM10 exceeded the annual average limit of the national ambient air pollutant primary concentration by 0.96 and 0.31 times, respectively. These pollutants did not satisfy the threshold for five years. In relation to all government initiatives to reduce emissions and promote environmental protection in the context of national urban environmental promotion, the average annual levels of SO2, NO2, and CO fluctuate less and change in a similar trend with a “W” pattern. The PM2.5/PM10 ratios in Jinghong were 0.52, 0.53, 0.57, 0.62, and 0.54 over five years, which is due to Yunnan Province’s lengthy borderline, which borders numerous agricultural countries and is influenced by the southwest monsoon, and the airflow is the first to pass through the border area of Yunnan, resulting in poor air quality [21]. PM2.5/PM10 was used to identify the sources of different sizes of atmospheric particles [22]. According to research by Chang Jiacheng on the periods of high pollution in Yunnan Province, 67.18% of the PM2.5 pollution was caused by emissions from burning biomass across international borders in Southeast Asia [23]. Qingjian Yang used the air quality model WRF-Chem to simulate a pollution process in Xishuangbanna in the spring of 2017 and discovered that biomass combustion accounted for up to 97% of the air pollution in Jinghong, with an external contribution of more than 90% [24]. The NO2/SO2 ratios were 2.11, 2.91, 3.61, 2.80, and 2.11 in the five-year period, indicating that the contribution of mobile traffic sources first increased and then decreased.
3.2.2. Seasonal Variations of Air Pollutants
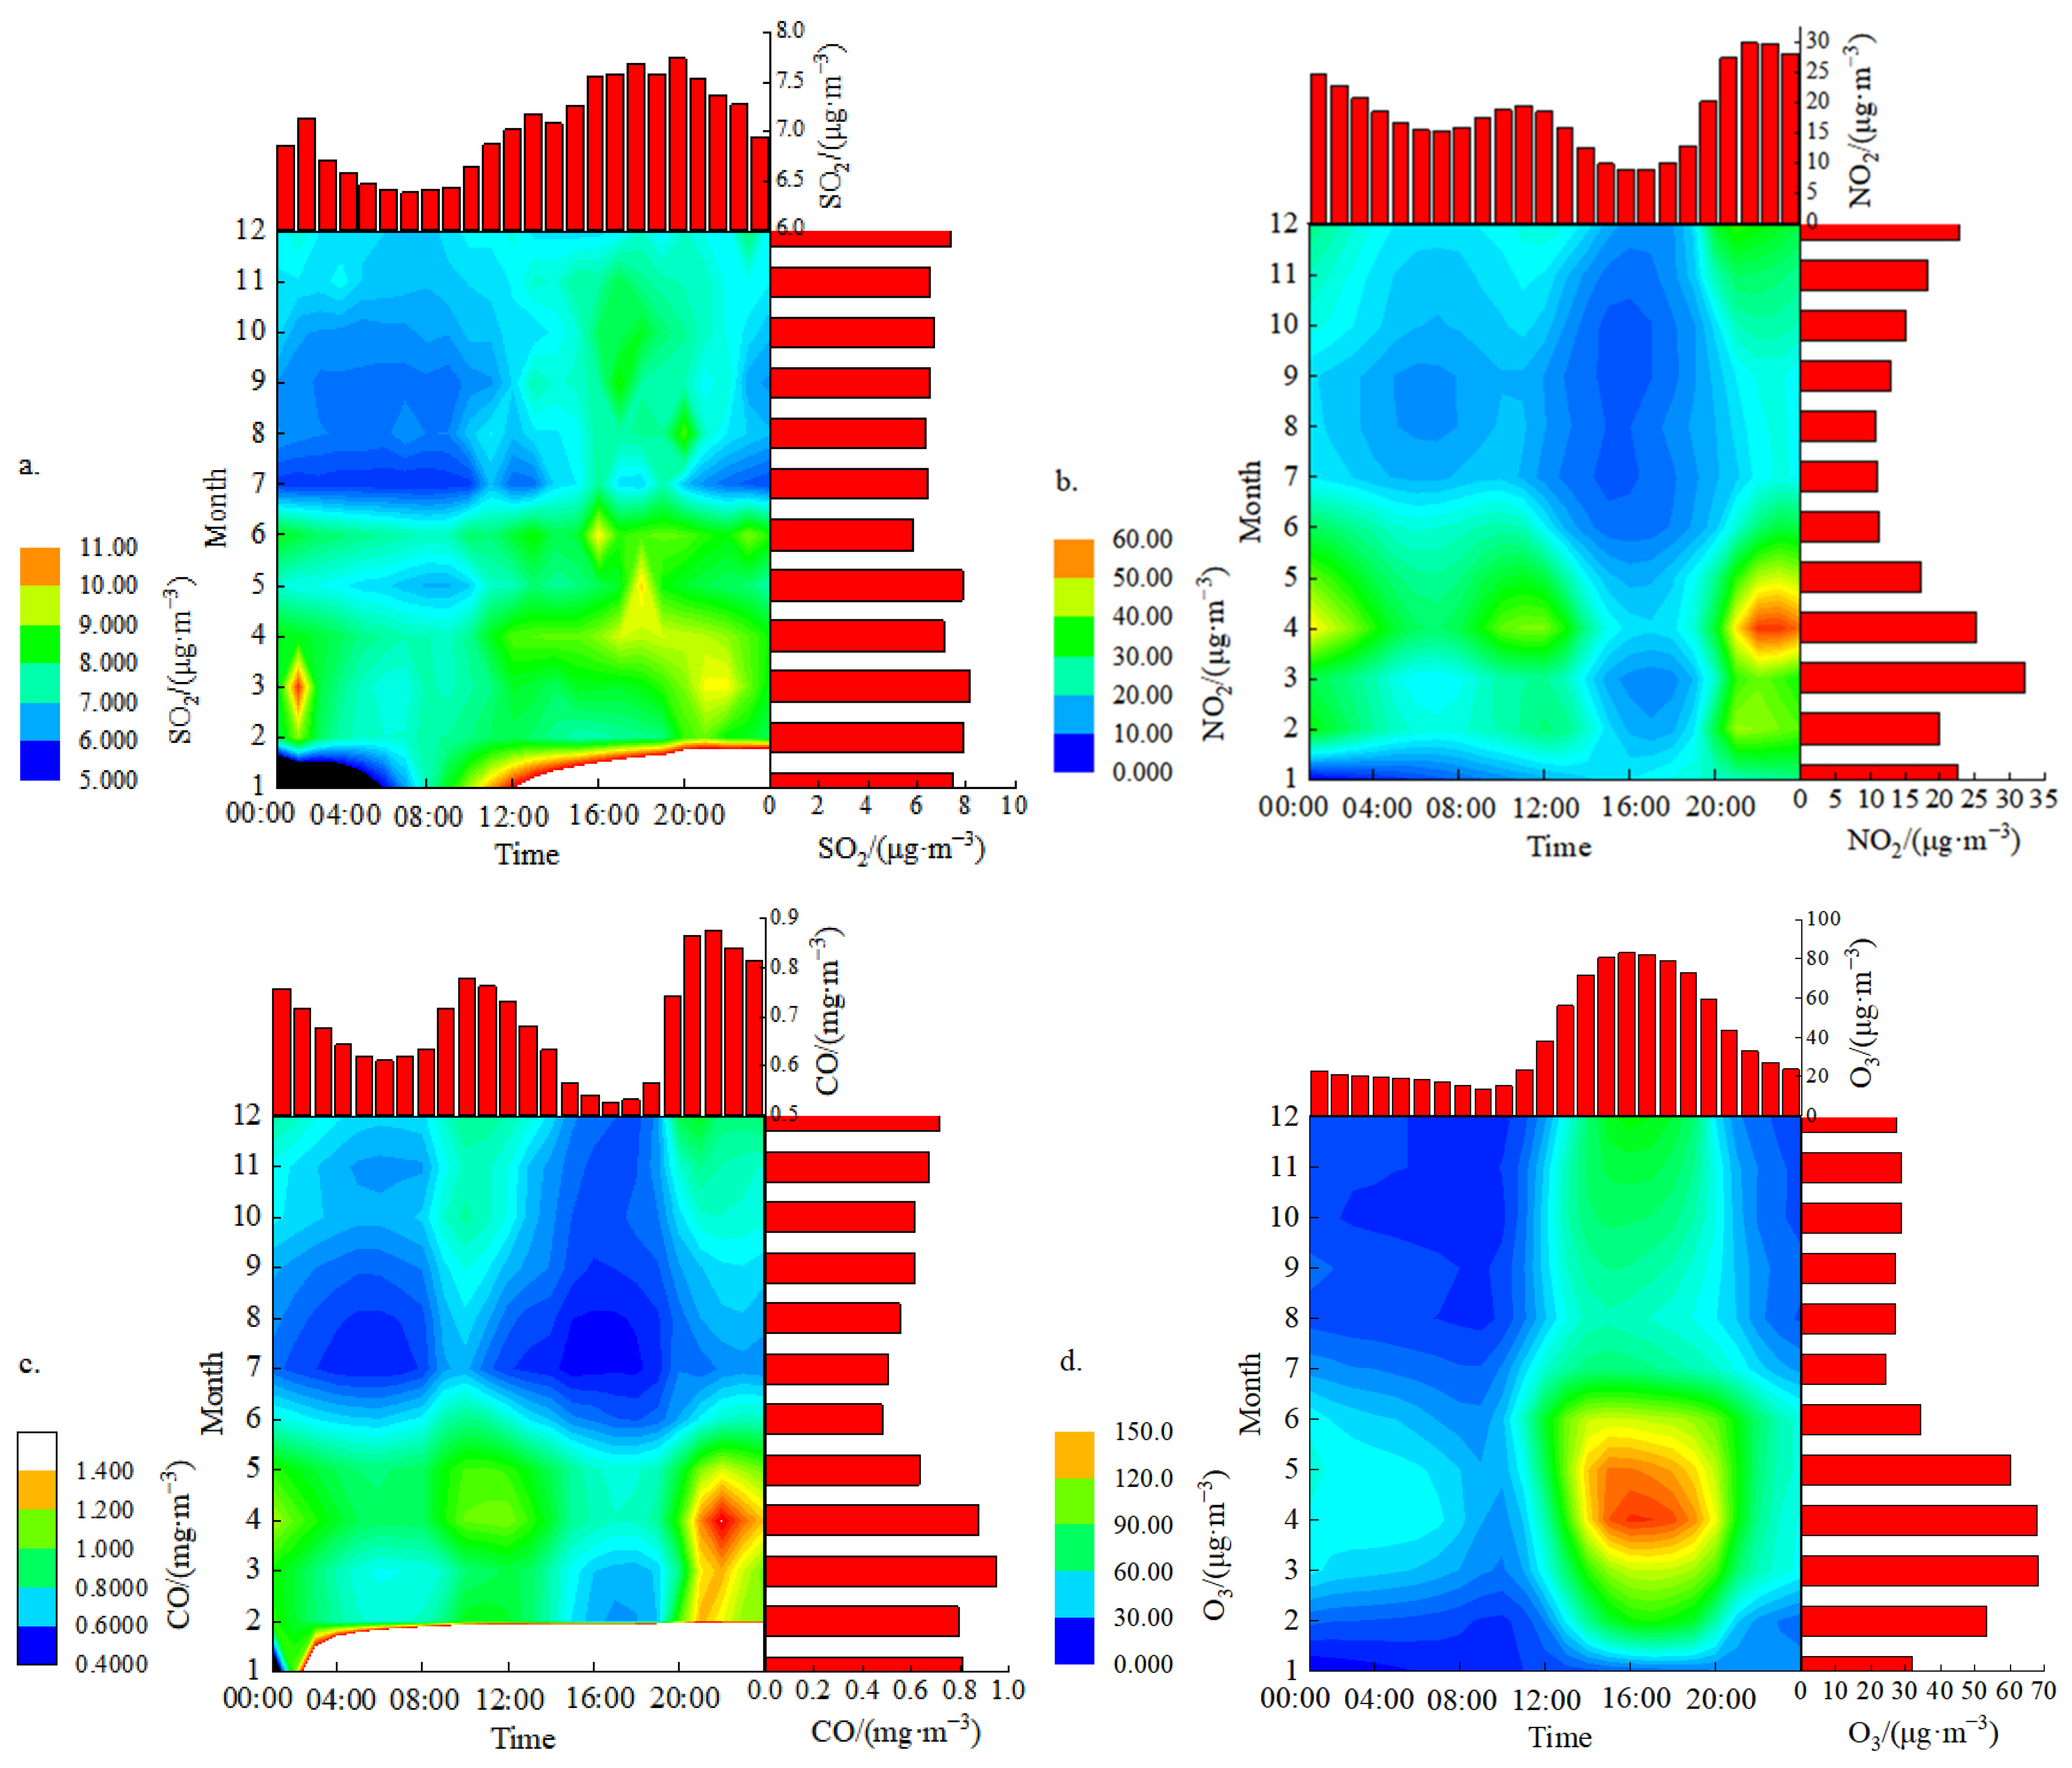
Figure 2 illustrates the “–” pattern of the seasonal variation in SO2, CO, O3, PM2.5, and PM10 concentrations in Jinghong, with spring > winter > autumn > summer. Due to unfavorable meteorological conditions such as winter heating, low boundary layer height, weak winds, and low precipitation, SO2 concentrations peaked in northern cities while SO2 concentrations peaked in southern cities without winter heating, ranging from 5.84 to 8.16 μg∙m−3 10.85 to 32.18 μg∙m−3, 0.48 to 0.95 mg∙m−3, 9.43 to 65.66 μg∙m−3, and 24.83 to 102.35 μg∙m−3 Without heating, the seasonal variability of SO2 concentrations in southern cities are minimal [25], with only minor variations in concentrations and inter-city differences, and no discernible seasonal variations. It is hypothesized that anthropogenic combustion sources and traffic sources, such as motor vehicle exhaust emissions, have an impact on Jinghong that is consistent with earlier studies. The highest monthly concentrations of the first four were found in March, likely as a result of the concentration of biomass combustion in Southeast Asia from February to April and the predominating southwesterly winds, particularly during the 8-day period of heavy pollution from 29 March to 9 April, 2020, when the main pollutant was primarily PM2.5. However, the year-round trends of NO2, CO, PM2.5, PM10, and SO2 were significantly different [26]. June marks the beginning of the rainy season in Yunnan, and 41% of days above 30 °C occurred in the spring. The local O3 concentration rises as a result of the quicker photochemical reaction rate and faster O3 generation.
3.2.3. Daily Variations of Air Pollutants
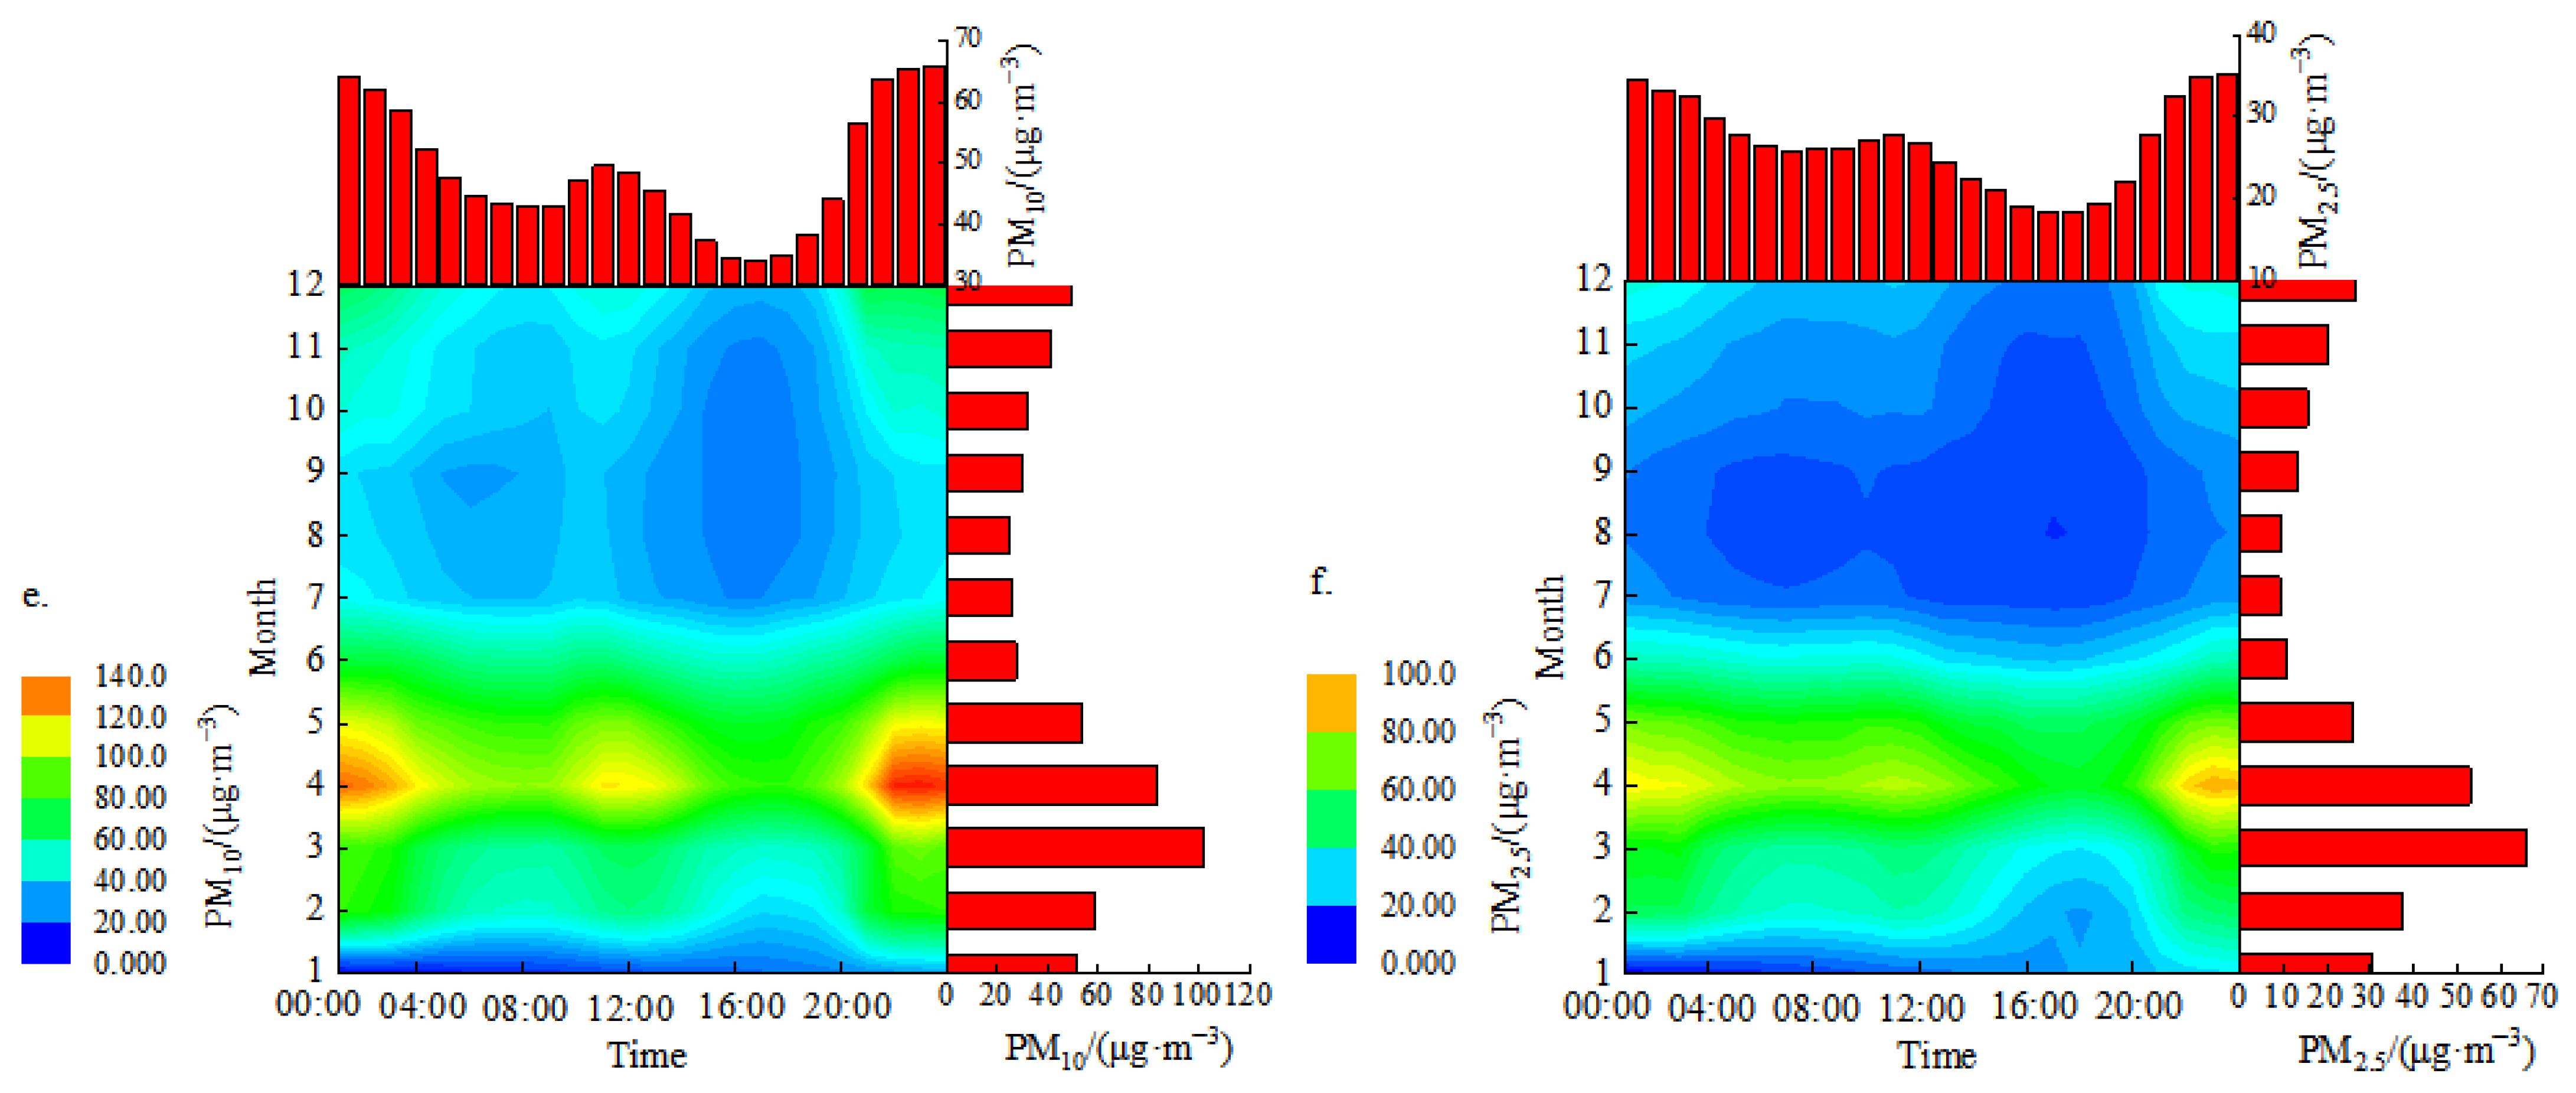
Figure 2 shows the daily changes in six air pollutants. Among them, the SO2 concentration started to increase slowly from 6:00 in the morning, reached the highest value (7.74 μg m−3) at 19:00 in the evening, and then slowly decreased, reaching a high value at 2:00 in the morning, and the SO2 concentration in the afternoon was higher than other time, its diurnal variation is bimodal. The highest and lowest values of O3 appeared at 15:00 pm and 8:00 am, respectively, showing a unimodal characteristic. The diurnal variations of NO2 and CO concentrations were both morning and evening bimodal, with peaks at 10:00 in the morning and 21:00 in the evening and low peaks at 16:00 in the afternoon; the hourly peaks of NO2 concentrations at night were higher than the daytime peaks. The morning rush hour is mainly influenced by human activities and peak motor vehicle traffic. In the afternoon, with the change in solar radiation and the increase in temperature, NOx (NO + NO2) and O3 in the air produce a photochemical reaction, which consumes NO2 and reaches the highest value at 16:00 in the afternoon; with the arrival of the evening peak of traffic, the weakening of the solar radiation intensity and the photochemical reaction in the air produced a large amount of NO2 accumulation, so the phenomenon that the evening peak was higher than the morning peak appeared. In addition, the diurnal variations of PM10 and PM2.5 also showed a morning and evening bimodal pattern, and the peak concentrations at night were higher than those during the day. Such diurnal variation characteristics are similar to NO2, indicating the importance of traffic pollution sources on particulate matter.
3.3. The Relationship between Meteorological Elements and Pollutants
A number of factors can affect and control a region’s ambient air quality and pollutant concentrations, but because the urban environment’s overall subsurface variation is not significant in the short term, pollutant concentrations are primarily influenced by pollutant emissions and meteorological elements [27]. Significant factors in the change in air pollutant concentrations are influenced by meteorological parameters, including temperature, precipitation, and wind speed. The processes of dilution, dispersion, migration, and transformation of pollutants in the atmosphere are largely dependent on meteorological factors in the case of relatively stable pollutant sources [28].
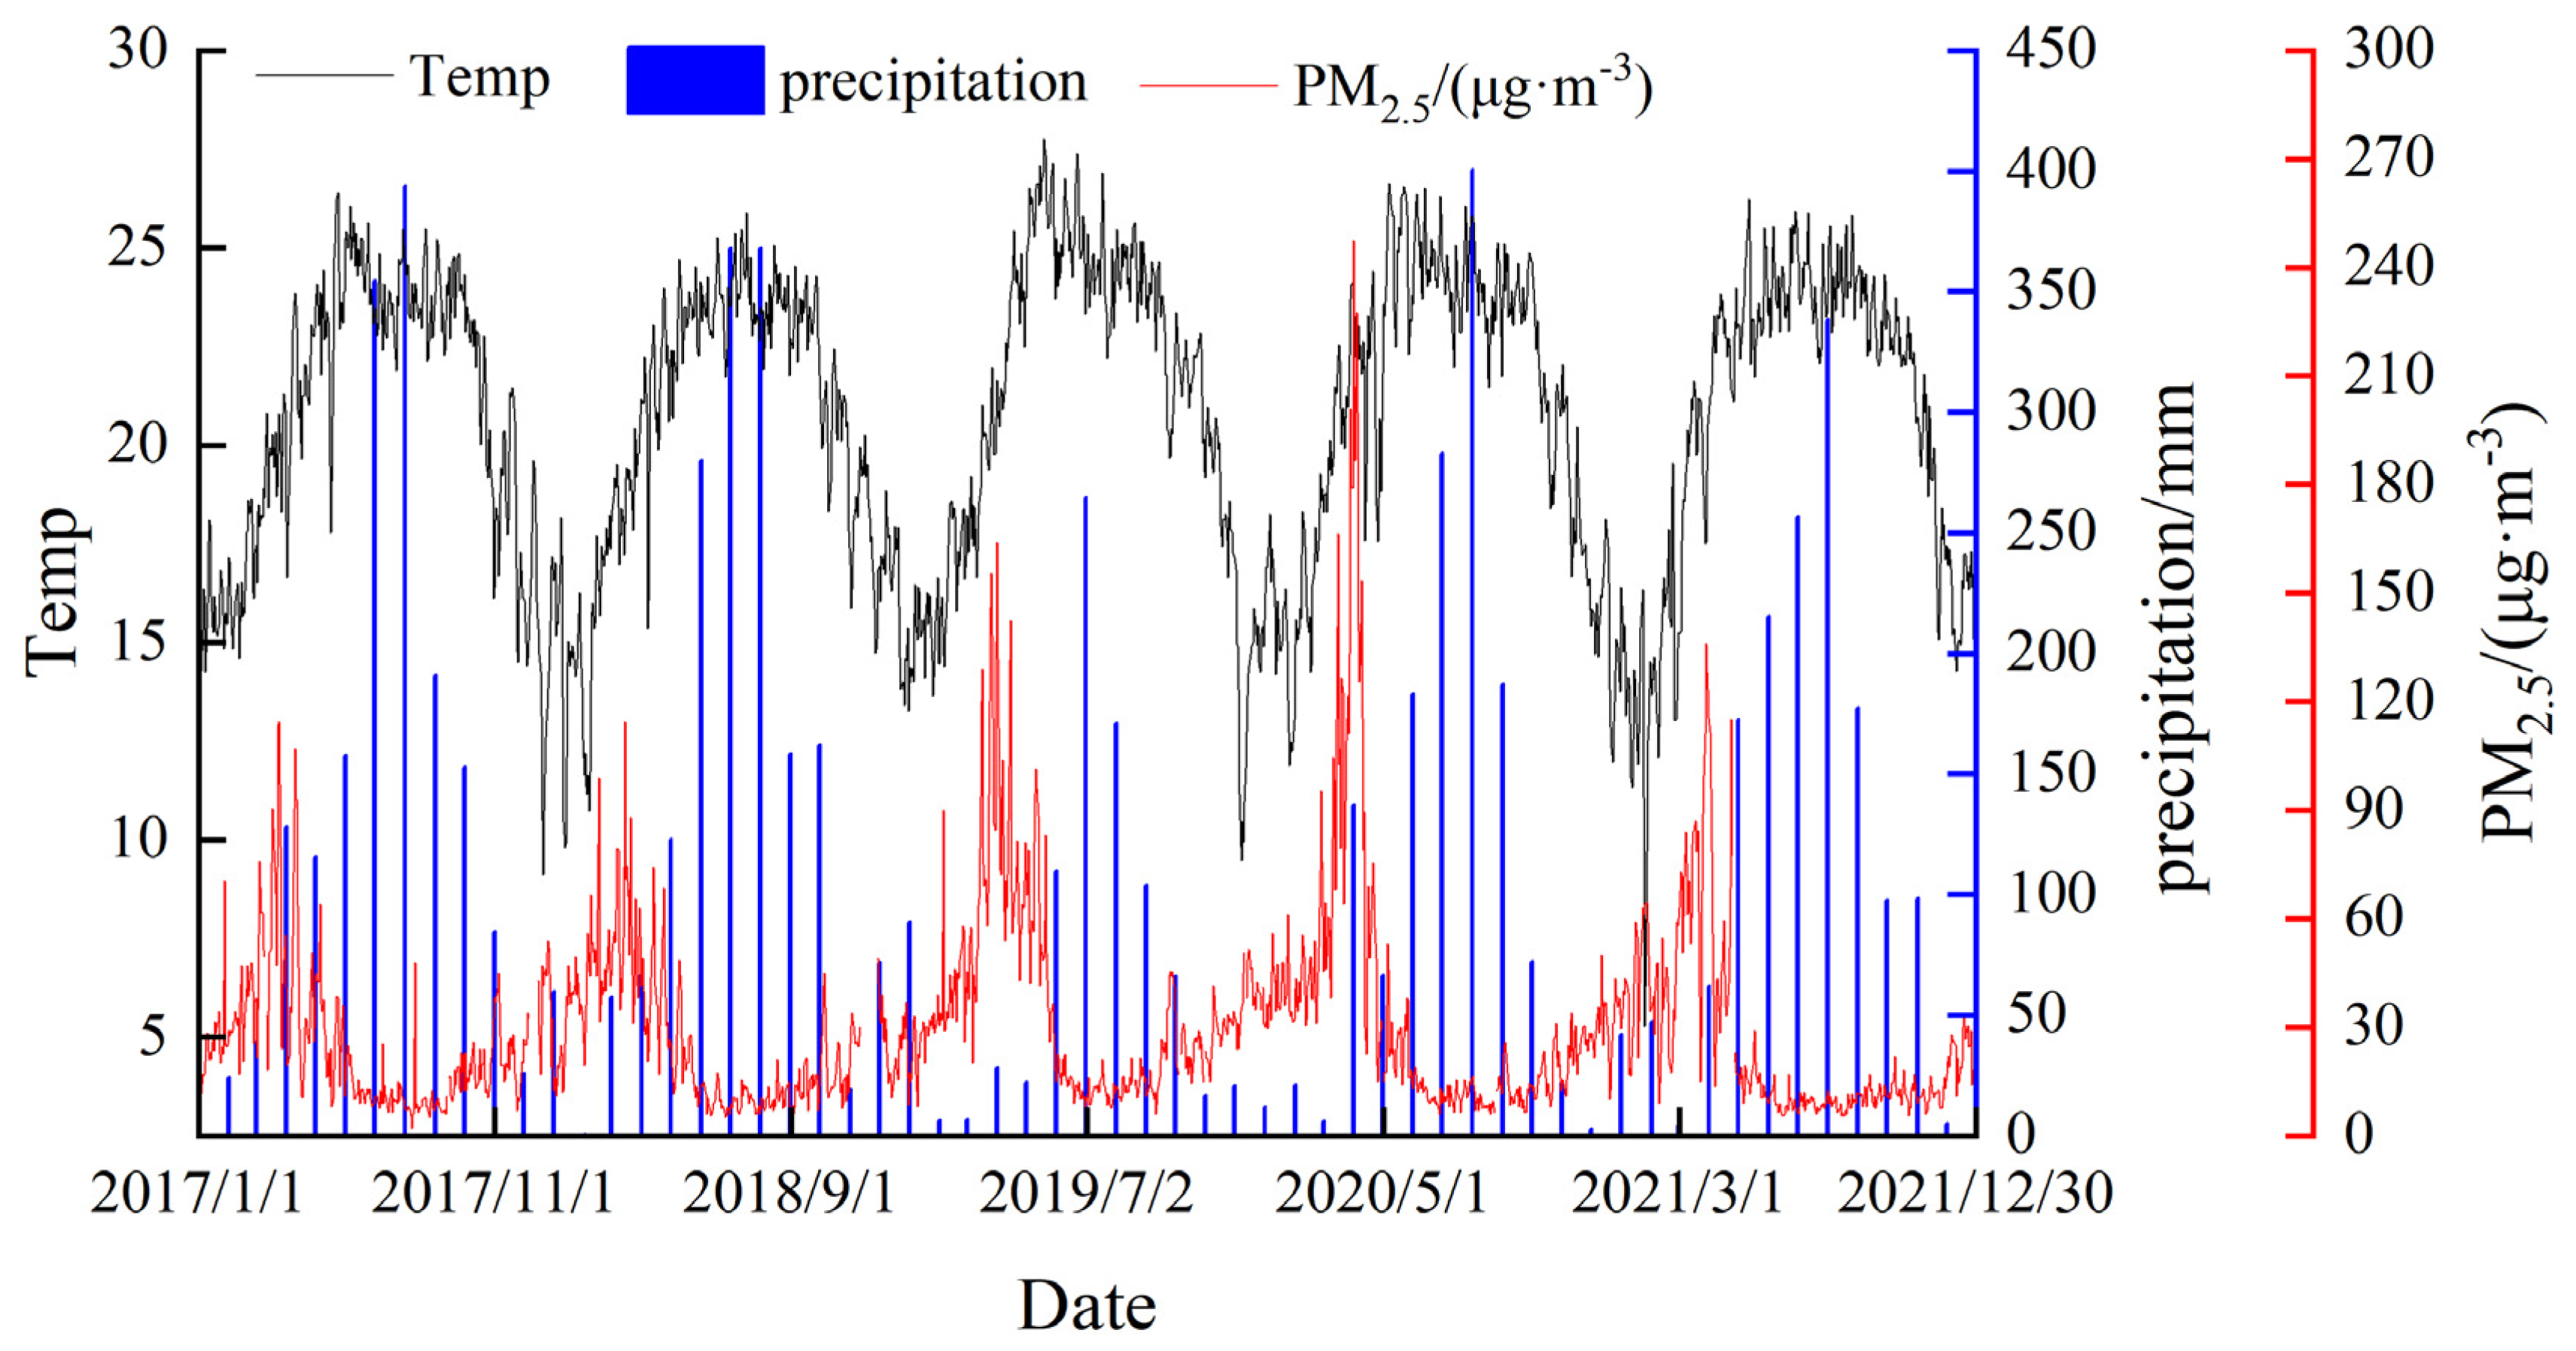
Variations in temperature have a direct effect on changes in dust and gas pollutants [29]. While the opposite is true when the ground temperature is low, high convective activity in the near-ground layer reduces the concentration of pollutants in the near-ground layer by influencing the turbulent mixing of the atmosphere, which in turn affects the diffusion of atmospheric pollutants and their upward transport. The average temperature in Xishuangbanna is 20.64 °C. As depicted in Figure 3, there is a sizable negative association between temperature and PM2.5 concentration. The pollutant concentration steadily rises as the temperature drops, peaking in the spring and falling to its lowest point in the summer of each year.
In the process of cleaning up pollutants, precipitation is crucial. Precipitation can continually dissolve and wash-away water-soluble SO2, NO2, and suspended particulate matter, which lowers the concentration of air pollutants. Figure 3 illustrates how pollution concentrations are comparatively low during precipitation occurrences. Statistics demonstrate that on days with precipitation, as opposed to days without precipitation, the concentration values of pollutants are substantially lower. While it has the least amount of scavenging power for ozone, precipitation has the greatest wet scavenging effect on particulate matter.
Variations in wind direction and wind frequency have a significant impact on the transport and concentration changes in pollutants, and wind speed plays a significant role in the diffusion of atmospheric pollutants. The multi-year monthly average wind speed in Jinghong is between 0.6 and 1.2 m/s, with the maximum wind speed occurring in June. In general, the wind speed in Jinghong is low throughout the year, which is not conducive to the diffusion of atmospheric pollutants. From 2017 to 2021, the multi-year annual average wind speed in Jinghong is 0.8 m/s, and the annual average wind speed is between 0.7 and 1.0 m/s, with small changes (Table 3).
4. Source Apportionment
4.1. Estimation of Source Inventories for Emissions of Air Pollutants
With 2021 as the base year, based on pollution source census data, field research, emission factor accounting, and other methods, the source emission information of major air pollutants in Jinghong is counted, and an air pollution emission inventory that can be used for problem diagnosis, pollution source emission control, and assessment is constructed (Table 4). According to the Table 4, Xishuangbanna Prefecture emits a total of 2296.70 t, 12,591.36 t, 34,572.67 t, 5342.15 t, and 9774.06 t of SO2, NOx, CO, PM2.5, and PM10 in 2021. According to the contribution of various emission sectors to air pollutants, industrial enterprises account for 54% of the SO2 produced by stationary combustion of fossil fuels; 78% of NOx produced by mobile sources and 49% by road-based mobile sources; 45% and 31% of CO produced by biomass combustion sources and mobile sources, respectively; and PM2.5 and PM10 produced primarily by sources of dust (which also produces a large amount of particulate matter).
Jinghong City is dominated by tourism, the contribution of local air pollutant emissions to high concentrations of air pollutants is limited, and the local government has implemented relevant policies such as the “Xishuangbanna State Polluted Weather Response Work Plan”. However, there is still continuous heavy polluted weather in spring, which may also be related to the regional transmission of pollutants.
4.2. Correlation Analysis of AQI and Air Pollutant Concentration
Table 5 shows Spearman correlation analysis revealed that there is a strong correlation between AQI and particulate matter, with the correlation coefficient with PM10 reaching 0.95 and the correlation with particulate matter ranging from large to small in each season: spring > autumn > winter > summer. This suggests that particulate matter, particularly PM10, has a long-term impact on Jinghong’s air quality year-round. In spring, AQI is significantly correlated with PM2.5 and PM2.5 but weakly correlated with SO2 and CO, mainly because PM2.5 and PM2.5 are the primary pollutants most often in spring. The correlation between AQI and O3-8 h and NO2 is higher than that between SO2 and CO for almost the whole year, indicating that compared with SO2 and CO, the air quality of Jinghong City is more affected by O3-8 h and NO2, which echoes the research results of NO2 as the second pollutant mentioned above.
Pollutant correlation analysis revealed a significant correlation between particulate matter and SO2, NO2, and CO, indicating that these pollutants share a common source. Particulate matter can act as a carrier for these pollutants, providing a reaction interface for the development and formation of sulfuric and nitric acids. It may also carry some metal elements, catalyzing the reaction process [30]. The fact that PM2.5 and PM10 have a substantial association shows that their origins are the same or very comparable. The relationships between PM10 and SO2, NO2, and CO are stronger than the relationship between PM10 and PM2.5, demonstrating that particulate matter, particularly respirable particulate matter, is produced during the emission process of gaseous pollutants. Normal SO2, NO2, and CO emissions are frequently accompanied by the generation of secondary aerosol particles such as PM2.5 [31]. These gaseous pollutants are also frequently linked to the emission of particulate matter. However, O3 is not significantly associated with SO2, NO2, or CO. This is likely because O3 is depleted throughout the oxidation process [32].
4.3. Backward Trajectory and Cluster Analysis
The backward trajectory was used to analyze the air pollutant concentrations in Jinghong, and the year 2020, with the highest number of heavily polluted days, was chosen for analysis and discussion in order to better understand the impact of the trajectory of pollutant transport air masses on changes in air pollutant concentrations in Jinghong.
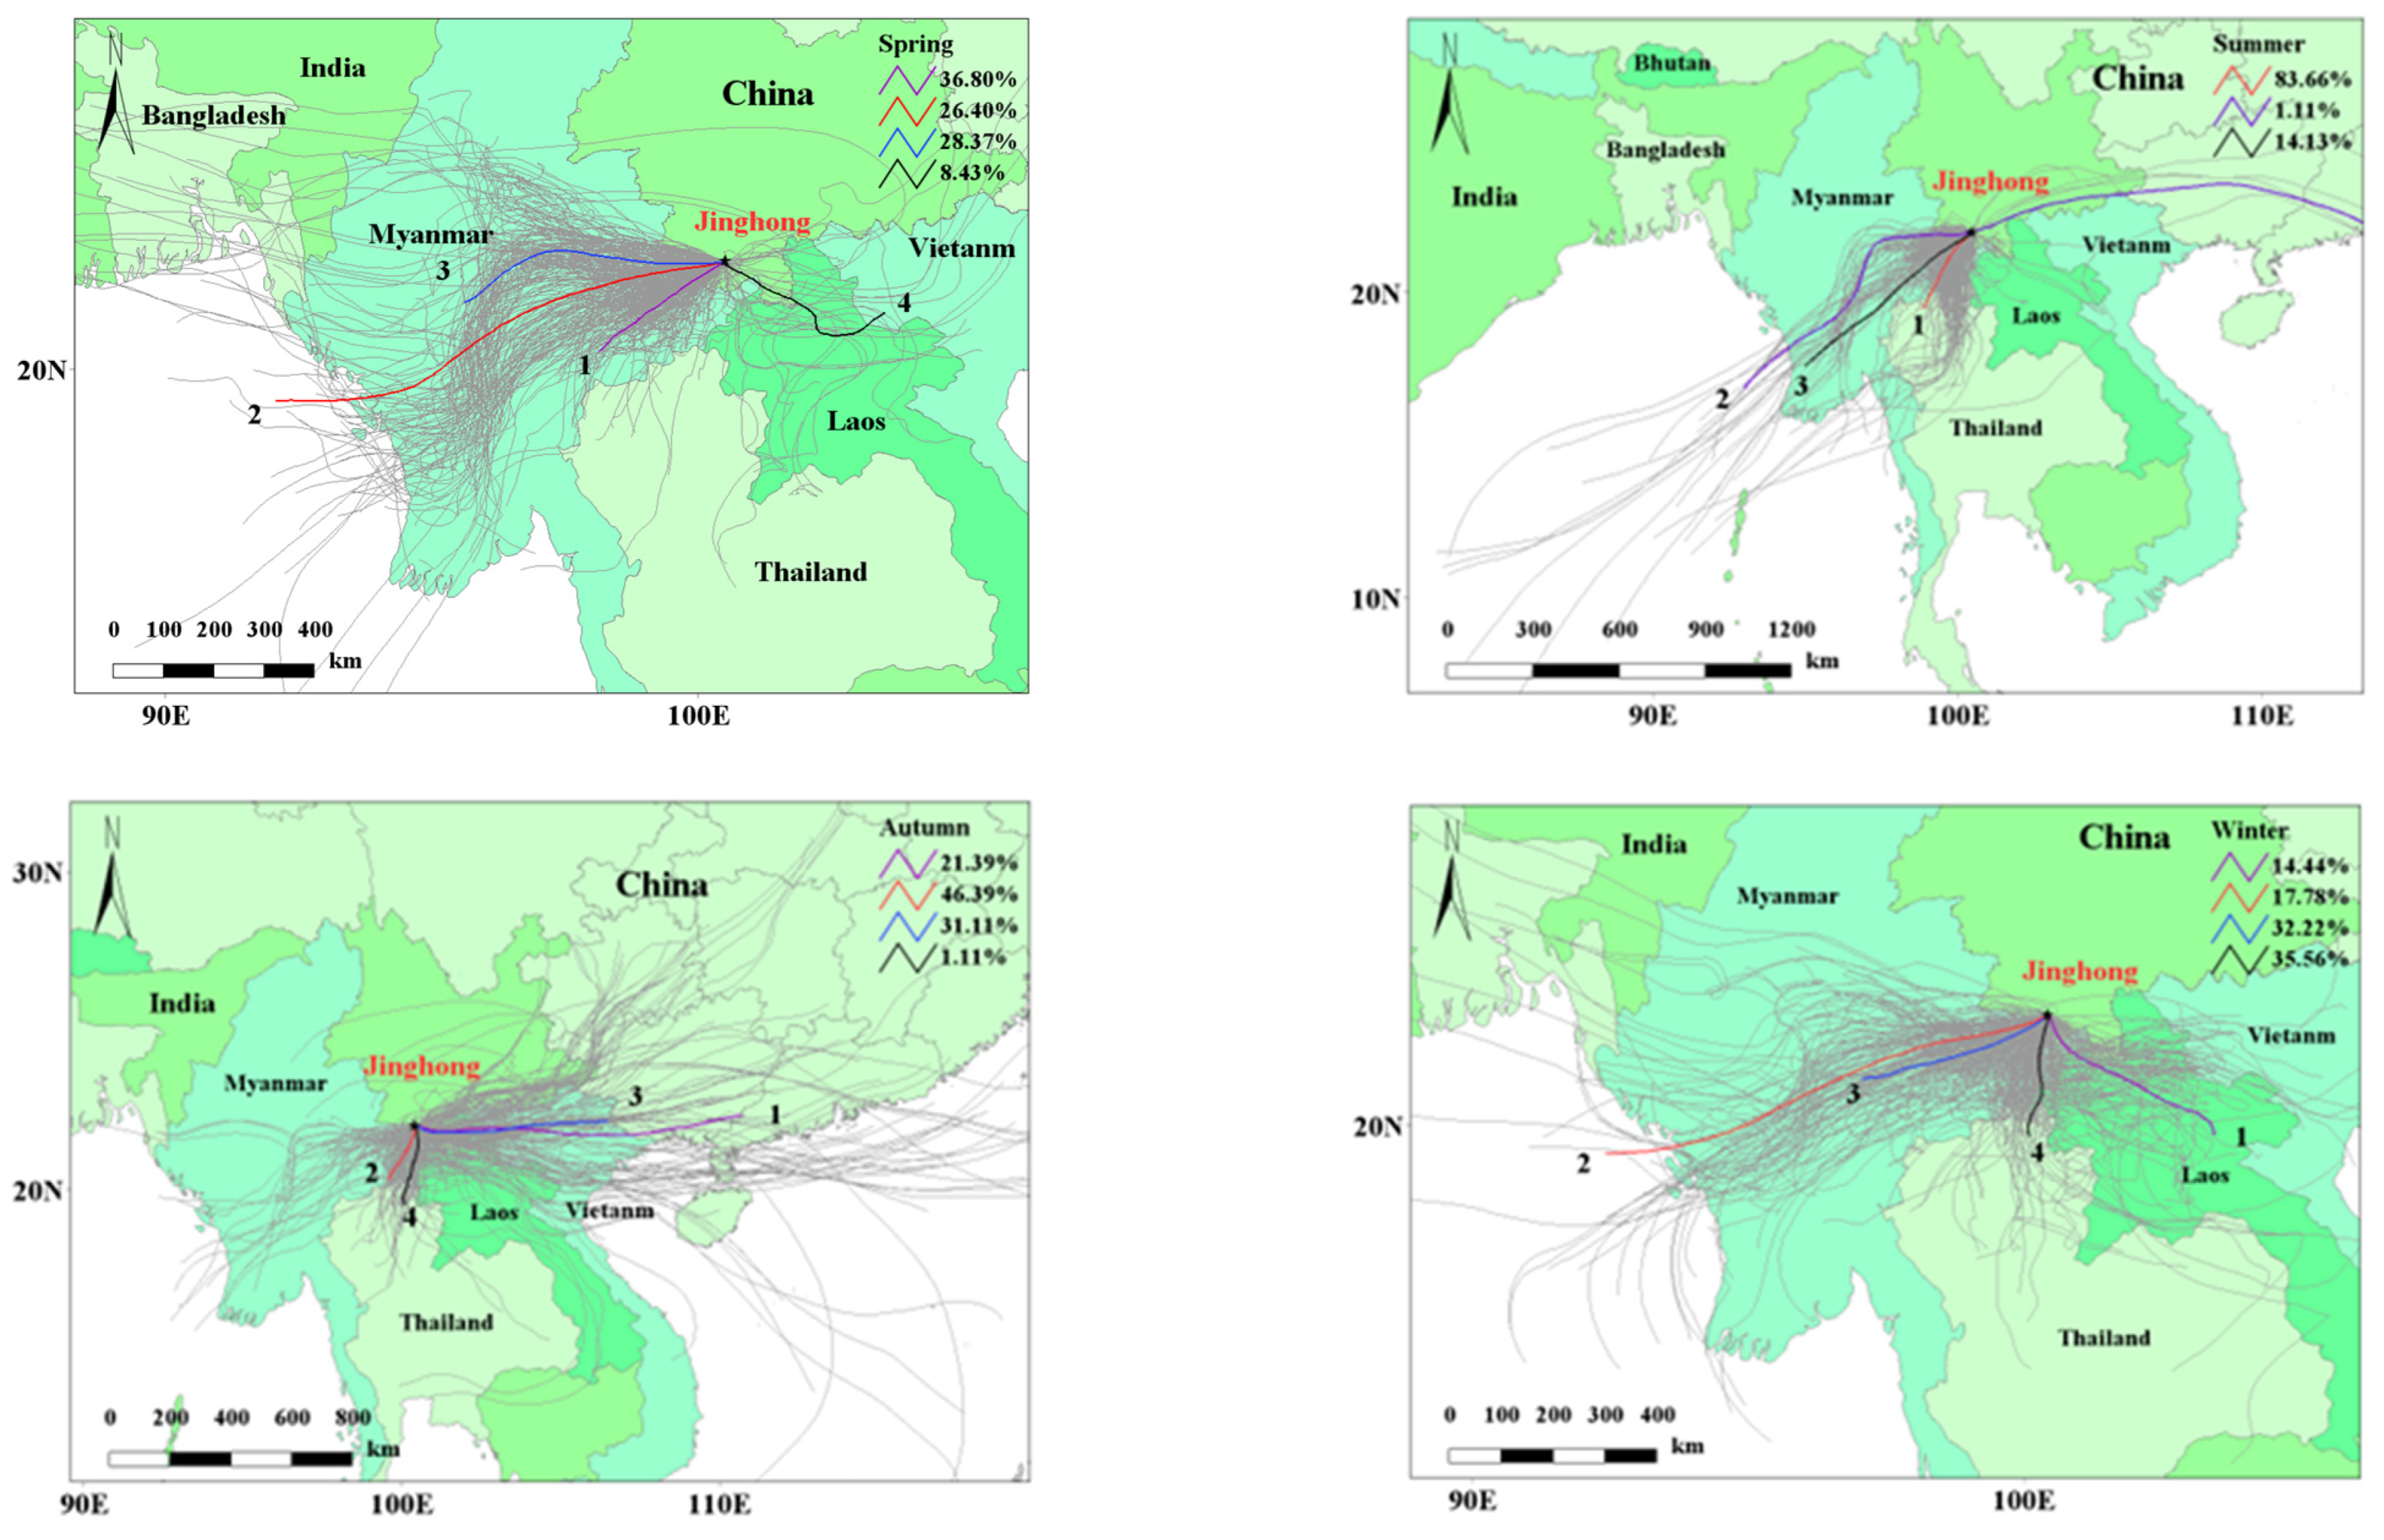
According to Figure 4, westerly and southerly airflow made up the majority of airflow in 2020, and Jinghong was primarily affected by these winds. In spring, westerly and southwesterly airflow (tracks 1, 2, and 3) account for a close proportion, while southeasterly airflow (track 4) accounts for the least. These airflows are mostly influenced by the northern Myanmar air mass. Because of the burning of biomass in northern Myanmar, the overall air pollutant concentrations conveyed were also much greater than during other seasons. There were only minor fluctuations in the number of fire points in early April, with daily high fire points lasting until mid-April, then declining sharply after May, and low values of daily fire points from June to September. The number of fire points started rising slowly in November and intensified into January, peaking at the beginning of late March with nearly 13,000 fire points/d. The western air flow (track 1) accounted for the largest proportion (36.80%), and the transmitted atmospheric pollutant concentrations were lower than those of track 2 except O3. The westerly air flow (track 2) accounted for 26.40%, which moved the fastest and transported the longest distance, and the atmospheric pollutant concentration transmitted was lower than that of track 3. Southwest airflow (track 3) accounted for 28.37%, and the transmitted NO2, CO, O3, PM2.5 and PM10 concentrations were the highest in the whole year. Were 31.38 μg·m−3, 1.09 mg·m−3, 70.70 μg·m−3, 92.65 μg·m−3, 78.78 μg·m−3, respectively (Table 6). In summer, the contribution of air masses from the South Asian continent is reduced, and most of the movement tracks originate over the Bay of Bengal and Myanmar, transporting lower concentrations of atmospheric pollutants than in other quarters. In autumn, the trajectory starting from the Bay of Bengal is less than that in summer, and there is an air mass in each direction. The proportion of eastern air flow and southwest air flow is close to each other. The concentration of SO2 transmitted by eastern air flow (track 1) is the highest in the whole year, which is 8.04 μg·m−3, indicating that biomass combustion has little influence on SO2 concentration [33]. Bein et al. found that biomass combustion was not the cause of SO2 pollution [34]. In winter, almost all tracks originate from South and Southeast Asia, with the air mass (track 1) passing over northern Vietnam accounting for the largest proportion and transporting the lowest concentration of air pollutants.
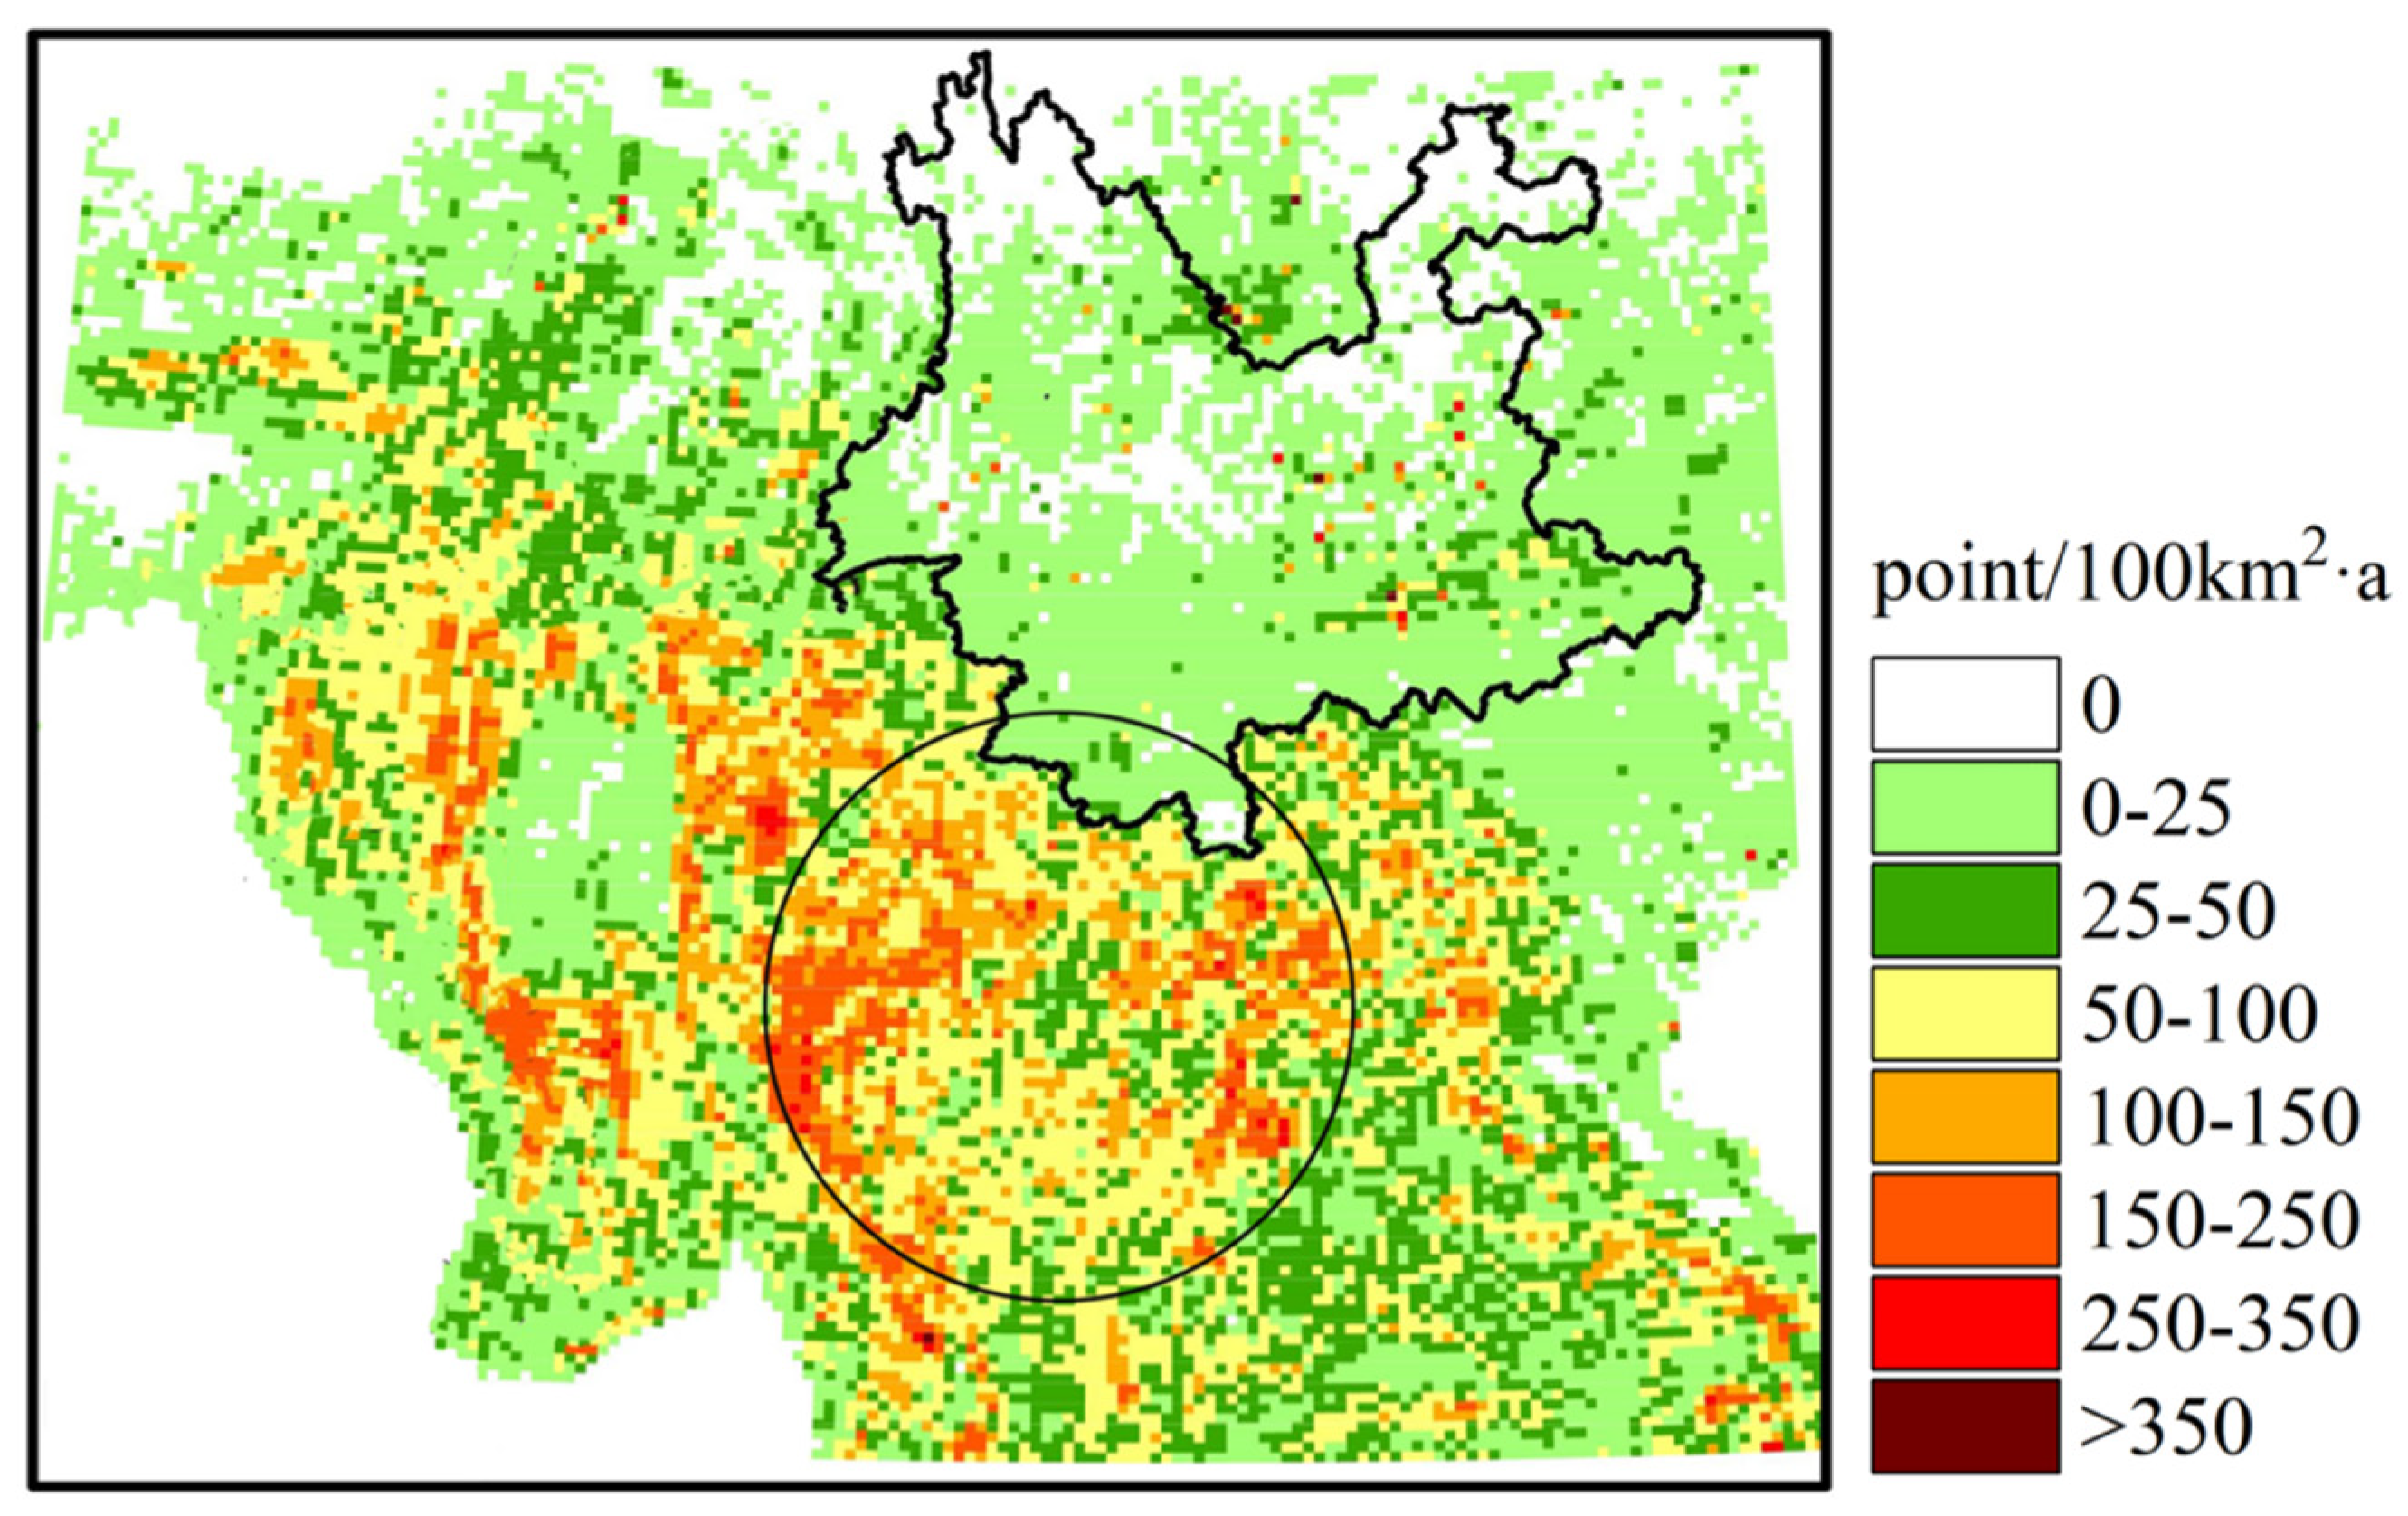
Only a few trajectories start in China and most of the air masses that arrive at this study site come from Southeast Asia (Sichuan and Guizhou Provinces). Figure 5 demonstrates that the fire locations are once more mostly concentrated in eastern Myanmar, northwestern Thailand, and northwestern Laos between the months of February and April. Additionally, air quality is significantly impacted by biomass combustion [35]. In the study, the cross-border transfer of air pollutants from Southeast Asia significantly influenced air pollutant concentrations in Jinghong and was particularly significant in spring. Local air pollution emissions in Jinghong contributed a little to high air pollutant concentrations.
5. Conclusions
Jinghong’s ambient air quality has been improving over the last five years after initially declining, with a 91.8% overall excellent rate. In 2019, PM2.5 exceeded the annual average limit of the secondary standard; particulate matter and O3 were the primary pollutants in Jinghong.
There is no discernible seasonal change in SO2 concentration, although there are similar seasonal variations in NO2, CO, O3, PM2.5, and PM10 with a “~” pattern, indicating that particulate matter and SO2, NO2, and CO have comparable sources.
The main factors affecting the air quality in Jinghong are local emissions and the outside movement of pollutants. The westerly and southerly airflow with more anthropogenic pollution sources (biomass burning) in Southeast Asia is probably the most important transport pathway affecting the concentration of air pollutants in Jinghong, especially significant in spring. Local meteorological parameters also affect the dilution, dispersion, and transmission of pollutants in the urban atmosphere (temperature, precipitation, wind direction, etc.).
Author Contributions
Conceptualization, J.S.; data curation, Z.W.; investigation, Z.Z. and Y.Z.; resources, Z.Z. and Y.D.; writing—original draft, Z.W.; writing—review and editing, Z.Z. All authors have read and agreed to the published version of the manuscript.
Funding
This research was partially supported by the Science and Technology Special Project of Demonstration Zone for National Sustainable Development in Yunnan (grant number. 202104AC100001-A14) and the National Natural Science Foundation of China (grant number 21966016).
Institutional Review Board Statement
Not applicable.
Informed Consent Statement
Not applicable.
Data Availability Statement
The data used in this paper can be provided by Jianwu Shi ([email protected]).
Acknowledgments
This work was supported by the Science and Technology Special Project of the Demonstration Zone for National Sustainable Development in Yunnan and the National Natural Science Foundation of China.
Conflicts of Interest
The authors declare that there are no competing financial interest that could inappropriately influence the contents of this manuscript.
References
- Lim, S.S.; Vos, T.; Flaxman, A.D.; Danaei, G.; Shibuya, K.; Adair-Rohani, H.; AlMazroa, M.A.; Amann, M.; Anderson, H.R.; Andrews, K.G. A comparative risk assessment of burden of disease and injury attributable to 67 risk factors and risk factor clusters in 21 regions, 1990–2010: A systematic analysis for the Global Burden of Disease Study 2010. Lancet 2012, 380, 2224–2260. [Google Scholar] [CrossRef] [Green Version]
- Kan, H.; London, S.J.; Chen, G.; Zhang, Y.; Song, G.; Zhao, N.; Jiang, L.; Chen, B. Differentiating the effects of fine and coarse particles on daily mortality in Shanghai, China. Environ. Int. 2007, 33, 376–384. [Google Scholar] [CrossRef] [PubMed] [Green Version]
- Sather, M.E.; Cavender, K. Update of long-term trends analysis of ambient 8-hour ozone and precursor monitoring data in the South Central US; encouraging news. J. Environ. Monit. 2012, 14, 666–676. [Google Scholar] [CrossRef]
- Marenco, A. Variations of CO and O3 in the troposphere: Evidence of O3 photochemistry. Atmos. Environ. 1986, 20, 911–918. [Google Scholar] [CrossRef]
- Chen, C.; Zhao, B.; Weschler, C.J. Indoor Exposure to “Outdoor PM10”: Assessing Its Influence on the Relationship Between PM10 and Short-term Mortality in US Cities. Epidemiology 2012, 23, 870–878. [Google Scholar] [CrossRef]
- Su, H.; Ge, B.; Chen, X. Pollution characteristics and source analysis of PM2.5 during spring and winter in urban area in typical cities. Environ. Eng. 2018, 36, 99–103. [Google Scholar]
- Chyang, C.-S.; Han, Y.-L.; Zhong, Z.-C. Study of HCl absorption by CaO at high temperature. Energy Fuel 2009, 23, 3948–3953. [Google Scholar] [CrossRef]
- Xiao, Y.; Tian, Y.; Xu, W.; Liu, J.; Wan, Z.; Zhang, X.; Li, X. Study on the spatiotemporal characteristics and socioeconomic driving factors of air pollution in China. Ecol. Environ. Sci. 2018, 27, 518–526. [Google Scholar]
- He, J.; Wu, L.; Mao, H.; Li, R. Impacts of meteorological conditions on air quality in urban Langfang, Hebei province. Res. Environ. Sci. 2016, 29, 791–799. [Google Scholar]
- Wang, S.; Li, W.; Deng, X.; Deng, T.; Li, F.; Tan, H. Characteristics of air pollutant transport channels in Guangzhou region. China Environ. Sci. 2015, 35, 2883–2890. [Google Scholar]
- Hu, J.; Qian, X.; Yin, W.; Huang, Y. Characteristics and causes of air pollution in Mengla County of Xishuangbanna prefecture in recent 3 years. Acta Sci. Circumstantiae 2021, 41, 4388–4395. [Google Scholar]
- Draxier, R.R.; Hess, G.D. An overview of the HYSPLIT_4 modeling system of trajectories, dispersion, and deposition. Aust. Meteorol. Mag. 1998, 47, 295–308. [Google Scholar]
- Stein, A.F.; Draxler, R.R.; Rolph, G.D.; Stunder, B.J.B.; Cohen, M.D.; Ngan, F. NOAA’s HYSPLIT atmospheric transport and dispersion modeling system. Bull. Am. Meteorol. Soc. 2015, 96, 2059–2077. [Google Scholar] [CrossRef]
- Lin, G.M.; Chyang, C.-S. Removal of HCl in flue gases by calcined limestone at high temperatures. Energy Fuels 2017, 31, 12417–12424. [Google Scholar] [CrossRef]
- Bera, B.; Bhattacharjee, S.; Sengupta, N.; Saha, S. Variation and dispersal of PM10 and PM2.5 during COVID-19 lockdown over Kolkata metropolitan city, India investigated through HYSPLIT model. Geosci. Front. 2022, 13, 101291. [Google Scholar] [CrossRef]
- Escudero, M.; Stein, A.F.; Draxler, R.R.; Querol, X.; Alastuey, A.; Castillo, S.; Avila, A. Source apportionment for African dust outbreaks over the Western Mediterranean using the HYSPLIT model. Atmos. Res. 2011, 99, 518–527. [Google Scholar] [CrossRef]
- Shan, W.; Yin, Y.; Lu, H.; Liang, S. A meteorological analysis of ozone episodes using HYSPLIT model and surface data. Atmos. Res. 2009, 4, 767–776. [Google Scholar] [CrossRef]
- Marcazzan, G.M.; Vaccaro, S.; Valli, G.; Vecchi, R. Characterisation of PM10 and PM2.5 particulate matter in the ambient air of Milan (Italy). Atmos. Environ. 2001, 35, 4639–4650. [Google Scholar] [CrossRef]
- Fan, X.; Lu, J.; Qiu, M.; Xiao, X. Changes in travel behaviors and intentions during the COVID-19 pandemic and recovery period: A case study of China. J. Outdoor Recreat. Tour. 2022, 100522. [Google Scholar] [CrossRef]
- Xie, S.; Li Qi, Y.Z.; Tang, X. Characteristics of air pollution in Beijing during sand-dust storm periods. Water Air Soil Pollut. Focus 2005, 5, 217–229. [Google Scholar] [CrossRef]
- Teng, M.; Yang, K.; Shi, Y.; Luo, Y. Study on the Temporal and Spatial Variation of PM2.5 in Eight Main Cities of Yunnan Province. In Proceedings of the 2018 26th International Conference on Geoinformatics, Kunming, China, 28–30 June 2018; pp. 1–7. [Google Scholar]
- Wang, Y.; Ying, Q.; Hu, J.; Zhang, H. Spatial and temporal variations of six criteria air pollutants in 31 provincial capital cities in China during 2013–2014. Environ. Int. 2014, 73, 413–422. [Google Scholar] [CrossRef] [PubMed]
- Chang, J.C. Variations of Air Quality and Atmospheric Environmental Capacity Assessment in the Typical Urban Areas over Yunnan Plateau. Master’s Thesis, Nanjing University of Information Science and Technology, Nanjing, China, 2019. [Google Scholar]
- Yang, Q.J. Observation and Simulation Studies on Urban Air Quality Changes and the Influencing Factors under the Background of Clean Atmospheric Environment over the Yunnan Plateau. Master’s Thesis, Nanjing University of Information Science and Technology, Nanjing, China, 2020. [Google Scholar]
- Yin, D.; Zhao, S.; Qu, J. Spatial and seasonal variations of gaseous and particulate matter pollutants in 31 provincial capital cities, China. Air Qual. Atmos. Health 2017, 10, 359–370. [Google Scholar] [CrossRef]
- Paraschiv, S.; Barbuta-Misu, N.; Paraschiv, S.L. Influence of NO2, NO and meteorological conditions on the tropospheric O3 concentration at an industrial station. Energy Rep. 2020, 6, 231–236. [Google Scholar] [CrossRef]
- Danek, T.; Weglinska, E.; Zareba, M. The influence of meteorological factors and terrain on air pollution concentration and migration: A geostatistical case study from Krakow, Poland. Sci. Rep. 2022, 12, 11050. [Google Scholar] [CrossRef]
- Ahmed, D.; Shams, Z.I.; Ahmed, M.; Siddiqui, M.F. Spatio-Temporal Variations of Lower Tropospheric Pollutants and Their Relationship With Meteorological Factors in Karachi, Pakistan. Arab Gulf J. Sci. Res. 2022, 39, 118–137. [Google Scholar] [CrossRef]
- Żyromski, A.; Biniak-Pieróg, M.; Burszta-Adamiak, E.; Zamiar, Z. Evaluation of relationship between air pollutant concentration and meteorological elements in winter months. J. Water Land Dev. 2014, 22, 25–32. [Google Scholar] [CrossRef]
- Pacitto, A.; Amato, F.; Moreno, T.; Pandolfi, M.; Fonseca, A.; Mazaheri, M.; Stabile, L.; Buonanno, G.; Querol, X. Effect of ventilation strategies and air purifiers on the children’s exposure to airborne particles and gaseous pollutants in school gyms. Sci. Total Environ. 2020, 712, 135673. [Google Scholar] [CrossRef] [PubMed]
- Zhou, X.; Zhang, T.; Li, Z.; Tao, Y.; Wang, F.; Zhang, X.; Xu, C.; Ma, S.; Huang, J. Particulate and gaseous pollutants in a petrochemical industrialized valley city, Western China during 2013–2016. Environ. Sci. Pollut. Res. 2018, 25, 15174–15190. [Google Scholar] [CrossRef]
- Rypdal, K.; Rive, N.; Berntsen, T.; Fagerli, H.; Klimont, Z.; Mideksa, T.K.; Fuglestvedt, J.S. Climate and air quality-driven scenarios of ozone and aerosol precursor abatement. Environ. Sci. Policy 2009, 12, 855–869. [Google Scholar] [CrossRef]
- Zhou, Y.; Luo, B.; Li, J.; Hao, Y.; Yang, W.; Shi, F.; Chen, Y.; Simayi, M.; Xie, S. Characteristics of six criteria air pollutants before, during, and after a severe air pollution episode caused by biomass burning in the southern Sichuan Basin, China. Atmos. Environ. 2019, 215, 116840. [Google Scholar] [CrossRef]
- Bein, K.J.; Zhao, Y.; Johnston, M.V.; Wexler, A.S. Interactions between boreal wildfire and urban emissions. J. Geophys. Res. Atmos. 2008, 113, D07304. [Google Scholar] [CrossRef]
- Punsompong, P.; Pani, S.K.; Wang, S.-H.; Pham, T.T.B. Assessment of biomass-burning types and transport over Thailand and the associated health risks. Atmos. Environ. 2021, 247, 118176. [Google Scholar] [CrossRef]
Figure 1.
Monthly average values of Jinghong’s AQI from 2017 to 2021.

Figure 2.
Variation in air pollutants by season and day.


Figure 3.
Relationship between temperature, precipitation, and PM2.5.

Figure 4.
Backward clustering on a four-season backward trajectory in Jinghong in 2020.

Figure 5.
The majority of Southeast Asia (90° to 107° E, 15° to 29° N) has a spatial distribution of the yearly average number of fire spots for biomass combustion from 2017 to 2021.
Figure 5.
The majority of Southeast Asia (90° to 107° E, 15° to 29° N) has a spatial distribution of the yearly average number of fire spots for biomass combustion from 2017 to 2021.


Table 1.
Statistics for Jinghong’s AQI level days from 2017 to 2021.
| Year | Days/d | AQI | Excellent Rate | Pollution Rate | Number of Monitoring Days/d | ||||
|---|---|---|---|---|---|---|---|---|---|
| Level 1 | Level 2 | Level 3 | Level 4 | Level 5 | |||||
| 2017 | 219 | 114 | 18 | 3 | 0 | 50.86 | 94.07% | 5.93% | 354 |
| 2018 | 198 | 141 | 7 | 1 | 0 | 48.65 | 97.69% | 2.31% | 347 |
| 2019 | 151 | 159 | 39 | 9 | 2 | 62.25 | 85.87% | 14.13% | 361 |
| 2020 | 180 | 142 | 22 | 9 | 10 | 59.89 | 88.64% | 11.36% | 364 |
| 2021 | 239 | 95 | 23 | 4 | 0 | 49.22 | 92.27% | 7.73% | 362 |
Table 2.
AQI and major air contaminants’ concentration levels.
| Year | Statistical Values | AQI | SO2/ (μg·m−3) | NO2/ (μg·m−3) | CO/ (mg·m−3) | O3-8 h/ (μg·m−3) | PM2.5/ (μg·m−3) | PM10/ (μg·m−3) |
|---|---|---|---|---|---|---|---|---|
| 2017 | Average ± S.d | 50.86 ± 26.20 | 8.38 ± 2.81 | 17.65 ± 7.71 | 0.52 ± 0.20 | 73.72 ± 39.77 | 25.53 ± 18.76 | 48.67 ± 27.40 |
| Measured value | 14–162 | 3.5–31 | 4.5–42.5 | 0.2–1.4 | 15–219 | 2–114.5 | 9–164.5 | |
| 2018 | Average ± S.d | 48.65 ± 21.98 | 6.84 ± 2.46 | 18 ± 7.02 | 0.63 ± 0.17 | 71.63 ± 30.74 | 25.61 ± 18.36 | 48.11 ± 25.52 |
| Measured value | 15.5–151.5 | 2.5–32.5 | 6.5–37.5 | 0.3–1.2 | 9–159 | 55–114.5 | 10.5–139.5 | |
| 2019 | Average ± S.d | 62.25 ± 34.32 | 6.05 ± 2.34 | 21.82 ± 9.46 | 0.66 ± 0.23 | 89.93 ± 37.39 | 36.42 ± 27.69 | 63.59 ± 42.01 |
| Measured value | 16.5–211 | 1.5–23 | 4–44 | 0.2–1.6 | 17–185 | 6–164 | 11.5–230 | |
| 2020 | Average ± S.d | 59.89 ± 43.75 | 6.99 ± 2.08 | 19.59 ± 8.92 | 0.76 ± 0.21 | 82.56 ± 42.52 | 34.43 ± 36.87 | 55.58 ± 39.99 |
| Measured value | 11–295.5 | 3–15 | 5.5–52.5 | 0.2–1.8 | 10.5–221 | 6–247.5 | 10–230 | |
| 2021 | Average ± S.d | 49.22 ± 29.70 | 8.64 ± 2.80 | 19.11 ± 10.75 | 0.63 ± 0.22 | 76.88 ± 36.37 | 25.14 ± 24.21 | 46.51 ± 39.07 |
| Measured value | 10–178.5 | 4.5–47.5 | 7–58 | 0.2–1.5 | 20.5–187.5 | 5.5–136 | 9.5–224 | |
| Annual Average | Average ± S.d | 54.23 ± 32.69 | 7.38 ± 2.70 | 19.26 ± 9.01 | 0.64 ± 0.21 | 79.03 ± 38.19 | 29.47 ± 26.65 | 52.53 ± 36.15 |
| Measured value | 10–295.5 | 1.5–47.5 | 4–58 | 0.2–1.8 | 9–221 | 2–247.5 | 9–230 |
Table 3.
Monthly average wind speed from 2017 to 2021.
| Month | 1 | 2 | 3 | 4 | 5 | 6 | 7 | 8 | 9 | 10 | 11 | 12 | Annual Average |
|---|---|---|---|---|---|---|---|---|---|---|---|---|---|
| Wind speed m/s | 0.7 | 0.9 | 0.9 | 0.9 | 1.0 | 1.2 | 0.9 | 0.9 | 0.7 | 0.6 | 0.6 | 0.7 | 0.8 |
Table 4.
Xishuangbanna State Air Pollution Inventory for 2021. Unit: ton.
| Source of Pollution | SO2 | NOx | CO | PM2.5 | PM10 |
|---|---|---|---|---|---|
| Industrial companies | 1233.62 | 948.74 | 8098.84 | 409.06 | 1168.75 |
| Resident source | 485.12 | 231.74 | 83.43 | 238.41 | |
| Mobile Sources | 411.39 | 9879.27 | 10,751.41 | 470.62 | 494.83 |
| Agricultural sources | 529.30 | ||||
| Dust sources | 1878.26 | 5234.31 | |||
| Biomass combustion | 166.57 | 917.73 | 15,683.14 | 2134.04 | 2178.04 |
| Restaurant Fumes | 84.58 | 39.28 | 366.74 | 459.72 | |
| Total pollutant emissions | 2296.70 | 12,591.36 | 34,572.67 | 5342.15 | 9774.06 |
Table 5.
Pollutant correlation analysis.
| AQI | SO2 | NO2 | CO | O3-8 h | PM2.5 | PM10 | ||
|---|---|---|---|---|---|---|---|---|
| Year-round | AQI | 1 | ||||||
| SO2 | 0.265 ** | 1 | ||||||
| NO2 | 0.799 ** | 0.229 ** | 1 | |||||
| CO | 0.307 ** | 0.078 * | 0.414 ** | 1 | ||||
| O3-8 h | 0.876 ** | 0.226 ** | 0.630 ** | 0.140 ** | 1 | |||
| PM2.5 | 0.938 ** | 0.234 ** | 0.840 ** | 0.387 ** | 0.782 ** | 1 | ||
| PM10 | 0.950 ** | 0.267 ** | 0.845 ** | 0.357 ** | 0.763 ** | 0.938 ** | 1 | |
| Spring | AQI | 1 | ||||||
| SO2 | 0.347 ** | 1 | ||||||
| NO2 | 0.811 ** | 0.370 ** | 1 | |||||
| CO | 0.242 ** | −0.014 | 0.258 ** | 1 | ||||
| O3-8 h | 0.883 ** | 0.335 * | 0.657 | 0.071 | 1 | |||
| PM2.5 | 0.948 ** | 0.278 ** | 0.831 ** | 0.404 ** | 0.785 ** | 1 | ||
| PM10 | 0.948 ** | 0.353 ** | 0.859 ** | 0.380 ** | 0.791 ** | 0.960 ** | 1 | |
| Summer | AQI | 1 | ||||||
| SO2 | 0.125 ** | 1 | ||||||
| NO2 | 0.487 ** | 0.017 | 1 | |||||
| CO | 0.230 ** | −0.096 | 0.522 ** | 1 | ||||
| O3-8 h | 0.764 ** | 0.139 ** | 0.361 ** | 0.144 | 1 | |||
| PM2.5 | 0.742 ** | −0.083 | 0.512 ** | 0.273 ** | 0.532 ** | 1 | ||
| PM10 | 0.844 ** | 0.079 | 0.562 ** | 0.277 ** | 0.493 ** | 0.742 ** | 1 | |
| Autumn | AQI | 1 | ||||||
| SO2 | 0.056 | 1 | ||||||
| NO2 | 0.718 ** | −0.053 | 1 | |||||
| CO | 0.178 ** | −0.029 | 0.244 ** | 1 | ||||
| O3-8 h | 0.820 ** | 0.059 | 0.495 ** | 0.132 | 1 | |||
| PM2.5 | 0.880 ** | 0.024 | 0.782 ** | 0.214 ** | 0.677 ** | 1 | ||
| PM10 | 0.920 ** | 0.067 | 0.763 ** | 0.199 * | 0.632 ** | 0.902 ** | 1 | |
| Winter | AQI | 1 | ||||||
| SO2 | 0.112 * | 1 | ||||||
| NO2 | 0.435 ** | −0.395 ** | 1 | |||||
| CO | 0.181 * | 0.005 | 0.278 ** | 1 | ||||
| O3-8 h | 0.720 ** | −0.008 | 0.178 ** | −0.092 | 1 | |||
| PM2.5 | 0.921 ** | 0.78 | 0.467 ** | 0.293 ** | 0.617 ** | 1 | ||
| PM10 | 0.866 ** | 0.149 ** | 0.681 ** | 0.188 * | 0.458 ** | 0.852 ** | 1 |
Note: ** Significant correlations at the 0.01 level (bilateral); * significant correlations at the 0.05 level (bilateral).
Table 6.
Clustering results of four-season backward trajectories in Jinghong in 2020 and the accompanying average concentrations of pollutants.
Table 6.
Clustering results of four-season backward trajectories in Jinghong in 2020 and the accompanying average concentrations of pollutants.
| Quarter | Track | Frequency | SO2/ (μg·m−3) | NO2/ (μg·m−3) | CO/ (mg·m−3) | O3/ (μg·m−3) | PM2.5/ (μg·m−3) | PM10/ (μg·m−3) |
|---|---|---|---|---|---|---|---|---|
| Spring | 1 | 36.80% | 5.88 | 19.97 | 0.84 | 62.14 | 63.27 | 51.85 |
| 2 | 26.40% | 6.27 | 29.43 | 0.97 | 52.17 | 80.64 | 66.11 | |
| 3 | 28.37% | 6.36 | 31.38 | 1.09 | 70.70 | 92.65 | 78.78 | |
| 4 | 8.43% | 4.52 | 19.73 | 0.80 | 27.98 | 19.60 | 24.23 | |
| Summer | 1 | 83.66% | 5.43 | 13.15 | 0.52 | 15.99 | 11.11 | 25.97 |
| 2 | 1.11% | 3.60 | 11.8 | 0.48 | 18.80 | 11.10 | 18.80 | |
| 3 | 14.13% | 4.46 | 11.9 | 0.52 | 24.81 | 10.77 | 24.81 | |
| Autumn | 1 | 21.39% | 8.04 | 20.76 | 0.78 | 10.85 | 16.71 | 42.68 |
| 2 | 46.39% | 6.94 | 18.82 | 0.72 | 9.82 | 16.87 | 42.97 | |
| 3 | 31.11% | 7.68 | 21.57 | 0.80 | 10.59 | 19.87 | 49.27 | |
| 4 | 1.11% | 7.00 | 11.75 | 0.61 | 9.63 | 11.50 | 30.00 | |
| Winter | 1 | 14.44% | 6.38 | 17.51 | 0.61 | 39.05 | 24.22 | 35.58 |
| 2 | 17.78% | 6.31 | 21.55 | 0.71 | 47.23 | 31.25 | 46.16 | |
| 3 | 32.22% | 5.60 | 22.71 | 0.79 | 44.61 | 35.72 | 50.29 | |
| 4 | 35.56% | 6.82 | 20.34 | 0.78 | 40.36 | 35.08 | 51.32 |
Publisher’s Note: MDPI stays neutral with regard to jurisdictional claims in published maps and institutional affiliations. |
© 2022 by the authors. Licensee MDPI, Basel, Switzerland. This article is an open access article distributed under the terms and conditions of the Creative Commons Attribution (CC BY) license (https://creativecommons.org/licenses/by/4.0/).
Share and Cite
MDPI and ACS Style
Zhou, Z.; Wang, Z.; Shi, J.; Zhong, Y.; Ding, Y. Variation Characteristics and Source Analysis of Pollutants in Jinghong before and after the COVID-19 Pandemic. Atmosphere 2022, 13, 1846. https://doi.org/10.3390/atmos13111846
AMA Style
Zhou Z, Wang Z, Shi J, Zhong Y, Ding Y. Variation Characteristics and Source Analysis of Pollutants in Jinghong before and after the COVID-19 Pandemic. Atmosphere. 2022; 13(11):1846. https://doi.org/10.3390/atmos13111846
Chicago/Turabian StyleZhou, Zengchun, Zhijun Wang, Jianwu Shi, Yunhong Zhong, and Yinhu Ding. 2022. "Variation Characteristics and Source Analysis of Pollutants in Jinghong before and after the COVID-19 Pandemic" Atmosphere 13, no. 11: 1846. https://doi.org/10.3390/atmos13111846
Note that from the first issue of 2016, this journal uses article numbers instead of page numbers. See further details here.