
Definition of Urban Built Environment Climate Adaptive Design Actions Aided by Environmental Data-Driven Design Processes


Dipartimento di Architettura(DiARC), University of Naples Federico II, 80138 Napoli, Italy
Atmosphere 2022, 13(11), 1835; https://doi.org/10.3390/atmos13111835
Submission received: 12 October 2022
/
Revised: 25 October 2022
/
Accepted: 2 November 2022
/
Published: 4 November 2022
(This article belongs to the Special Issue Urban Climate Mitigation Techniques and Technologies)
Abstract
:Environmental and technological design for climate adaptation in the urban built environment can no longer be separated from the generation, collection, or use of data (big data). ICT tools (Information and Communication Technologies), for the modelling and simulation of the built urban environment are identified as measuring devices and provide knowledge on the impacts of climate change in design practice based on an environmentally data-driven approach. This study aims to define a framework for the evaluation of environmental health and comfort parameters applicable to simulation tools, with a specific focus on thermal and environmental exchanges between indoor and outdoor spaces, to define those factors that affect the perception of user’s well-being in thermal stress conditions (e.g., heatwaves), both indoor and outdoor. Through the definition of two study cases in the city of Naples, Italy, special attention was paid to investigating the interaction between outdoor and indoor performance when urban temperatures rise. A comparison between a daily survey for occupants and simulations was conducted to confirm the validity of the data obtainable from the perceived thermal sensations. The obtained results show that the designed framework can reliably simulate real outdoor and indoor conditions according to comfort indices such as the predicted mean vote and adaptive comfort model. The methodological framework developed can guarantee the interoperability of data to simulate indoor and outdoor environments responding to real conditions and determine a favourable condition for the development of urban redevelopment interventions through the application of climate adaptive design strategies.
1. Introduction
The built urban environment can be seen as a mosaic of shapes and surfaces that determine peculiar spatial morphologies capable of giving shape to unique environmental conditions. The study of the climate in the city and the repercussions that this brings to the microclimate in the different parts of which it is constituted is a decisive reason for facing the challenge of climate change in progress; in addition, the projected growth of the population living in cities in the next decades, the consequent urban development, and the inevitable increase in the consumption of resources (soil and energy) make this an important issue. Collecting and analysing the environmental interactions of the built environment through the use of advanced and enabling digital technologies, such as Key Enabling Technologies (KET’s) [1], considering the effects of human actions and their interaction with the environment [2], allows for decoding with a greater wealth of information [3]. At the same time, the use of digital technologies makes it possible to give back with fewer and less uncertain possible scenarios and strategies, which are capable of containing the impacts of climate change.
More generally can be considered the spread and use in the urban environment of smart and enabling technologies, such as Internet of Things (IoT), 5G connections, artificial intelligence (AI), machine learning, blockchain, virtual reality (VR), augmented reality (AR), cloud computing, big data, apps, etc., as well as the use of low technologies (widespread sensor systems), as an opportunity to catalyse the information generated by users and the environment [4]. An augmented city is an embodied, complex, and above all, a real city in which the smart devices that we all use today allow us to implement functions and facilitate access to services, making cities a “[…] spatial/cultural/social/economic device to connect the components of contemporary urban life, individual and collective, informal and institutional, generating well-being and happiness” [5]. Programs and research projects, such as the Array of Things (AoT) for the city of Chicago [6,7,8], and City Scanner [9,10], represent an example of the creation of an augmented human-oriented city in which the data collected are at the service of the user to respond to different purposes and needs. Mapping the environmental quality, road safety for drivers and pedestrians, etc., as a response to phenomena related to climate change (heatwaves and pluvial flooding) today represents an immense pool of data for the advanced analysis conducted by designers and operators for the government of the territory.
The climate crisis scenario that we are facing today inevitably obliges us to intervene to avoid making “mistakes”, defining approaches and strategies capable of containing the effects deriving from possible inadequacies. This approach is increasingly characterized by an interdisciplinary approach, critical of the performance of the intervention sites, holistic in the ability to consider the dynamic interactions of the built environment (the atmosphere, buildings, vegetation, man), and above all capable of returning objective data on the specific achievable performances.
To this end, today, more and more information and communication technology tools (ICT) are used for the simulation of the built urban environment, constituting a valid apparatus for knowledge of the environmental phenomena of the built urban space.
To support the simulation processes, it is necessary to acquire data and information that are useful for the reproducibility of real conditions, such as the operations and phases of surveys related to the urban shape and geometric data, knowledge of the types of materials of which the surfaces of open spaces are made, and also the construction and performance characteristics of buildings, the types of vegetation present and, in particular, the direct and indirect retrieval of environmental and climatic data. Local environmental monitoring actions play a key role not only in defining climatic and microclimatic trends in the urban environment but also in the construction of databases of information. These are useful in the investigation of the phenomena that most influence the climate in the city, Such as the increase in temperatures, the heat island effect, and heat waves, constituting databases useful for performing a site-specific “calibration” of ICT tools. In this way, the simulation of the state of the sites allows the generation of “reliable” climatic and microclimatic conditions within the virtual environment to bring out the technical-performance criticalities of the simulated urban environment and, therefore, of the real ones.
The role of ICT tools, intended as enabling technologies for the definition of new operating environments, methodologies, and procedures for the development of strategies for climate-adaptive environmental regeneration, is substantial in the experimentation and definition of adaptive strategies and solutions for achieving climate and environmental resilience. The possibility of simulating the behaviour of the built urban environment through the retrieval of environmental data and specific boundary conditions for different urban contexts allows us to test, control, and define the most appropriate strategies and solutions which will be able to guarantee adequate responses for our adaptation to new climate conditions.
Today, the experimentation of design strategies aimed at climate-adaptive urban regeneration takes place more and more often through hybrid methodological phases characterized by data collections in the field and also through experimental and sensor instruments and phases of simulation analysis using the software.
This hybridization leads to the search for new possibilities of investigation and new forms of knowledge based on the collection of real and digital data. In a study conducted in Genoa, Italy [11], we wanted to measure the relationship between the comfort conditions perceived by a group of users and the different urban morphological characteristics within different spaces of the city during a climate walk. The data collected were georeferenced to obtain a mapping of the data collected and propose a methodology to evaluate the comfort perceived in the open spaces of the city of Genoa to the different morphologies and environmental conditions.
The study conducted in the city of Thessaloniki in Greece aimed to determine the performance effectiveness of the urban regeneration intervention that affected the open spaces of the city centre [12,13]. The definition of climate adaptation actions, such as cool materials, the insertion of new trees, fountains, splashes, and waterfalls, as well as fans, was achieved through a recursive process of analysis involving the use of hybrid instrumentation, an environmental monitoring station, an infrared thermometer, and the ENVI-met 5 software, for pre-and post-intervention microclimatic simulation processes, while also simulating the future conditions of climate change.
Regarding what has been conducted in other studies, this article aims to investigate, within a specific research field, the lack of scientifically relevant advances in the development of methodological frameworks involving the use of low-tech environmental monitoring instruments, the involvement of people, and the simulation and data exchange platforms. The development of data-driven design and data exchange processes will make it possible to verify the environmental behaviour and comfort sensation perceived by users through the use of a single working environment. The proposed work aims to develop a methodological process using data exchange processes between known simulation tools to create a reliable and holistic method.
Generally, the succession of phases that characterize the use of IT tools in the field of environmental design, which is confronted with the theme of combating the effects of climate change in the urban environment, provides for the adoption of recursive simulation analysis processes. These processes foresee the first appropriate testing phases that allow the verification of the correspondence of the data collected in the field with the outputs of the simulation processes and, subsequently, performance checks that allow the solutions and design interventions capable of guaranteeing better benefits in terms of performance to be identified, in contrast to the effects of climate change in the city. The data obtained considering environmental factors (such as air temperature, surface temperature, humidity, and wind speed) are indicators of urban morphology, such as the Sky View Factor (SVF) [14,15]; indicators of the levels of achievable thermal well-being (Universal Thermal Comfort Index—UTCI, Physiologically Equivalent Temperature—PET, Predicted Average Vote—PMV) [16,17,18,19,20,21], return an objective reading of the achievable performance, considering the outputs of the simulations, as benchmarks of the actual improvement of the urban microclimate, in terms of the reduction in summer temperatures and the ability to mitigate the urban heat island effect.
2. Materials and Methods
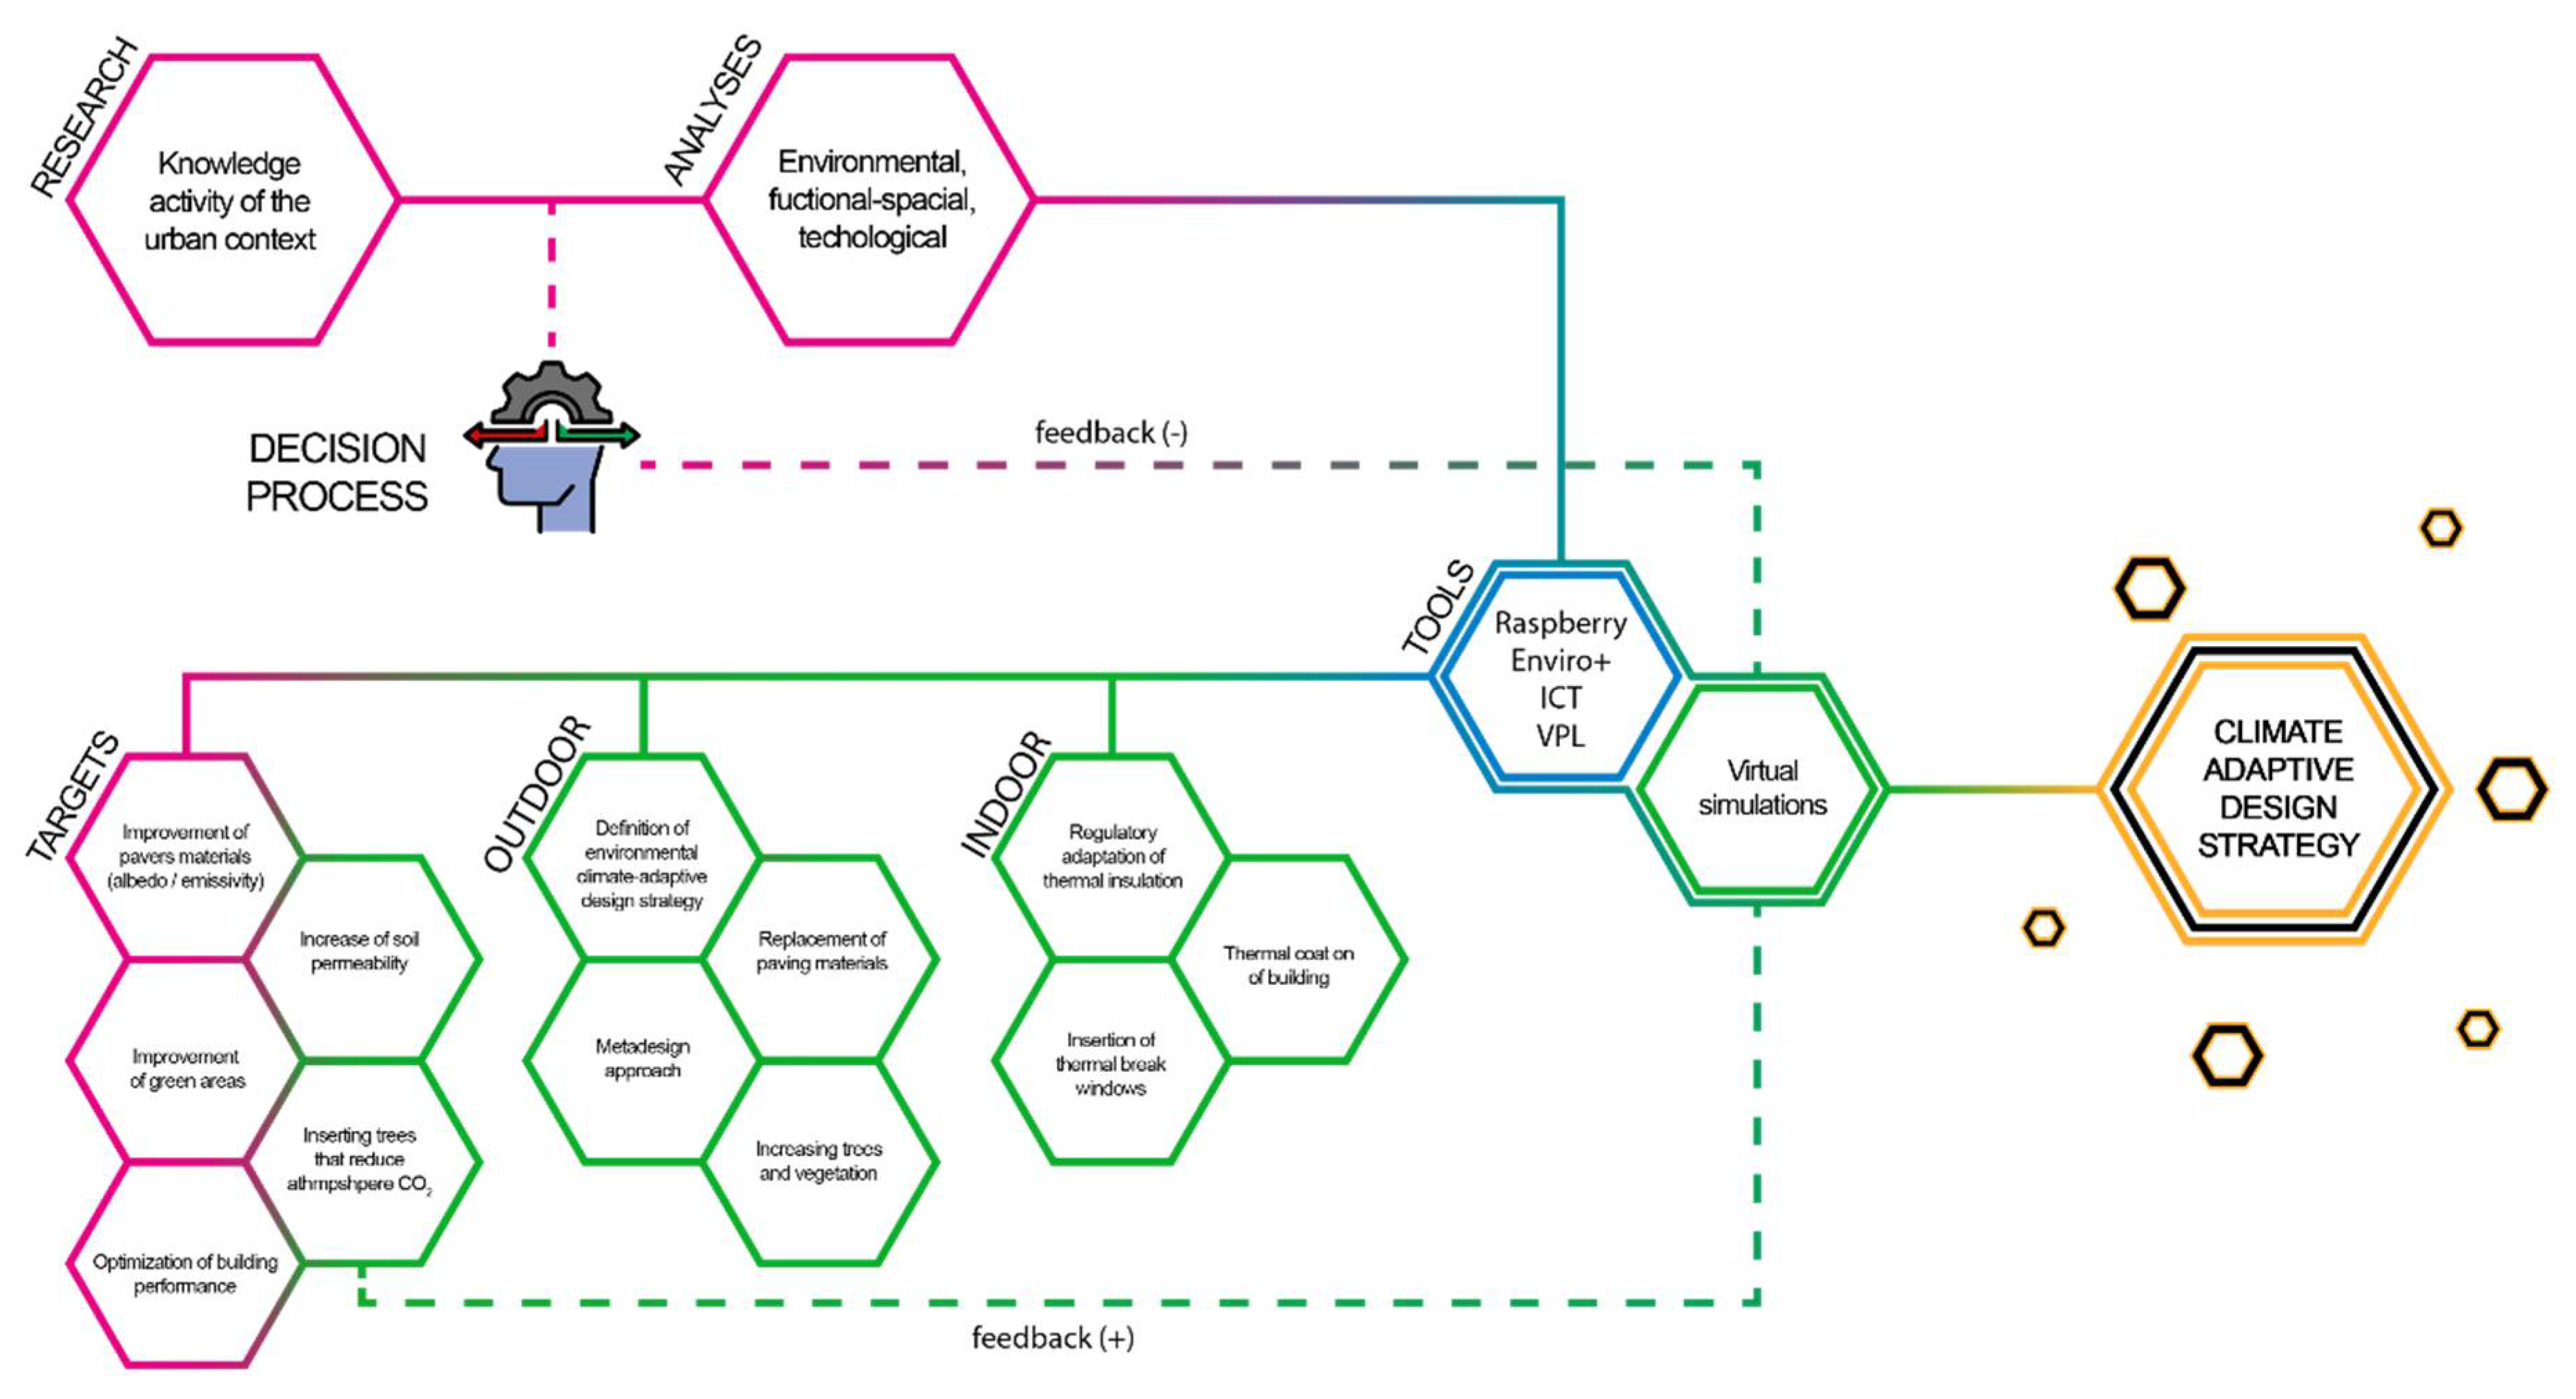
The workflow presented in this study is aimed at creating a methodological framework based on the use of low-tech technologies for indoor and outdoor environmental data collection, analytical, simulation, and data exchange digital processes (Figure 1). All this is aimed at the knowledge of the systems that regulate the balance of the urban environment built in specific contexts, resulting in a fundamental prerequisite to cope with climate change in the development of a data-driven approach to environmental design.
At the base of this study, there is, therefore, the desire to identify a procedure based on energy and environmental simulation processes and the use of virtual Programming language (VPL) platforms capable, through the development of algorithms, in order to allow data exchange between different software without ever having to change the working environment. In particular, Grasshopper’s VPL platform was used [20] combined with Rhinoceros’ 3D modelling software and numerous add-ons capable of connecting proprietary external software, which allowed us to recreate, in a virtual environment, the investigated urban contexts. The objective for the simulation data obtained and the comparison with the data collected through the sensors was to obtain results that did not exceed a target percentage difference of 15%.
Within this model, there is also a dual purpose, namely, to investigate the adequacy of two methods to verify the conditions of perceived well-being in the indoor environment: the index for the evaluation of thermal comfort of the predicted mean vote—PMV [21,22,23] and the adaptive comfort model (AMC). The first is defined as the average value of the expressed vote in a given environment by a group of people. The PMV is defined using the Fanger model, UNI 7730, according to the 2020 ASHRAE 55 standard. The index is measured on a scale of 7 points, where 0 represents a condition of neutrality. The following points, in ascending and descending order, present a maximum and minimum index of +3 and −3 that indicate a feeling of hot and cold, respectively. The thermo-hygrometric comfort condition is within a range of the values (−1, +1).
The second, the adaptive comfort model, considers the user within an indoor environment, unlike the PMV, no longer as a passive subject but as an active agent who interacts at all levels with the environment in which he is located (ASHRAE 55 of 2004). Originally, the model provided for the total absence of mechanical ventilation systems, except for passive cooling strategies. With the ASHRAE 55 standards of 2020, the model has been updated by introducing the presence of mechanical ventilation systems provided; however, they are not in operation. Moreover, being more flexible than the Fanger model, rather than the thermal comfort indices, the adaptive model is mainly based on the recorded temperatures, which must fall within a temperature range between 10 and 33.5 °C. Beyond this temperature range, ACM does not allow reliable results.
The reference parameter is the operating temperature (OT), which is defined as the uniform temperature of an imaginary black envelope in which the subject would exchange for irradiation and the convection of the same energy that it exchanges in the non-uniform real environment and is given by the combination of the air temperature and the average radiant temperature. Knowing the operating temperature, it is possible to calculate the PMV through a tabular method provided by UNI EN ISO 7730. The OT has been considered a fundamental parameter to extrapolate from it the actual temperature of the simulated environments.
For the outdoor environment, it was decided to observe only the PMV as it is an effectively tested and reliable model [24,25,26].
The framed methodological work has been developed according to the following phases: (1) the knowledge of the urban, morphological, technological, and environmental analysis context; (2) the direct collection of environmental data through sensors and data on the perception of users’ comfort through the submission of a questionnaire (Questionnaire S1); (3) the construction of an algorithmic process using a VPL platform for the digitization of information and the simulation of indoor and outdoor environmental behaviours based on the data collected; (4) the extraction, verification, and validation of the reliability of the results by comparing the data obtained from the simulations and the data obtained from the questionnaires; (5) the definition and application of climate-adaptive regeneration strategies for buildings and open spaces; (6) the comparison of the results obtained pre-and post-intervention.
2.1. Knowledge of the Analysis of the Urban, Morphological, Technological and Environmental Context
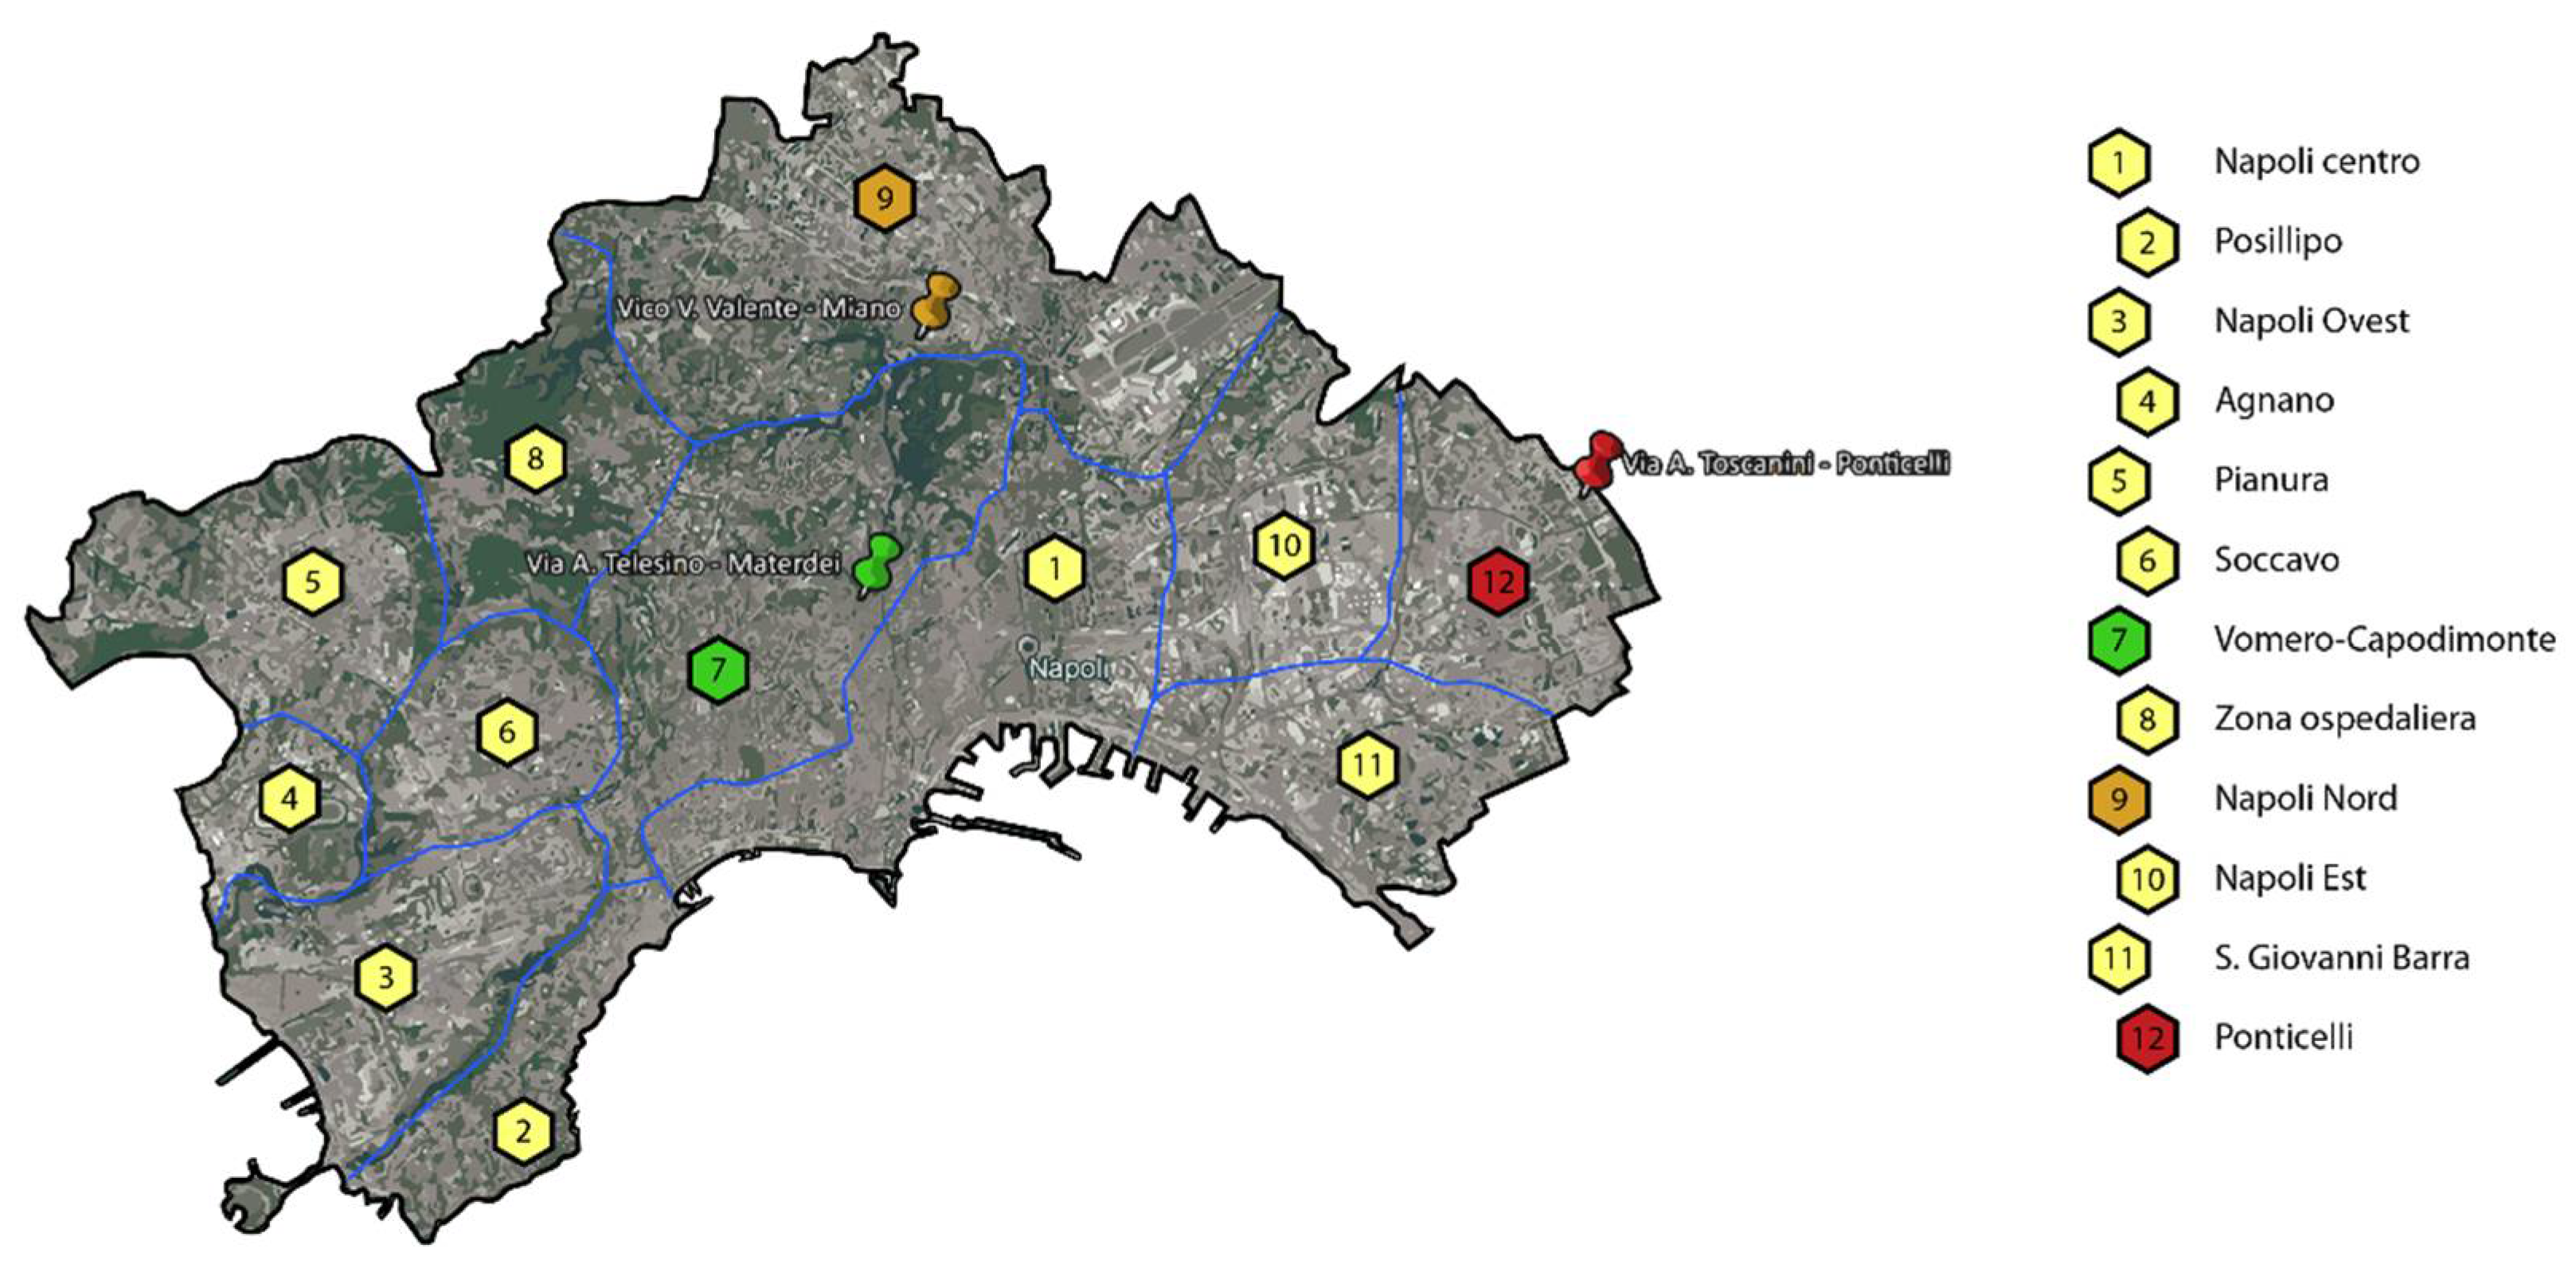
To develop, test, and verify the process of analysis, the data exchange, and the verification of performance response to the introduction of adaptive climate urban regeneration strategies, two case studies were identified that differed in their construction period, construction technologies, and morphological characteristics in the urban context. In particular, as application cases, we chose to analyse the energy behaviour of a building that existed in the Materdei district and one in the Ponticelli district (Figure 2), as well as the environmental behaviour of the urban contexts in which they existed, and the interaction and influence between the inside and outside. For both cases chosen, it was possible to monitor the indoor and outdoor conditions exclusively within a housing unit.
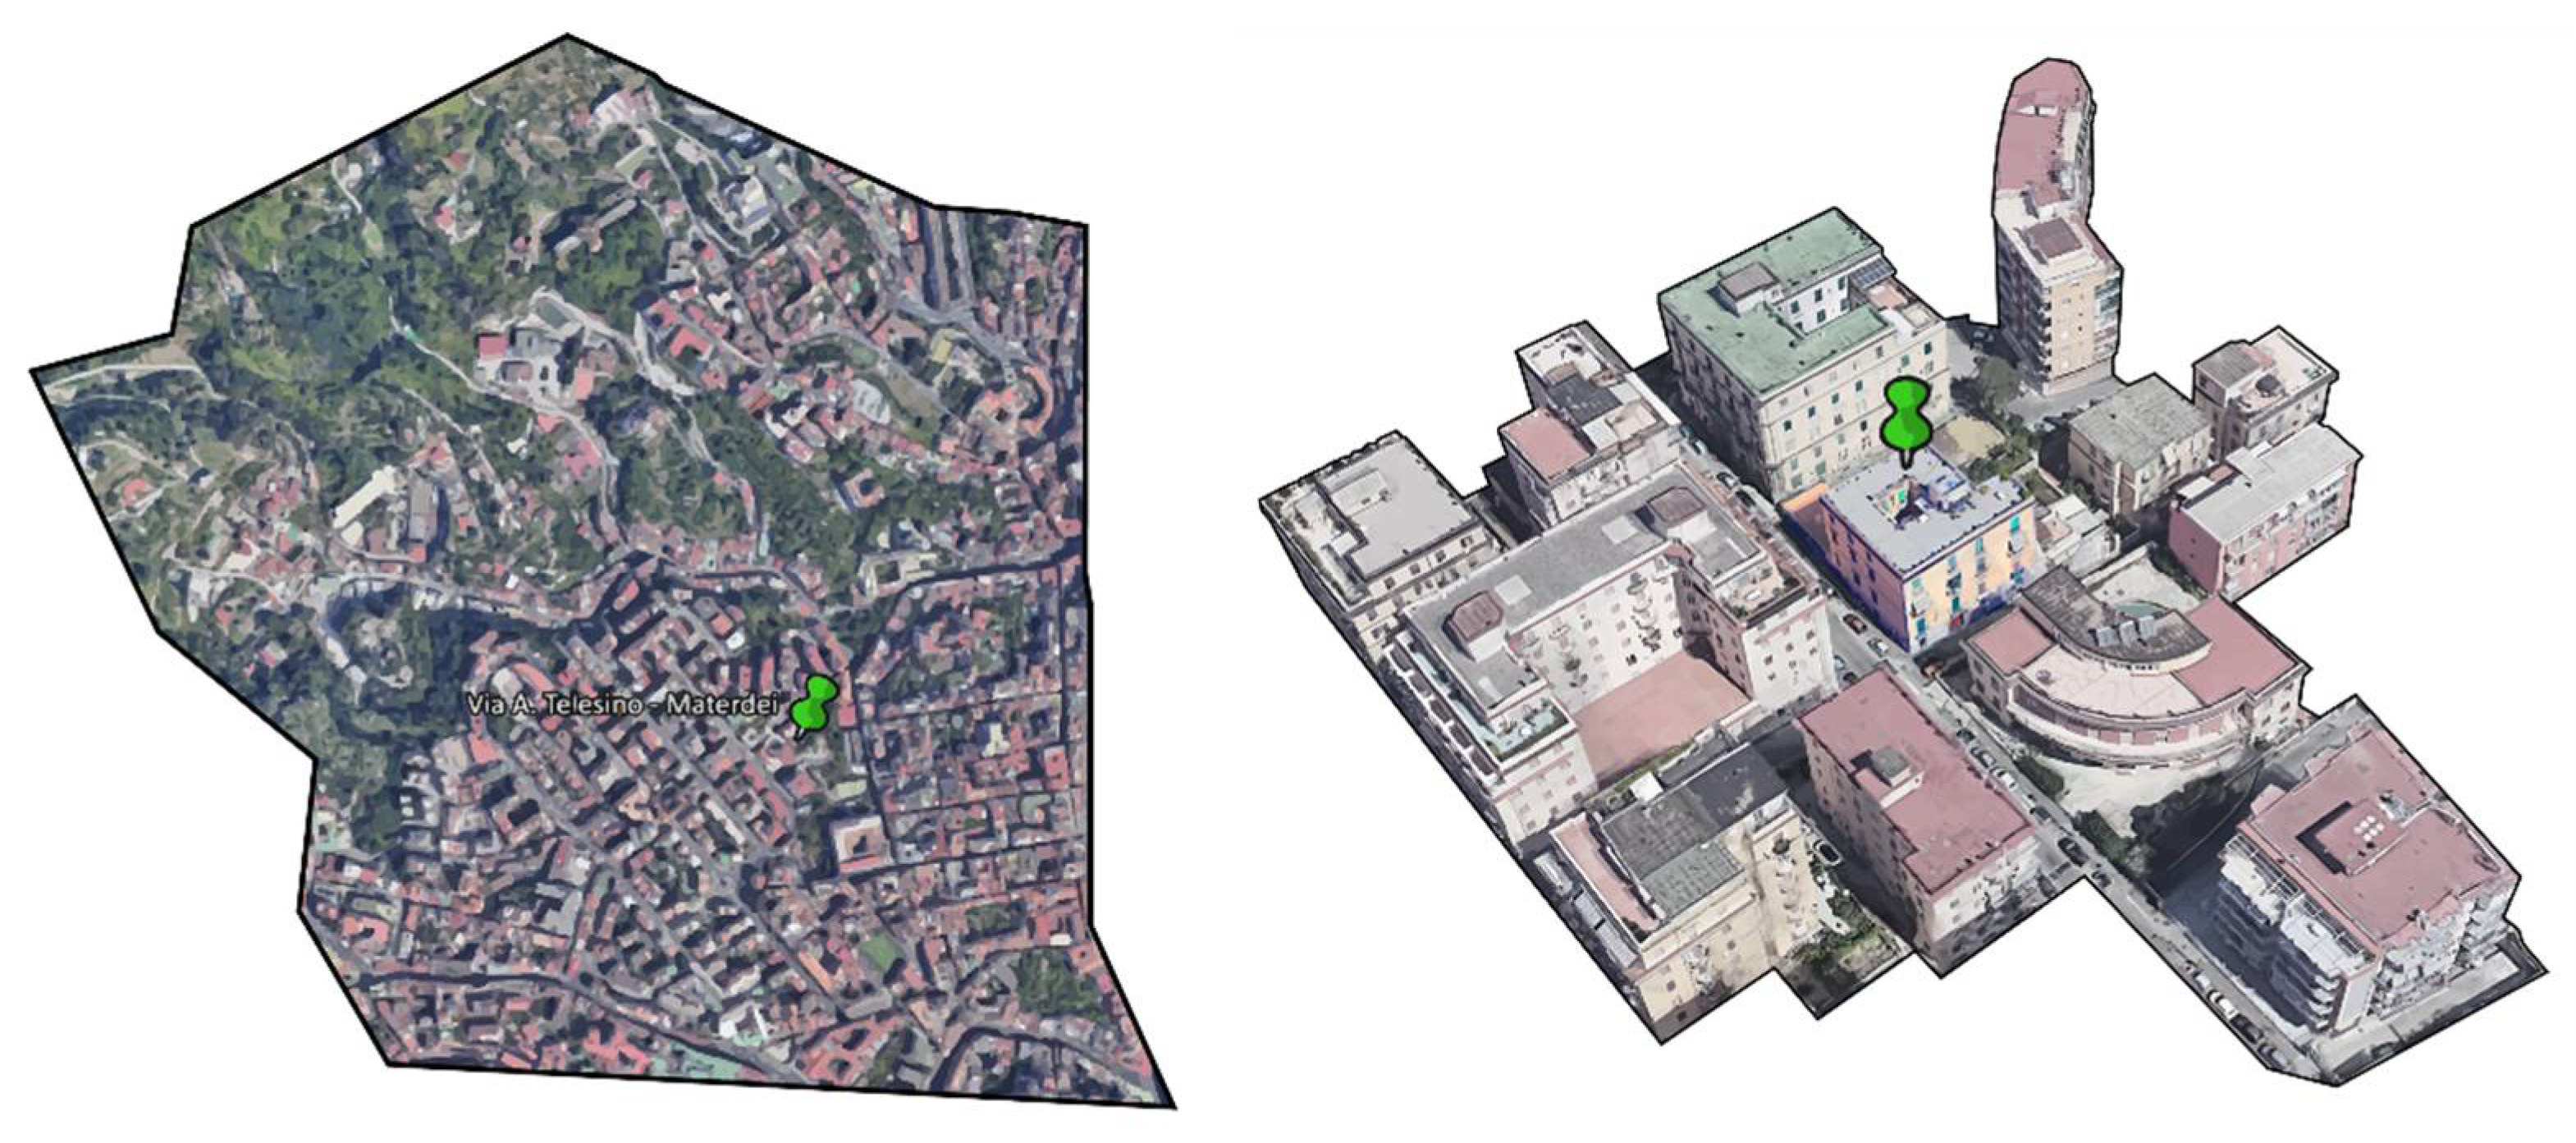
As for the building considered for the district of Materdei (Figure 3), just as most of the buildings in the neighbourhood, it was built between the end of the ‘800s and the beginning of the ‘900s. The construction technology found had a tufa brick load-bearing masonry, brick and concrete slabs, and the transparent closures of various types. In particular, for the monitored housing unit, transparent closures were made of aluminium with double glazing, with the presence of sunscreens placed on the outside.
The building of the Materdei district was compact, with block buildings of a height and width that were homogeneous with the width of the street, which did not exceed 10 m. Of note is the almost total absence of vegetation in the public spaces and the presence of asphalt road surfaces and pavements for sidewalks in concrete blocks.
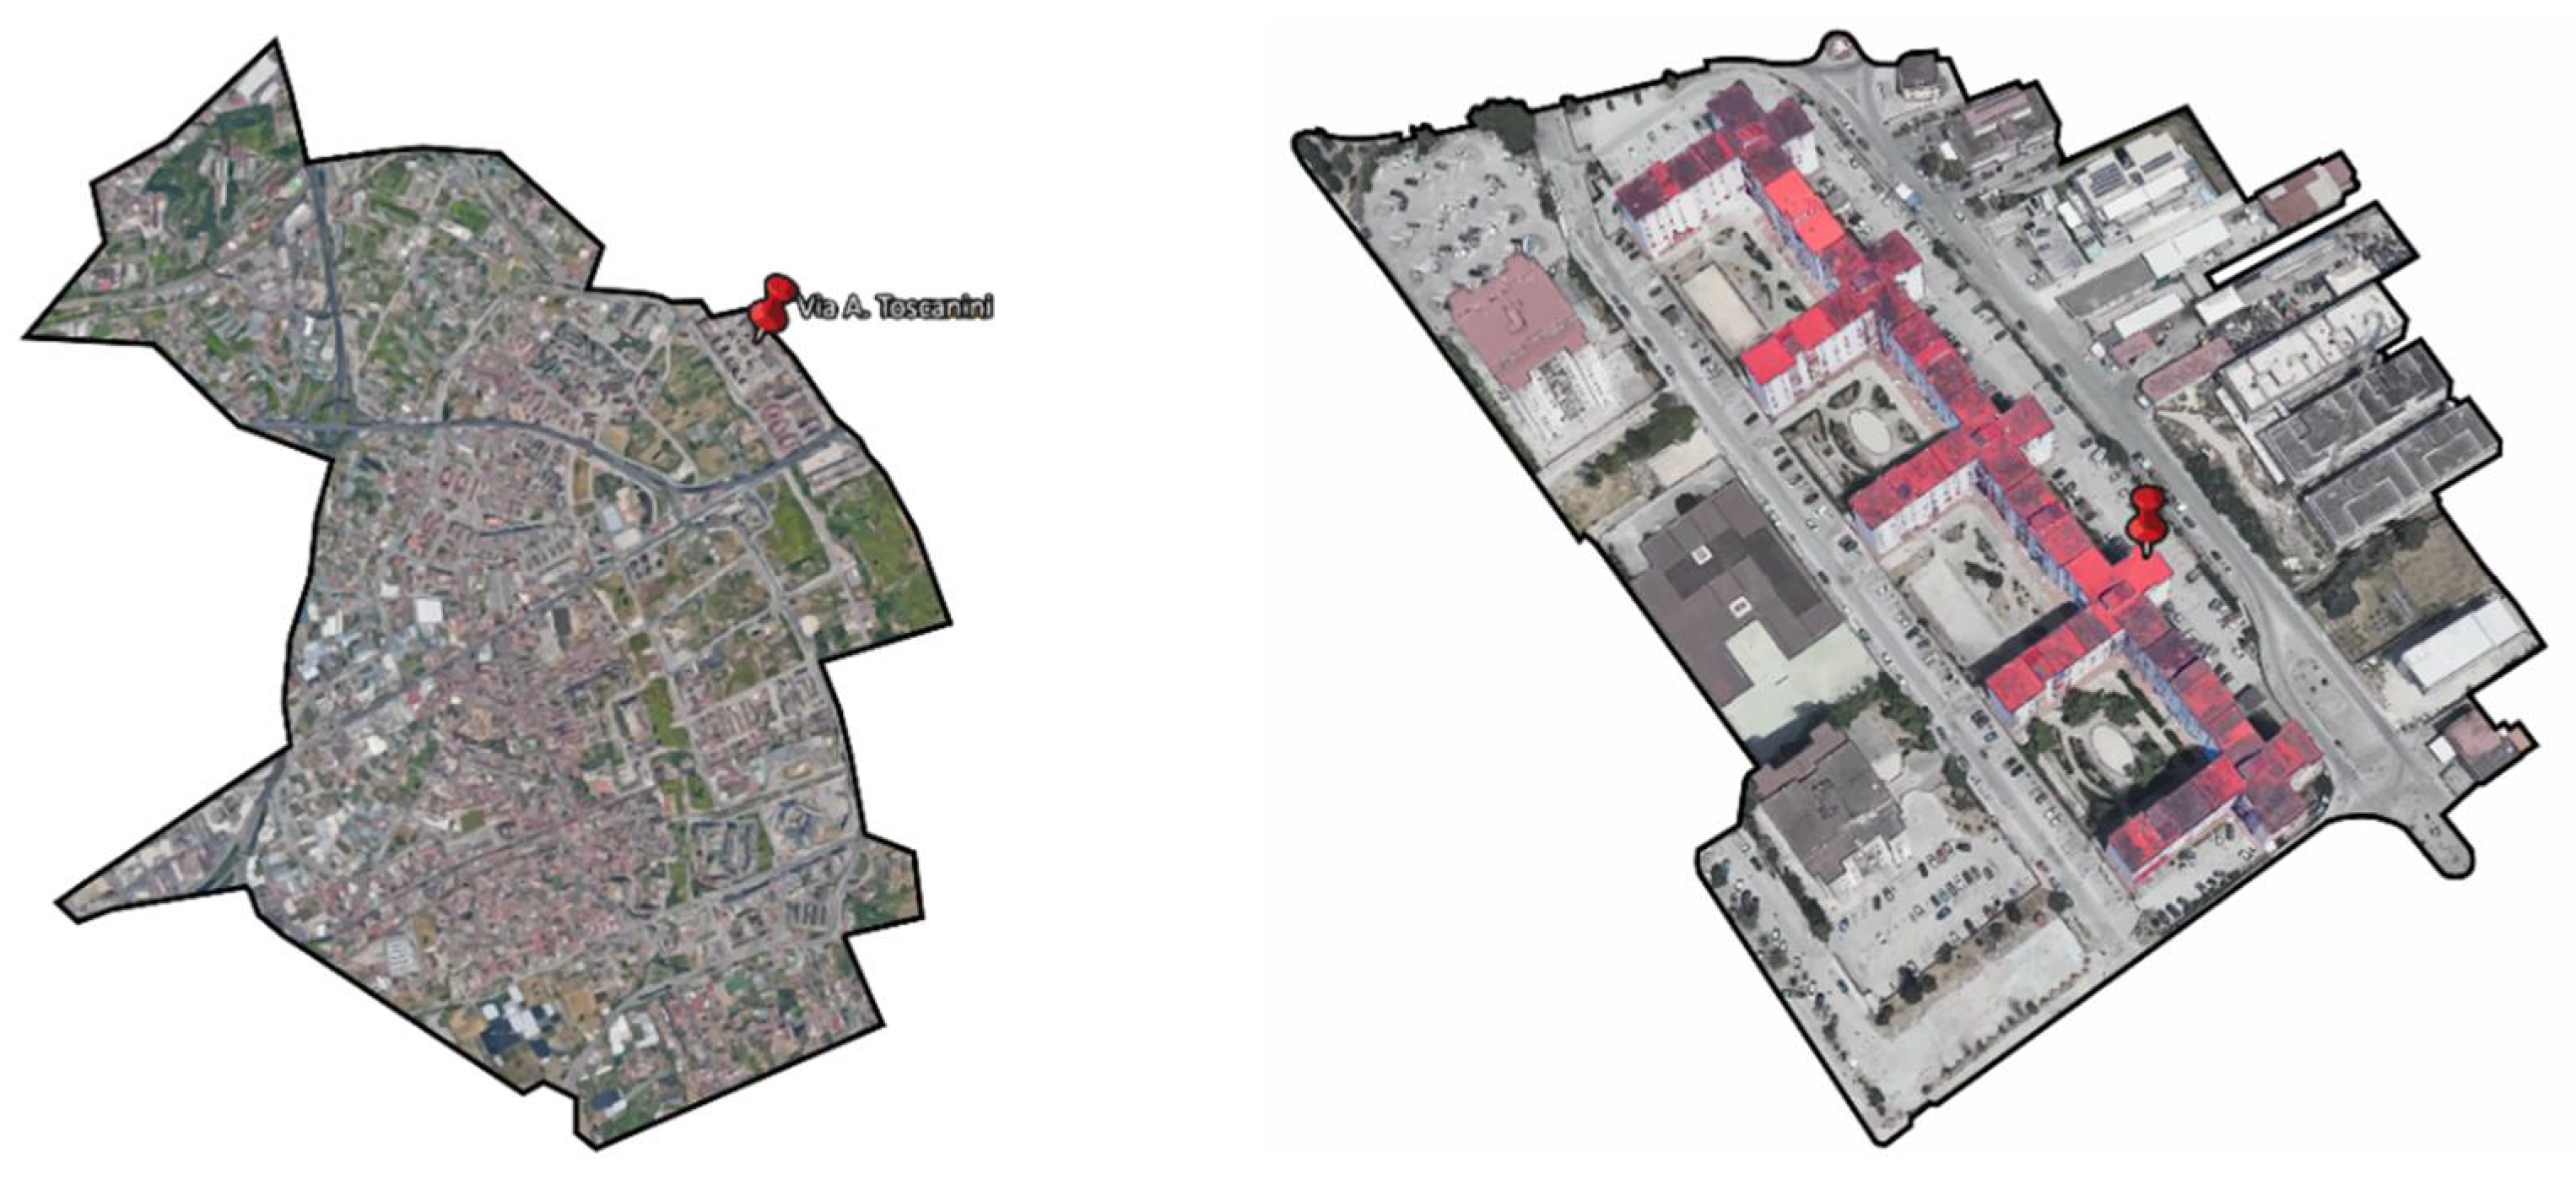
The building analysed within the Ponticelli district (Figure 4) was built in the early 80s, following the Programma Straordinario di Edilizia Residenziale (P.S.E.R.), a program issued after the earthquake of 1980 as part of Law 219/81, which, in Title VIII, provides for the construction in the metropolitan area of Naples, including 20,000 housing and related urbanization works. The construction technology found included a reinforced concrete frame structure, opaque concrete closing panels, brick and concrete slabs, and anodized aluminium with a single glass for transparent closures.
The building in which the building under consideration existed was part of a larger complex of in-line buildings placed according to different orientations to form a sequence of open courtyards. The morphology of the Ponticelli district was mixed depending on the construction time of the buildings. If we consider the analysed building, this was isolated from the surrounding buildings. The width of the roads was more than 15 m, and the presented roadway, a paved surface, and the sidewalks were realized with concrete blocks or ceramic terracotta surfaces. The lawn surfaces were present within the open courtyards and were formed between the buildings, while the trees were small and, if present, exclusively in the courtyards.
2.2. Direct Collection of Environmental Data
The collection of environmental and microclimatic data through the use of sensors, the data of the geometric, functional-spatial, and technological-constructive characteristics of the urban space (Table 1), the survey of the materials (Table 2), and the knowledge of the thermophysical characteristics (thermal transmittance, albedo, emissivity, etc.), as well as the elements of the vegetation, are all factors of knowledge necessary for the correct definition of the subsequent phases and the simulation processes within the framework.
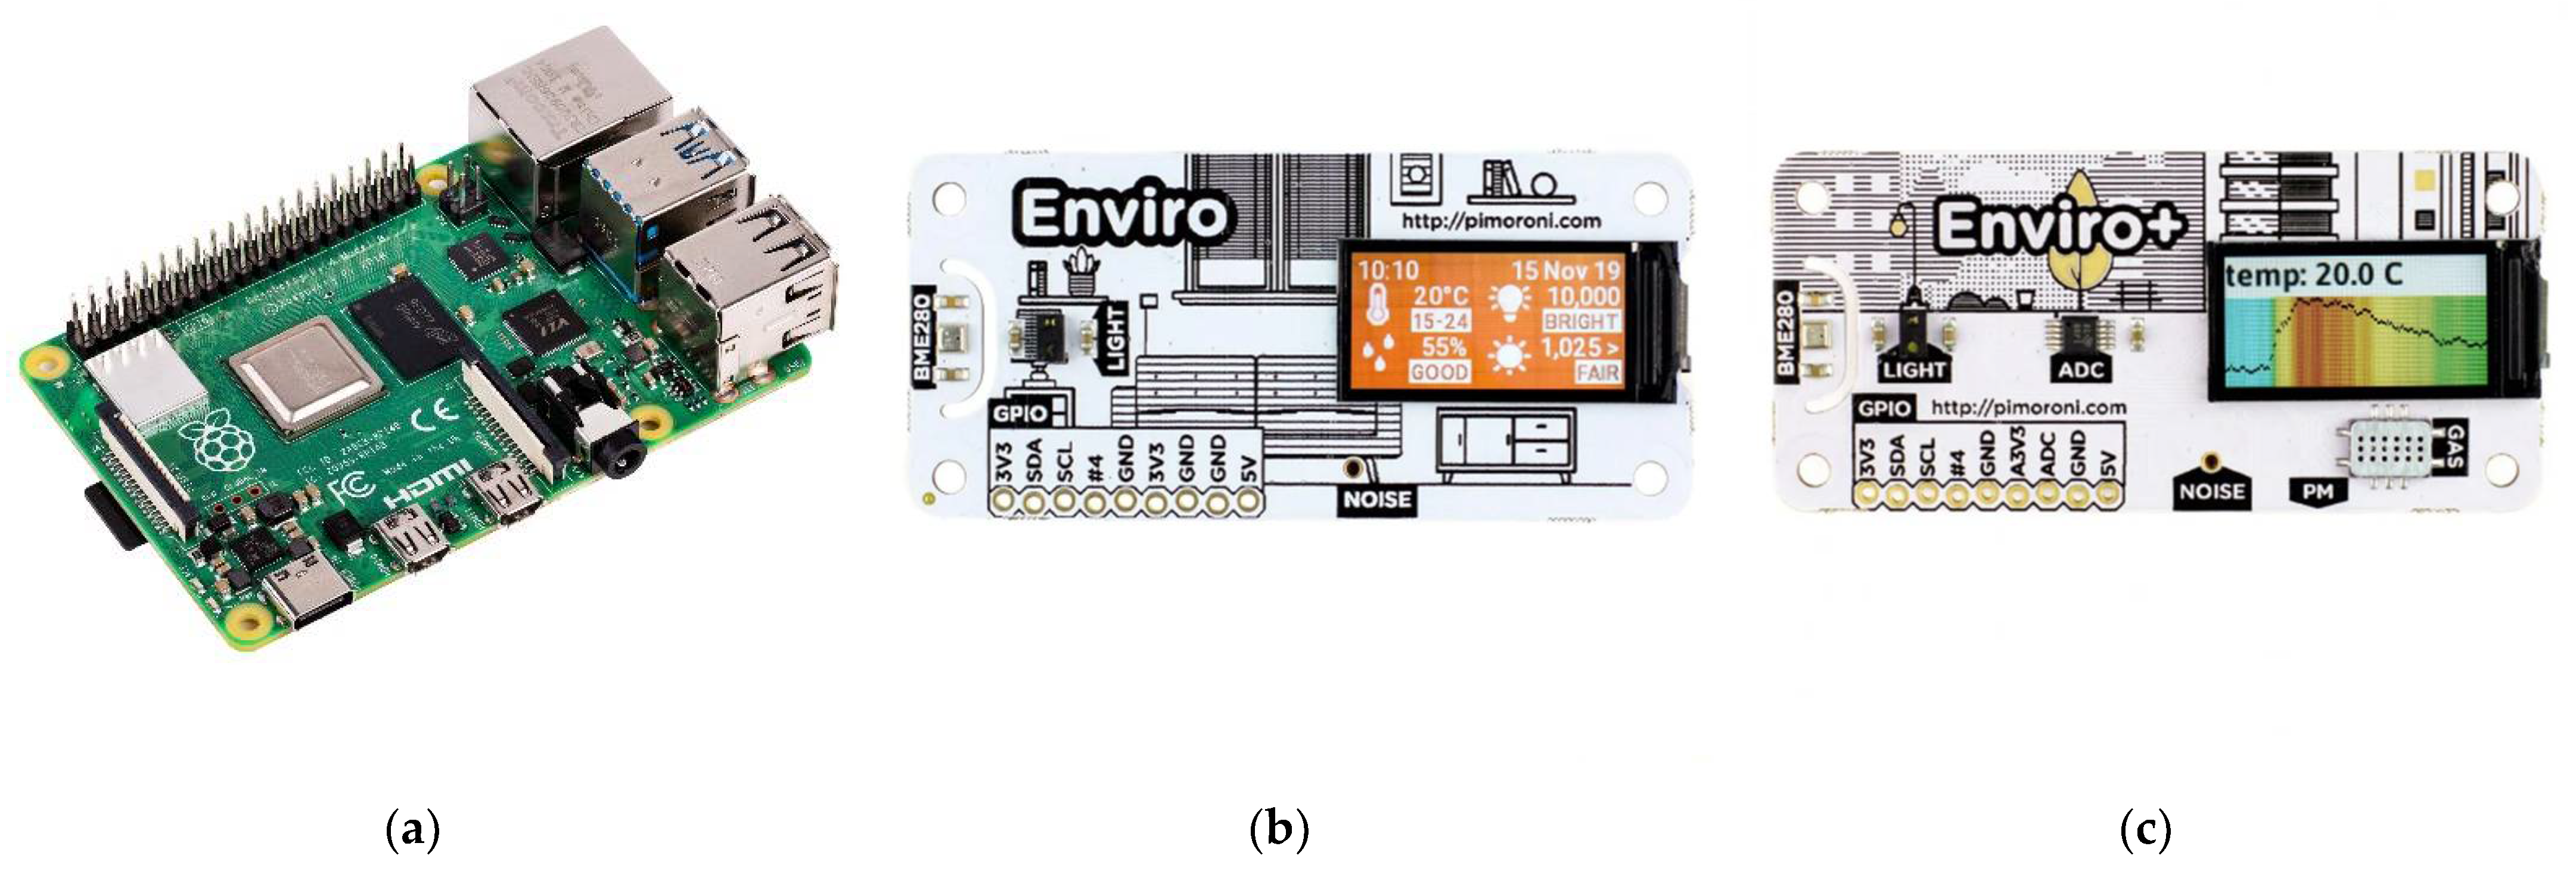
To this end, it was necessary to use direct and indirect methods in a process that was articulated between the material and immaterial. In particular, for the survey of indoor and outdoor environmental data, the Pimoroni Enviro and Enviro+ sensors were used, installed on two single-board computers, the Raspberry Pi 4—Model B type, that were capable of revealing data on air temperature, humidity, and solar radiation (Figure 5). For the construction of the virtual models of the buildings and open spaces, an algorithmic process was used using the Gismo plug-in [27] for the VPL (virtual programming language) platform, Grasshopper, which allowed the execution of a data exchange process from a GIS environment within the Rhinoceros three-dimensional modelling software. A more detailed definition of the model, which included for open spaces the different surfaces and vegetation present, was obtained through the plug-ins of Grasshopper, Ladybug, and the Dragonfly Legacy for outdoor analysis [28]; this allowed the connection and exchange of data with the ENVI-met 5 software [29]. For indoor analysis, the algorithmic process allowed the imputation of the geometric, constructive conditioning systems characteristic of the buildings to be analysed and the schedules of the behaviour of the occupants, the operation of the equipment, and the opening of the transparent closures, then free of the environmental contributions. It was chosen to use the Ladybug Tools add-on suite [30], which allowed the connection with simulation tools such as Radiance, Daysim, EnergyPlus, and OpenStudio [31,32,33,34].
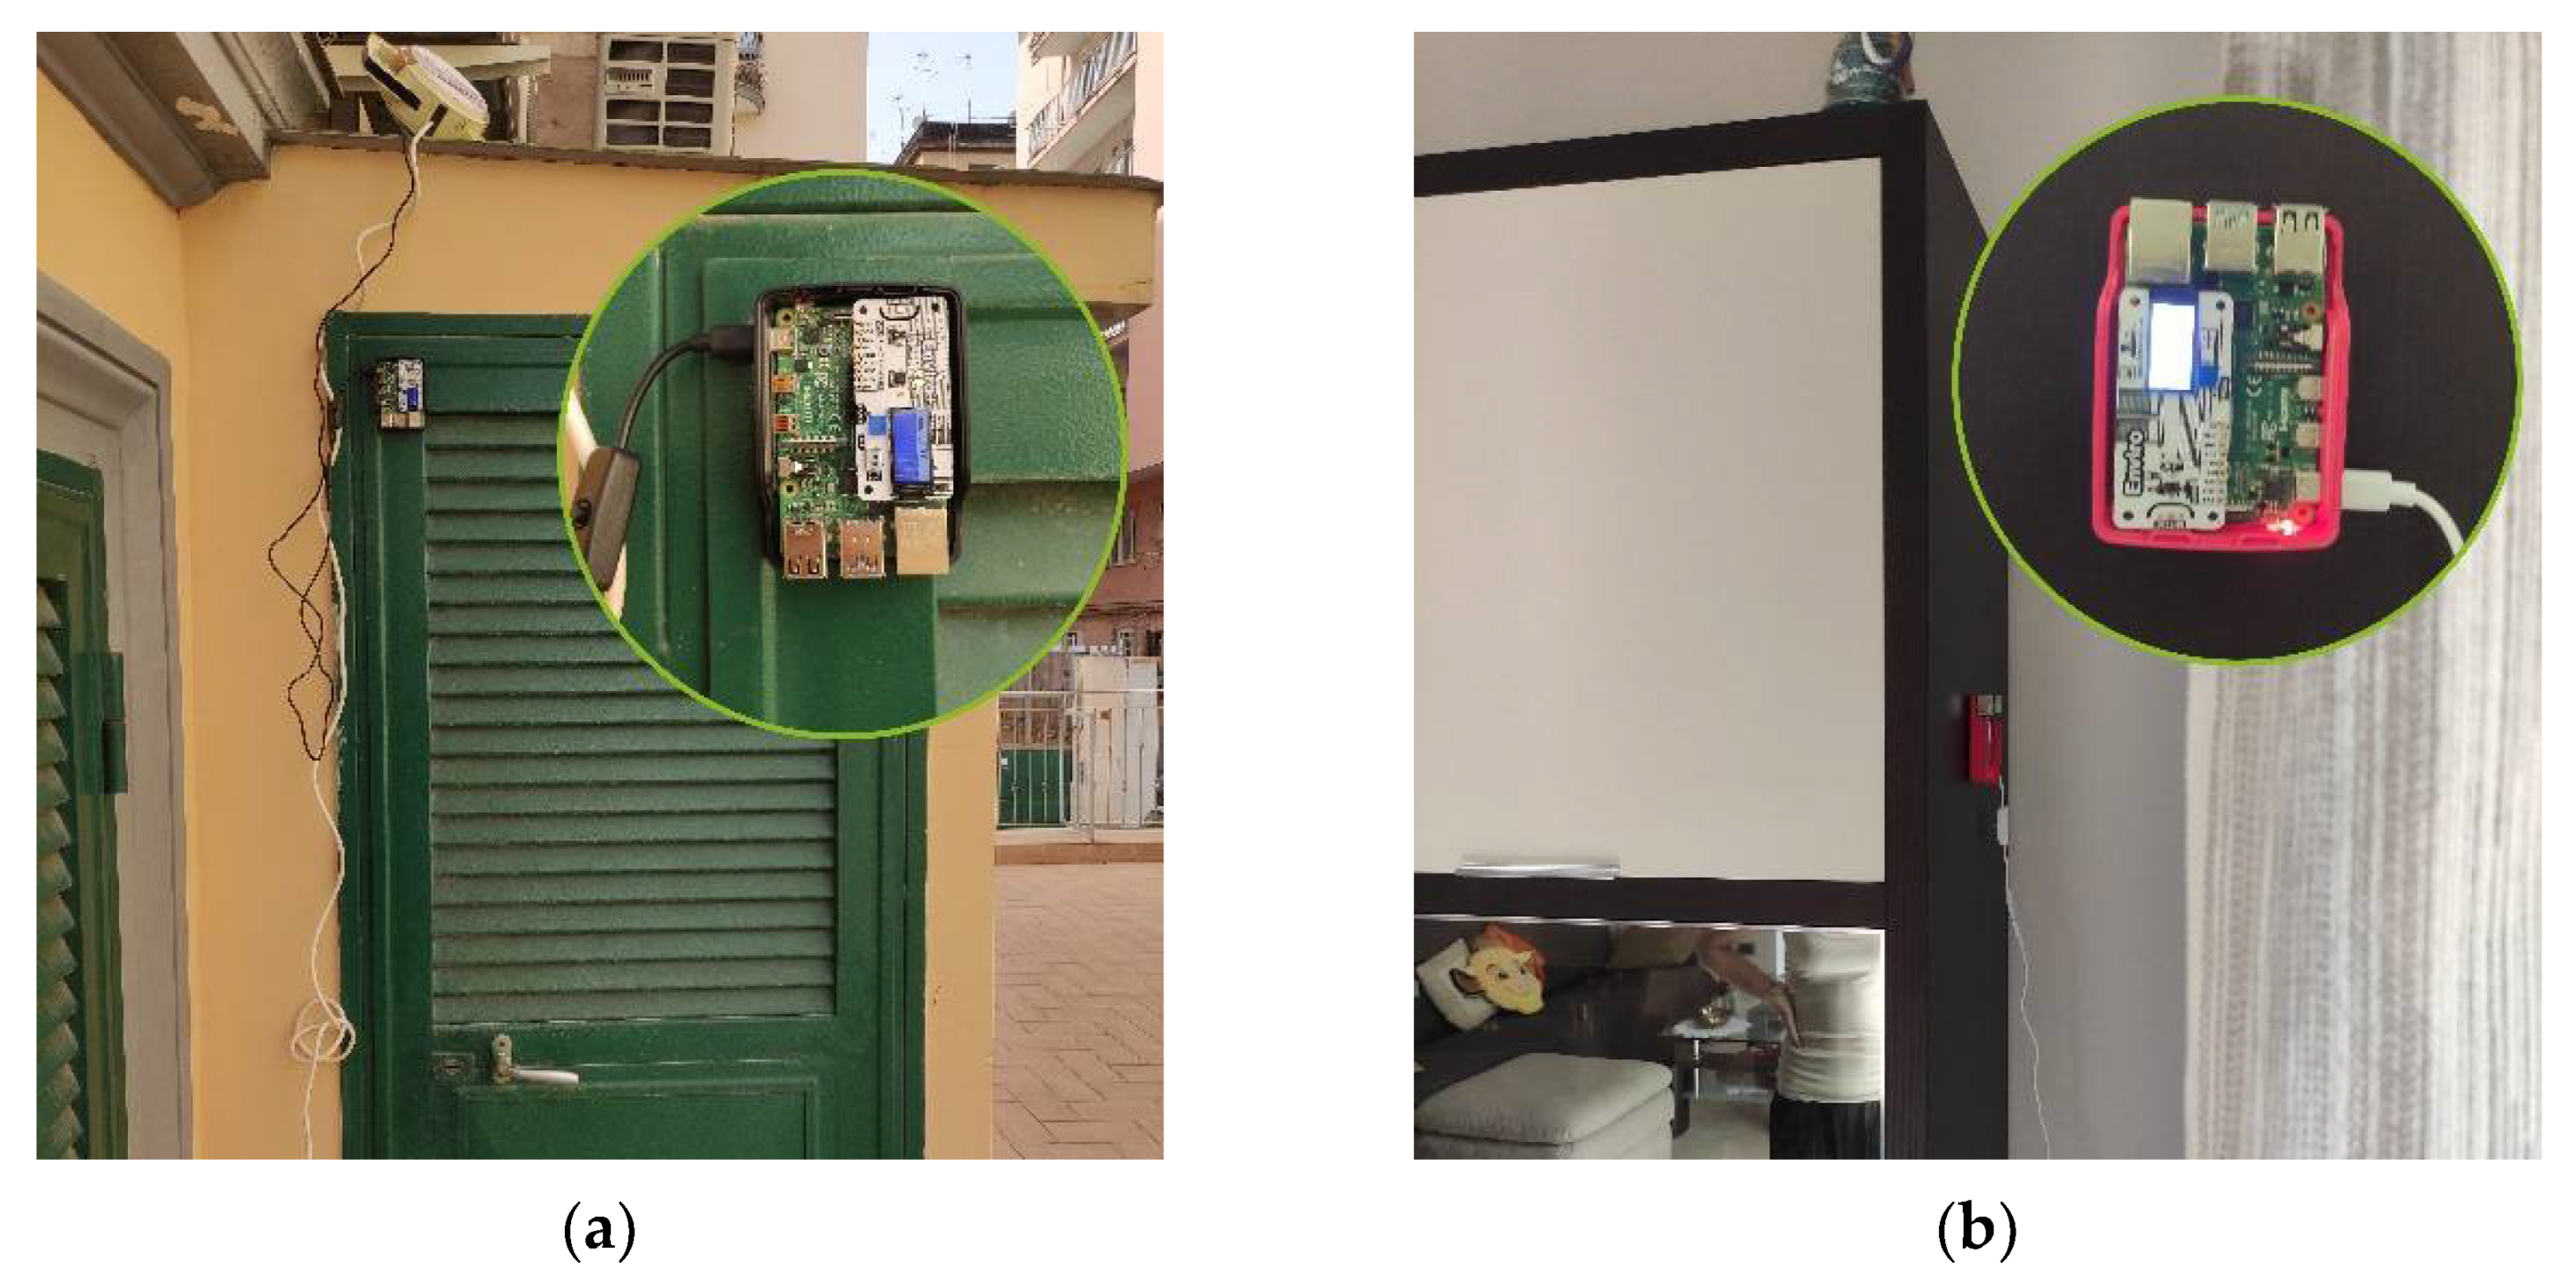
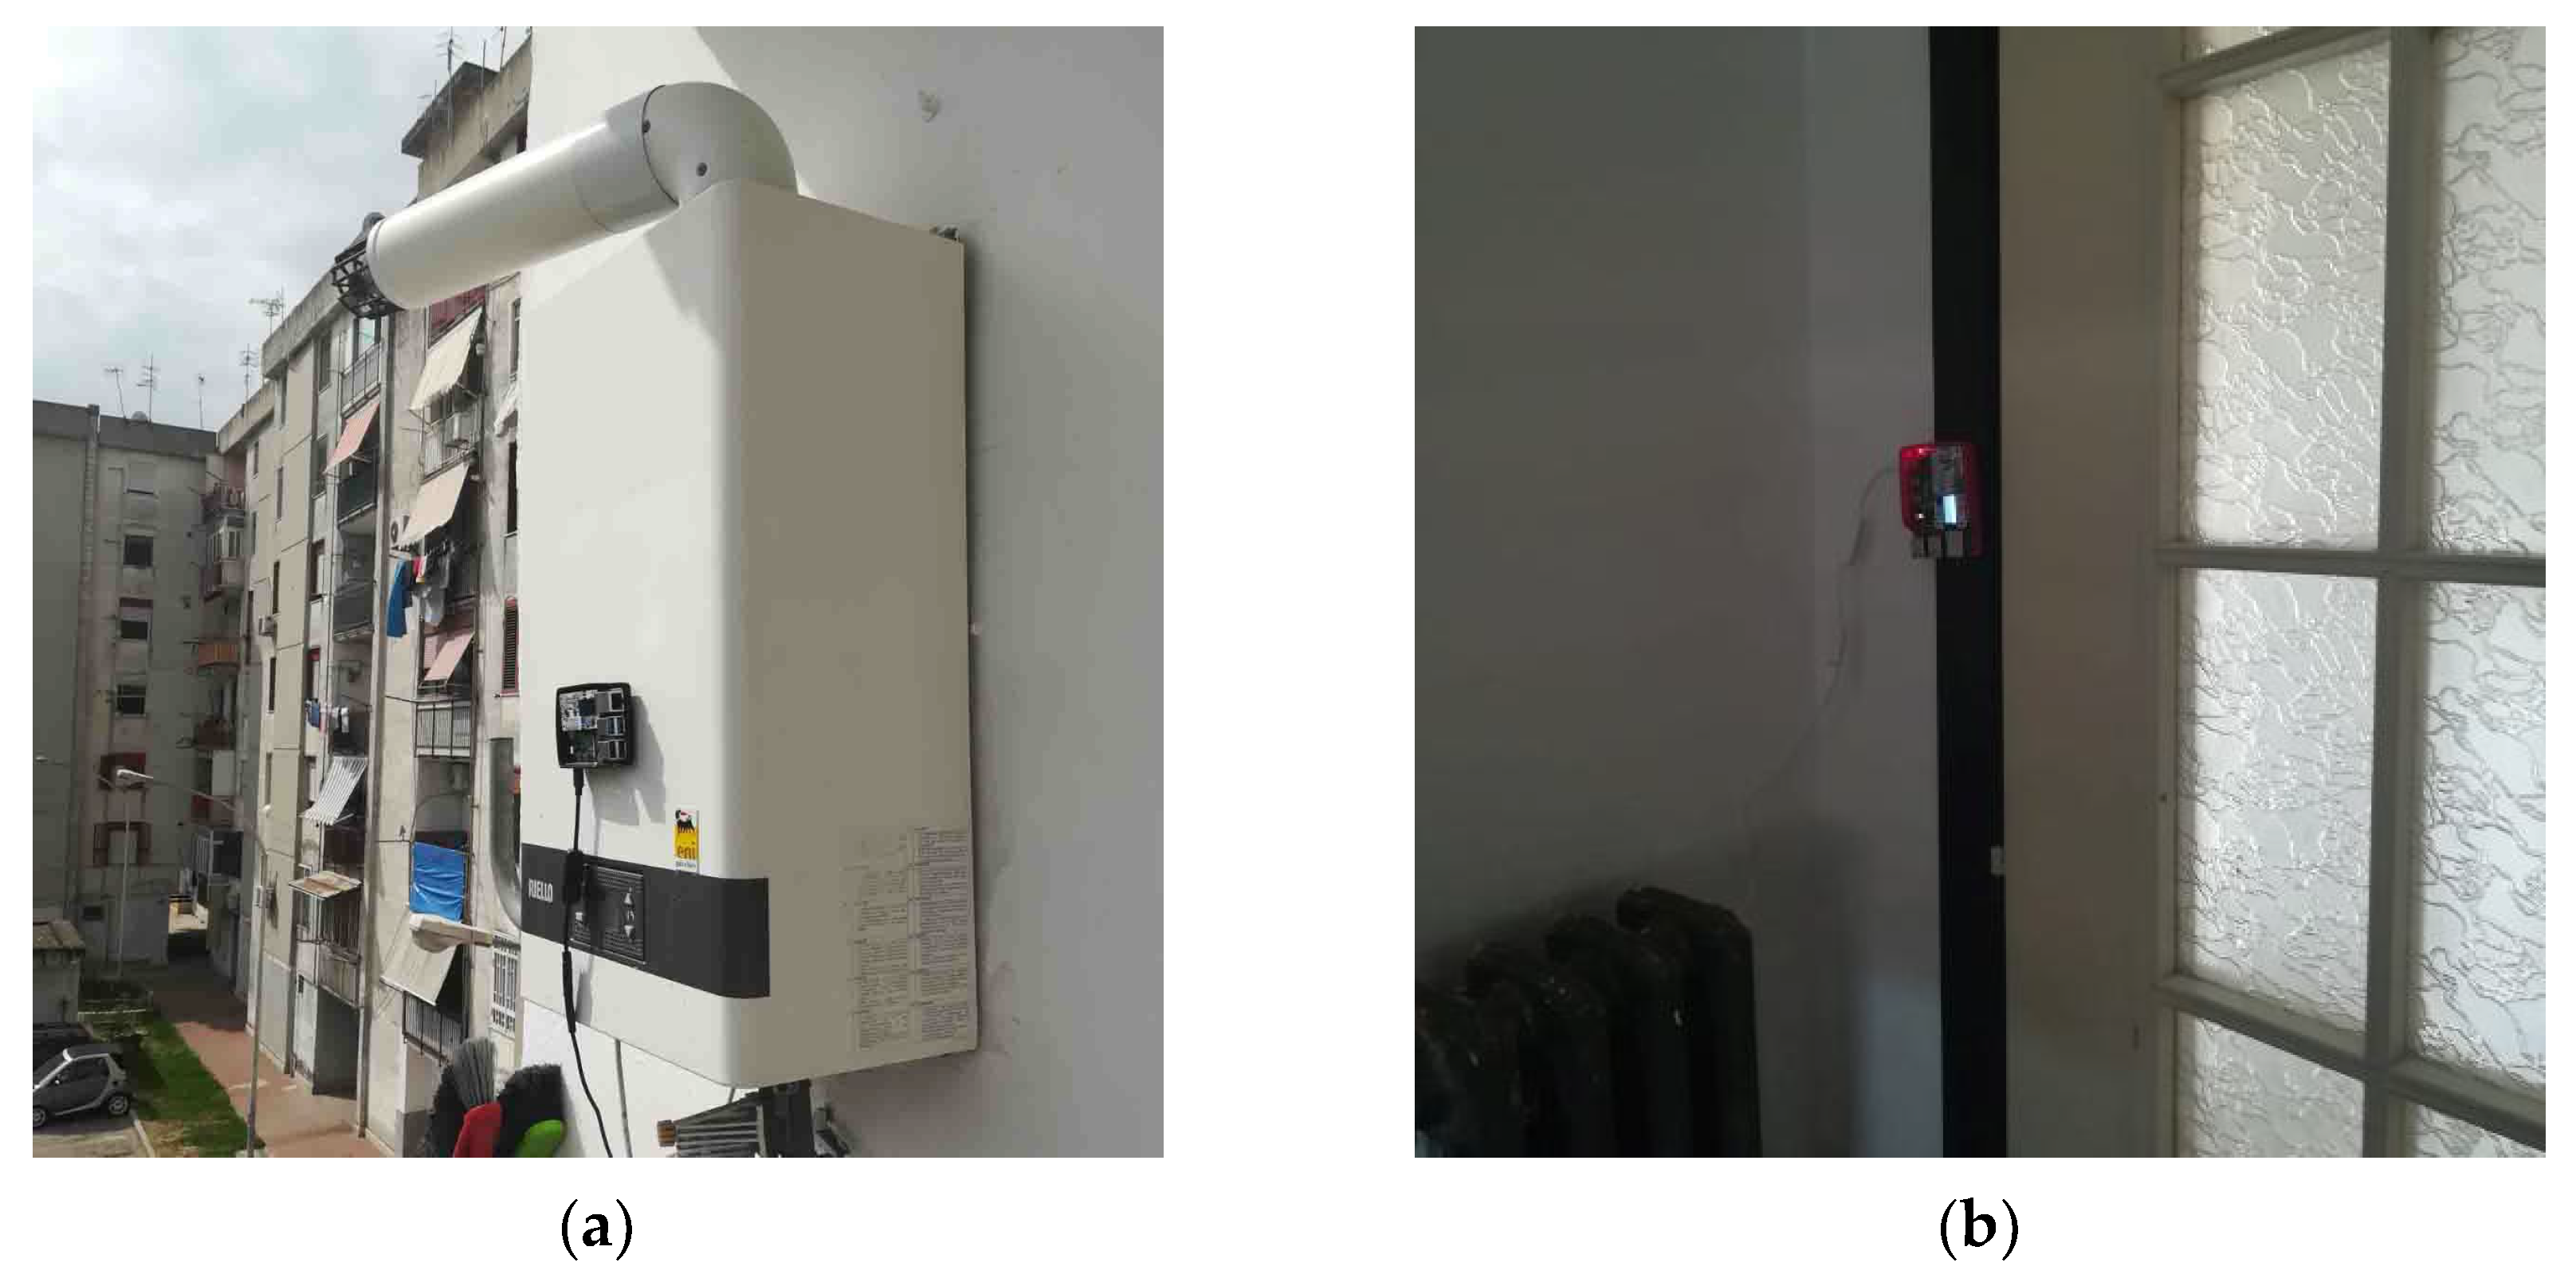
The period of the collection of indoor and outdoor environmental data through the sensors took place during the summer season for the city of Naples and, in particular, for the housing unit monitored within the Materdei district, the detection period went from 11 August to 15 August 2021 (Figure 6), while for the housing unit inside the Ponticelli district, the survey period went from 24 July to 2 August 2021 (Figure 7).
The data obtained were then analysed to be systematized, converted, and used within the algorithmic environment. For this purpose, starting with a .CSV file type, the data were converted to a .EPW file type: a standard format for climate data [33].
2.3. Administration of a Questionnaire on the Perception of Indoor and Outdoor Comfort
Parallel to the collection of data through the sensors, and for both cases, an anonymous questionnaire was administered on the behaviour of the people interviewed at home and outside, as well as an assessment of the perceived feeling of well-being. The aim was to compare the behaviours and feelings of comfort that users recorded in various time intervals and the data that would be obtained from the simulation processes according to the PMV and ACM indices.
The structure of the questionnaire included a first part where data such as location, the prevailing exposure of the housing unit, the year of construction, and the type of construction were recorded. In the second part, it was required to identify the environment where the two sensors were installed, for the indoor, the plant equipment (summer and winter air conditioning systems), and for the outdoor, the presence of overhangs, protrusions, or vegetation that may cast shadows on the sensors (the position of the sensors and the context in which they were inserted had to be documented through photographs). The third part concerned the occupants of the apartment, where it was required to specify the number of individuals, their sex, age, height, weight, work/activity, affection for chronic diseases and for how long and finally, in the case of women, if they were pregnant. The last part involved the repetition of a card for each day of monitoring, divided into four sections: the morning (6:00–12:00), afternoon (12:00–18:00), evening (18:00–24:00), and night (24:00–6:00). In this section it came to the individual to indicate whether they had been predominantly at home or away from home; if yes it was necessary to state the prevalent activity they carried out (work, study, housework, exercise, rest, etc.), as well as indicating whether the windows were open or closed, whether the air conditioner or fan was active, the type of clothing, the feeling experienced ranging from very hot to very cold, and the degree of satisfaction inside the house (from very satisfied to very dissatisfied). For the monitoring of outdoor behaviours and sensations, the survey first asked whether the interviewee had been away from home or had remained near their home, and if the answer was affirmative, which activity they had mainly carried out (sitting, walking, brisk walking, physical exercise, etc.), indicating the type of clothing, the sensation experienced (from extreme heat to extreme cold), as well as the degree of satisfaction experienced outside (from very satisfied to very dissatisfied).
2.4. The Development of the Algorithm for the Simulation of Conditions Outdoor
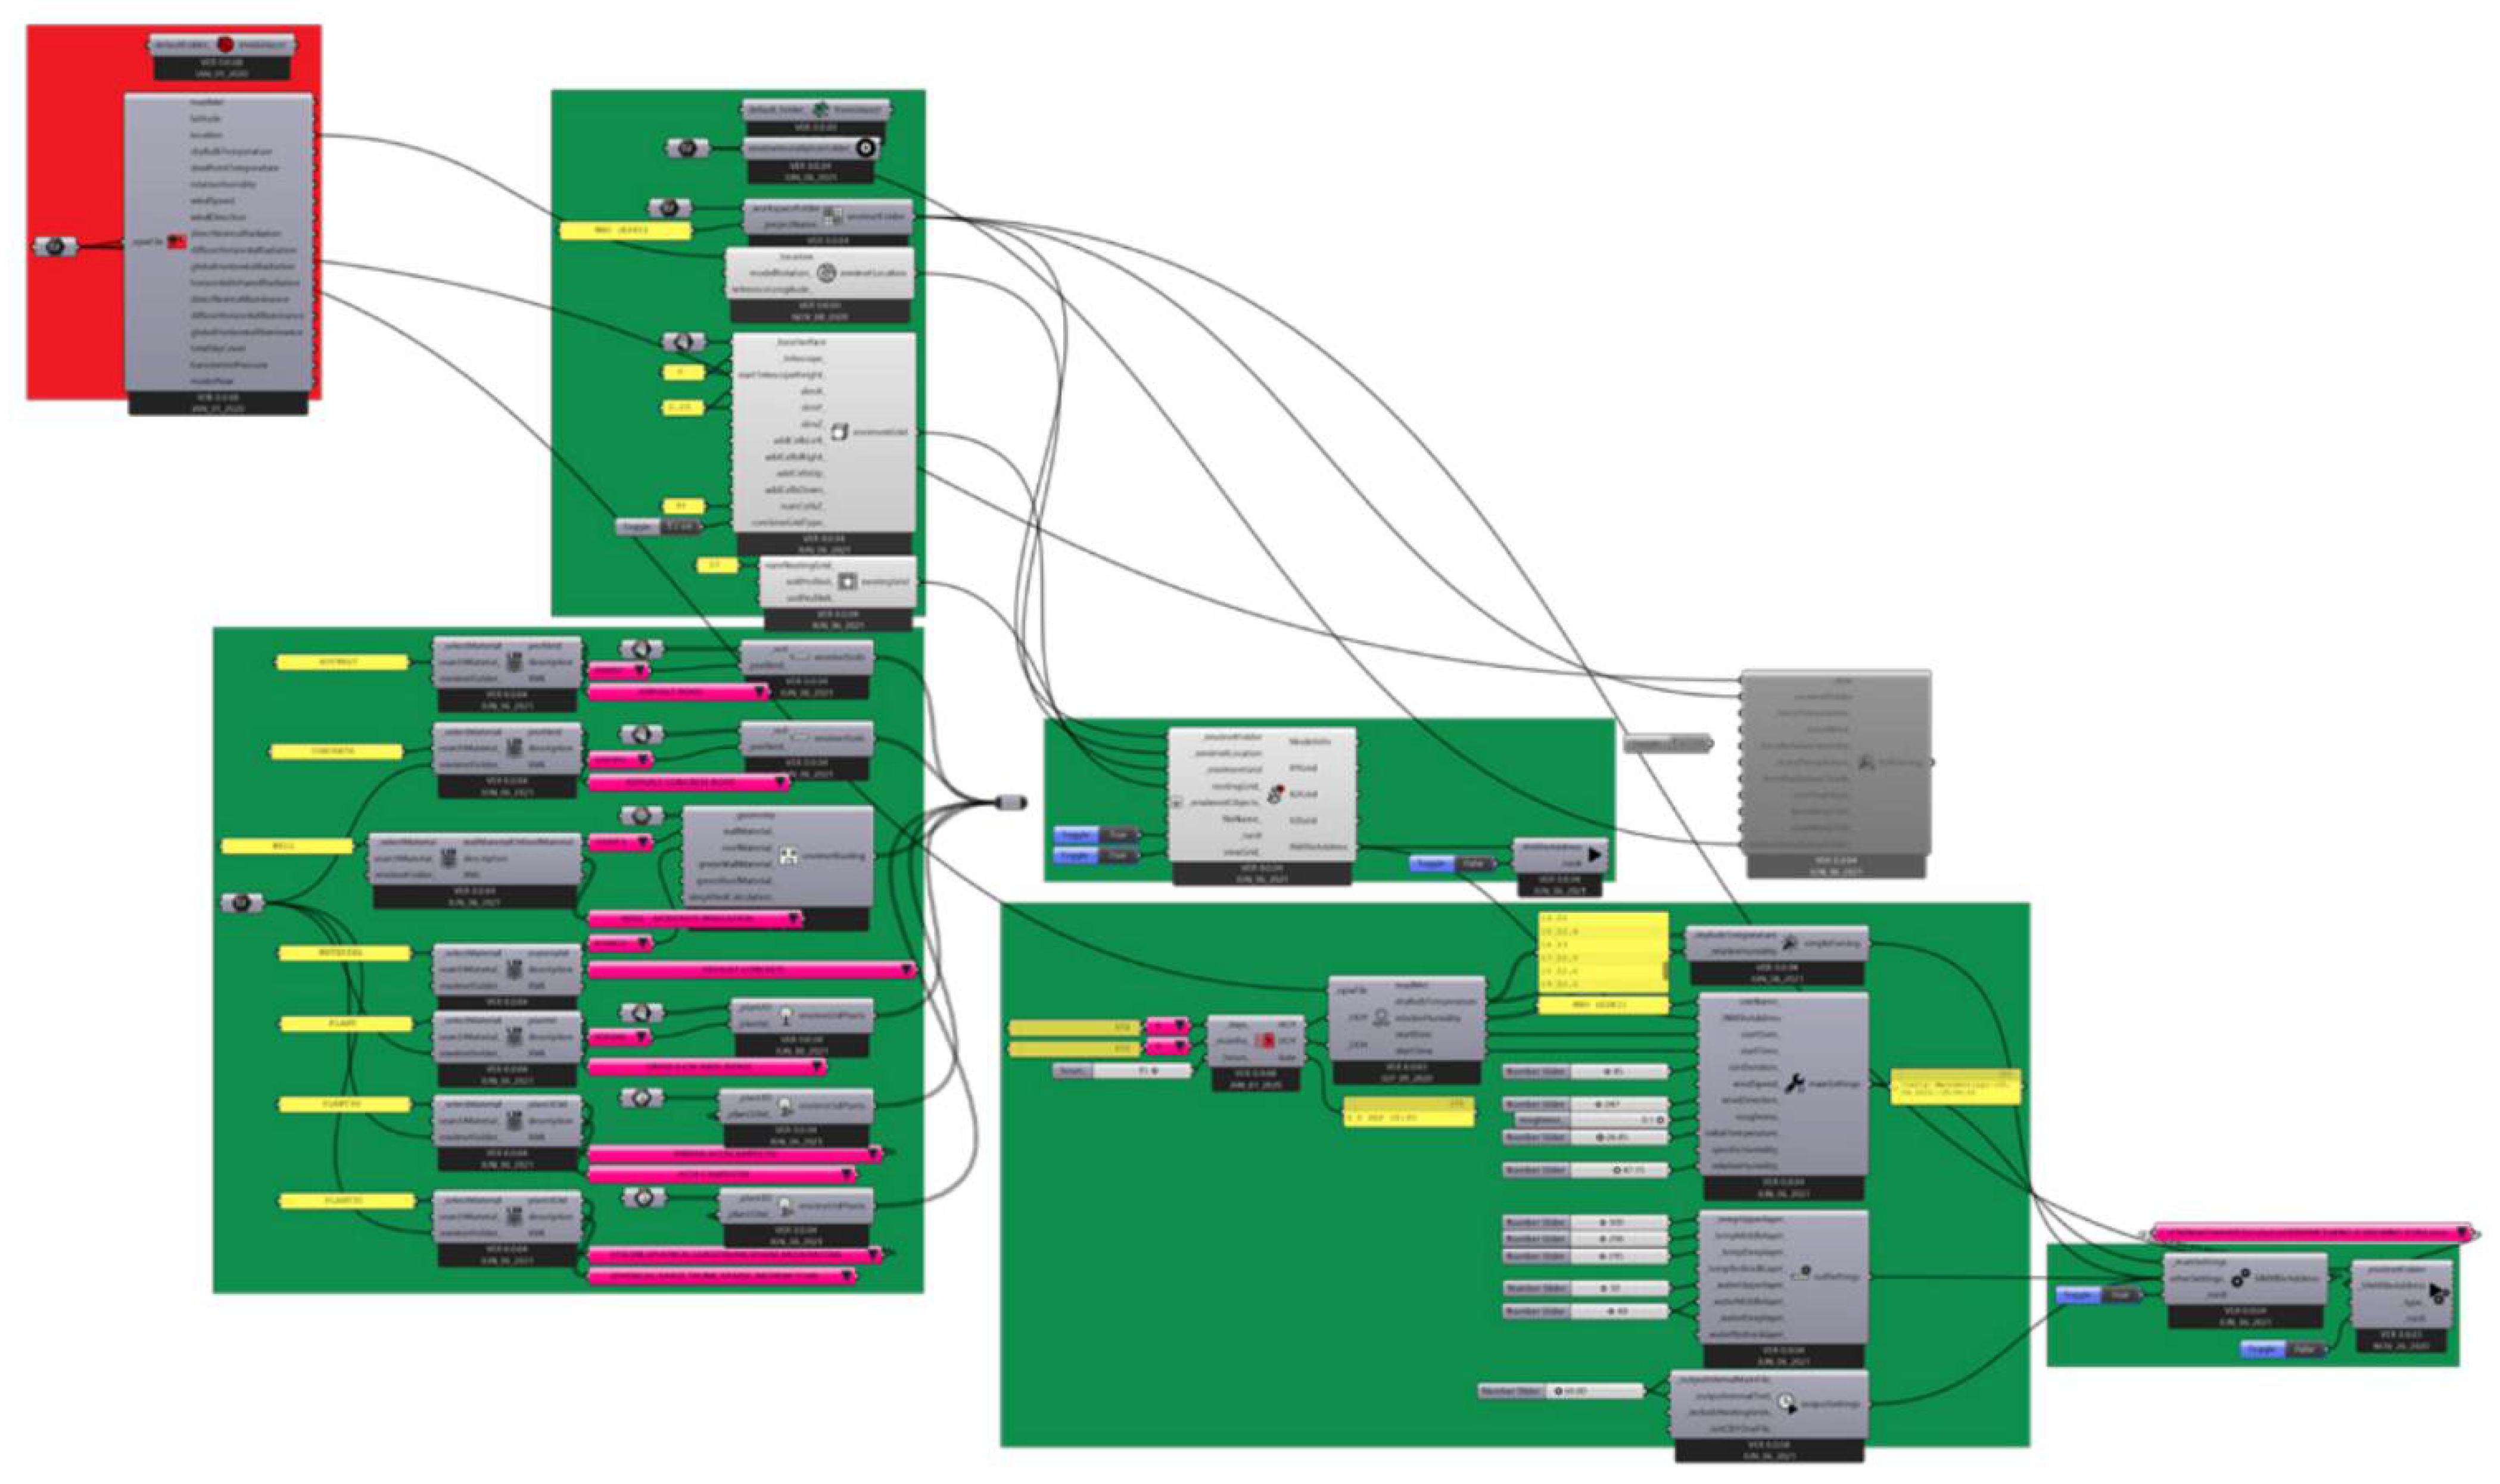
To conduct a simulative analysis on the outdoor behaviour of the reference urban context, extract the data and compare them with those obtained from environmental monitoring through sensors by determining the accuracy of the simulations, an algorithmic process based on the Grasshopper plugins, such as the Ladybug and Dragonfly Legacy, have been used which allow the potential of the ENVI-met 5 software simulation engine to be exploited (Figure 8).
Through the potential offered by the Grasshopper add-on, Gismo, it was possible to create a simplified three-dimensional model of the area of interest in Rhinoceros and automate the process by entering the IDs for the buildings, roads, green areas, and paved surfaces. The choice to simplify the geometric shapes of the elements was pursued to obtain the best ratio between the effectiveness and time for simulations.
Subsequently, part of the algorithm was developed to input .EPW files in the process of performing simulations of the outdoor environment through the Ladybug and Dragonfly Legacy plugins. By assigning to the 3D model the elements that constituted the open space (paving, vegetation, etc.), the simulation process could start, simulating the same period in which the environmental monitoring took place.
At the end of the simulation processes, the outputs obtained could be compared to confirm or refute the validity of the data obtained from the simulations when compared with those obtained from the sensors. The simulated data were extracted both at ground level and at the height at which the sensors were installed: 4.5 m above the ground.
The comparison of the results obtained for the outdoor environmental simulations and the area under consideration in the Materdei district (Figure 9) showed, at a height of +4.5 m, a percentage difference in the average temperatures of 10.8% between those recorded by the sensors (Th = 4.5 34.2 °C), and those obtained from the simulations using the ENVI-met simulation engine (Th = 4.5 30.5 °C, Th = 0 30.6 °C). As for the perception of comfort, both the data obtained through the reading of the survey and those obtained as a result of the simulations highlighted a sensation of warmth (Table 3).
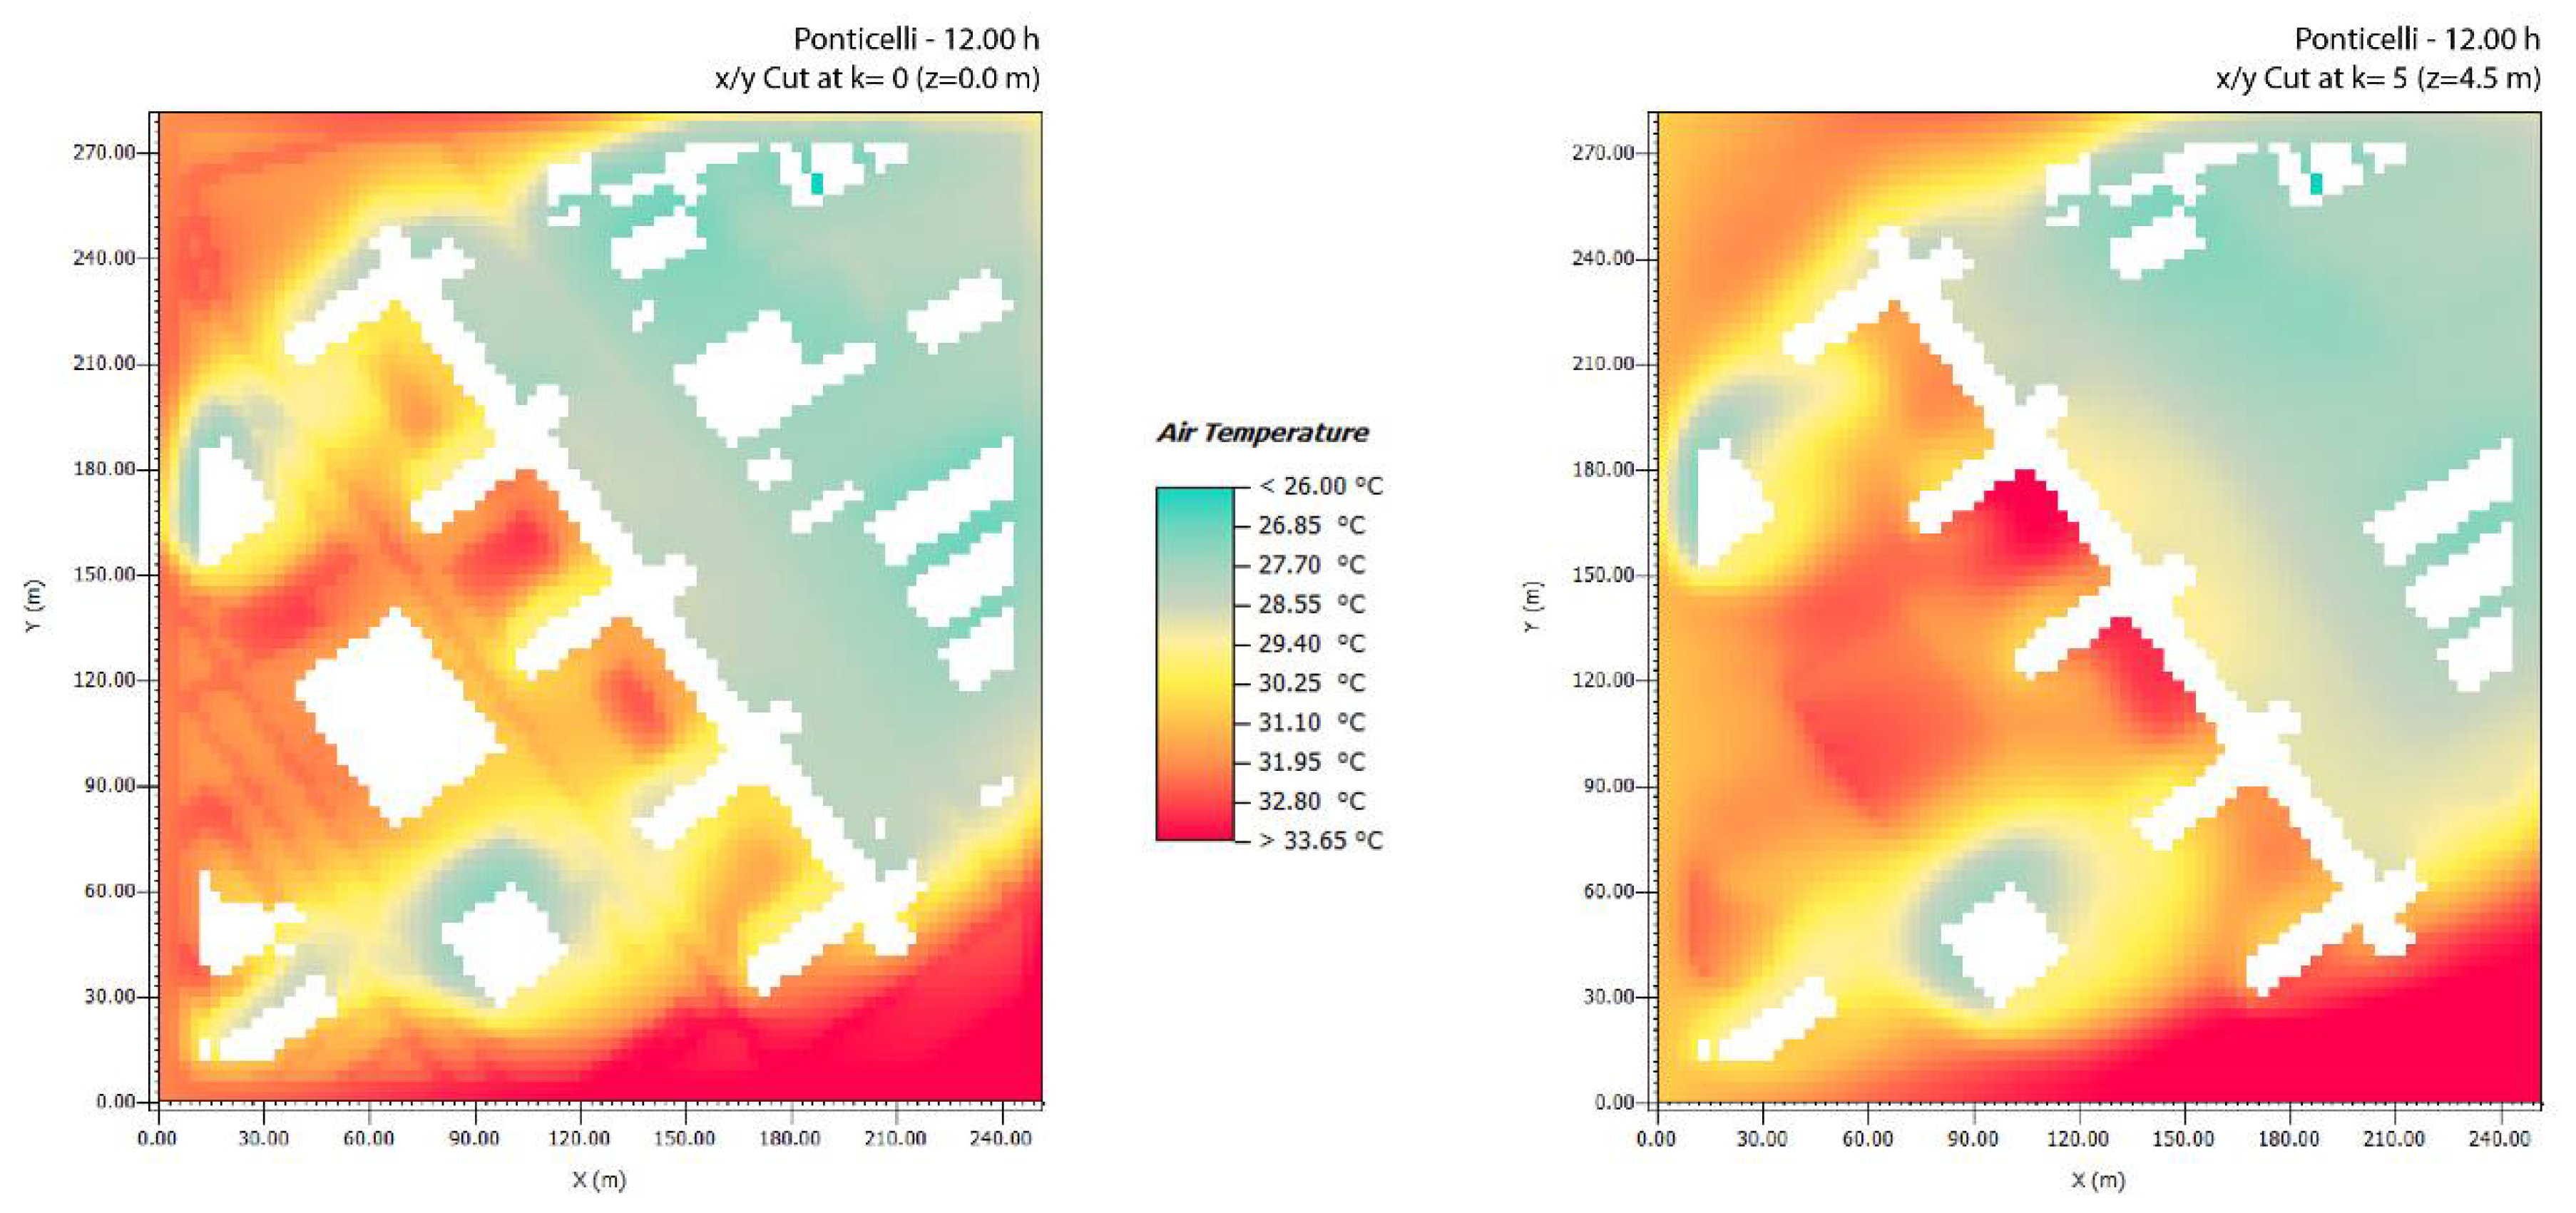
A similar comparison was made for the data obtained for the outdoor environmental simulations for the area in the Ponticelli district (Figure 10). The percentage difference in the average temperatures at height +4.5 m was equal to 20.4% between the temperatures recorded by the sensors (Th = 4.5 27.0 °C) and those obtained from the simulations using the ENVI-met simulation engine (Th = 4.5 32.5 °C, Th = 0 32.5°C). The comparison between the data on the perception of comfort from the survey and simulation confirmed a sensation between warm and hot (Table 4).
2.5. The Development of the Algorithm for the Simulation of Indoor Conditions
A similar procedure was conducted for the indoor collected data. A simplified three-dimensional model of the building and its housing units was realized. In this case, the algorithm was much more complex than that used for the outdoor analysis. Taking advantage of the plug-ins of Grasshopper, Honeybee Energy, and Honeybee Radiance, it was possible to define an algorithm to allow an energy analysis of the building to be obtained while also considering the free thermic contributions coming from solar radiation, in addition to those emitted by the equipment present in the residential units (TV, fridge, air conditioners, lighting, etc.). After setting up the crowding schedule of the people inside the residential units, based on the obtained data, the technological characteristics of the building were defined, the control of the window openings for natural ventilation and the possible use of the air conditioning setting schedule according to the data came from the proposed questionnaire. The simulation involved a more detailed analysis inside the apartment where the survey was carried out, while the level of detail was reduced in the apartments in which the internal partitions, equipment, and habits of the occupants were unknown.
The indoor simulation apparatus, based on an algorithmic development, provided multiple outputs for the analysis of thermal comfort, among which it was chosen to be based on a PMV, ACM, and operating temperature analysis through the OpenStudio 3.3 software, from which it was possible to extract the actual temperatures of the environments (Figure 11).
The starting date for the simulative analysis of the apartment in the building within the Materdei district reflected the habits recorded within the questionnaire by providing schedules for 3 people, the free contribution of natural ventilation, the setting of a schedule for the opening of the windows and the air changes, as well as the operation of the air conditioning, in this case, n. 4 split with an outdoor refrigeration unit.
Similarly, the following starting data were provided for the simulative analysis of the apartment in the building within the Ponticelli district, providing a schedule for 3 people, the free contribution of natural ventilation, the setting of schedules for opening windows and air changes, as well as the operation of the air conditioning, in this case, n. 3 split with an outdoor refrigeration unit.
Once the simulation process was finished, data were extracted and compared with the monitoring data. The comparison was twofold: the outputs obtained from the simulations were compared both with the data recorded by the sensors and with the data recorded within the questionnaire administered to users to verify the correspondence between the simulations and the real data.
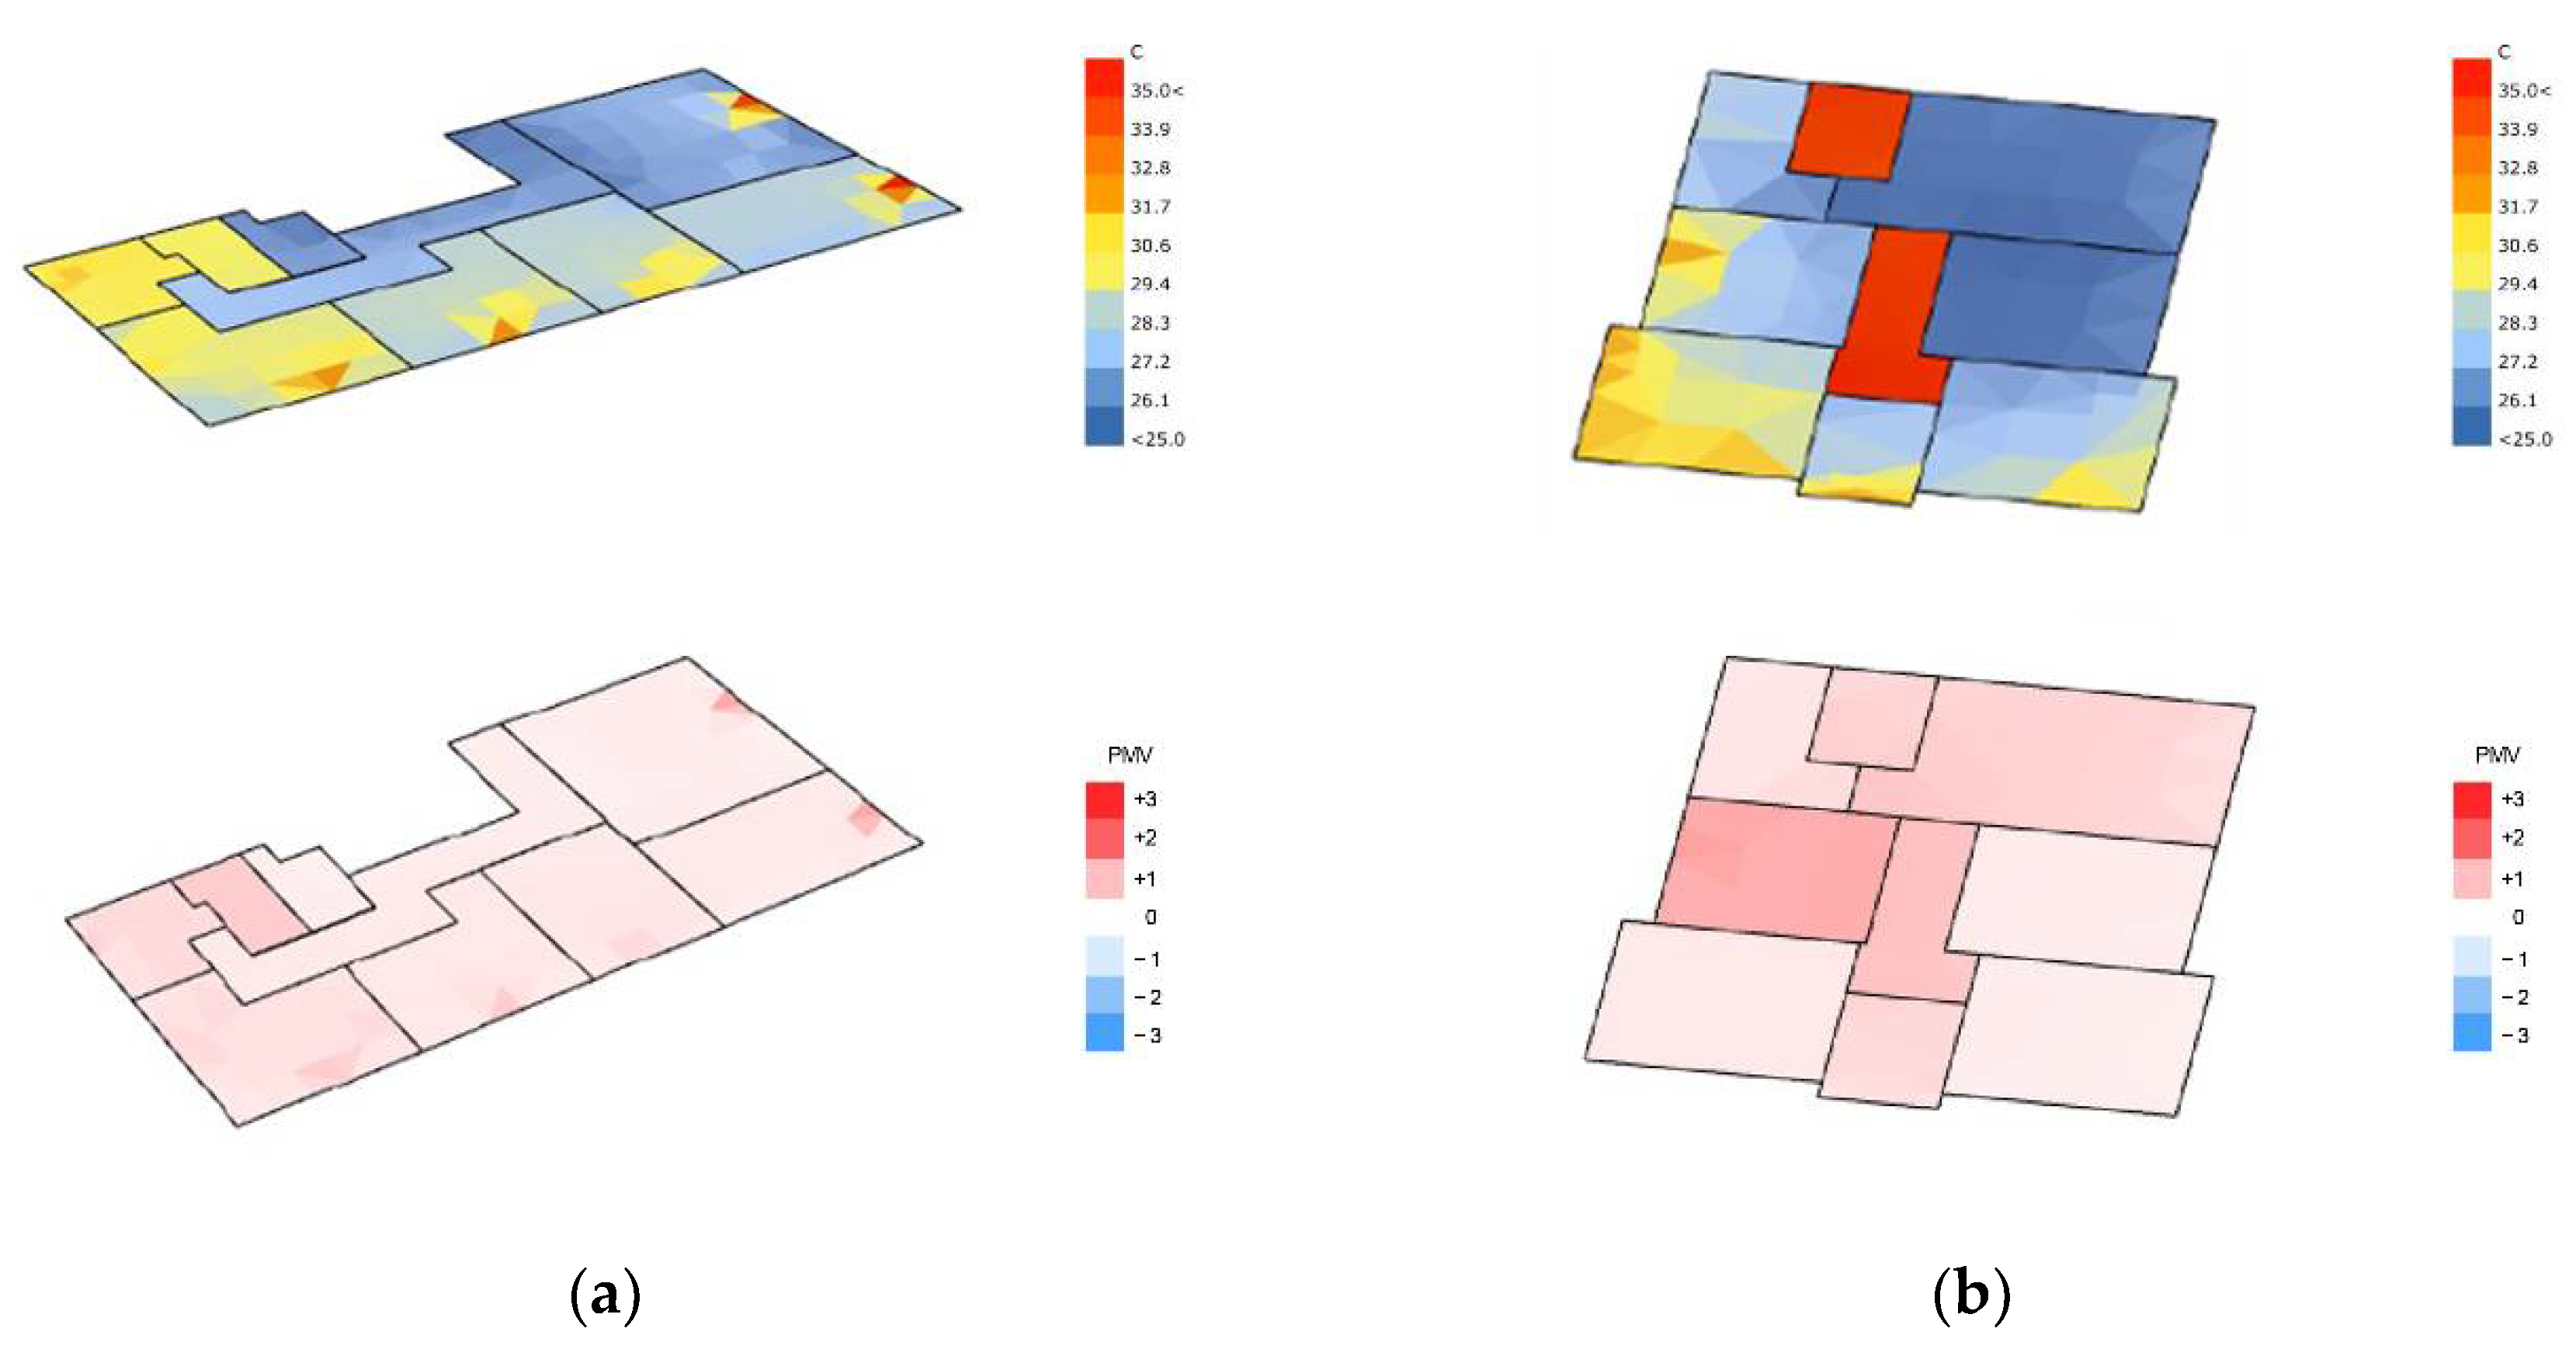
For the case of Materdei, the average temperatures recorded in the rooms were 23.7 °C, which, compared with the average temperatures recorded through the sensors of 25.0 °C, revealed a percentage difference of 5.2%. The PMV values, compared with the sensations of comfort recorded through the survey, returned an average comfort sensation of slightly warm, while the ACM returned a slightly altered temperature (Table 5).
For the case of Ponticelli, the simulated average internal temperatures were 33.9 °C which, compared with the average temperature recorded by the Raspberry, approx. 31.0 °C was kept within a gap of 9.35%, considered acceptable. The PMV values compared with the sensations of comfort recorded through the survey returned an average comfort sensation of warmth, while the ACM returned a slightly altered temperature (Table 6).
2.6. The Analysis of the Perception of Indoor and Outdoor Comfort
The comparison of data on the perception of comfort collected through the questionnaire addressed to users who have lived in the housing units on which the environmental monitoring was carried out aimed to detect any correspondence with the simulated data. The questionnaire, as already explained, was divided in such a way that each person, day by day, throughout the monitoring period and the four intervals of the day (morning, afternoon, evening, and night), declared the activity carried out, specified the clothing worn, and noted their thermal perception inside and outside the apartment.
For the case of Materdei, the score obtained from the questionnaire was an average of 1.67 for the indoor, a situation between the slightly warm and the warm, and 2.25 for the outdoor, decidedly warm. In Ponticelli, the condition of thermal comfort perceived according to what was reported by the questionnaire appeared to be on an average warm index, with the average values reaching 2.11 for the indoor and 2.29 for the outdoor conditions (Figure 12).
A comparison between the indoor PMV average values recorded by the questionnaire and the simulated ones is shown in Table 7.
The comparison of the average temperature values recorded for the entire monitoring period shows that the match is such as to fall within an acceptable deviation of 15% while also noting that the outdoor data obtained by the ENVI-met software were overestimated for the daytime data and the same underestimates for the night data. Similarly, the indoor simulation process tended to underestimate the night values.
Once the algorithm was verified, it was possible to proceed with the technological retrofit and urban redevelopment interventions through climate-adaptive strategies using categories of greening, de-paving, and cool materials interventions to guarantee an improvement in the outdoor wellness conditions, with benefits inside the buildings as well.
3. Results
Following the operations of the analysis, comparison, and then verification of the reliability of the algorithmic framework developed, an execution of similar simulation processes based on the design hypotheses that provided for the outdoor space a meta-design action of the redevelopment of open spaces through climate adaptive design strategies were carried out, and the technological and energy retrofit of the buildings was analysed. In addition, a further process of the simulation analysis was conducted to verify how much the redevelopment of open spaces impacted the energy behaviour and the perception of comfort within the environments of the buildings subjected to retrofit interventions.
3.1. The Climate-Adaptive Strategy for the Redevelopment of Open Space
The urban regeneration phase of the public space around the analysed building was carried out by a meta-design process. This phase would consider the application of climate adaptive solution categories of an intervention providing, for example, the insertion of new vegetation (trees, green surfaces, etc.), the de-paving of urban surfaces, and the use of cool materials for paved or asphalted surfaces. The application rates, the effectiveness of the individual solution, and the combination of design solutions are referred to in a previous study [35].
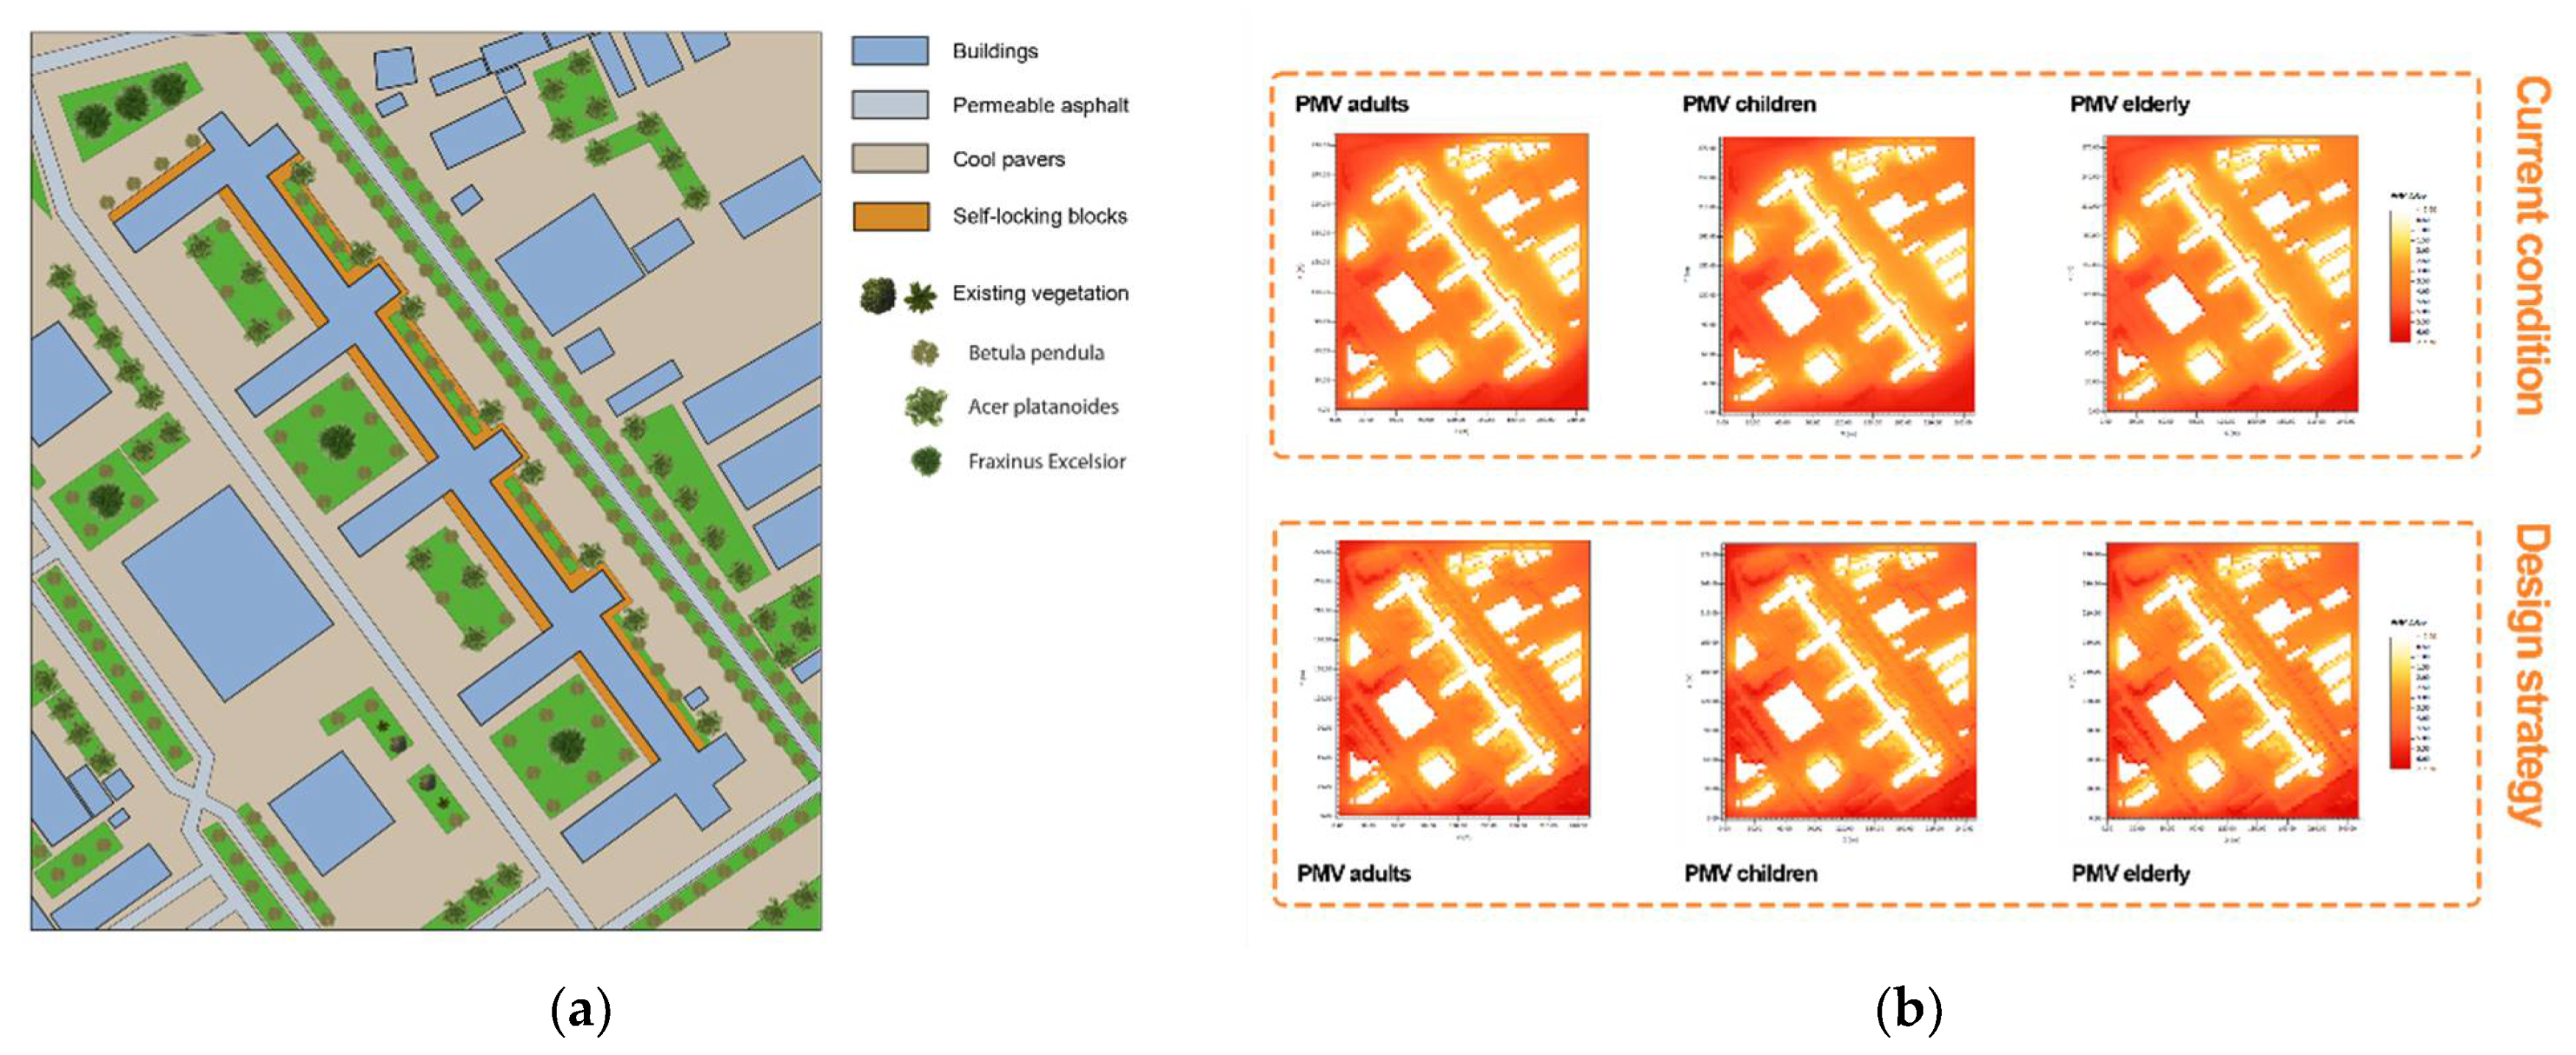
For the chosen area within the Materdei district, which has a degree of reception for climate-proof solutions that can be considered intermediate, it is planned to insert rows of trees along the sidewalks, but only on one side of the roadway, reducing the driveway surface, as well as the strengthening of the vegetation inside the courtyards and in the green spaces of the area. In addition, it is planned to replace the road surface with permeable asphalt with albedo values of 0.50, while for the sidewalks, cool concrete blocks with an albedo factor equal to 0.60 have been considered for use (Figure 13).
At the end of the simulation analysis process, the results relating to the average air temperature compared to those obtained from the simulation of the actual conditions are shown in Table 8.
The comparison of the PMV values between the simulations obtained downstream of the redevelopment actions and those of the actual condition are shown in Table 9.
From the comparison of the obtained results, it is clear that the average temperatures were reduced by 12.9%, while the values of PMV were reduced by an average of 28.6%, obtaining an average sensation of slight warmness (Figure 13).
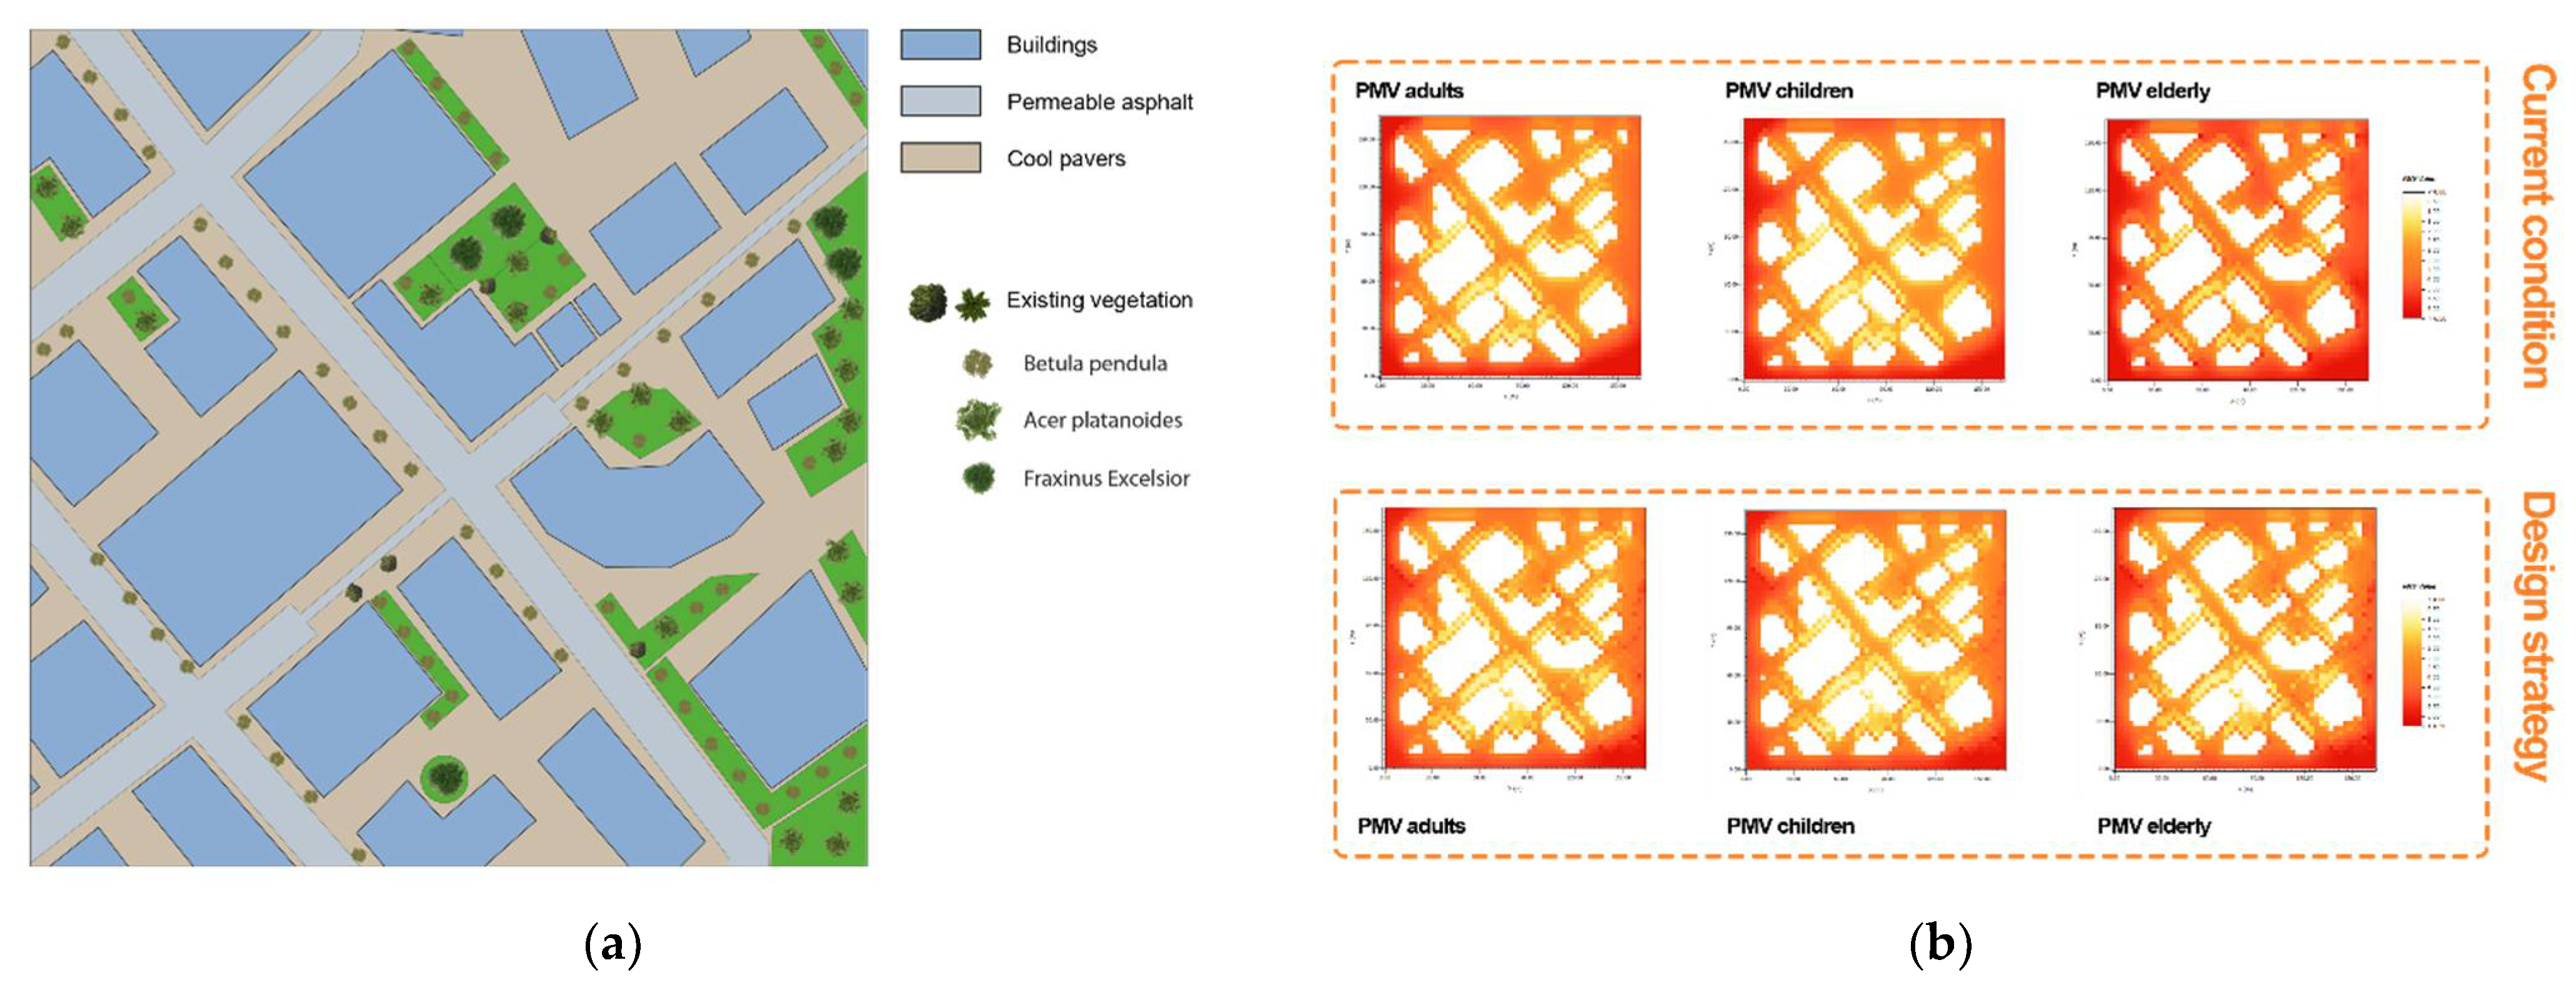
The study area in the Ponticelli district, as a newly formed urban fabric, is able to accommodate more transformations; therefore, it is planned to include climate-proof redevelopment strategies, providing the insertion of rows of trees along the sidewalks, inside the courtyards and near the buildings, as well as providing the insertion of lawn surfaces and a rain garden along the roadway. Other solutions include the replacement of asphalt along the roadways with permeable asphalt with albedo values of 0.50, as well as the provision of cool concrete blocks for walkways with an albedo of 0.60 (Figure 14).
From the results and the comparison with the actual conditions, it is clear that the values of the air temperatures obtained from the simulations that involve redevelopment interventions return an average reduction of 2.8%, with an average air temperature of 31.6 °C. Similarly, the external PMV values for adults, children, and the elderly tended to reduce by an average value of 12.3%, recording an average comfort sensation between slightly warm and warm (Figure 14).
3.2. The Performance Adaptation of the Building for the Improvement of Indoor Environmental Conditions
For the technological and energy retrofit of the building, to comply with the minimum requirements provided for by the national legislation in the Ministerial Decree of 26 June 2015, in both cases, it is planned to intervene on the entire vertical opaque envelope by affixing a thermal coat and providing the use of stone wool panels with a thermal conductivity value (λ) of 0.035. For the insulation of the roofs, a rigid stone wool panel is provided for the extrados, λ = 0.036, with the addition of a layer of clay and spans, λ = 0.09, and at the intrados, the insertion of sheets of fibreglass, λ = 0.038. For the transparent closures, wood and aluminium thermal break windows with λ = 1.70 have been provided for the Materdei building, while for the Ponticelli building, it is planned to replace it with PVC thermal break windows, λ = 1.30. For the exterior finish, a heat-insulating plaster is provided, λ = 0.086.
The calculations of the new transmittances of the opaque and transparent closures are summarized in Table 12.
Inserting the new characteristics of the enclosures within the algorithmic process, the simulation processes for the energy behaviour of the buildings are repeated, as well as that relating to the perception of indoor comfort, preserving the same settings of the starting condition.
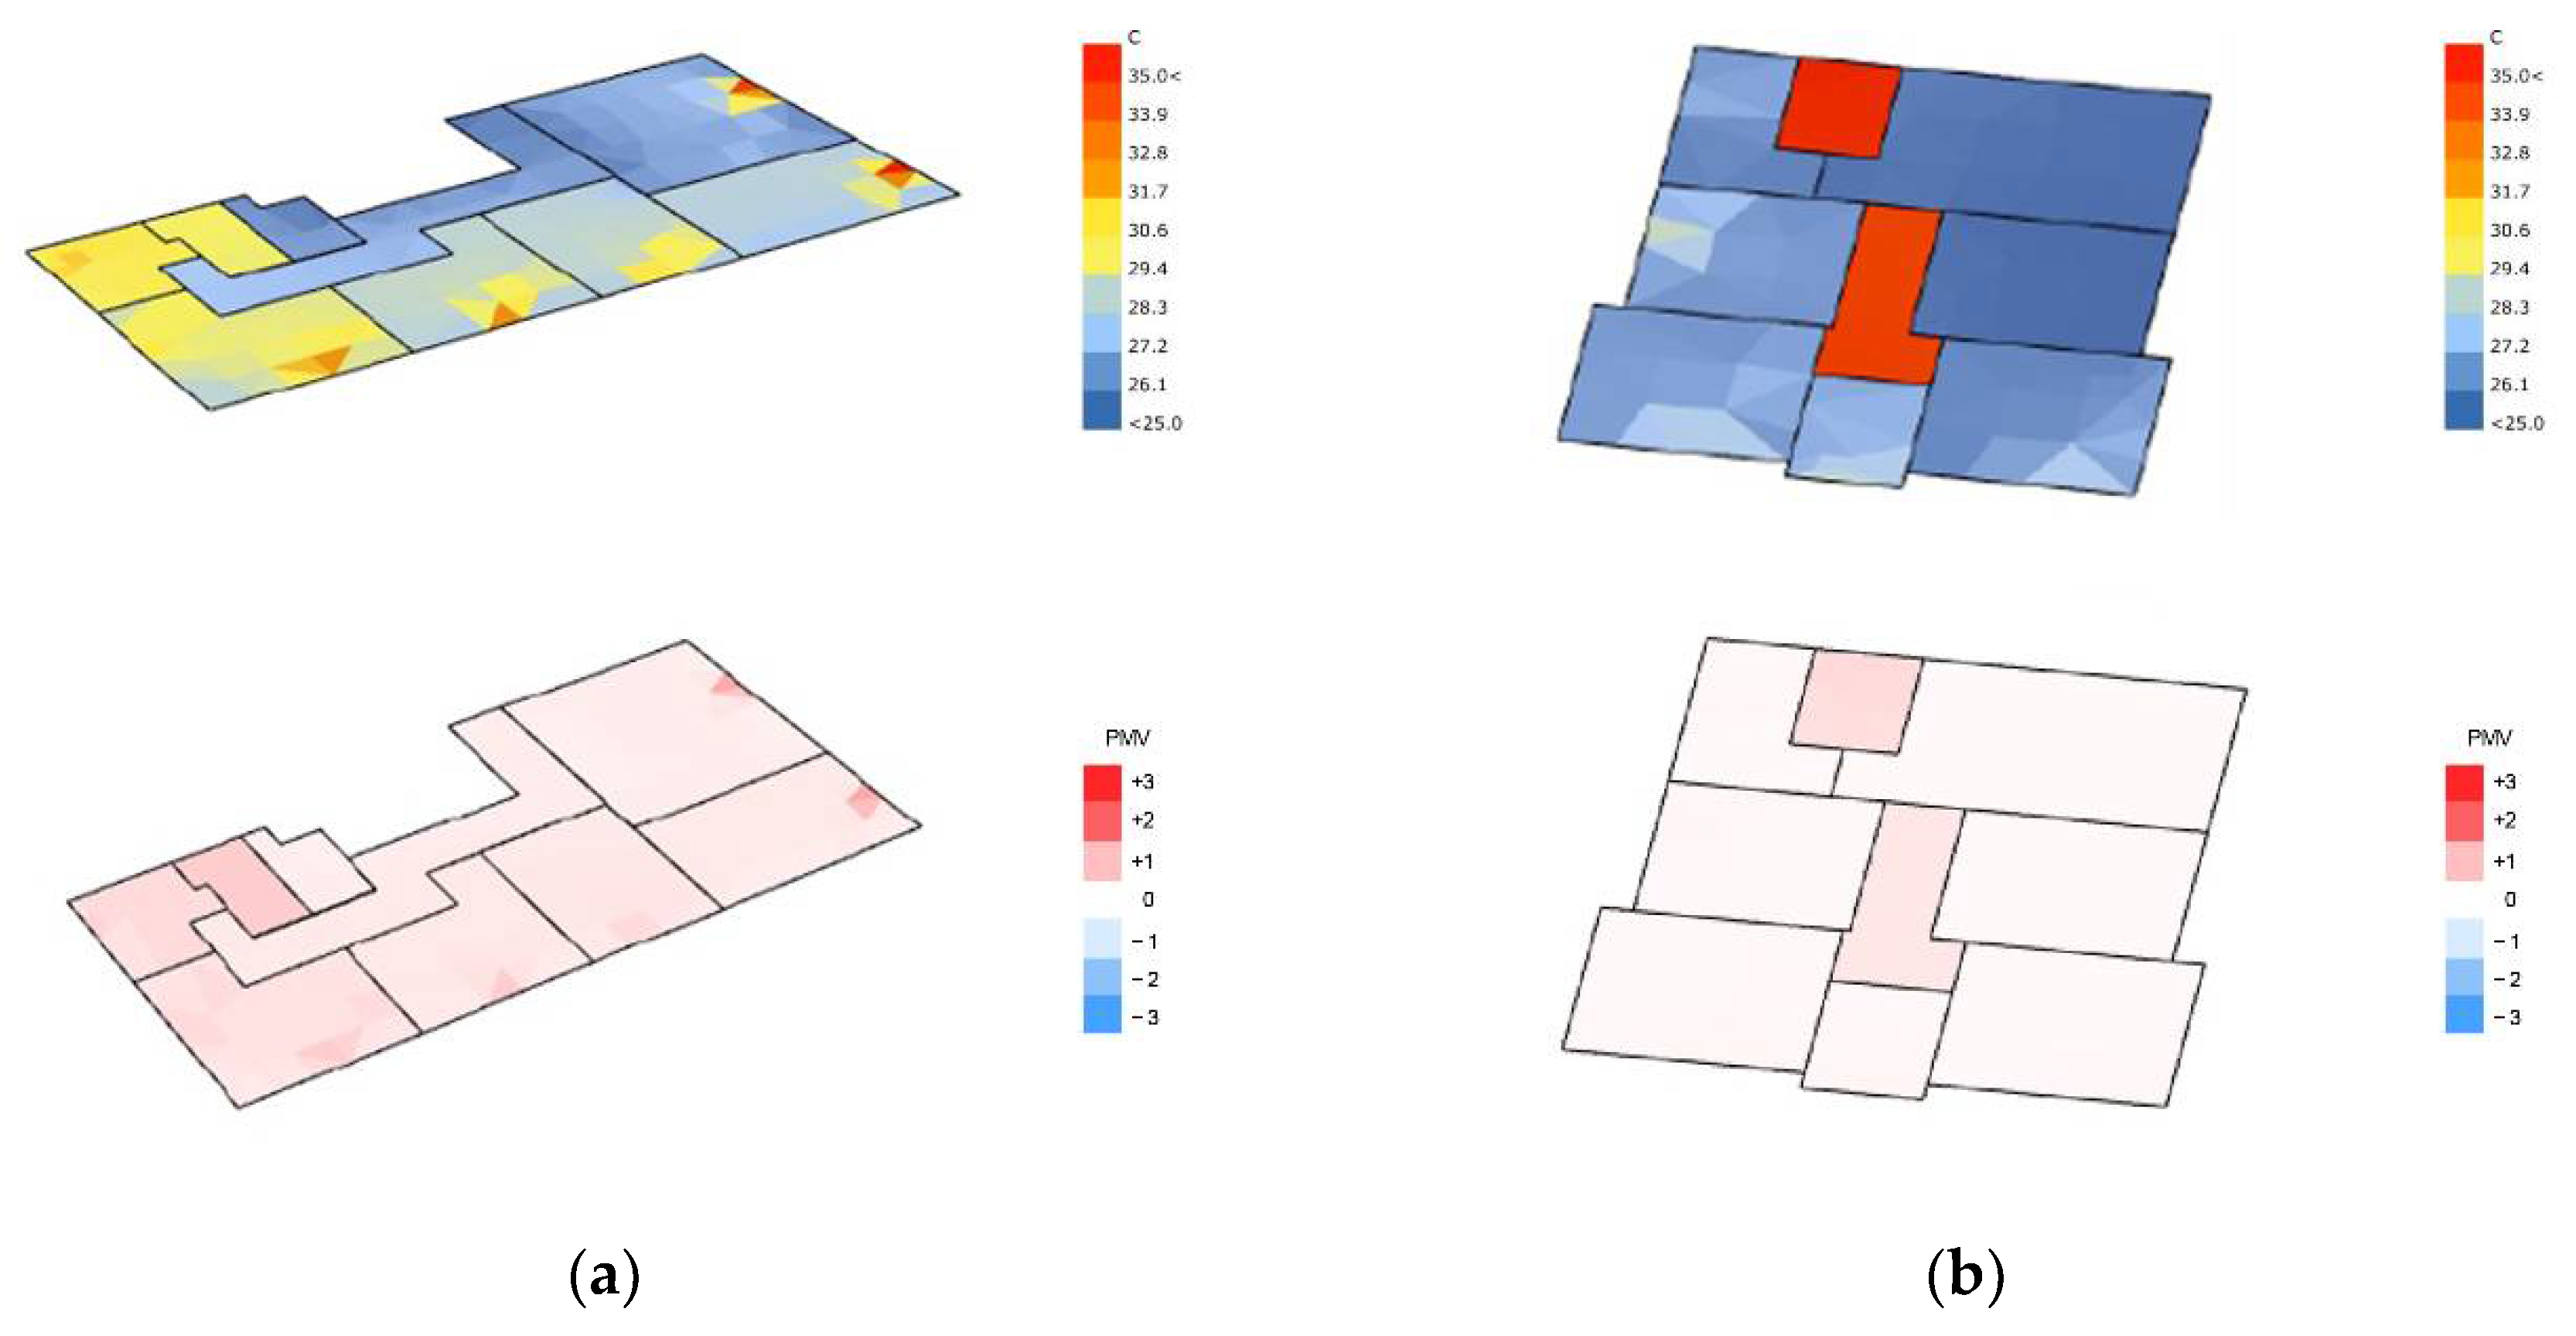
The analyses for the Materdei building show how the indoor temperature could be reduced after the application of the retrofit strategies, recording average internal temperatures at 21.7 °C, with an average reduction of 8.4%, and the sensation of comfort by the PMV was recorded between neutral and slightly warm with an average reduction of 31.4%. The ACM recorded the average temperature at 22.2 °C (Table 13 and Figure 15).
For the Ponticelli building under analysis, the results obtained indicate how both the average internal temperatures of 27.1 °C, with an average reduction of 20.0%, and the feeling of comfort in the PMV values that stand at 1.77, with an average reduction of 24.3%, define a decidedly improving condition. The ACM recorded the average temperature at 27.1 °C (Table 14 and Figure 15).
3.3. The Combination of Indoor and Outdoor Strategies
Finally, the aim was to verify how the buildings, once in their starting conditions and applying the retrofit actions, would react in the condition of the redevelopment of open spaces from the environmental data extracted from the simulation process in which the climate-proof actions were determined from the two redevelopment scenarios acted within the algorithm. In addition, for the indoor algorithm, it was deprived of the control of mechanical ventilation, leaving only natural ventilation to act.
By making the redevelopment actions of the open space act with the starting conditions, for the apartment in Materdei, the reduction in the indoor air temperature was −1.1 °C, while for the apartment in Ponticelli, it was −5.8 °C. For Materdei, the PMV values had a slightly warm condition, while the ACM was aligned with the air temperature. For Ponticelli, the PMV values recorded a condition of warm, while the ACM values, as for Materdei, aligned with the air temperature (Figure 16, Table 15 and Table 16).
Crossing the meta-design conditions of the climate adaptive design for the open space and the retrofit of buildings, considering the absence of controlled mechanical ventilation and only natural ventilation, in both cases, the average indoor temperatures tended to decrease compared to the starting condition (Figure 17).
For the Materdei apartment, the temperature was −2 °C, while for the Ponticelli apartment, it was −9.4 °C. For Materdei, the PMV values had a slightly warm condition, while the ACM aligned with the air temperature. For Ponticelli, the PMV values recorded a condition between slightly warm and warm, while the ACM values, as for Materdei, aligned with the air temperature (Table 15 and Table 16).
4. Discussion
The obtained results show how the algorithmic combination and data exchange between different tools within a single virtual environment allows for the optimisation of processes downstream with only parametric variations. The few steps within the entire process involving the construction of input data and the extraction of output data determined the phases of the methodological approach that was applied.
Since the study is intended to focus narrowly on the condition of rising summer temperatures and the phenomenon of heat waves, the data collected is deliberately partial and corresponds only to the monitoring period (24 July–2 11 August–15 August), when temperatures for the city of Naples are on average high or above average.
This limitation is dictated by the interest in a specific climatic and environmental condition, which for urban centres in the south of the Mediterranean area is decisive for the well-being conditions of users. The simulation conditions, and therefore the solutions adopted for both buildings and open spaces, may be limited only to the response of high temperatures, even if and, in particular, for the retrofit of buildings, as solutions adopted to meet the minimum legal requirements (Ministerial Decree 26 June 2015) and essential parameters for designing and containing a thermal dispersion, especially in winter.
A similar study on the compliance of the simulation tools with real conditions in the winter regime may be envisaged in the future to consider the methodological framework valid in all ambient conditions.
For the study’s focus on summer conditions, the obtained results show that in the two different morphological, thus environmental conditions, the difference in temperatures and the perception of well-being between the indoor and outdoor can vary significantly. Considering that the climatic-environmental conditions and those of the temperatures recorded outdoors do not differ greatly, and given also the consequential nature of the monitoring period and hence of the analysis, it is possible to attribute the different perceptions of comfort to the morphological differences between the buildings. Those of Materdei, at a medium density in the balance between a covered and uncovered surface, with a reduced percentage of external surfaces, favour the dissipation of surface temperatures through the action of the wind. The urban morphology in the district of Ponticelli is of a low density, where the presence of a greater percentage of horizontal external surfaces favours an increase in external temperatures [35,36,37]. Another factor that may determine indoor behaviour concerns the quality of the construction types of the building envelopes analysed, in which the Ponticelli reference building performed less.
A consideration of the differences between the indoor values of PMV and ACM obtained from the algorithmic simulation processes is necessary. It can be said that if the algorithm is correctly controlled by setting the parameters onto the mechanical conditioning of the temperatures, the PMV returns reliable results, particularly in the verification of real conditions in a digital environment. However, it can also return less reliable values for design analysis under ideal thermal conditions. Otherwise, it is the ACM that, in cases of the absolute control of the algorithm, can return slightly diverging values. Considering instead the case in which the algorithm does not have absolute thermal control, the PMV, even in the absence of mechanical conditioning, manages to return responsive values. In the same way, the ACM is also reliable in the absence of mechanical thermal conditioning but returns more discordant values than the PMV [38,39].
In summary, it is possible to say that both are not able to return a condition that perfectly corresponds to reality, so it is necessary to evaluate on a case-by-case basis which is the most appropriate simulation condition.
5. Conclusions
The methodological developed framework, based on algorithmic and data exchange processes within a single work environment, can guarantee the interoperability of information, manage to simulate indoor and outdoor environments responding to real conditions, and determine a favourable condition for the development of urban redevelopment interventions. Through the application of climate adaptive design intervention strategies, it is possible to quantify to what extent benefits can be achieved to in contrast of thermal stress and energy consumption caused by the effects of climate change, in particular, in response to rising temperatures and heat waves in the city [40,41,42].
The use of comfort benchmarks and indices, such as air temperature, but especially PMV and ACM, make it possible to measure both the performance deficiencies of the urban environment, understood as buildings and open spaces, and to quantify the benefit obtainable from the application of mitigation and adaptive design strategies in response to the negative effects of climate change.
The results obtained demonstrate both the real benefits to be gained from urban regeneration interventions and how the use of the different forms and uses of digital technologies [1,6,7,8,9,10] can feed the vision of sustainable development and climate-oriented cities based on a data-driven approach, in which data can serve as an interface between the desired objectives and the progress achieved and achievable [43], in which users and public administrations can interact with reality in a more informed and aware manner.
KETs, big data, simulations, analysis, and models of predictive scenarios, represent in their heterogeneity a set of tools useful for the construction of “new” work environments for environmental design, which shift their centre of gravity towards the governance of processes and the definition of the project and its specific solutions. This concept could be described as useful for the development of processes based on blockchain technologies, but which, on the contrary, develop and expand due to the variability and implementation of data flows and the advancement of knowledge.
Today, through tools capable of quantifying in a preventive way the effectiveness of transformation interventions and the comparison with real data, as well as with citizen’s feedback, through data processing between the material and immaterial, it is possible to configure and use data exchange and interoperability environments in which recursive processes allow the synthesis of the instances in the project with the most adequate performance achievable.
The developed framework, although still implementable with new features and adjustments, represents a starting point for the creation of open-source information databases, capable of containing different information and instances of urban areas to be redeveloped, design guidelines and technical information, proposing itself as a matrix of typological case studies for the application of environmental and climate requalification strategies.
Supplementary Materials
The following supporting information can be downloaded at: https://drive.google.com/file/d/1_FGQ-DSgxzeDwnqRqDE2mNdZJxJHIrz_/view?usp=sharing, Questionnaire S1: Questionnaire on the perception of indoor and outdoor comfort.
Funding
This research received no external funding.
Informed Consent Statement
Informed consent was obtained from all subjects involved in the study.
Conflicts of Interest
The authors declare no conflict of interest.
References
- Governo Italiano. Piano Nazionale di Ripresa e Resilienza; Governo Italiano: Rome, Italy, 2021. Available online: https://www.governo.it/sites/governo.it/files/PNRR.pdf (accessed on 1 October 2022).
- Giffinger, R.; Lü, H. The Smart City Perspective. A Necessary Change from Technical to Urban Innovation; Fondazione Giangiacomo Feltrinelli: Milan, Italy, 2015; Available online: https://fondazionefeltrinelli.it/app/uploads/2018/01/The-Smart-City-perspective.-Rudolf-Giffinger-e-Hui-Lu.pdf (accessed on 1 October 2022).
- Bibri, S.E. Data-driven smart sustainable cities of the future: An evidence synthesis approach to a comprehensive state-of-the-art literature review. Sustain. Futures 2021, 3, 100047. [Google Scholar] [CrossRef]
- Marrone, P.; Orsini, F.; Raimondi, A. Scenari e tecnologie a basso costo per la rigenerazione ambientale degli spazi tra le case. In Design in the Digital Age. Technology Nature Culture; Perriccioli, M., Rigillo, M., Russo Ermolli, S., Tucci, F., Eds.; Maggioli Editore: Milan, Italy, 2020; pp. 350–353. [Google Scholar]
- Carta, M. Augmented City. A Paradigm Shift; LISt Publisher: Trento, Italy, 2017. [Google Scholar]
- Project Array of Things. Available online: http://arrayofthings.github.io/ (accessed on 1 October 2022).
- Opengrid. Available online: http://opengrid.io/ (accessed on 1 October 2022).
- Data—City of Chicago. Available online: https://data.cityofchicago.org/ (accessed on 1 October 2022).
- City Scanner—Sensible City Lab MIT. Available online: http://senseable.mit.edu/cityscanner/ (accessed on 1 October 2022).
- MIT Sensible City Lab. Available online: https://senseable.mit.edu/ (accessed on 1 October 2022).
- Chokhachian, A.; Lau, K.K.-L.; Perini, K.; Auer, T. Sensing transient outdoor comfort: A georeferenced method to monitor and map microclimate. J. Build. Eng. 2018, 20, 94–104. [Google Scholar] [CrossRef]
- Chatzidimitriou, A.; Kanouras, S.; Topli, L.; Bruse, M. Evaluation of a sustainable urban redevelopment project in terms of microclimate improvement. In Proceedings of the PLEA 2017, Design to Thrive, Edinburgh, UK, 3–5 July 2017. [Google Scholar]
- USE—Urban Sustainability Exchange. Bioclimatic Upgrade of Public Spaces. Thessaloniki, Greece; USE: Berlin, Germany, 2017. [Google Scholar]
- Oke, T.R. The Energetic Basis of the Urban Heat Island. Q. J. R. Meteorol. Soc. 1982, 108, 1–24. [Google Scholar] [CrossRef]
- Watson, I.; Johnson, G. Graphical estimation of sky view-factors in urban environments. J. Climatol. 1987, 7, 193–197. [Google Scholar] [CrossRef]
- UTCI Universal Thermal Climate Index Documents. Available online: http://www.utci.org/utci_doku.php (accessed on 1 October 2022).
- Mayer, H.; Höppe, P. Thermal comfort of man in different urban environments. Theor. Appl. Climatol. 1987, 38, 43–49. [Google Scholar] [CrossRef]
- Höppe, P. The physiological equivalent temperature—A universal index for the biometeorological assessment of the thermal environment. Int. J. Biometeorol. 1999, 43, 71–75. [Google Scholar] [CrossRef]
- Matzarakisn, A.; Mayer, H.; Iziomon, M. Applications of a universal thermal index: Physiological equivalent temperature. Int. J. Biometeorol. 1999, 43, 76–84. [Google Scholar] [CrossRef]
- Grasshopper, Algorithmic Modeling for Rhino. Available online: https://www.grasshopper3d.com/ (accessed on 1 October 2022).
- Fanger, P.O. Thermal Comfort—Analysis and Application in Environmental Engineering; McGraw-Hill Book Company: New York, NY, USA, 1972. [Google Scholar]
- UNI EN ISO 7730:2006; Ergonomia Degli Ambienti Termici—Determinazione Analitica e Interpretazione del Benessere Termico Mediante il Calcolo degli Indici PMV e PPD e dei Criteri di Benessere Termico Locale. UNI: Milano, Italy, 2006.
- ANSI/ASCHRAE Standard 55; Thermal Environmental Conditions for Human Occupancy. ASHRAE: Peachtree Corners, GA, USA, 2020.
- Honjo, T. Thermal Comfort in Outdoor Environment. Glob. Environ. Res. 2009, 13, 43–47. [Google Scholar]
- Cocci Grifoni, R.; Passerini, G.; Pierantozzi, M. Assessment of outdoor thermal comfort and its relation to urban geometry. WIT Trans. Ecol. Environ. 2013, 173, 3–14. [Google Scholar] [CrossRef] [Green Version]
- Zhaosong, F.; Xiwen, F.; Zhang, L. Investigation of PMV Model for Evaluation of the Outdoor Thermal Comfort. Procedia Eng. 2017, 205, 2457–2462. [Google Scholar]
- Gismo. Available online: https://github.com/stgeorges/gismo (accessed on 1 October 2022).
- Dragonfly Legacy. Available online: https://github.com/ladybug-tools/dragonfly-legacy (accessed on 1 October 2022).
- ENVI-Met. Available online: https://www.envi-met.com/ (accessed on 1 October 2022).
- Ladybug Tools. Available online: https://www.ladybug.tools/ (accessed on 1 October 2022).
- Radiance. Available online: https://www.radiance-online.org/ (accessed on 1 October 2022).
- Daysim. Available online: http://daysim.ning.com/ (accessed on 1 October 2022).
- EnergyPlus. Available online: https://energyplus.net/ (accessed on 1 October 2022).
- OpenStudio. Available online: https://openstudio.net/ (accessed on 1 October 2022).
- Bassolino, E.; D’Ambrosio, V.; Sgobbo, A. Data Exchange Processes for the Definition of Climate-Proof Design Strategies for the Adaptation to Heatwaves in the Urban Open Spaces of Dense Italian Cities. Sustainability 2021, 13, 5694. [Google Scholar] [CrossRef]
- Martin, L.; March, L. Urban Spaces and Structures; Cambridge University Press: Cambridge, UK, 1972. [Google Scholar]
- Ratti, C.; Raydan, D.; Steemers, K. Building form and environmental performance: Archetypes, analysis and an arid climate. Energy Build. 2003, 35, 49–59. Available online: http://senseable.mit.edu/papers/pdf/20030115_Ratti_etal_BuildingForm_EnergyBuildings.pdf (accessed on 1 October 2022). [CrossRef]
- de Deara, R.J.; Brager, G.S. Thermal comfort in naturally ventilated buildings: Revisions to ASHRAE Standard 55. Energy Build. 2002, 34, 549–561. [Google Scholar] [CrossRef] [Green Version]
- Adaptive Comfort Model—Center for the Built Environment. Available online: https://cbe.berkeley.edu/research/adaptive-comfort-model/ (accessed on 1 October 2022).
- Zuo, J.; Pullen, S.; Palmer, J.; Bennetts, H.; Chileshe, N.; Ma, T. Impacts of heat waves and corresponding measures: A review. J. Clean. Prod. 2015, 92, 1–12. [Google Scholar] [CrossRef]
- IPCC. Climate Change 2014—Synthesis Report. 2015. Available online: https://www.ipcc.ch/site/assets/uploads/2018/05/SYR_AR5_FINAL_full_wcover.pdf (accessed on 1 October 2022).
- IPCC. Global Warming of 1.5 °C—Summary for Policymakers. 2018. Available online: https://www.ipcc.ch/site/assets/uploads/sites/2/2019/05/SR15_SPM_version_stand_alone_HR.pdf (accessed on 1 October 2022).
- Ratti, C. How the Data Revolution Will Help the World Fight Climate Change. foreignpolicy.com. 2021. Available online: https://foreignpolicy.com/2021/10/20/climate-change-cities-big-data-artificial-intelligence/?utm_campaign=clipping_institucional_dia_a_dia&utm_medium=email&utm_source=RD+Station (accessed on 1 October 2022).
Figure 1.
The developed methodological framework.

Figure 2.
Territorial framing of the experimentation areas in the city of Naples.

Figure 3.
Identification of the Materdei district and the area and building of interest.

Figure 4.
Identification of the Ponticelli district and the area and building of interest.

Figure 5.
Indoor and outdoor Ambiental monitoring equipment: (a) Raspberry 4 Model B single board computer; (b) Pimoroni Enviro sensor board; (c) Pimoroni Enviro+ sensor board.
Figure 5.
Indoor and outdoor Ambiental monitoring equipment: (a) Raspberry 4 Model B single board computer; (b) Pimoroni Enviro sensor board; (c) Pimoroni Enviro+ sensor board.

Figure 6.
The sensors installed at the Materdei building: (a) Outdoor installation; (b) Indoor installation.
Figure 6.
The sensors installed at the Materdei building: (a) Outdoor installation; (b) Indoor installation.

Figure 7.
The sensors installed at the Ponticelli building: (a) Outdoor installation; (b) Indoor installation.
Figure 7.
The sensors installed at the Ponticelli building: (a) Outdoor installation; (b) Indoor installation.

Figure 8.
The simulation algorithm for outdoor environmental analysis.

Figure 9.
The output of air temperatures within the Materdei area, at heights 0.00 and +4.50.

Figure 10.
The output of air temperatures within the Ponticelli area, at heights 0.00 and +4.50.

Figure 11.
The simulation algorithm for indoor environmental analysis.

Figure 12.
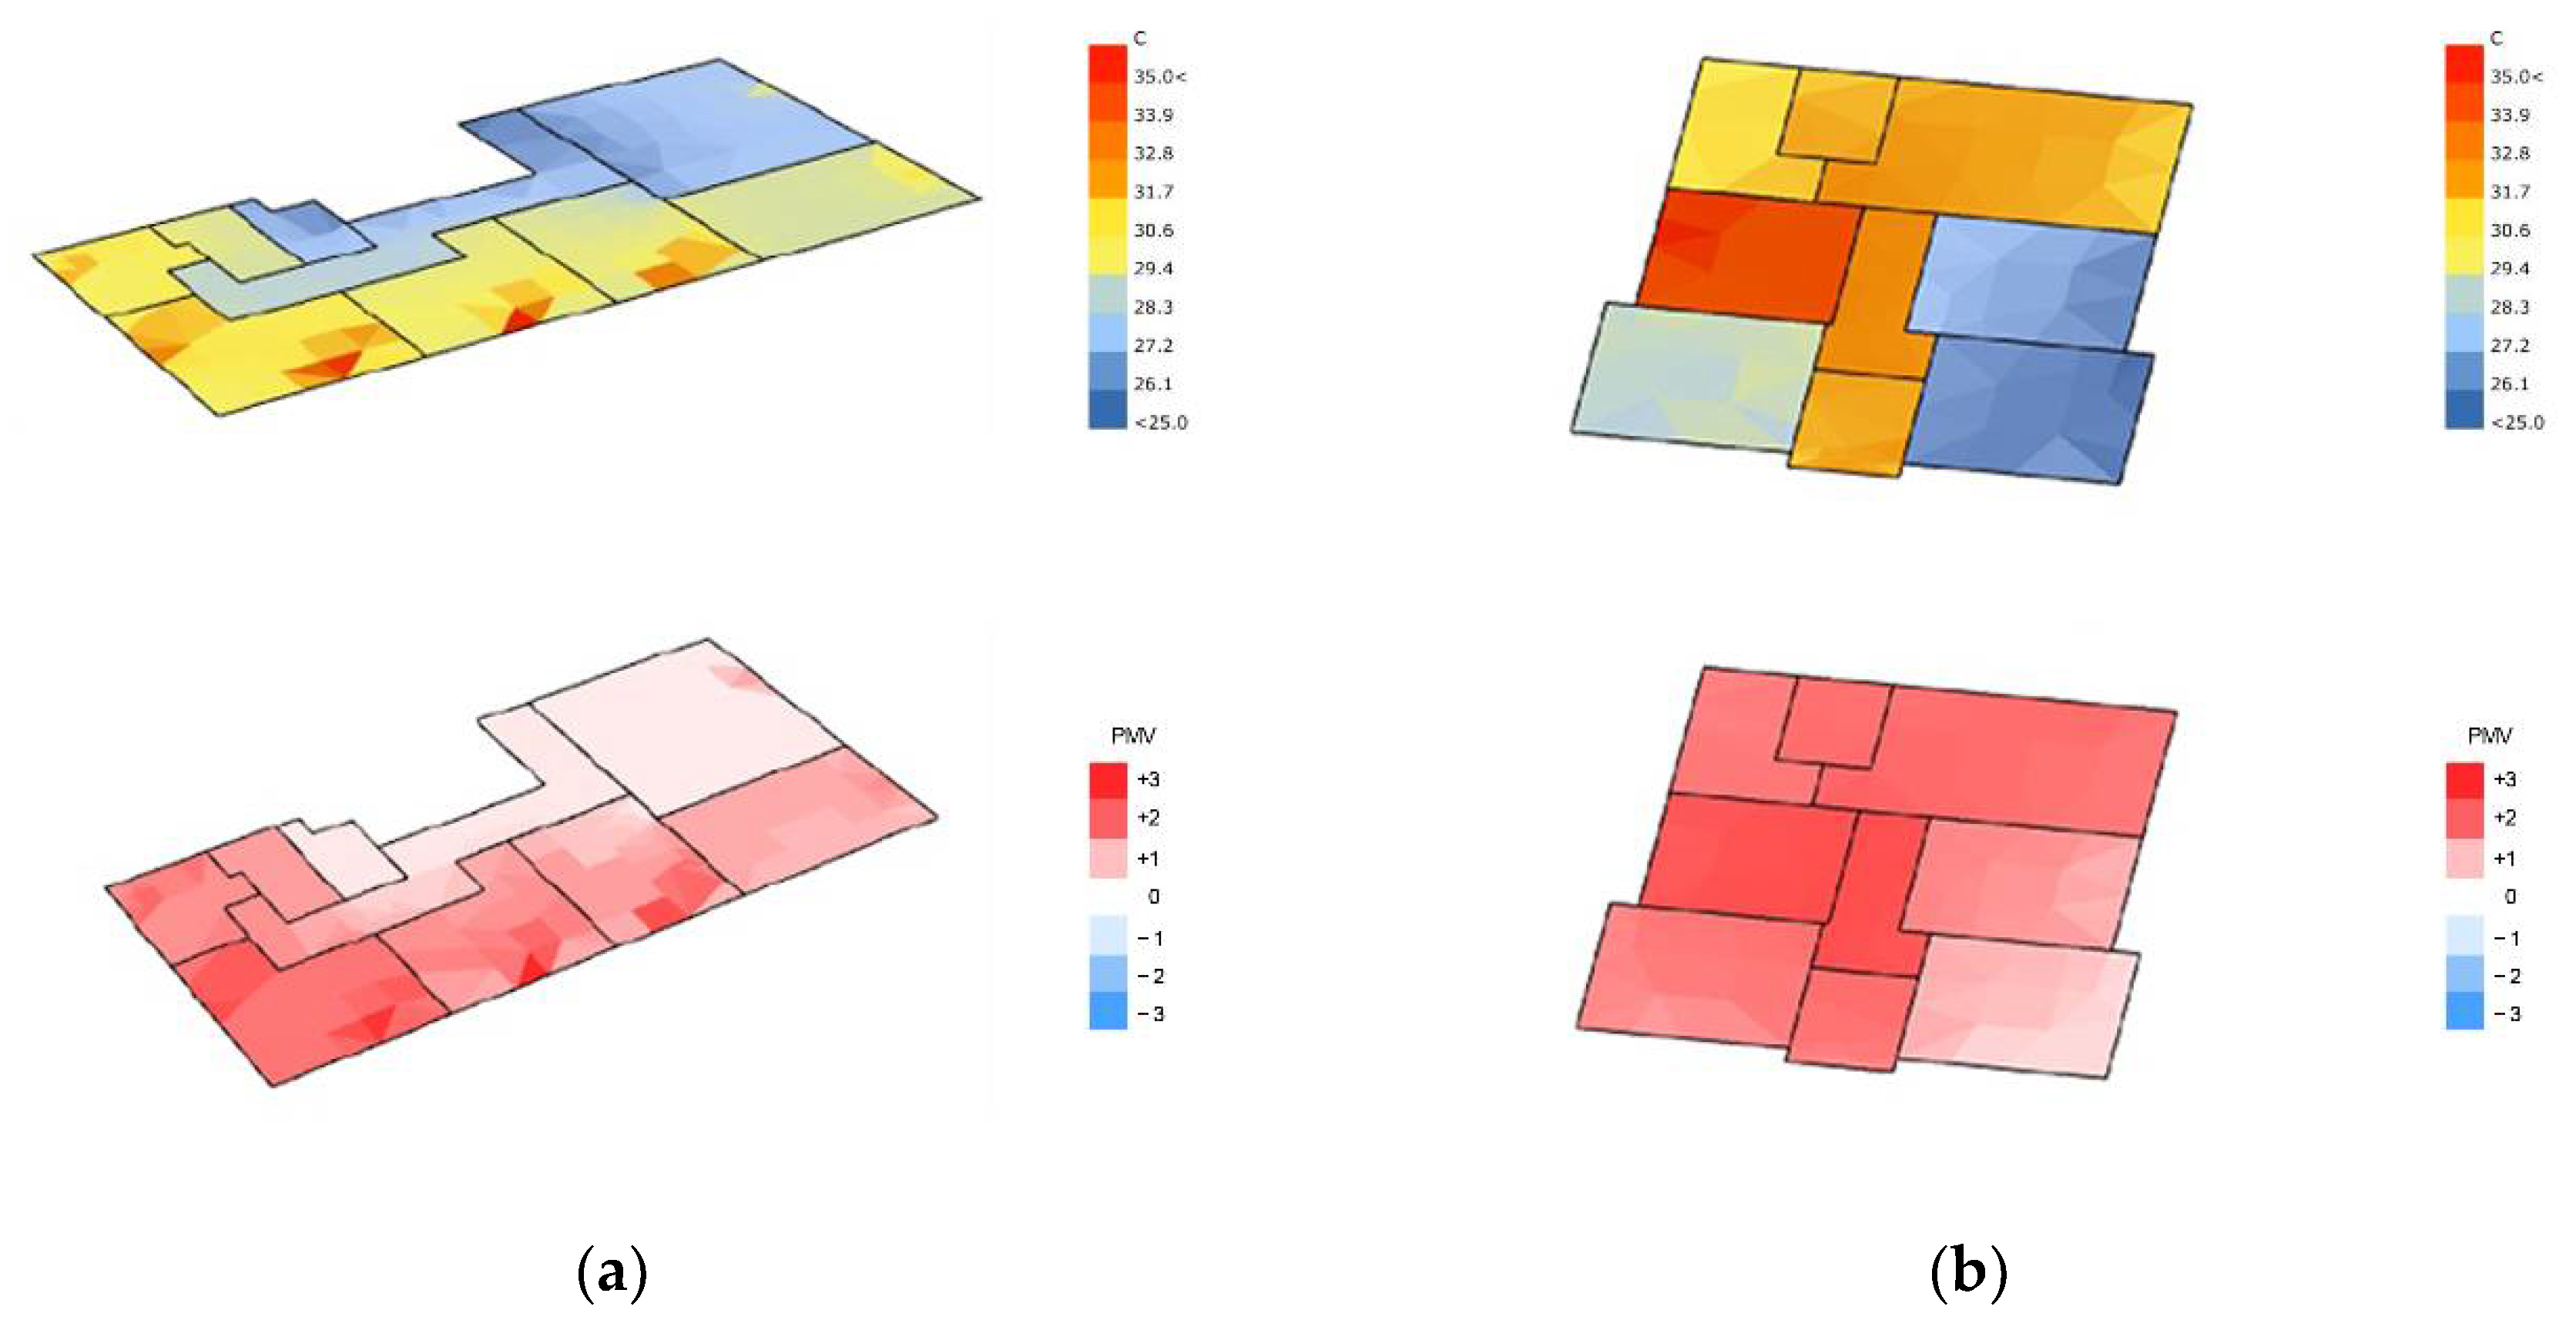
The actual indoor output of air temperatures and PMV: (a) The simulated flat for the Materdei building; (b) The simulated flat for the Ponticelli building.
Figure 12.
The actual indoor output of air temperatures and PMV: (a) The simulated flat for the Materdei building; (b) The simulated flat for the Ponticelli building.

Figure 13.
Outdoor redevelopment of the Materdei area with climate-proof technical solutions: (a) Meta-design of the climate adaptive redevelopment interventions; (b) Comparison of the PMV analyses for the three categories of users in the current meta-design scenario.
Figure 13.
Outdoor redevelopment of the Materdei area with climate-proof technical solutions: (a) Meta-design of the climate adaptive redevelopment interventions; (b) Comparison of the PMV analyses for the three categories of users in the current meta-design scenario.

Figure 14.
Outdoor redevelopment of the Ponticelli area with climate-proof technical solutions: (a) Meta-design of the climate adaptive redevelopment interventions; (b) Comparison of the PMV analyses for the three categories of users in the current meta-design scenario.
Figure 14.
Outdoor redevelopment of the Ponticelli area with climate-proof technical solutions: (a) Meta-design of the climate adaptive redevelopment interventions; (b) Comparison of the PMV analyses for the three categories of users in the current meta-design scenario.

Figure 15.
The indoor output of air temperatures and PMV as a result of retrofitting actions: (a) The simulated flat for the Materdei building; (b) The simulated flat for the Ponticelli building.
Figure 15.
The indoor output of air temperatures and PMV as a result of retrofitting actions: (a) The simulated flat for the Materdei building; (b) The simulated flat for the Ponticelli building.

Figure 16.
The indoor output of air temperatures and PMV considering only outdoor climate adaptive redevelopment: (a) The simulated flat for the Materdei building; (b) The simulated flat for the Ponticelli building.
Figure 16.
The indoor output of air temperatures and PMV considering only outdoor climate adaptive redevelopment: (a) The simulated flat for the Materdei building; (b) The simulated flat for the Ponticelli building.

Figure 17.
The indoor output of air temperatures and PMV considering building retrofit and outdoor climate adaptive redevelopment: (a) The simulated flat for the Materdei building; (b) The simulated flat for the Ponticelli building.
Figure 17.
The indoor output of air temperatures and PMV considering building retrofit and outdoor climate adaptive redevelopment: (a) The simulated flat for the Materdei building; (b) The simulated flat for the Ponticelli building.


Table 1.
The thermal transmittances of the parts of the building envelope for the two involved buildings.
Table 1.
The thermal transmittances of the parts of the building envelope for the two involved buildings.
| Parts of the Building | Materdei Reference Building | Ponticelli Reference Building | Minimum Performance Required by Law—C Zone (DM 26 June 2015.) |
|---|---|---|---|
| Vertical opaque closure to the outside | 2.42 W/m2 k | 3.34 W/m2 k | ≤0.36 W/m2 k |
| Horizontal opaque closure to the outside | 3.21 W/m2 k | 2.11 W/m2 k | ≤0.32 W/m2 k |
| Horizontal opaque closure to the ground | 4.30 W/m2 k | 1.99 W/m2 k | ≤0.32 W/m2 k |
| Transparent closures | 3.35 W/m2 k | 6.65 W/m2 k | ≤2.00 W/m2 k |
Table 2.
Types of surface materials in the open spaces of the two reference areas.
| Outdoor Surface | Materdei Reference | Ponticelli Reference Area |
|---|---|---|
| Roadway | Asphalt | Asphalt |
| Sidewalk | Asphalt | Concrete blocks |
| Internal courtyards | - | Terracotta |
| Percentage of the covered area by trees * | ≈0.2% | ≈0.5% |
| Percentage of lawn surfaces * | ≈3% | ≈12% |
* The total area including buildings.
Table 3.
Comparison of PMV data for the Materdei area extracted from the questionnaire and simulations for interviewees and simulated persons.
Table 3.
Comparison of PMV data for the Materdei area extracted from the questionnaire and simulations for interviewees and simulated persons.
| Characteristics of Individuals | Collection Data Type | PMV Average Value | PMV Average Value |
|---|---|---|---|
| G: male; A: 60; C: 0.6 * | Survey | 1.22 | 1.62 |
| G: female; A: 64; C: 0.5 * | Survey | 1.56 | |
| G: female; A: 30; C: 0.4 * | Survey | 2.08 | |
| G: male; A: 35; C: 0.5 * | Simulation | 1.13/1.02 ** | 1.49/1.43 ** |
| G: male; A: 8; C: 0.4 * | Simulation | 1.76/1.68 ** | |
| G: male; A: 65; C: 0.7 * | Simulation | 1.49/1.49 ** |
* G: gender; A: age; C: average clothing factor. ** Value at 4.5 m height.
Table 4.
Comparison of PMV data for the Ponticelli area extracted from the questionnaire and simulations for interviewees and simulated persons.
Table 4.
Comparison of PMV data for the Ponticelli area extracted from the questionnaire and simulations for interviewees and simulated persons.
| Characteristics of Individuals | Collection Data Type | PMV Average Value | PMV Average Value |
|---|---|---|---|
| G: male; A: 60; C: 0.6 * | Survey | 2.67 | 2.29 |
| G: female; A: 64; C: 0.5 * | Survey | 1.90 | |
| G: female; A: 30; C: 0.4 * | Survey | 2.30 | |
| G: male; A: 35; C: 0.5 * | Simulation | 2.09/2.07 ** | 2.20/2.18 ** |
| G: male; A: 8; C: 0.4 * | Simulation | 2.47/2.45 ** | |
| G: male; A: 65; C: 0.7 * | Simulation | 2.05/2.03 ** |
* G: gender; A: age; C: average clothing factor. ** Value at 4.5 m height.
Table 5.
Indoor environmental analysis data for the Materdei building.
| Simulation Interval | Air Temperature Average Values | PMV Average Values | ACM Temperature Average Values |
|---|---|---|---|
| 00:00–06:00 | 23.4 °C | 1.48 | 23.6 °C |
| 06:00–12:00 | 23.7 °C | 1.55 | 24.5 °C |
| 12:00–18:00 | 24.2 °C | 1.61 | 25.8 °C |
| 18:00–24:00 | 23.6 °C | 1.53 | 25.1 °C |
| 06:00–18:00 | 23.9 °C | 1.58 | 25.1 °C |
| Run period | 23.7 °C | 1.55 | 24.7 °C |
Table 6.
Indoor environmental analysis data for the Ponticelli building.
| Simulation Interval | Air Temperature Average Values | PMV Average Values | ACM Temperature Average Values |
|---|---|---|---|
| 00:00–06:00 | 33.5 °C | 2.28 | 34.8 °C |
| 06:00–12:00 | 34.0 °C | 2.35 | 35.2 °C |
| 12:00–18:00 | 34.1 °C | 2.37 | 35.4 °C |
| 18:00–24:00 | 34.2 °C | 2.40 | 35.6 °C |
| 06:00–18:00 | 34.1 °C | 2.37 | 35.4 °C |
| Run period | 33.9 °C | 2.33 | 35.3 °C |
Table 7.
Comparison of indoor data extracted from the questionnaire and simulations.
| Characteristics of Individuals | Reference Case Study | PMV Average Values of the Reference Period | PMV Average Values | PMV Simulated Average Values |
|---|---|---|---|---|
| G: male; A: 60; C: 0.6 * | Materdei | 0.80 | 1.67 | 1.55 |
| G: female; A: 64; C: 0.5 * | Materdei | 1.96 | ||
| G: female; A: 30; C: 0.4 * | Materdei | 2.25 | ||
| G: male; A: 60; C: 0.6 * | Ponticelli | 2.40 | 2.11 | 2.33 |
| G: female; A: 64; C: 0.5 * | Ponticelli | 2.13 | ||
| G: female; A: 30; C: 0.4 * | Ponticelli | 1.80 |
* G: gender; A: age; C: average clothing factor.
Table 8.
Comparison of outdoor air temperature data for the Materdei area between the starting and redeveloped conditions.
Table 8.
Comparison of outdoor air temperature data for the Materdei area between the starting and redeveloped conditions.
| Simulation Data Height | Actual Conditions Average Air Temperature Values | Redevelopment Average Air Temperature Values | Percentage Difference |
|---|---|---|---|
| 0.00 m | 30.6 °C | 29.9 °C | −2.3% |
| 4.50 m | 30.5 °C | 29.8 °C | −2.3% |
Table 9.
Comparison of outdoor PMV data for the Materdei area between the starting and redeveloped conditions.
Table 9.
Comparison of outdoor PMV data for the Materdei area between the starting and redeveloped conditions.
| Characteristics of Individuals | Simulation Data Height | Actual Conditions Average PMV Values | Redevelopment Average PMV Values | Percentage Difference |
|---|---|---|---|---|
| G: male; A: 35; C: 0.5 | 0.00 m | 1.13 | 0.90 | −20.4% |
| 4.50 m | 1.02 | 0.83 | −18.6% | |
| G: male; A: 8; C: 0.4 | 0.00 m | 1.76 | 1.59 | −9.7% |
| 4.50 m | 1.68 | 1.53 | −8.9% | |
| G: male; A: 65; C: 0.7 | 0.00 m | 1.58 | 0.70 | −55.7% |
| 4.50 m | 1.49 | 0.62 | −58.4% |
Table 10.
Comparison of outdoor air temperature data for the Ponticelli area between the starting and redeveloped conditions.
Table 10.
Comparison of outdoor air temperature data for the Ponticelli area between the starting and redeveloped conditions.
| Simulation Data Height | Actual Conditions Average Air Temperature Values | Redevelopment Average Air Temperature Values | Percentage Difference |
|---|---|---|---|
| 0.00 m | 32.5 °C | 31.6 °C | −2.8% |
| 4.50 m | 32.5 °C | 31.6 °C | −2.8% |
Table 11.
Comparison of outdoor PMV data for the Ponticelli area between the starting and redeveloped conditions.
Table 11.
Comparison of outdoor PMV data for the Ponticelli area between the starting and redeveloped conditions.
| Characteristics of Individuals | Simulation Data Height | Actual Conditions Average PMV Values | Redevelopment Average PMV Values | Percentage Difference |
|---|---|---|---|---|
| G: male; A: 35; C: 0.5 | 0.00 m | 2.09 | 1.81 | −13.4% |
| 4.50 m | 2.07 | 1.81 | −12.6% | |
| G: male; A: 8; C: 0.4 | 0.00 m | 2.47 | 2.26 | −8.5% |
| 4.50 m | 2.45 | 2.26 | −7.8% | |
| G: male; A: 65; C: 0.7 | 0.00 m | 2.05 | 1.72 | −16.1% |
| 4.50 m | 2.03 | 1.72 | −15.3% |
Table 12.
The thermal transmittances of the parts of the building envelope for the two involved buildings as a result of retrofitting actions.
Table 12.
The thermal transmittances of the parts of the building envelope for the two involved buildings as a result of retrofitting actions.
| Parts of the Building | Materdei Reference Building | Ponticelli Reference Building | Minimum Performance Required by Law—C Zone (DM 26 June 2015) |
|---|---|---|---|
| Vertical opaque closure to the outside | 0.30 W/m2 k | 0.32 W/m2 k | ≤0.36 W/m2 k |
| Horizontal opaque closure to the outside | 0.31 W/m2 k | 0.32 W/m2 k | ≤0.32 W/m2 k |
| Horizontal opaque closure to the ground | 0.30 W/m2 k | 0.28 W/m2 k | ≤0.32 W/m2 k |
| Transparent closures | 1.72 W/m2 k | 1.36 W/m2 k | ≤2.00 W/m2 k |
Table 13.
Indoor environmental analysis data for the Materdei building as a result of retrofitting actions.
Table 13.
Indoor environmental analysis data for the Materdei building as a result of retrofitting actions.
| Simulation Interval | Air Temperature Average Values | PMV Average Values | ACM Temperature Average Values |
|---|---|---|---|
| 00:00–06:00 | 21.3 °C | 1.02 | 21.0 °C |
| 06:00–12:00 | 21.7 °C | 1.17 | 22.1 °C |
| 12:00–18:00 | 22.4 °C | 1.35 | 23.4 °C |
| 18:00–24:00 | 21.6 °C | 1.14 | 22.5 °C |
| 06:00–18:00 | 22.0 °C | 1.23 | 22.7 °C |
| Run period | 21.7 °C | 1.18 | 22.2 °C |
Table 14.
Indoor environmental analysis data for the Ponticelli building as a result of retrofitting actions.
Table 14.
Indoor environmental analysis data for the Ponticelli building as a result of retrofitting actions.
| Simulation Interval | Air Temperature Average Values | PMV Average Values | ACM Temperature Average Values |
|---|---|---|---|
| 00:00–06:00 | 27.0 °C | 1.61 | 27.0 °C |
| 06:00–12:00 | 27.3 °C | 1.84 | 27.3 °C |
| 12:00–18:00 | 27.1 °C | 1.76 | 27.2 °C |
| 18:00–24:00 | 27.1 °C | 1.76 | 27.1 °C |
| 06:00–18:00 | 27.5 °C | 1.90 | 27.2 °C |
| Run period | 27.1 °C | 1.77 | 27.1 °C |
Table 15.
Comparison of air temperature, PMV, and ACM output data for the Materdei apartment under initial conditions and after the combination of indoor and outdoor strategies.
Table 15.
Comparison of air temperature, PMV, and ACM output data for the Materdei apartment under initial conditions and after the combination of indoor and outdoor strategies.
| Parameter | Starting Conditions | Outdoor Redevelopment | Building Retrofit + Outdoor Redevelopment |
|---|---|---|---|
| Air temperature | 23.7 °C | 22.6 °C | 21.7 °C |
| PMV | 1.55 | 1.32 | 1.18 |
| ACM | 24.7 °C | 22.4 °C | 21.3 °C |
Table 16.
Comparison of air temperature, PMV, and ACM output data for the Ponticelli apartment under initial conditions and after the combination of indoor and outdoor strategies.
Table 16.
Comparison of air temperature, PMV, and ACM output data for the Ponticelli apartment under initial conditions and after the combination of indoor and outdoor strategies.
| Parameter | Starting Conditions | Outdoor Redevelopment | Building Retrofit + Outdoor Redevelopment |
|---|---|---|---|
| Air temperature | 33.9 °C | 28.1 °C | 24.5 °C |
| PMV | 2.33 | 2.01 | 1.69 |
| ACM | 35.3 °C | 28.5 °C | 24.7 °C |
Publisher’s Note: MDPI stays neutral with regard to jurisdictional claims in published maps and institutional affiliations. |
© 2022 by the author. Licensee MDPI, Basel, Switzerland. This article is an open access article distributed under the terms and conditions of the Creative Commons Attribution (CC BY) license (https://creativecommons.org/licenses/by/4.0/).
Share and Cite
MDPI and ACS Style
Bassolino, E. Definition of Urban Built Environment Climate Adaptive Design Actions Aided by Environmental Data-Driven Design Processes. Atmosphere 2022, 13, 1835. https://doi.org/10.3390/atmos13111835
AMA Style
Bassolino E. Definition of Urban Built Environment Climate Adaptive Design Actions Aided by Environmental Data-Driven Design Processes. Atmosphere. 2022; 13(11):1835. https://doi.org/10.3390/atmos13111835
Chicago/Turabian StyleBassolino, Eduardo. 2022. "Definition of Urban Built Environment Climate Adaptive Design Actions Aided by Environmental Data-Driven Design Processes" Atmosphere 13, no. 11: 1835. https://doi.org/10.3390/atmos13111835
Note that from the first issue of 2016, this journal uses article numbers instead of page numbers. See further details here.