1. Introduction
Aerosols have been increasing during the last half century due to rapid economic development. Many observational and modeling studies have indicated that aerosols may significantly affect convection and cloud properties [
1,
2,
3]. Aerosols can act as cloud condensation nuclei (CCN) or ice nuclei (IN), both of which affect cloud microphysics through their role in nucleating cloud drops and ice particles. Higher CCN concentrations tend to decrease cloud droplet size, increase number concentration, and narrow the droplet spectrum [
4,
5]. Tao compared observational results of microphysical properties developed in dirty and clean environments [
6,
7]. Andreae analyzed in situ observations and found that increases in smoke and surface heat due to biomass burning tend to lead to higher cloud-top heights and the enhancement of cold-rain processes over the Amazon basin [
8]. The hilly precipitation can be decreased by 30 to 50% during hazy conditions, with a visibility of less than 8 km at the mountain top [
9]. An observational study showed that the rainfall onset and peak times occur earlier, and the duration becomes longer under pollution over Beijing–Tianjin–Hebei [
10]. Fang found that more aerosols result in smaller cloud drops and inhibit precipitation over Beijing [
11]. The modeled average precipitation rate decreases with rising aerosol background concentration for a Beijing heavy rainfall [
12]; meanwhile, the precipitation amount under polluted conditions can also be increased for convective clouds in Beijing [
13].
Model simulation studies confirm that CCN changes not only warm cloud processes but also mixed-phase cloud processes [
1,
14,
15]. A change in the droplet size impacts ice particle riming efficiencies [
16]. Borys revealed that an increase in aerosol sulfate concentration led to higher concentrations of smaller cloud droplets [
17] and a reduction in the efficiency of ice crystal riming, producing lightly rimed snow crystals that fall slowly and advect farther downstream [
18]. Furthermore, Lynn found that polluted continental-type simulations tended to suppress precipitation [
19], shift the precipitation maximum downstream, and reduce the presence of graupel.
With increasing aerosols, an increasing amount of IN appears in the atmosphere along with larger CCN numbers. You carried out an observation of ice nuclei in Beijing in 1963 with a mixing cloud chamber [
20]. More than 30 years later, in 1995 and 1996, You repeated this observation in Beijing again, observing data showing that the ice nuclei concentrations in Beijing increased by 15 times from 1963 to 1995 and were extremely high during heavy-pollution conditions [
21]. At the top of Mt. Huangshan in China, the total number concentration of IN at −20 °C measured by a mixing cloud chamber was 16.6 L
−1 [
22], much lower than that of Beijing in the 1990s. Jiang et al. [
23] conducted sampling observations of atmospheric ice cores in Xinjiang Province, China, and established a parameterization scheme for atmospheric IN.
Both CCN and IN play important roles in cloud and precipitation processes; compared with CCN effects, the IN effects are much more complicated and far from well-understood due to the varied activation properties and different IN measurement methods [
24]. Increasing attention has been given to aerosol effects on cloud physics in recent years, and a number of empirical parameterizations have been proposed on the basis of laboratory or field IN observations [
25] and are used to determine the effects of IN on convective clouds and precipitation [
26]. Research has shown that increased IN concentrations can promote ice-phase processes within orographic clouds to increase precipitation [
27]. Lohmann [
28] conducted simulation research and found that dust and soot aerosols act as contact-freezing nuclei that increase the ice phase process in clouds, thereby increasing precipitation. However, some studies have also shown that an increase in ice core concentration will lead to a decrease in precipitation [
29].
Aerosols have an important significance in the study of atmospheric IN along with CCN on clouds and precipitation. Thompson [
30] considered aerosols as CCN and ice nuclei IN in the microphysical scheme of the WRF model. The changes in the number and mass concentrations of hail by CCN and IN led to larger hail formed in high CCN, but smaller hail stones were produced in high IN with sensitivity experiments with WRF-SBM [
27]. Using a parameterization scheme for atmospheric IN [
23], with the increase in IN concentration, the precipitation intensity increased significantly [
31]. Therefore, it is more important to consider aerosols of both CCN and IN on the cloud and precipitation process, especially when cloud seeding for weather-modification changes cloud droplets, rain embryos, or ice nuclei to modify the cloud and precipitation process through cloud seeding with hygroscopic particles, silver iodide, or coolant seeding agents [
32,
33,
34]. Aerosols can affect the development of clouds and precipitation, which in turn affects the effects of cloud seeding, especially in the condition of increasing atmospheric pollution. Seeding models of different seeding agents have been developed to simulate seeding agents nucleating and interacting with cloud and precipitation fields [
35,
36]. A key assumption of cloud seeding is that seeding particles dominate over the effects of natural aerosols. However, most NWP models currently do not consider the ambient background aerosol population when calculating water drop and ice particle nucleation, and thus, this deficiency limits their usefulness for cloud-seeding simulations where the competition between the natural and seeding aerosols is essential [
37]. The significance of the different seeding effects potentially also depends on the presence of natural GCCN aerosol in the background, as suggested by parcel model calculations [
38]. A new look at Israeli cloud-seeding experiments is that clouds in Israel contain large cloud droplets, precipitation-sized drops, and considerable concentrations of natural ice particles at quite high temperatures, all of which should obviate attempts to increase rainfall by artificial seeding in wintertime air masses [
39]. It has also been found that seeding (increasing aerosol number and size) slows down the autoconversion [
40], and the specific outcome of cloud seeding will presumably also depend on the properties of the background aerosol as well as on the turbulence characteristics of the cloud. Obtaining a sufficiently high concentration of large (>1 μm) CCN from flares in terms of efficient precipitation enhancement might be challenging with currently used practical applications [
41]. Most of the aerosol impacts on the seeding effect are mainly focused on hygroscopic agents; only a few studies of IN impacts on glaciogenic seeding effects have been carried out [
42], and these studies only considered the IN impacts without the consideration of aerosols on cloud number concentrations along IN.
CCN and IN has an impact on number concentrations, mass contents, and snowfall. Weather modification adds seeding agents to modify the number concentrations of cloud drops, rain drops, or ice crystals to change the cloud and precipitation processes. Will natural IN and CCN counteract seeding agents such as IN and CCN, especially under high-aerosol conditions, such as air pollutants, dust, or haze? If so, how much will they affect the seeding result? Through the simulation of a snowfall event occurring on 17–18 March 2012 near Beijing, this paper aimed to conduct research on stratiform cloud snowfall in polluted air with ice nuclei and cloud number concentration increases in Beijing and snowfall-seeding effects with higher cloud drop numbers and more IN particles, as in polluted air. This research helps in the understanding of the aerosol influence on the weather-modification effect and assists in the design of seeding methods and evaluation of seeding effects for weather modification under different aerosols.
2. Description of CAMS Scheme and Simulation Setups
In this research, the Weather Research and Forecasting model (WRF) coupled with the Chinese Academy of Meteorological Sciences (CAMS) two-moment bulk microphysics scheme was used (WRF_CAMS) [
43]. The CAMS scheme predicts the mass contents of water vapor (Qv), cloud droplets (Qc), rainwater (Qr), ice (Qi), snow (Qs), and graupel (Qg) as well as the number concentrations of ice (Ni), snow (Ns), rain (Nr), and graupel (Ng). In addition, in order to describe the autoconversion of cloud water to rain water [
44], a relatively broad cloud droplet size distribution function Fc was used, as listed in
Table 1. Each category of water substance was assumed to have a size distribution of the form of
where
N(
D)d
D is the number of particles in the diameter range d
D centered on
D, and α, λ, and
N0 are three spectrum parameters, as listed in
Table 1. To preserve the positivity, conservation, and stability of the water substance, a quasi-implicit calculation framework was developed. A total of 31 microphysical processes were calculated (
Table 2), including autoconversion, collection, condensation and evaporation, freezing and melting, and sublimation and deposition. The leading letter of a microphysical process is the abbreviation for the name of the process; the second and third letters represent the depleted and produced water substances, respectively. In front of these three letters, an additional letter N is used to express the change rate of the number concentration. NCii, NCrr, and NCss are processes only having number concentrations.
Several microphysical processes in the CAMS scheme were treated uniquely. The number of concentrations of raindrops were predicted following the work of Hu [
45], eliminating the need to prescribe the truncated values of spectra as a function of the respective precipitation rate or constant. On the basis of the numerical simulation results of Berry [
46], if Fc is larger than 1, a number of rain embryos are converted from the growing cloud droplet population. The minimum diameter of cloud droplets (24 µm) was set such that they can be collected and form secondary ice. The freezing process of rain drops to graupel particles (Mrg) was calculated from the possibility function of freezing (Pfrg), considering the change rate of T, the number change rate, and the volume change rate of raindrops. Additionally, a quasi-implicit calculation method was established for all microphysical processes.
The WRF_CAMS model has been run operationally since 2012 to predict cloud macrophysics, cloud microphysics, and precipitation and can be used to analyze seeding ability for weather-modification operations in China.
The WRF model simulation was carried out on three nested domains with grid spacings of 27, 9, and 3 km and mesh sizes of 101 × 101, 91 × 91, and 127 × 127. All grids used 28 unevenly spaced vertical computational levels, extending from 15 m to approximately 17 km above ground level. Other physical schemes included the RRTM long-wave radiation scheme, Goddard short-wave scheme, Monin–Obukhov surface layer scheme, YSU planetary boundary layer scheme, and Grell 3D cumulus parameterization scheme, which was used in the first and second domains, whereas the cumulus convection scheme was turned off in the third domain. The initial and lateral boundary conditions were interpolated from the NCEP/DOE reanalysis data. The simulation period was from 0600 UTC on 17 March to 0600 UTC on 18 March 2012.
3. Case Simulation
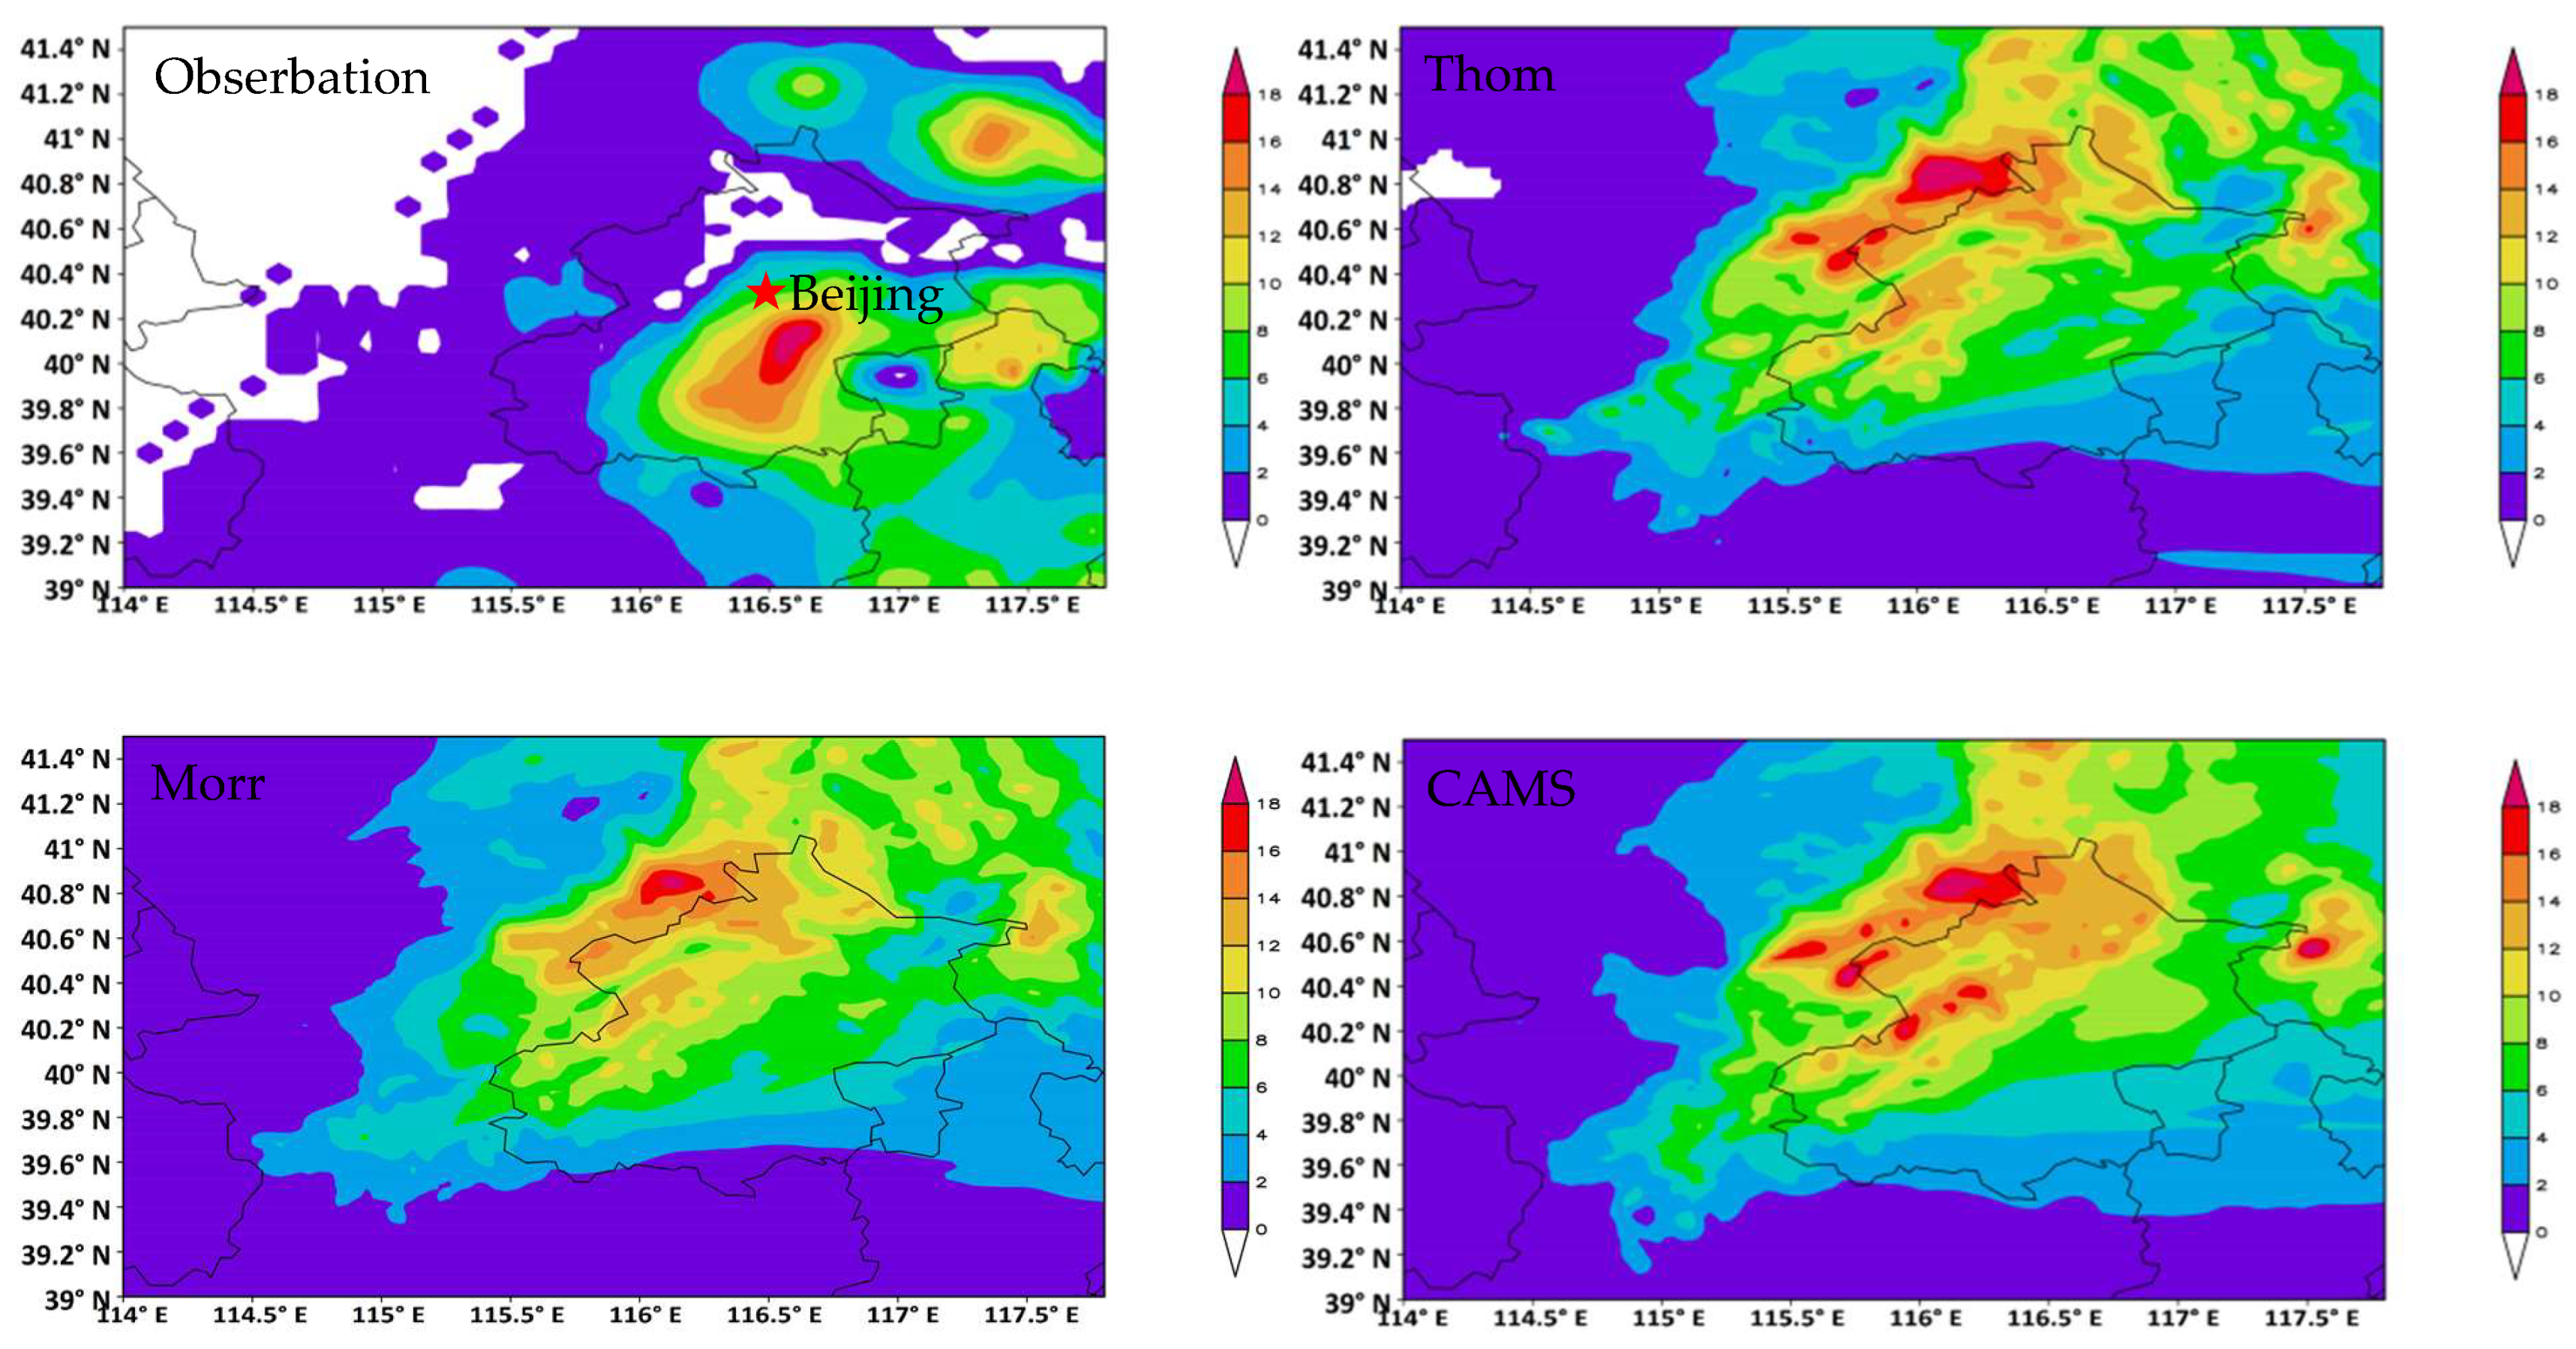
A trough occurred on 17 March in 2012 at Hexizoulang in western China. As this trough moved east, it brought snowfall to the north of Beijing, resulting in a total amount of precipitation of more than 18 mm a day at the center. Using the WRF_CAMS model, the snowfall system was simulated for a period of 24 h. To make comparisons, Thompson and Morrison explicit schemes were also used for this simulation. The model-simulated daily snowfall amounts of the Thompson, Morrison, and CAMS microphysical schemes were compared with the observed data over 24 h (
Figure 1). Compared with the observed data, the simulated weather condition and its development trend were consistent with the measured data, which indicates that this model with these three cloud schemes has good simulation capability except that the simulated temperature and potential height at 500 hPa in Beijing and its surrounding areas were slightly higher than the observed results. The simulated daily precipitation of all three schemes were very close to each other not only in terms of snowfall distribution but also in terms of the strength of snowfall centers. Meanwhile, the snowfall simulation areas of all three schemes were much larger than the observations. Simulation areas of daily snowfall amount larger than 4 mm covered two-thirds of the domain, as shown in
Figure 1, and the observed snowfall area took up even less than one-half of the domain. The simulated snowfall centers were located northwest of those of the observations. The distributions of precipitation larger than 16 mm of the Thompson scheme were very similar to those of CAMS; both were widely scattered along the northern border of Beijing city, but there was only one snowfall core (>16 mm) of the Morrison scheme result, which was closer to the observations than those of Thompson and CAMS.
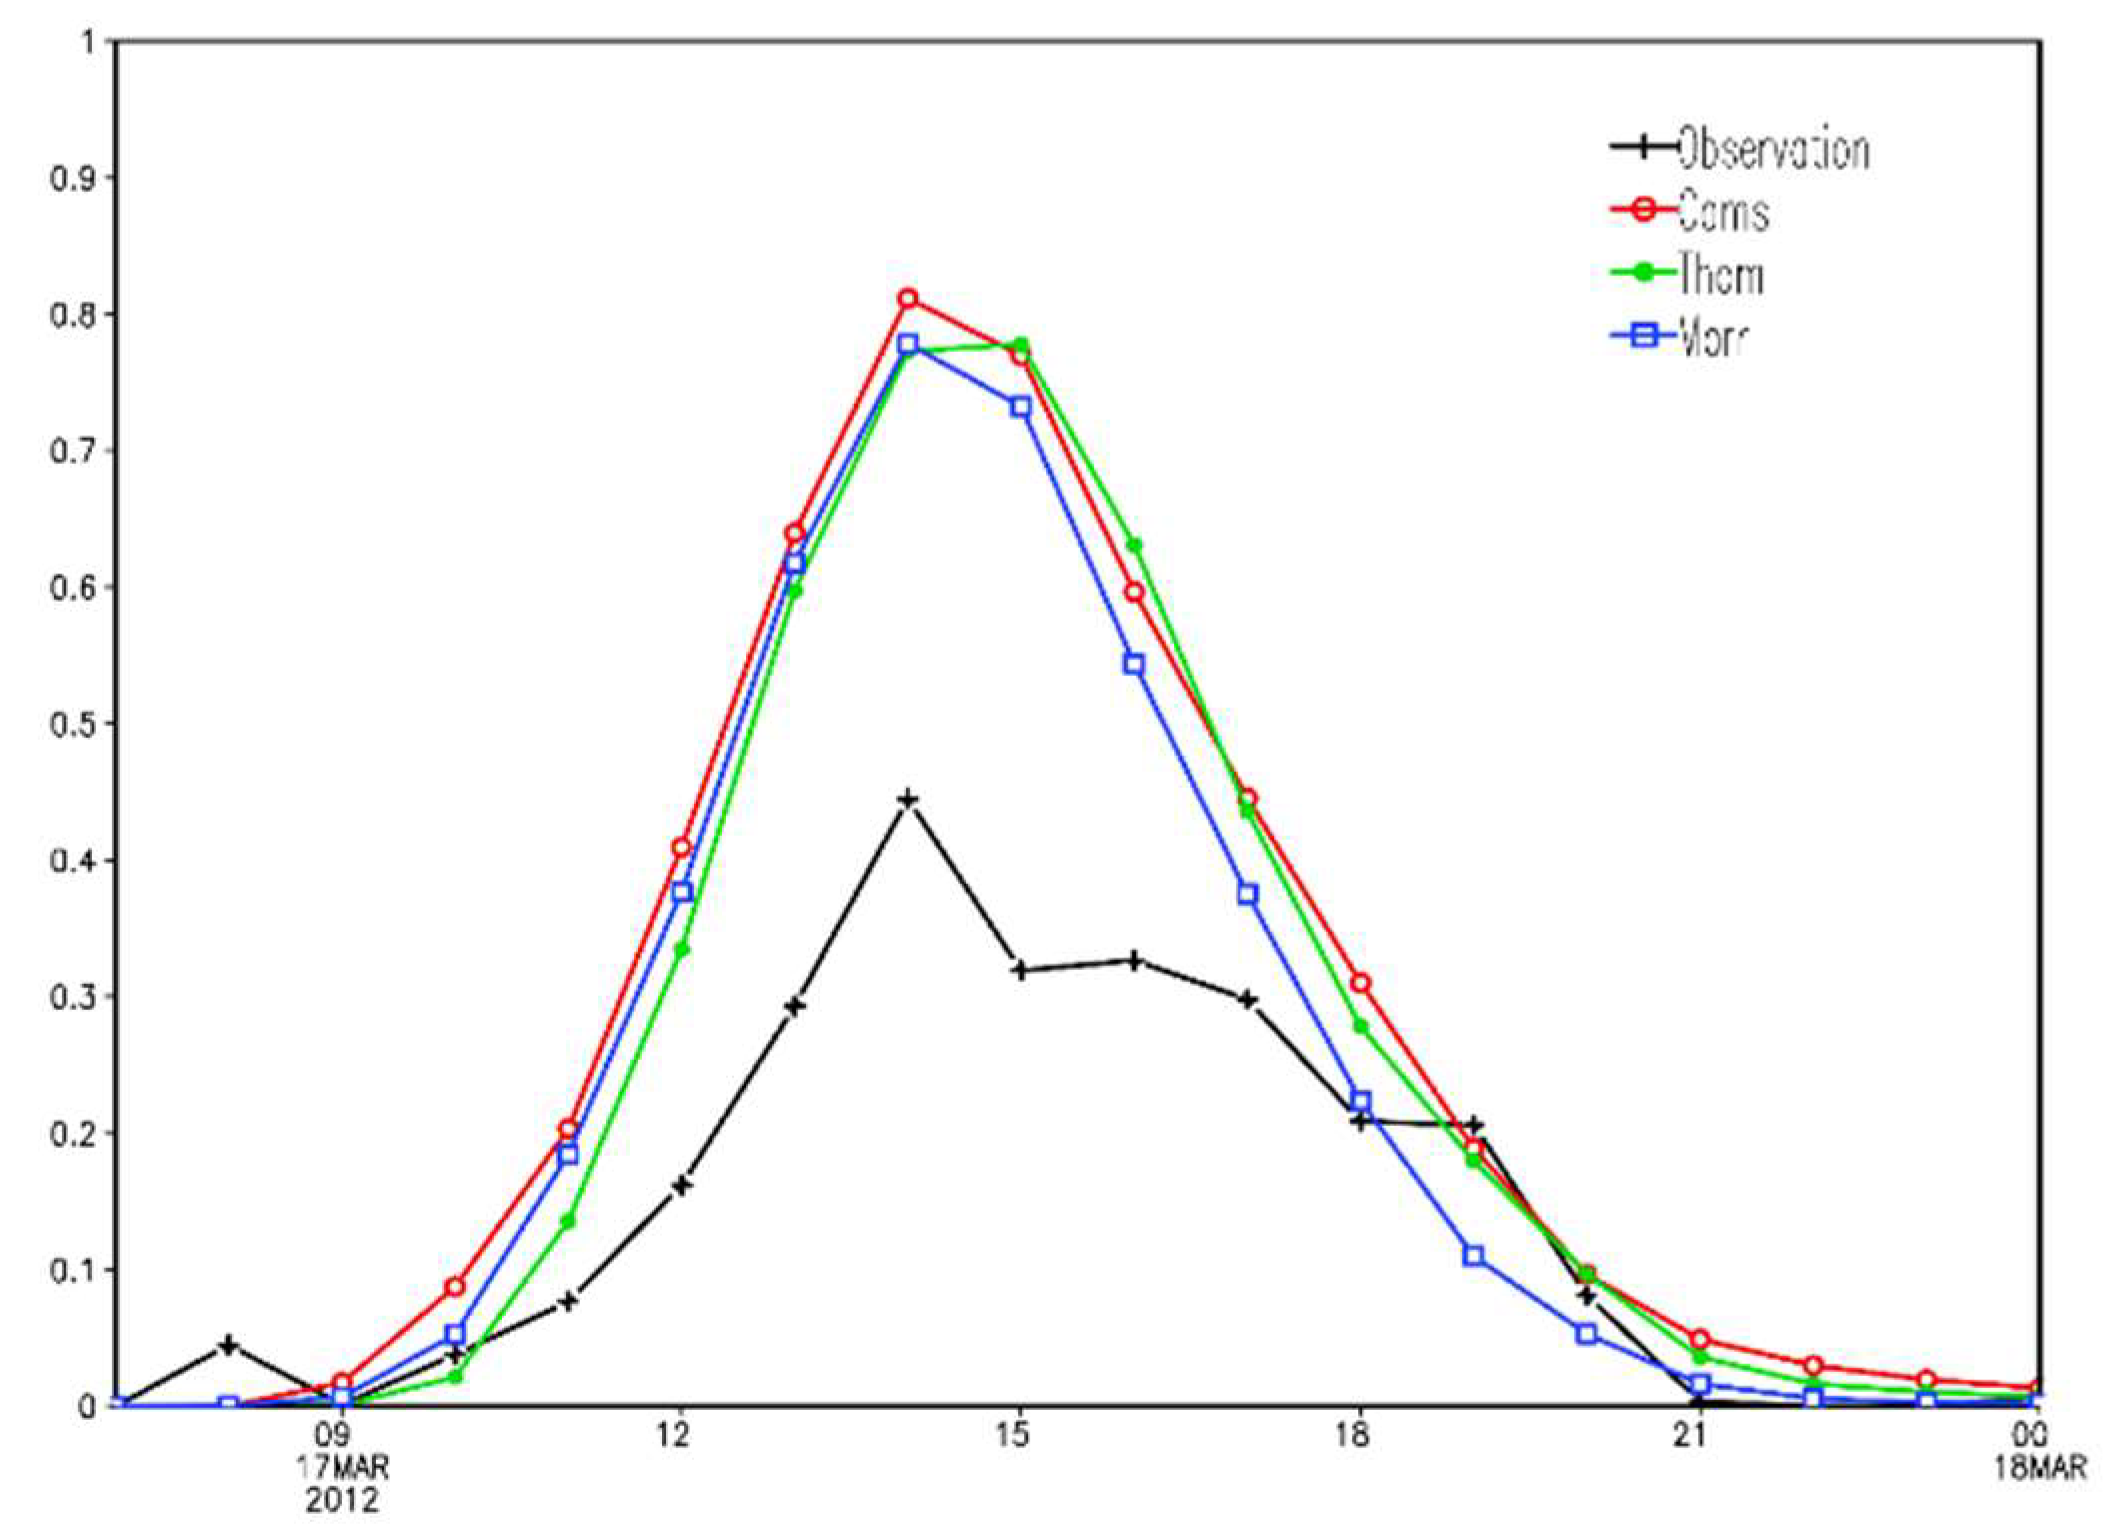
The hourly averaged snowfalls for the third domain of simulations and observations are shown in
Figure 2. All three cloud schemes represented the snowfall process very well—the starting and ending times of precipitation were nearly the same as the observation except that the observed starting time was one hour earlier than that of the simulations, and the observed ending time was 2–3 h earlier than simulations when the simulated precipitations were truly weak. The simulated developing period and the weakening period of snowfall maintained the same step as the observations although all the simulations had much more precipitation than the observation data.
In this study, as the north of Beijing is a mountainous area with few automatic observation sites, the hourly precipitation of 0.1° grid data formed by fusion with CMORPH [
47] may be inconsistent with the actual precipitation; along with the slightly higher temperature and potential height of simulation results, these two reasons may have caused the daily and hourly precipitation simulation results of the three microphysics schemes to be stronger than the observation data, with the simulated precipitation distribution centers being slightly shifted to the northwest.
4. Sensitivity Experiments of Cloud Drop Number and Ice Nuclei
4.1. Design of Sensitivity Tests
In the CAMS scheme, the ice nucleation process (Pvi) is based on the work of Fletcher [
47]:
Equation (2) is deduced from the results of experiments in the cloud chamber, where N
N is the total number of nucleated IN under the given temperature. N
N is an exponential distribution with decreasing temperature, and NIN and BIN are two parameters of the nucleation process. NIN is the truncated value of this curve, equal to the N
N at 0 °C. BIN is the slant value of the exponential curve. In the work of Fletcher [
48], NIN = 10
−5 L
−1, and BIN = 0.6 (°C)
−1. Bowdle et al. [
49] found for the high planes (Montana) that NIN = 10
−4 L
−1, and BIN = 0.3 (°C)
−1 in the spring and summer in 1975 and 1976 [
5]. In the CAMS scheme, NIN and BIN were based on ice nuclei concentrations observed by the Bigg mixing cloud chamber for 44 days (18 March to 30 April) during the spring of 1963 in Beijing by You et al. [
20,
50]. At temperatures of −15 °C, −20 °C, −25 °C, and −30 °C, the IN concentrations in the morning were 1.6 L
−1, 6.4 L
−1, 44 L
−1, and 401 L
−1, respectively, and in the afternoon were 0.7 L
−1, 3.9 L
−1, 42.7 L
−1, and 267 L
−1, respectively. The IN observation results also depended on the wind direction and visibility. After fitting to the log curve, we obtained NIN = 6.53 × 10
−3 L
−1, and BIN = 0.342 (°C)
−1.
If the temperature remains unchanged in the cloud chamber, the number of nucleated ice particles will not increase significantly after some time. According to the conditions of the experiments in the cloud chamber, the nucleation rate was taken to be a function of the change rate of temperature.
NN is also a function of vapor supersaturation over ice (S), according to Huffman [
51]:
where
C and
K are parameters. The
K value was found to increase from a value of about 3 for natural air over rural, northeast Colorado, through to a value of 4.5 at Laramie, reaching a value near 8 for air samples in the vicinity of St. Louis. It is analogous to the generally accepted result for the activity spectrum of CCN, with the supersaturation being expressed with respect to liquid water in the latter case. Moreover,
K increases as the air sample becomes more urban. On the basis of (2) and (4), we obtain
If
, the ice phase is not stable, and the nucleation rate is zero. Thus, the nucleation rate of ice is taken as a function of the change rate of temperature and the vapor supersaturation (S) as follows:
where
is the initial mass of ice nucleated particles, and the value was 10
−10 g in this research.
In the spring of 1995 and 1996, You repeated the ice nuclei observation with the same Bigg mixing cloud chamber as that of the 1963 spring season in the same location in Beijing [
20,
21], using the same period from 18th March to 30th April (44 days), the same observation method, and the same observation procedure as that used in the 1963 experiment. During the 1995 observations, dust, dust storms, smoke, and severe pollution weather processes occurred, and the observed IN at −15 °C varied by four orders of magnitude, while at −25 °C and −30 °C, IN varied by one order of magnitude. The largest values of IN at −20 °C were 604 L
−1 during severe air pollution background and 417 L
−1 in dust storm weather. In 1996, the IN concentrations at −15 °C and −20 °C were significantly lower than those in 1995—the maximum values were 39 L
−1 and 243 L
−1, respectively, and the IN concentrations increased relatively slowly at lower temperatures. Comparing the observations in 1963, 1995, and 1996, at temperatures of −15 °C, −20 °C, −25 °C, and −30 °C, the IN concentrations in 1995 and 1996 increased by 14.7, 15.8, 14.6, and 16.9 times, respectively, compared to the results in 1963. Using the same slant value and keeping BIN unchanged (0.342), the concentrations of IN increased 15 times, meaning NIN increased from 6.53 × 10
−3 L
−1 in the 1960s to approximately 100 × 10
−3 L
−1 in the 1990s in the nucleation curve to represent the basic and pollution background conditions. The 10
−5 L
−1 value of NIN was also used to test the clean environment, as described by Pruppacher [
5], and thus, three sensitivity numerical experiments of three NIN values of 0.01 × 10
−3 L
−1, 6.53 × 10
−3 L
−1, and 100 × 10
−3 L
−1 of the ice nucleation process were designed to represent the clean, basic, and pollution conditions, respectively.
The best way to determine the CCN effect on cloud and precipitation processes is to calculate the CCN nucleation to the cloud drop process; however, in the CAMS scheme, the cloud drop number concentration was not predicted, and the cloud drop number concentrations per cubic meter at the cloud base (CN) were set instead to represent the cloud property. Meanwhile, the Hndb parameter was used to consider the ratio of cloud drop number concentration and cloud droplet spectral dispersion on the basis of the observation data in Lushan Cloud and Fog Station in China [
52]. Therefore, the sensitivity tests of CN were designed along with NIN to consider the aerosol influence on cloud drop number concentrations as CCN. For the control, CN and Hndb were 3 × 10
8 m
−3 and 1200, respectively. Because many records of high Nc above 1000 cm
−3 are observed in Beijing [
53], in this research, values of 3 × 10
7 m
−3 and 1 × 10
9 m
−3 (3e7 and 1e9 in
Table 3) were also used to represent clean air and polluted air, respectively, while the value of Hndb was adjusted along with CN.
Three CN values, together with three values of NIN, totaling five sensitivity tests, were designed as given in
Table 3; they were 3e7, 1e9, Hnin001, Hnin100, 1e9-Hnin100, and the control test, where NIN is 6.53 × 10
−3 L
−1, and CN is 3e8 m
−3. In these tests, the 3e7 test and 1e9 test are used to study only the CN impacts; the Hnin001 test and Hnin100 test are used to study the IN impacts, and the 1e9-Hnin100 test is aimed to study the combined impacts of CN and IN.
4.2. CN and NIN Influence on Snowfall
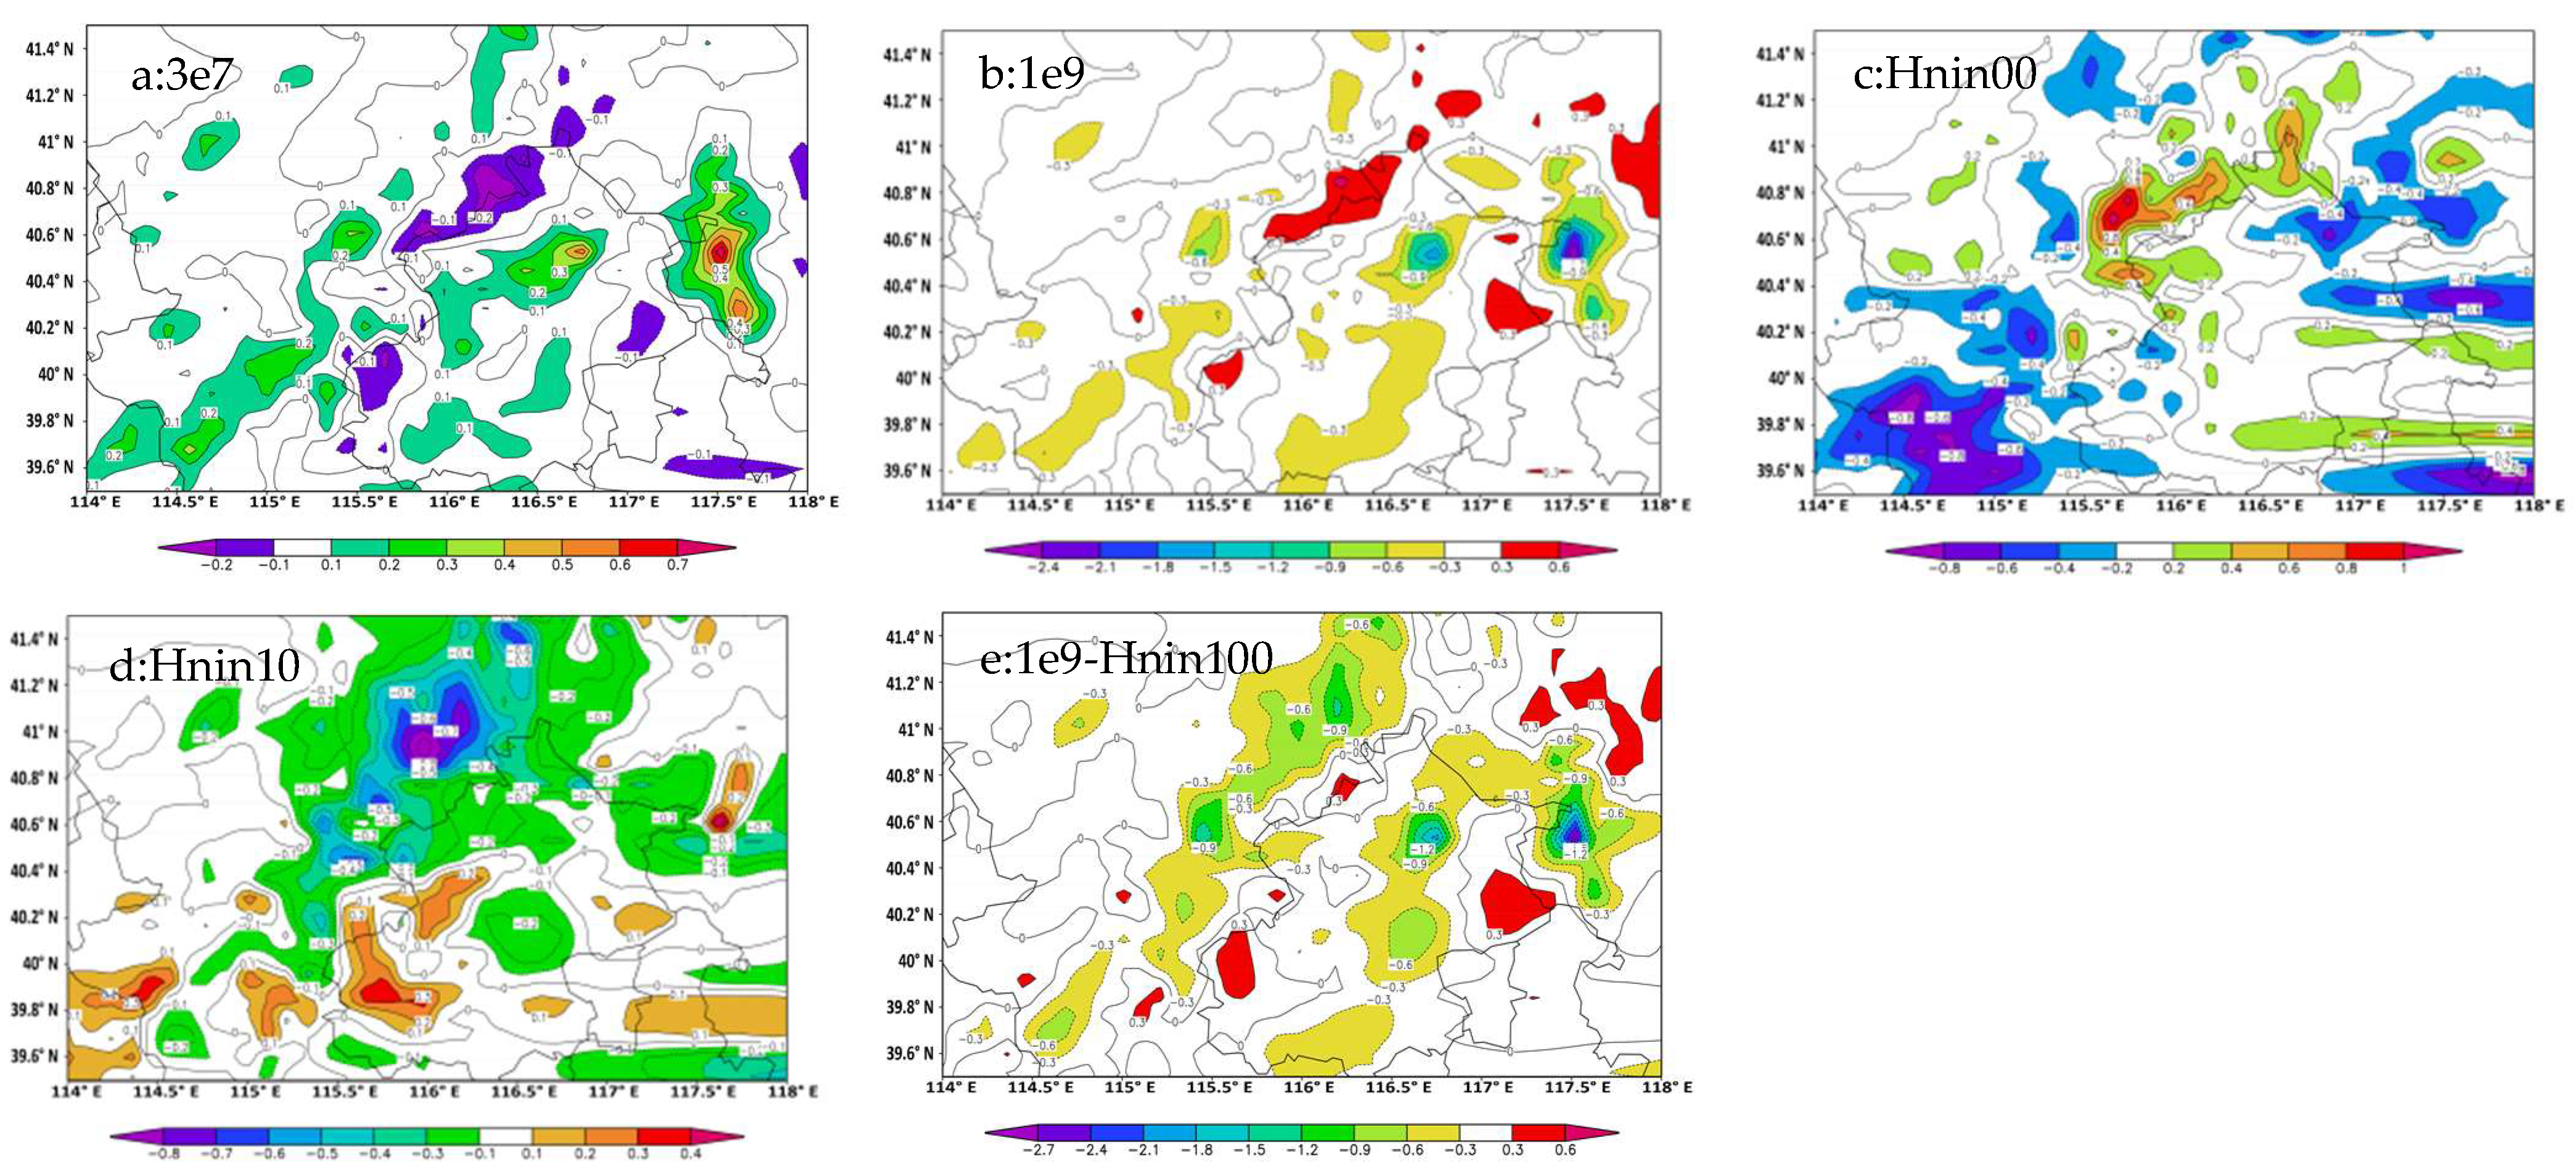
With the same initial input data and model sets, five sensitivity and control tests were run for 24 h of model time. The daily snowfall deviation distributions of the five sensitivity experiments and control simulations are provided in
Figure 3. CN and NIN truly impacted snowfall amounts. By reducing the number of cloud droplets in the 3e7 test, snowfall increased in most precipitation locations, and many increased centers appeared, in which the peak value of deviation was up to 0.7 mm from 18 mm total snowfall. Only a small precipitation reduction occurred in a very small area, and the reduced snowfall did not exceed 0.2 mm. In contrast, in the 1e9 experiment, in most areas, snowfall reduction appeared, and the distribution was relatively consistent with the snow increase distribution in the 3e7 experiment, with its maximum snow reduction even exceeding 2.4 mm, while there was only a very small area where a 0.6 mm snowfall increase occurred.
In the case of extremely low NIN (Hnin001) to stand for clean air, a relatively large-scale snowfall increase occurred, and in a small area, the maximum value of snow increase was up to 1 mm, which was the greatest increase for all five tests; additionally, 0.8 mm of snow reduction centers appeared in the southeast and east of the snowfall areas. The simulation shows that the reduction in NIN generally caused an increase in snowfall in the center domains of snowfall, but at the same time, it reduced snowfall over a wide space in other areas of weak snowfall. Contrary to the Hnin001 test, as NIN increased (Hnin100), the snowfall decreased in the vast majority of snowfall sites, showing an overall large snow reduction covering almost the entire snowfall domain, with an extreme snow reduction of 0.8 mm. In the weak snowfall area in the southern part of the snowfall center, the simulation of Hnin100 showed several snow increase centers that can locally increase the snowfall by 0.4 mm.
In the case of increasing both NIN and CN (1e9-Hnin100), the snow reduction covered nearly the entire snowfall area, and the maximum snow reduction exceeded 2.7 mm, which was to up to 15% of the daily 18 mm. Snowfall increased only to a very small extent in several small areas. The distributions of reduced snowfall were different from the Hnin100 test and the 1e9 test, and they were the combined influence of IN and CN.
4.3. CN and NIN Influence on Water Substances
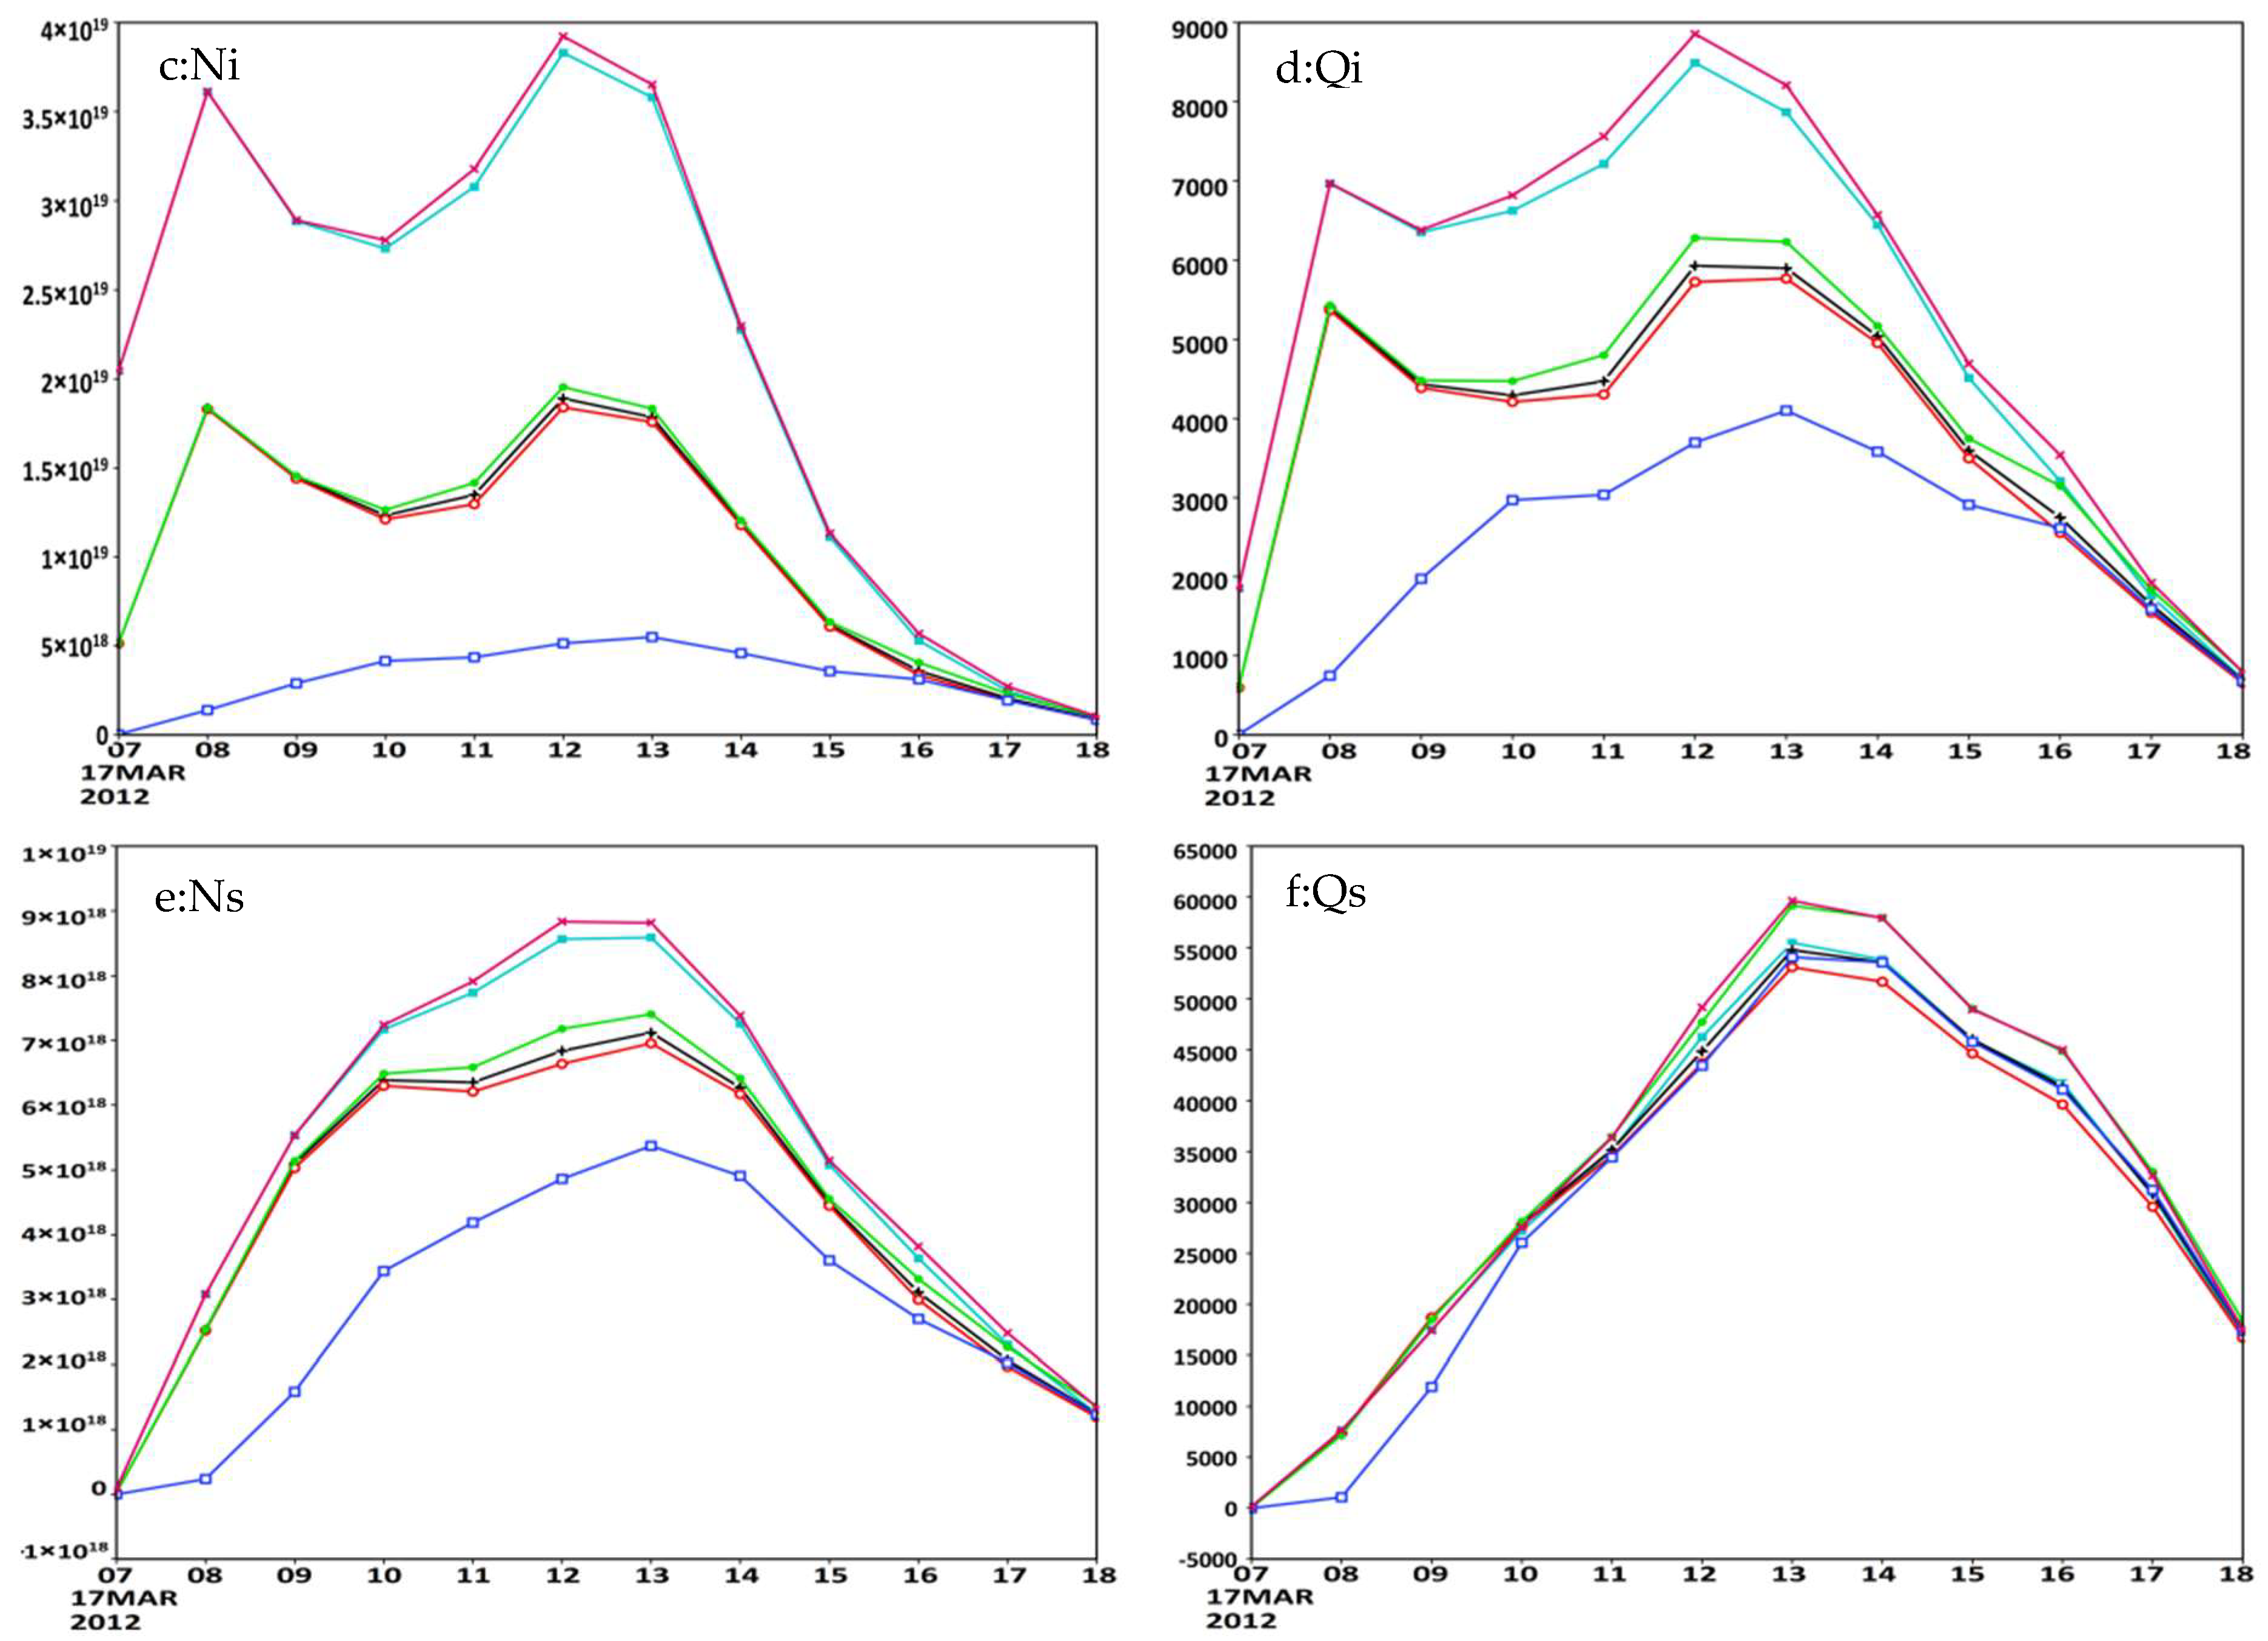
The snowfall changes caused by NIN and CN in the control and five sensitivity tests were distinct, which means that the simulated water substances of these tests were modified with different CN and NIN. Considering that this is a winter snowfall case, as shown in
Figure 4, only the third domain averaged water substances of clouds, ice crystals, and snow below 10 km height were provided. Generally, the number concentrations of cloud drops in the 1e9 test and 1e9-Hnin100 test were very large, and there were many more cloud water contents in these two tests. In the 3e7 test, there were the lowest cloud drop number concentrations among all tests, and thus, more large cloud droplets existed during this test, which means more cloud water autoconverted to rain water than in other tests, and the Qc was only approximately 70% of the control test. The cloud drop number concentrations of the 1e9 test and 1e9-Hnin100 test were the opposite of that of the 3e7 test, including up to eight times the amount of drops compared to the control; additionally, the relatively small sizes of cloud drops led to less cloud water autoconversion to rain water, which resulted in more cloud water in the 1e9 test and 1e9-Hnin100 test, which was almost double that of the 3e7 test.
In addition to CN, NIN also affects cloud drop number concentrations and cloud water contents. Nc was relatively large in the Hnin001 test during the first several simulation hours (before 10Z), and it was amazing that the Qc of this test was much larger than that of the other tests. The depletion of cloud water through the Bergeron and collection processes using ice particles was limited because of the fewer ice particles in the Hnin001 test. Therefore, cloud water was affected not only by CN but also by NIN. Several hours later, the Qc of tests 1e9 and 1e9-Hnin100 exceeded the cloud water contents of the Hnin001 test and control test by 60% at peak time.
The ice crystal concentrations were greatly affected by NIN. With the same BIN value of the ice nucleation process of Pvi, there were more ice nuclei in the Hnin100 and 1e9-Hnin100 tests, where NIN was 100 × 10−3 L−1, with double the ice crystal particle concentrations compared to other sensitivity and control tests and with the Hnin001 test having the lowest concentration of ice particles. CN almost changed the ice crystal number neither in the 3e7 test nor the 1e9 test, and Ni was very close to that of the control simulation.
The ice concentration had a positive correlation with NIN but was not proportional to NIN. The NIN in the Hnin001 test was only one-tenthousandth that of the Hnin100 test, which directly resulted in the least Ni among all tests during the entire simulation time, with only one-tenth of the ice particles in the Hnin100 test. The ice mass contents showed almost the same distribution pattern as Ni, and the small Ni in the Hnin001 test resulted in a small ice mass content. The Qi values of the 1e9-Hnin100 and Hnin100 tests were the two largest values among all tests, at a maximum of 50% larger than that of the control test.
The growth mechanism of snow mainly involves the deposition of water vapor, aggregation of ice and cloud water, and autoconversion of ice to snow such that snow number concentrations mainly depend on ice number concentrations. In the Hnin001 test, small ice crystal concentrations resulted in small snow particle number concentrations, while in the Hnin100 test and 1e9-Hnin100 test, snow concentrations were large during the whole simulation period, approximately 28% larger than those in the control test. Snow mass contents were affected by cloud water contents and ice mass contents, and Qs showed smaller differences than Qc and Qi in all six tests. In the first several hours, the Qs of the Hnin001 test maintained the lowest value among all tests before 11UTC, when the snow contents of all other tests were very close to each other, and later, the contents of the 1e9 test and 1e9-Hnin100 test surpassed other tests within the extent of 20%.
In this snowfall case, snow mass was the largest mass content among all five types of water substances, graupel mass content was less than half of the snow mass content, and supercooled cloud water was not rich and lower than rain water. From the above analyses of mass contents of cloud water, ice, and snow, there were larger snow mass contents in the 1e9 and 1e9-Hnin100 tests and the lowest in the 3e7 test. The mass content ratio of ice-phase water substance and total water substance of the 1e9-Hnin100 test was the largest among all tests, and the peak value was up to 98.5%, which means that the liquid water content was only 1.5% of the total water content. The ratio of the Hnin001 test had the lowest percentage among all tests in the entire simulation time; additionally, from 95% to 97%, it increased slowly, while the ratios of other tests decreased with time.
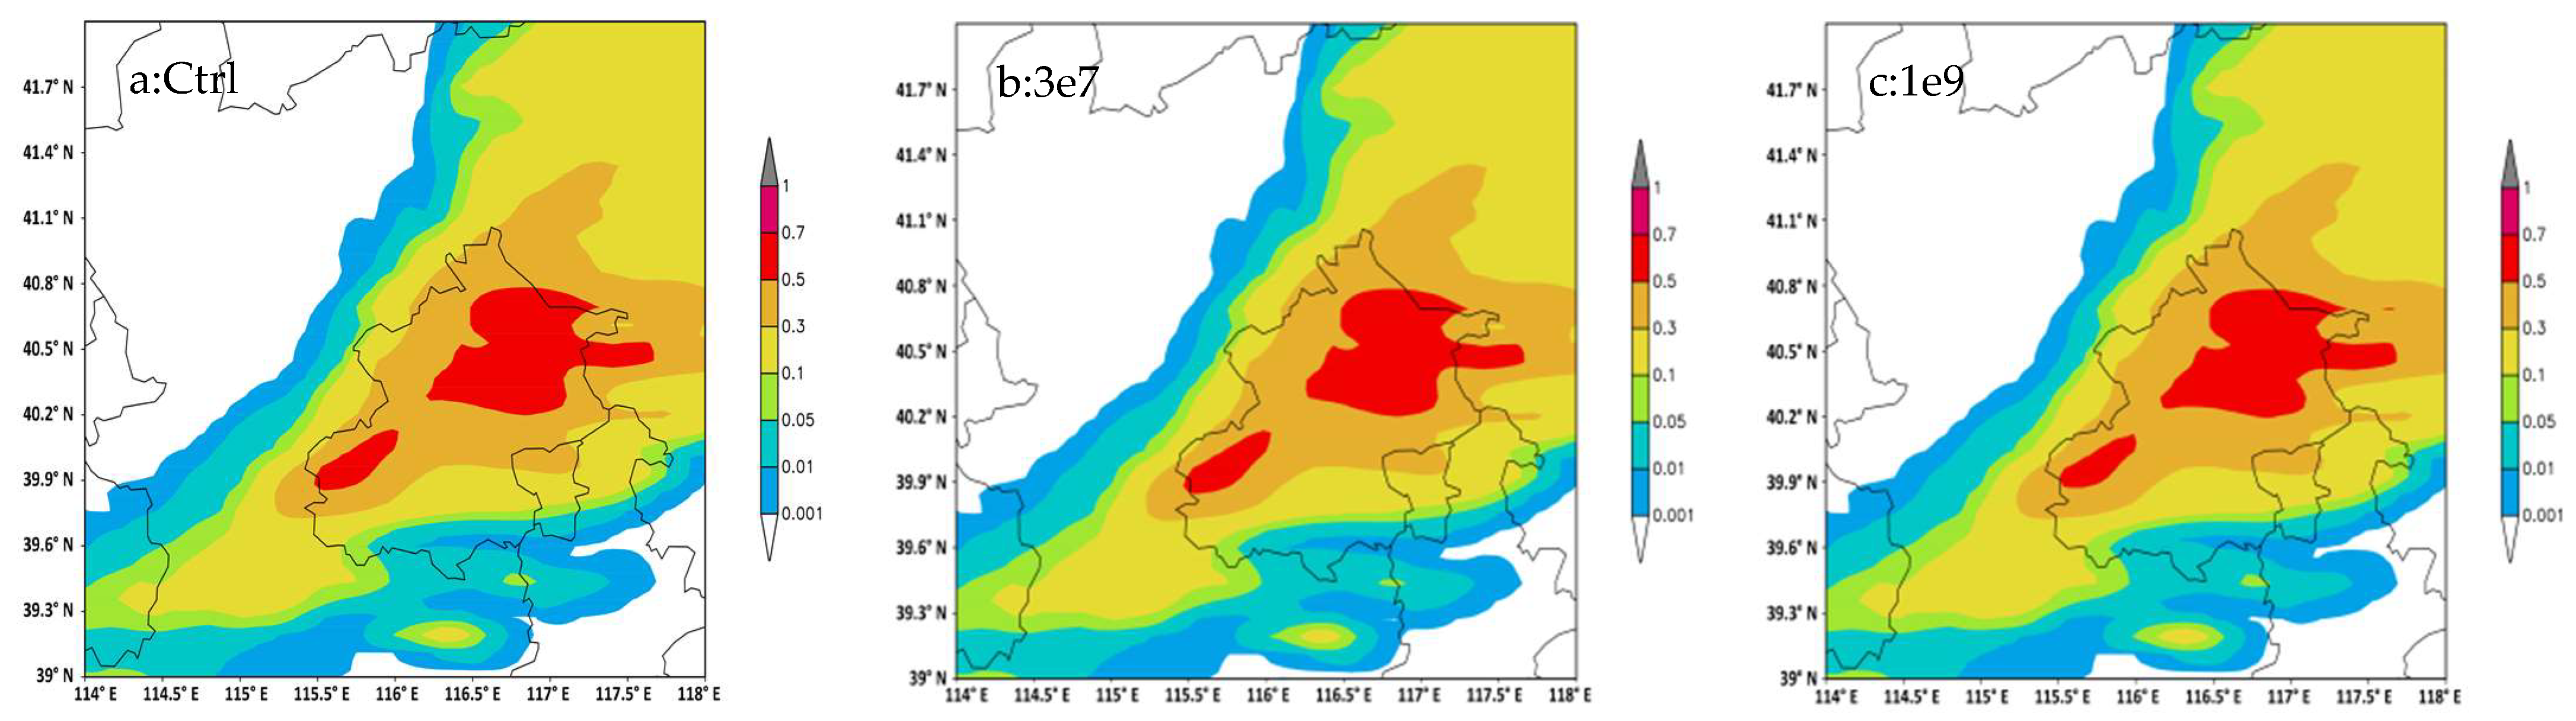
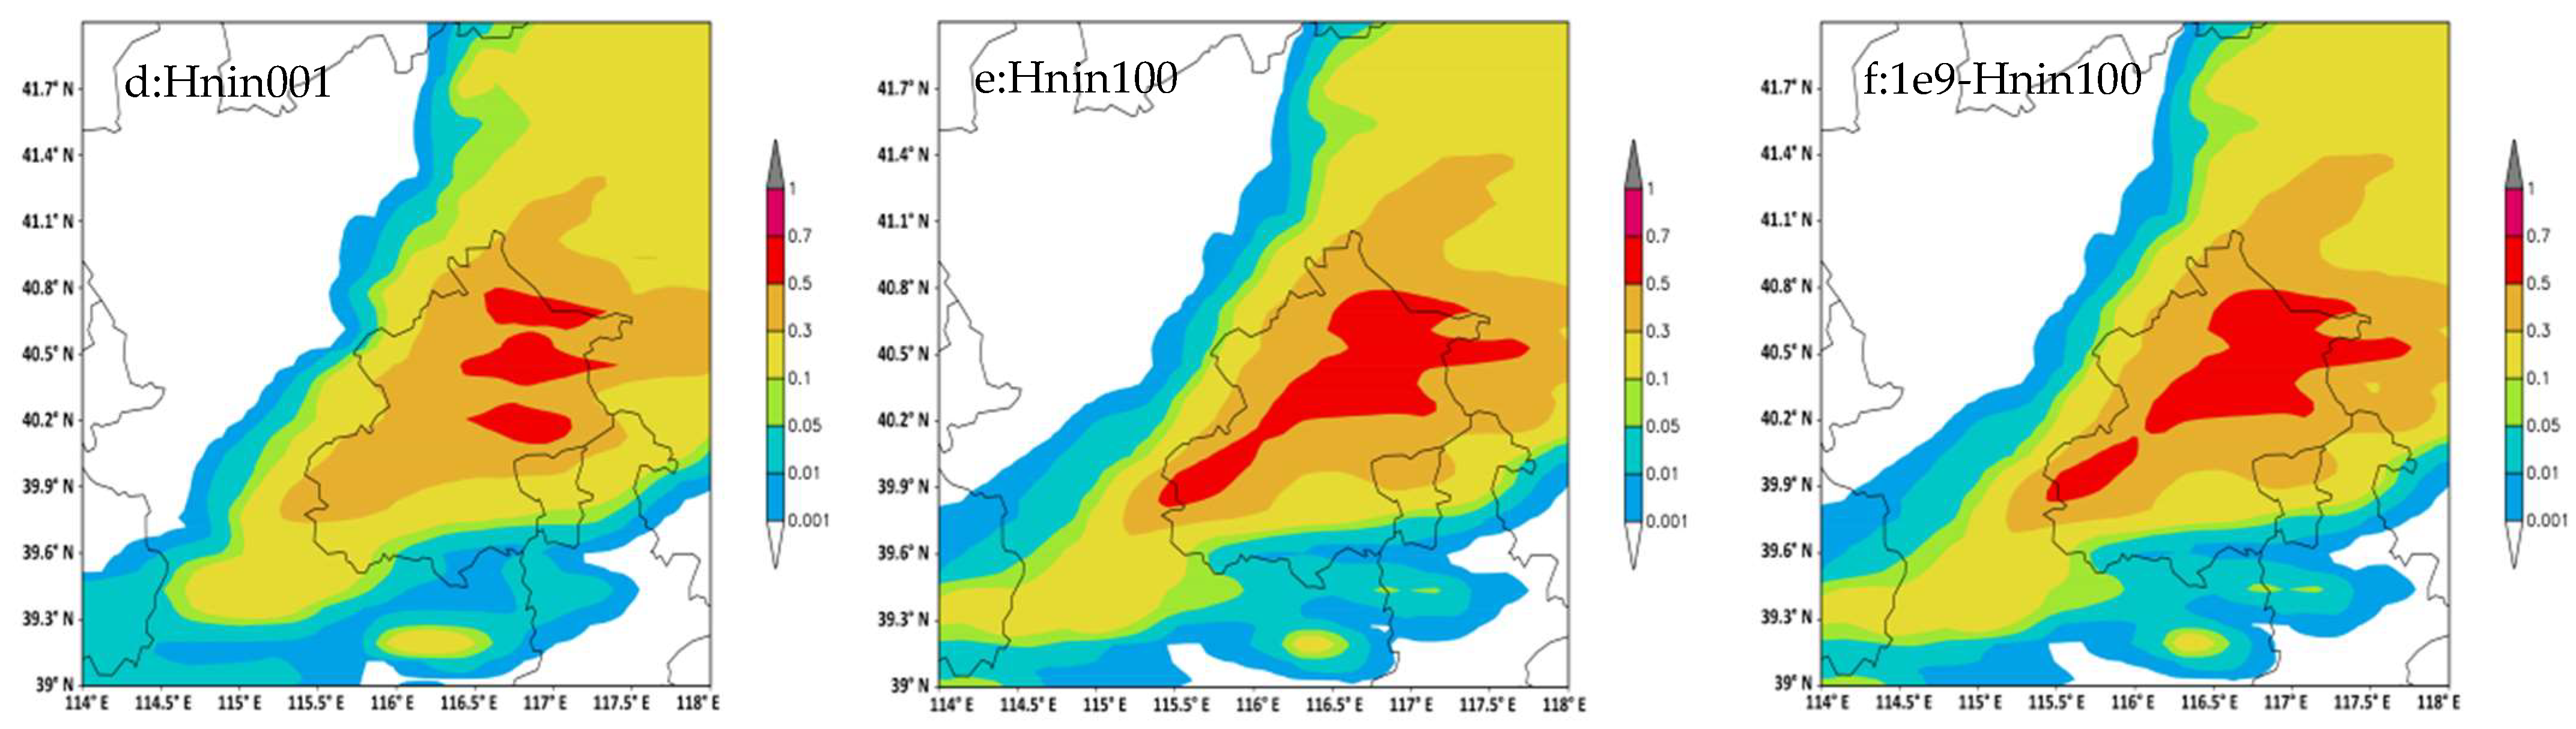
Figure 5 shows the total mass contents of water substances of the control and the five sensitivity simulations at a height of approximately 5 km. Generally, the distributions of the total mass contents in all tests were very similar, especially the locations and areas of values larger than 0.3 g/kg; however, areas larger than 0.5 g/kg showed some differences. Because of the lowest ice and snow mass contents in the Hnin001 test, its mass contents covered the smallest area among all tests; meanwhile, in terms of the large ice and snow mass contents in the Hnin100 test and 1e9-Hnin100 test, the 0.5 g/kg contour (red color shaded) of these two tests covered more areas than the other tests. There were small supercooled liquid water contents at a height of approximately 5 km, and simulations of total mass contents showed little difference among the control, 3e7, and 1e9 tests, wherein only CN was changed, while NIN remained the same constant.
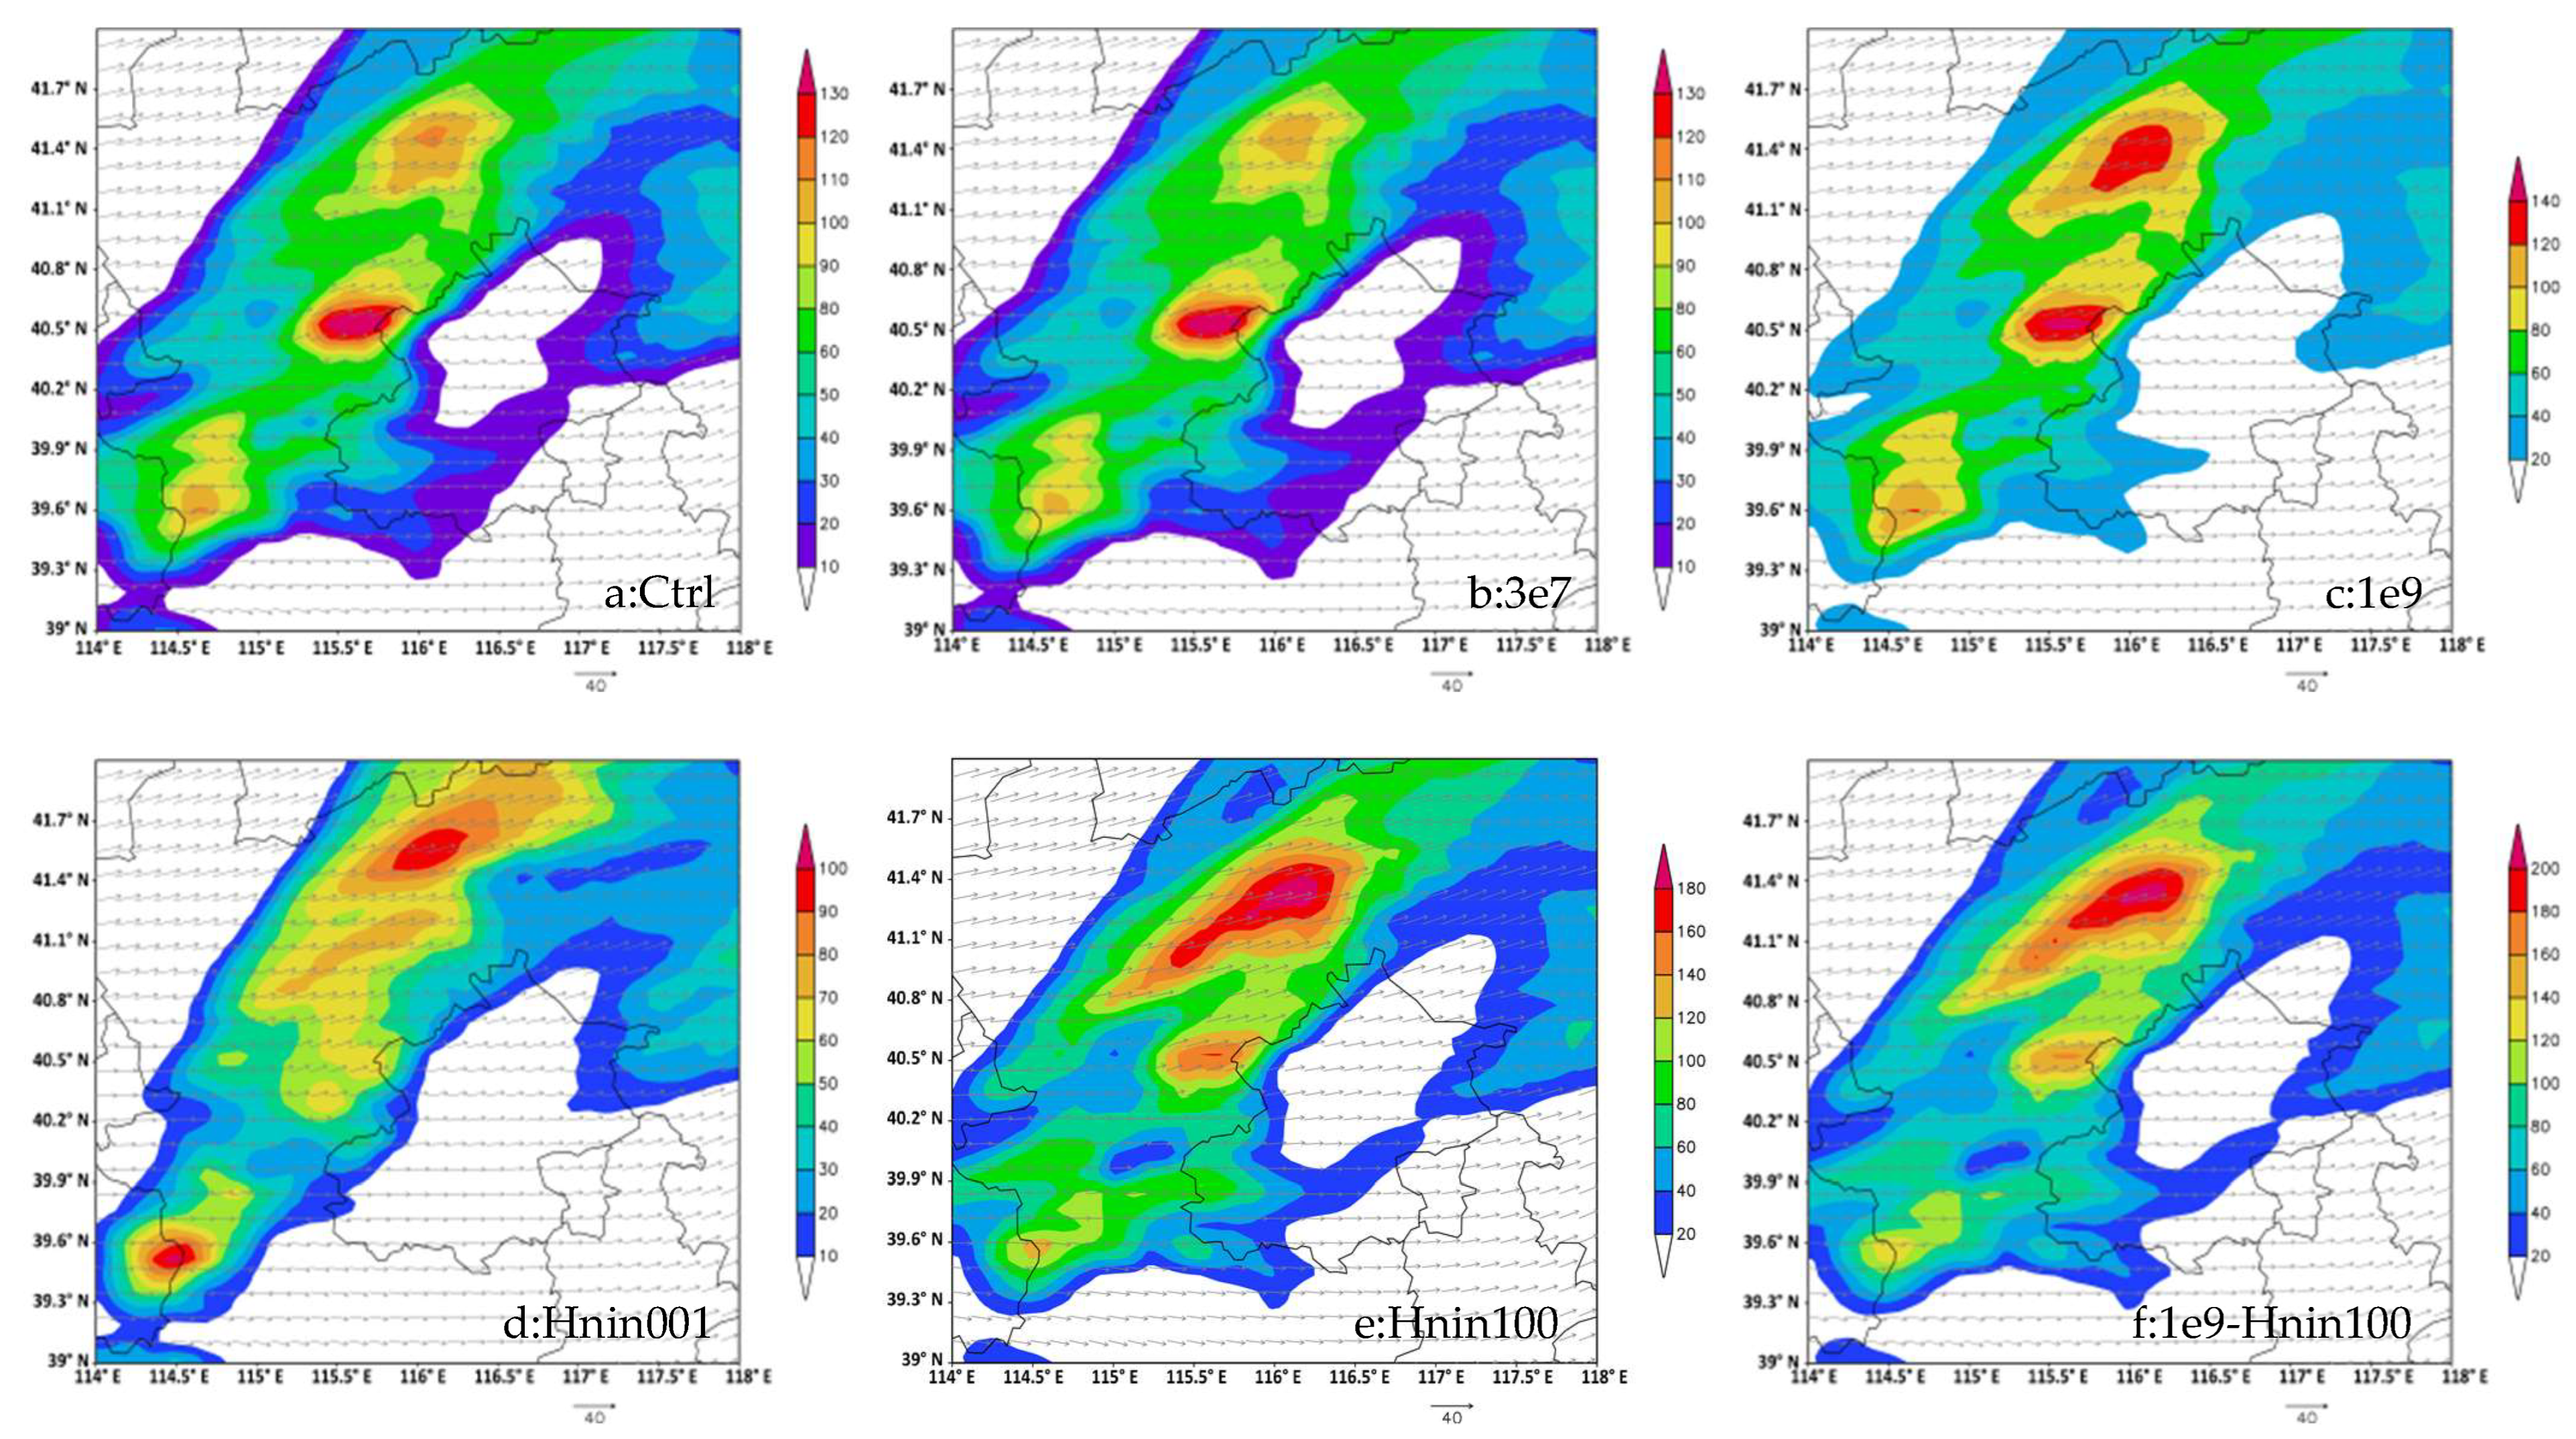
The total number concentration of precipitation particles was the sum of rain, snow, and graupel, as shown in
Figure 6. The total number concentrations in all six tests at a height of approximately 5 km exhibited three large value centers. In the Hnin001 test, snow particles were the lowest among all tests; their precipitation particles were also the lowest, being less than 100 L
−1, and particles more than 90 L
−1 were located in the south and north centers. Excluding the Hnin001 test, the largest concentrations of all other five test precipitation particles were more than 120 L
−1. The highest particles for precipitation were found in the Hnin100 test and 1e9-Hnin100 test. The smaller size of the precipitation particles resulted in less snowfall in these two tests, as shown in
Figure 3.
4.4. CN and NIN Influences on Artificial Seeding of Weather Modification
To analyze seeding effects under different CN and NIN conditions, ice crystals with minimum mass were added directly into clouds in the control, Hnin100, 1e9, and 1e9-Hnin100 tests to simulate a basic background, high IN or high CN, as well as the combination of high IN and CN. For all four tests, in the third domain, ice crystals of 100 L−1 concentrations were added to Ni at a temperature range of −5 °C–10 °C during 13:00 UTC and 13:12 UTC, and seeding locations extended from 40 N to 41 N and 115 E to 115.8 E.
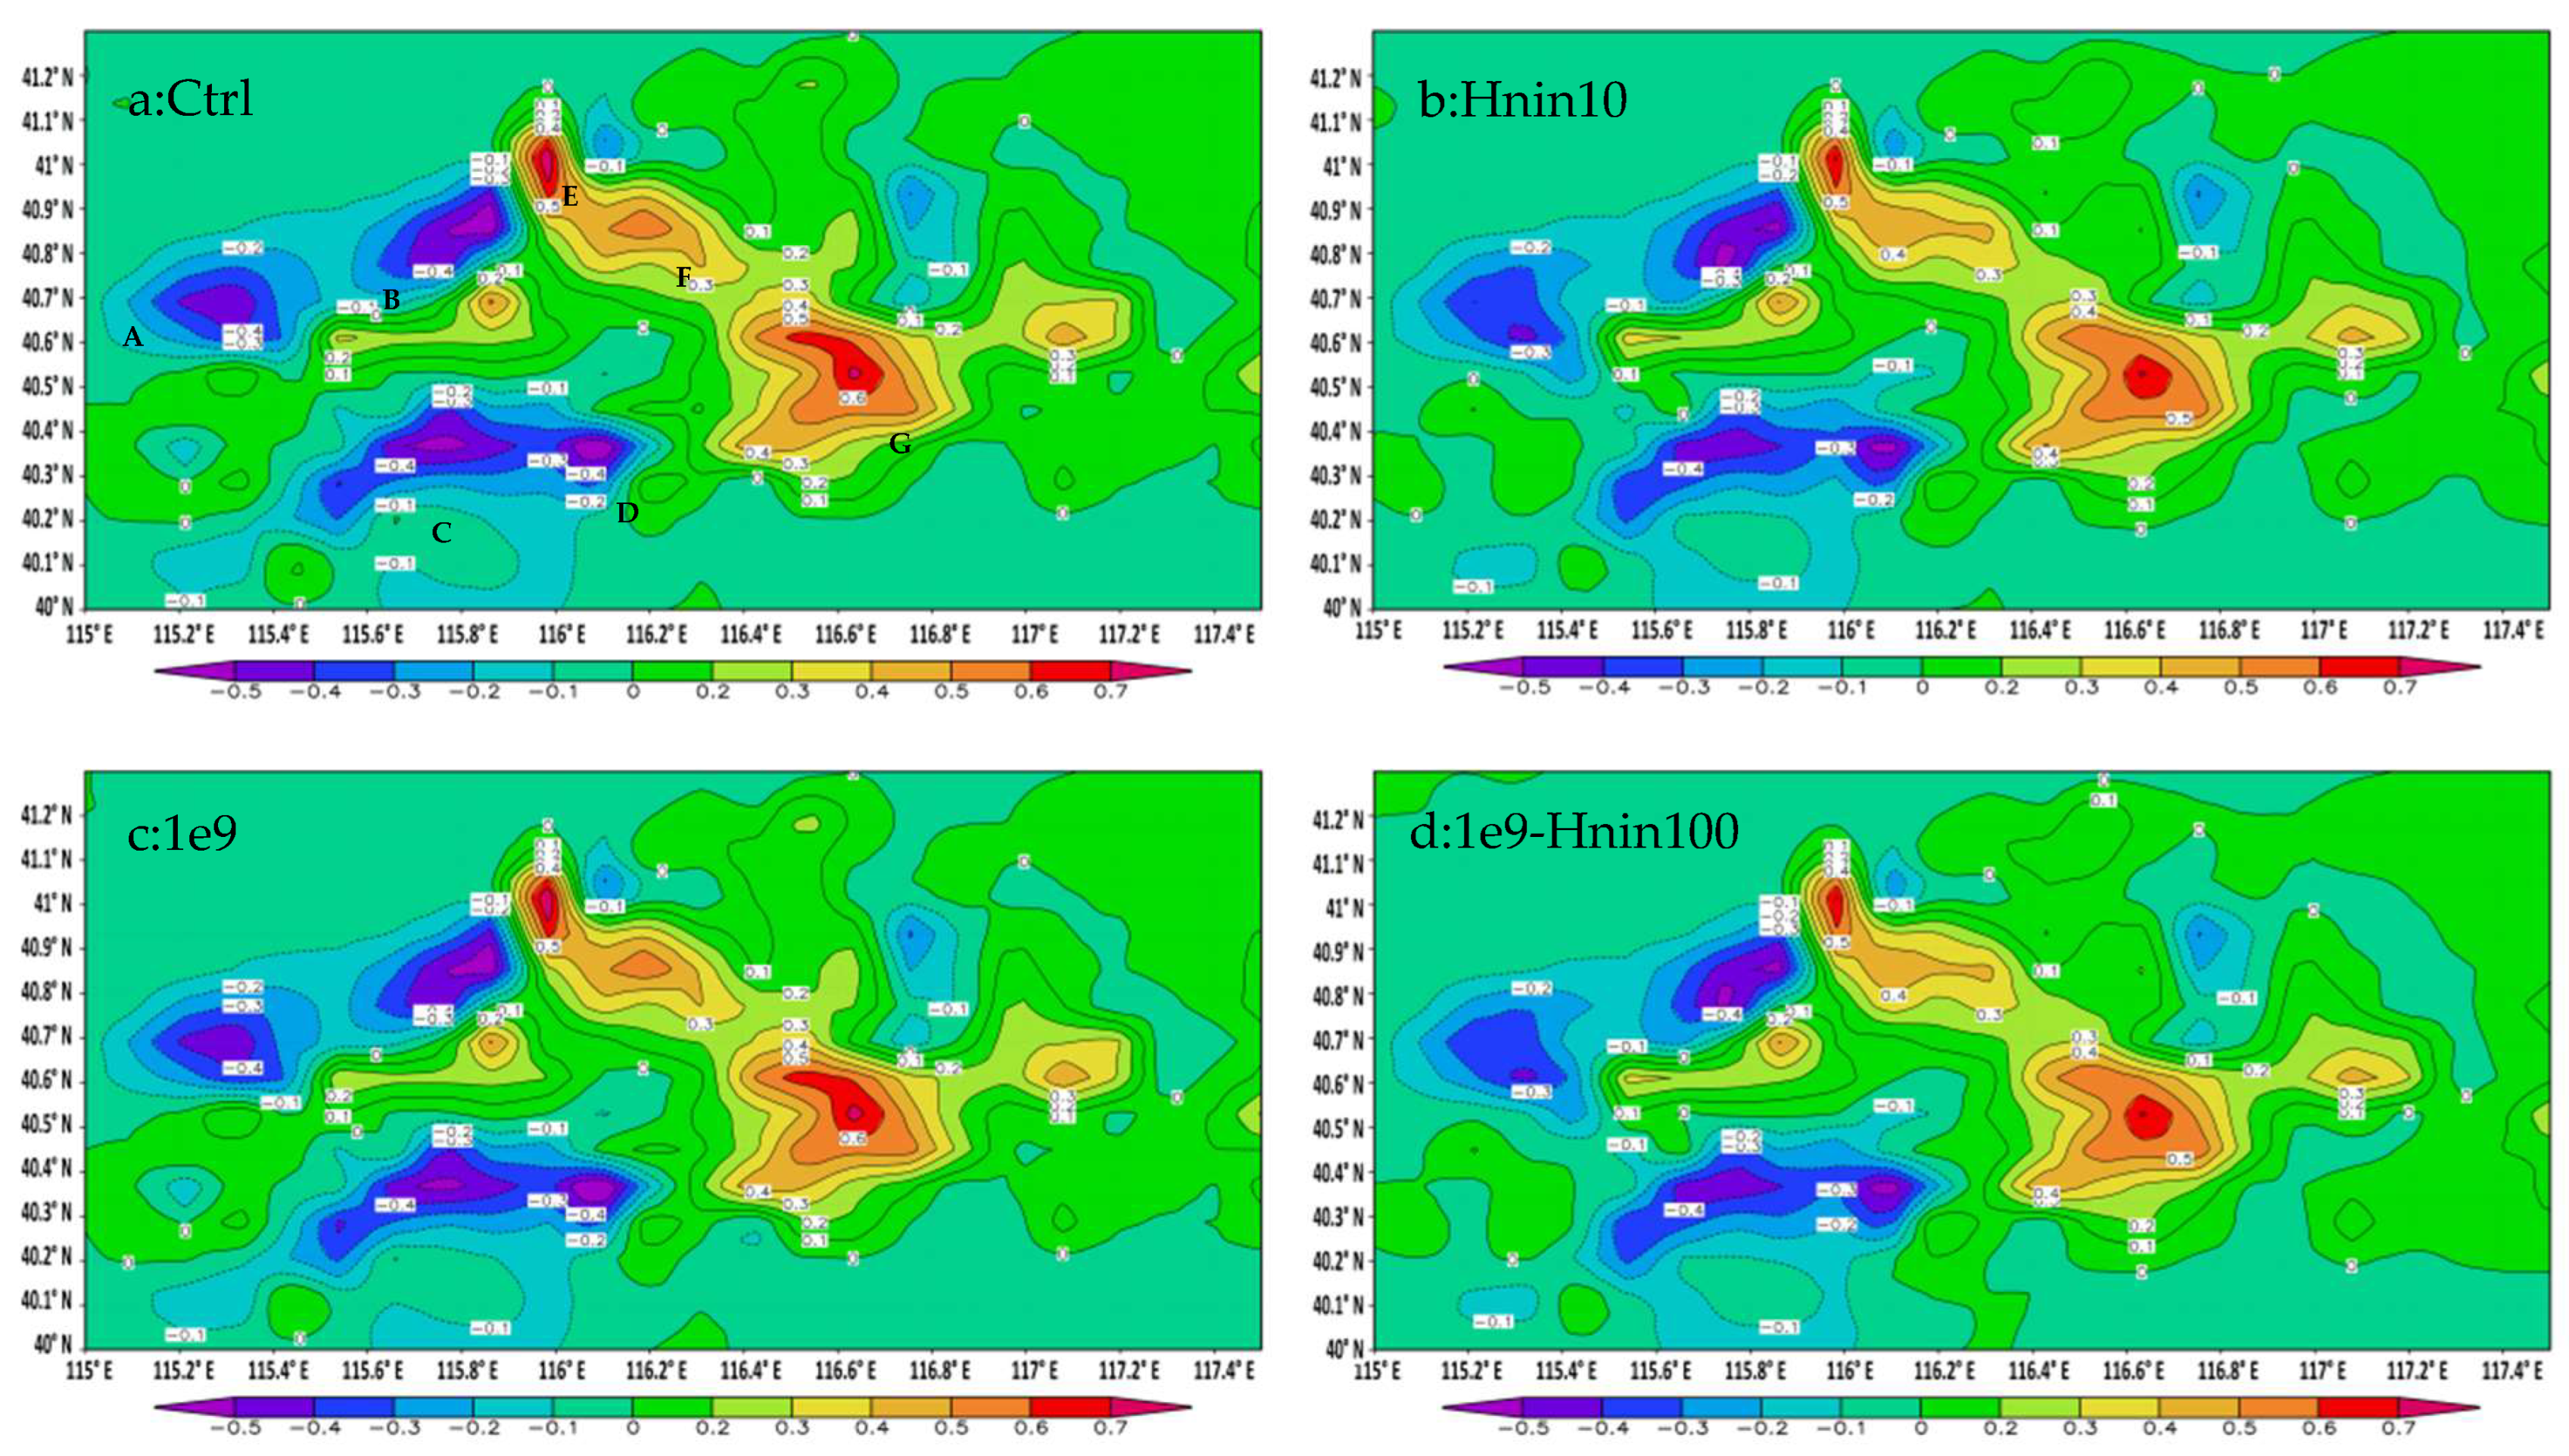
The daily precipitation deviations of seeding and without seeding (Ps-P) are shown in
Figure 7. There were multiple precipitation-increasing and precipitation-reducing centers in all tests of change of precipitation with seeding. A, B, C, and D are four decreasing centers, and E, F, and G are three increasing centers. For the maximum daily amount of 18 mm, the seeding effects for the seven precipitation change centers were −2.2% for center A; −2.8% for centers B, C, and D; 3.9% for centers E and G; and 2.8% for center F in the control test, as shown in
Figure 7a. For all tests, the locations of these centers for all four tests were nearly the same, and the peak values of these centers were also very close to each other.
Generally, the changes in precipitation with and without seeding in all four tests were similar; at the same time, there were differences in the distributions of precipitation among seeding simulations. The influences on the seeding effect were more obvious in the case of a large NIN compared to a large CN. With a larger NIN (Hnin100 test), the precipitation reductions of two northern centers A and B and two southern centers C and D were weaker than those of the control seeding. The covering areas of the −0.4 mm contour for A and the −0.5 mm contour for B and D were less than those of the control test, and the 0.5 mm reduction contour for C disappeared. In the Hnin100 test, there was no increase in center F; in increased center G, the area of 0.6 mm was 40% smaller than that in the control test. For centers C and F, the precipitation increased or decreased by 0.1 mm, which resulted in a change in the seeding effect of approximately 0.6%, a relative change of approximately 21.4% from the seeding effects of −2.8% and 2.8% of the control test for these two centers, and a relative change of approximately 14.1% from the largest grid seeding effect of 3.9% (centers E and G) for the entire domain, as shown in
Figure 7.
In the 1e9 test, there were no obvious differences from the control; the 1e9-Hnin100 test showed the seeding effect as in the Hnin100 test, exhibiting a smaller increase in precipitation for the increased centers and a reduced decrease in precipitation for the decreased centers.
In this snowfall case, NIN had a significant impact on the seeding effect. When NIN increased from 6.53 × 10⁻³ L−1 to 100 × 10−3 L−1, the seeding effect was significantly influenced, shifting by approximately 0.6% in some grids, causing the seeding effect to change from −2.8% in the control test to −2.2% in the Hnin100 test and 1e9-Hnin100 test for decreased center C as well as reducing the seeding effect from 2.8% in the control test to 2.2% in the Hnin100 test and 1e9-Hnin100 test for the F-increased center.
5. Summary
Aerosols can act as CCN or IN, both of which will directly affect the cloud drop number concentration and ice crystal number concentrations and will affect cloud microphysics properties and cloud and precipitation processes through their roles in nucleating clouds and ice particles. It is important to study atmospheric aerosol effects on cloud and precipitation processes and cloud-seeding effects as aerosol increases.
In this study, numerical simulations of a snowfall case in Beijing were conducted using the CAMS two-moment explicit cloud scheme and the WRF model. The CAMS scheme predicts the particle number concentration and mixing ratio of cloud water, rain, ice, snow, graupel, and hail except Nc. According to the observed natural IN concentration with the Bigg cloud chamber in the 1960s and 1990s in Beijing and on the basis of cloud drop concentration at the cloud base, five sensitivity and control tests were designed to study the effects of different parameters of CN and NIN of the Pvi process on cloud and precipitation processes and weather-modification seeding effects.
Both CN and NIN affected snowfall amount and distribution. With reducing CN in the 3e7 test, snowfall increased in most areas. Snowfall seemed to be inversely proportional to NIN, with NIN reduction to 0.001 × 10⁻³ L−1 in the Hnin001 test, with a relatively large-scale snowfall increase occurring. With higher concentrations of CN and NIN, snowfall was reduced, and as a result of the combined impact of increased NIN and CN as an air pollution environment, the amount of snowfall decreased in wide areas; its maximum snow reduction even exceeded 2.7 mm, up to 15% from the total amount of 18 mm, with only a very small area where a 0.6 mm snowfall increase occurred.
CN and NIN not only affected snowfall but also affected the distributions of water substances. With less CN, the cloud mass contents were much lower, but CN had little effect on ice and snow water substances. NIN significantly changed the number concentrations of ice crystals and snow. With larger ice nuclei, more ice crystals were nucleated, and more snow particles were generated through the autoconversion microprocess of ice crystals to snow. The impacts of NIN on ice crystals were more obvious than those on snow particles.
NIN impacted the seeding effect in this snowfall case. A large NIN reduced the seeding effect, and there was less increased precipitation in the increased centers and less decreased precipitation in the decreased centers. When NIN increased from 6.53 × 10⁻³ L−1 to 100 × 10−3 L−1, the seeding effect shifted by approximately 0.6% at some grids, which was a relative 14.1% effect change from the 3.9% seeding effect of the control test.
Sensitivity simulations of NIN and CN affect cloud and precipitation and seeding effects, and it is necessary to consider the aerosol influence not only on clouds and precipitation but also on seeding effects of weather-modification activities.


