Article

The Spatio-Temporal Onset Characteristics of Indian Summer Monsoon Rainfall and Their Relationship with Climate Indices

1
Department of Geography, Delhi School of Economics, University of Delhi, Delhi 110007, India
2
Delhi School of Climate Change & Sustainability, Institution of Eminence, University of Delhi, Delhi 110007, India
3
Centre for Atmospheric Science, Indian Institute of Technology, Delhi 110016, India
4
Centre for Climate Research Singapore, Meteorological Services Singapore, Singapore 537054, Singapore
5
Application Laboratory, Japan Agency for Marine-Earth Science and Technology (JAMSTEC), Yokosuka 2360001, Japan
*
Author to whom correspondence should be addressed.
Atmosphere 2022, 13(10), 1581; https://doi.org/10.3390/atmos13101581
Submission received: 20 August 2022 / Revised: 14 September 2022 / Accepted: 23 September 2022 / Published: 28 September 2022

Abstract

:
Regional variations of monsoon onset dates across India were analyzed for 67 years (1951–2017) under different modes of climate variations, i.e., El Niño, La Niña, and the Indian Ocean Dipole (IOD), along with flood and drought years using the objective method and statistical techniques. Monsoon onset analysis revealed that the northern, northeastern, and southern parts were highly susceptible to the early onset of La Niña, and the northern and northern northwest parts were highly susceptible to the early onset of El Niño. The onset dates were early (late) in the sub-regions of the central, southern, and northeastern (northern, northwestern, and western) parts of India during flood (drought) years. Further, onset dates in flood years occurred earlier than those in La Niña years, and onset dates in drought years were later than those in El Niño years. The onset occurrence probability and influence of the synoptic events are discussed. This research could help in understanding the onset of monsoon and its predictability for societal applications.

1. Introduction

The southwestern monsoon onset (onset) date for different regions of India plays an important role in different sectors of socio-economic concern. Due to the variation in the onset dates in India, a very large size of the population involved in agriculture and allied activities is often affected [1]. The fragility of especially economically weaker states increases due to variability in onset [2]. The very general behaviour and inherent intricacies of monsoon onset have been studied by [3], and the long-term trend of monsoon rainfall was studied by [4] for five homogenous monsoon regions in India. Concerning the different modes of climate, late and early onsets in India are strongly influenced by El Niño-Southern Oscillation (ENSO)-driven changes in the meridional tropospheric temperature over the southern Asian monsoon region. For example, onset can be delayed by nine days, and withdrawal can advance by 10 days during El Niño years as compared to La Niña years [5]. Due to the influence of ENSO and the trend in Indian Ocean warming, it gives a sense of surety that the abnormality in the onset dates and rainfall amount is going to intensify, and this interesting phenomenon needs proper and deeper investigation [6].
The regional variation in the onset dates and magnitude of anomalous onset times during different modes of climate variations is a better way of understanding the sensitivity of the region concerning monsoon onset. Even if floods/droughts are consequences of monsoon onsets, the strong connection between early onset with floods and late onset with drought is a well-known fact in India, and not all flood and drought events are linked to modes of climate variations [7,8]. Hence, the inclusion of independent flood and drought years (considering the years with the absence of any of the modes of climate variations) in the present study is to understand the spatio-temporal onset characteristics of the Indian summer monsoon under different conditions.
We understand that during the process of the northward movement of the southwestern monsoon, onset in different sub-regions (SRs) (Figure 1) is influenced by ENSO and Indian Ocean Dipole (IOD)-like phenomena [9,10,11,12,13]. Monsoon Intra-Seasonal Oscillation (MISO) is one important player in the intra-seasonal variability in monsoon rainfall, and considering the context of the present study, it has a strong relationship with the onset of monsoons [14]. The frequency of MISO (active and break periods of monsoons) varies from year to year, and it is one very important property of quasi-periodicity [15,16]. The frequency and duration of MISO under different modes of climate variations are complex [17,18]. Given this, we also considered it a constant quasi-periodic player for the period 1951–2017. However, [19] found that Madden-Julian Oscillations (MJO) could be linked to delayed and early onset, though further studies are required to understand their influence on the onset over the SRs of India. It is evident from previous studies that variability in the onset is caused by intra-seasonal variability and MJO besides ENSO, and other modes of climate variations play a role. In a recent series of studies by [20,21,22], the role of the Atlantic Zonal mode (AZM) was discussed, and its influence over the central part and some parts of Western Ghats rainfall were highlighted. In addition, [21] highlighted that the relationship of AZM with rainfall over India is not widespread and is limited to some parts of India only. Moreover, the limited role of AZM and its role across India is influential in non-ENSO years and very small in comparison to that of ENSO.
In many important studies, onset in Kerala has always been the reference point for onset for the whole of India as it marks the beginning of the rainfall season in India [24,25]. The general monotonic trend of monsoon rainfall is significantly decreasing in Kerala [26]. Onset in Kerala has never been a perfect signal of onset across the country, and sometimes ‘bogus’ onset (double onset) phenomena create confusion in discerning the actual onset [27,28,29]. There is almost a void in the concept of the onset day and the method for onset date calculation in India. This is due to the availability of an objective method to determine onset over Kerala only and its absence for other parts of India. Ref. [30] followed the method used by [31], which is based on the cumulative rainfall crossing a threshold limit. In a recent study by [32], threshold-based criteria for determining the onset of monsoon were used, and the whole of India was divided into three major divisions and one micro division to get the results of the onset at a grid point scale [32]. For a long time, the India Meteorological Department (IMD) declared the onset dates based on abrupt changes in various parameters, and this method was categorized as subjective [25,33]. It was only in the year 2006 that the IMD adopted a new objective criterion for declaring the onset in Kerala [34].
There are many methods available for calculating the onset, and they differ from each other based on different factors [25,31,32,35]. Multiple parameters over the Asia–Pacific region were used by [36] to determine the onset in Kerala, and they developed a model using principal component regression for the prediction of the onset. However, Ref. [37] discussed the method provided by [36], and later the same method was adopted by the IMD. Therefore, with a lot of methods available, the one which can give the most accurate estimate of the monsoon onset will be highly reliable.
The method of onset determination [38] given in the research report (RR-124) of the Indian Institute of Tropical Meteorology (IITM) has some advantages over others as it focuses on multiple parameters instead of one at the regional as well as the global scale to determine the onset. Two indices, i.e., the Local Hydro-Meteorological Index (LHMI) and General and Regional Atmospheric Circulation Intensity Index (GARACII), are used for each of the 19 SRs in India. The number of SRs and their boundaries were obtained from the research report. India was divided into 19 SRs [23] based on six factors. The factors considered to delineate the SRs in India are topographic features, the pattern of mean annual and monsoon-season rainfall, physiographic features (e.g., coast, plain, desert, plateau, among others), the pattern of drainage, normal date of onset and withdrawal of monsoon across India, and daily rainfall grid data (1° × 1°) provided by the IMD [23]. Hence, this method is used in the present study to determine the monsoon onset date for different sub-regions of India.
The aim of this work is to calculate and analyze the SR-wise onset at the pan India scale for exploring the role of different modes of climate variations along with the flood and drought years. It should be noted here that the onset of monsoon in this study is the factor of flood/drought years and other modes of climate variations. Therefore, years with different modes of climate variations are discussed as the cause of the early/late onset of monsoons.

2. Materials and Methods

With many advantages of the IITM’s method, onset in different SRs is treated completely independent of the trough movement from the day of onset in Kerala. With the use of the IITM’s method, monsoon onset over the extreme southwestern peninsula of India is declared after achieving the specified threshold of the LHMI and GARACII. The calculated threshold value is based on the climatological onset of monsoons over different SRs. The IITM’s research report had the onset dates calculated for all 19 SRs using 1° × 1° observed gridded rainfall and 2.5° × 2.5° reanalyzed data. However, we added 10 more years (2008–2017) and calculated the data for 1951–2017 using a relatively high resolution (0.25° × 0.25°) of the rainfall data. Based on a comparison of the previous onset date with the present, an average difference of +0.5 days (late onset) was found for India as a unit, and the difference could be due to the higher resolution of rainfall data (0.25° × 0.25°) [39] used in the present study.

2.1. Data

To achieve the aims of the current study, we used the daily basic data of different variables (Table 1). The list of different monsoon years of flood, drought, La Niña, and El Niño was provided by the IITM (https://mol.tropmet.res.in/monsoon-interannual-timeseries/ (accessed on 14 September 2022)) and used by [40], based on the SST anomalies in the Niño 3.4 region and homogenous Indian rainfall dataset. The data of positive and negative IOD years were obtained from the Bureau of Meteorology (BOM), Australian Government, and they were maintained for the period after 1960.

2.2. Determination of Monsoon Onset

To obtain the onset in each SR, a combination of the LHMI and GARACII thresholds for each SR was obtained as explained in the technical report of the IITM [38]. As per the requirement of the objective of the present research study, we followed the steps as detailed below:
Step 1: The calculation of the SR-wise threshold limit of the LHMI, i.e., 1.
Step 2: Obtaining the threshold of the GARACII for each SR.
Step 3: Determining the onset dates for each SR based on both conditions given in Steps 1 and 2 above.
Step 4: The exercises discussed in Step 3 were repeated for all years from 1951 to 2017.
The mean of normal years was calculated by taking the average of all the years between the period 1951 and 2017 excluding El Niño years (12 event years) and La Niña years (11 event years), making a total of 44 normal years for the mean. The anomaly for El Niño (La Niña) was obtained by removing the mean of normal years from El Niño (La Niña) event years. This scheme was followed in the case of positive and negative IOD as well as flood and drought. All years characterized as flood years, drought years, La Niñas, El Niños, positive IODs, and negative IODs were uniquely identified. The years with the co-occurrence of La Niñas, El Niños, positive IODs, and negative IODs with each other were excluded from the scope of the present study. The SST-related modes of climate variations are important, but not all onsets can be explained by ENSO- and IOD-related SSTs. Therefore, we considered floods and droughts as two independent categories for the analysis because it is known that early/late onsets lead to floods and droughts irrespective of their concurrences with ENSO and IOD for all the SRs of India. However, some of their co-occurrences of flood and drought could not be avoided, which might have some confounding effects on onset dates.

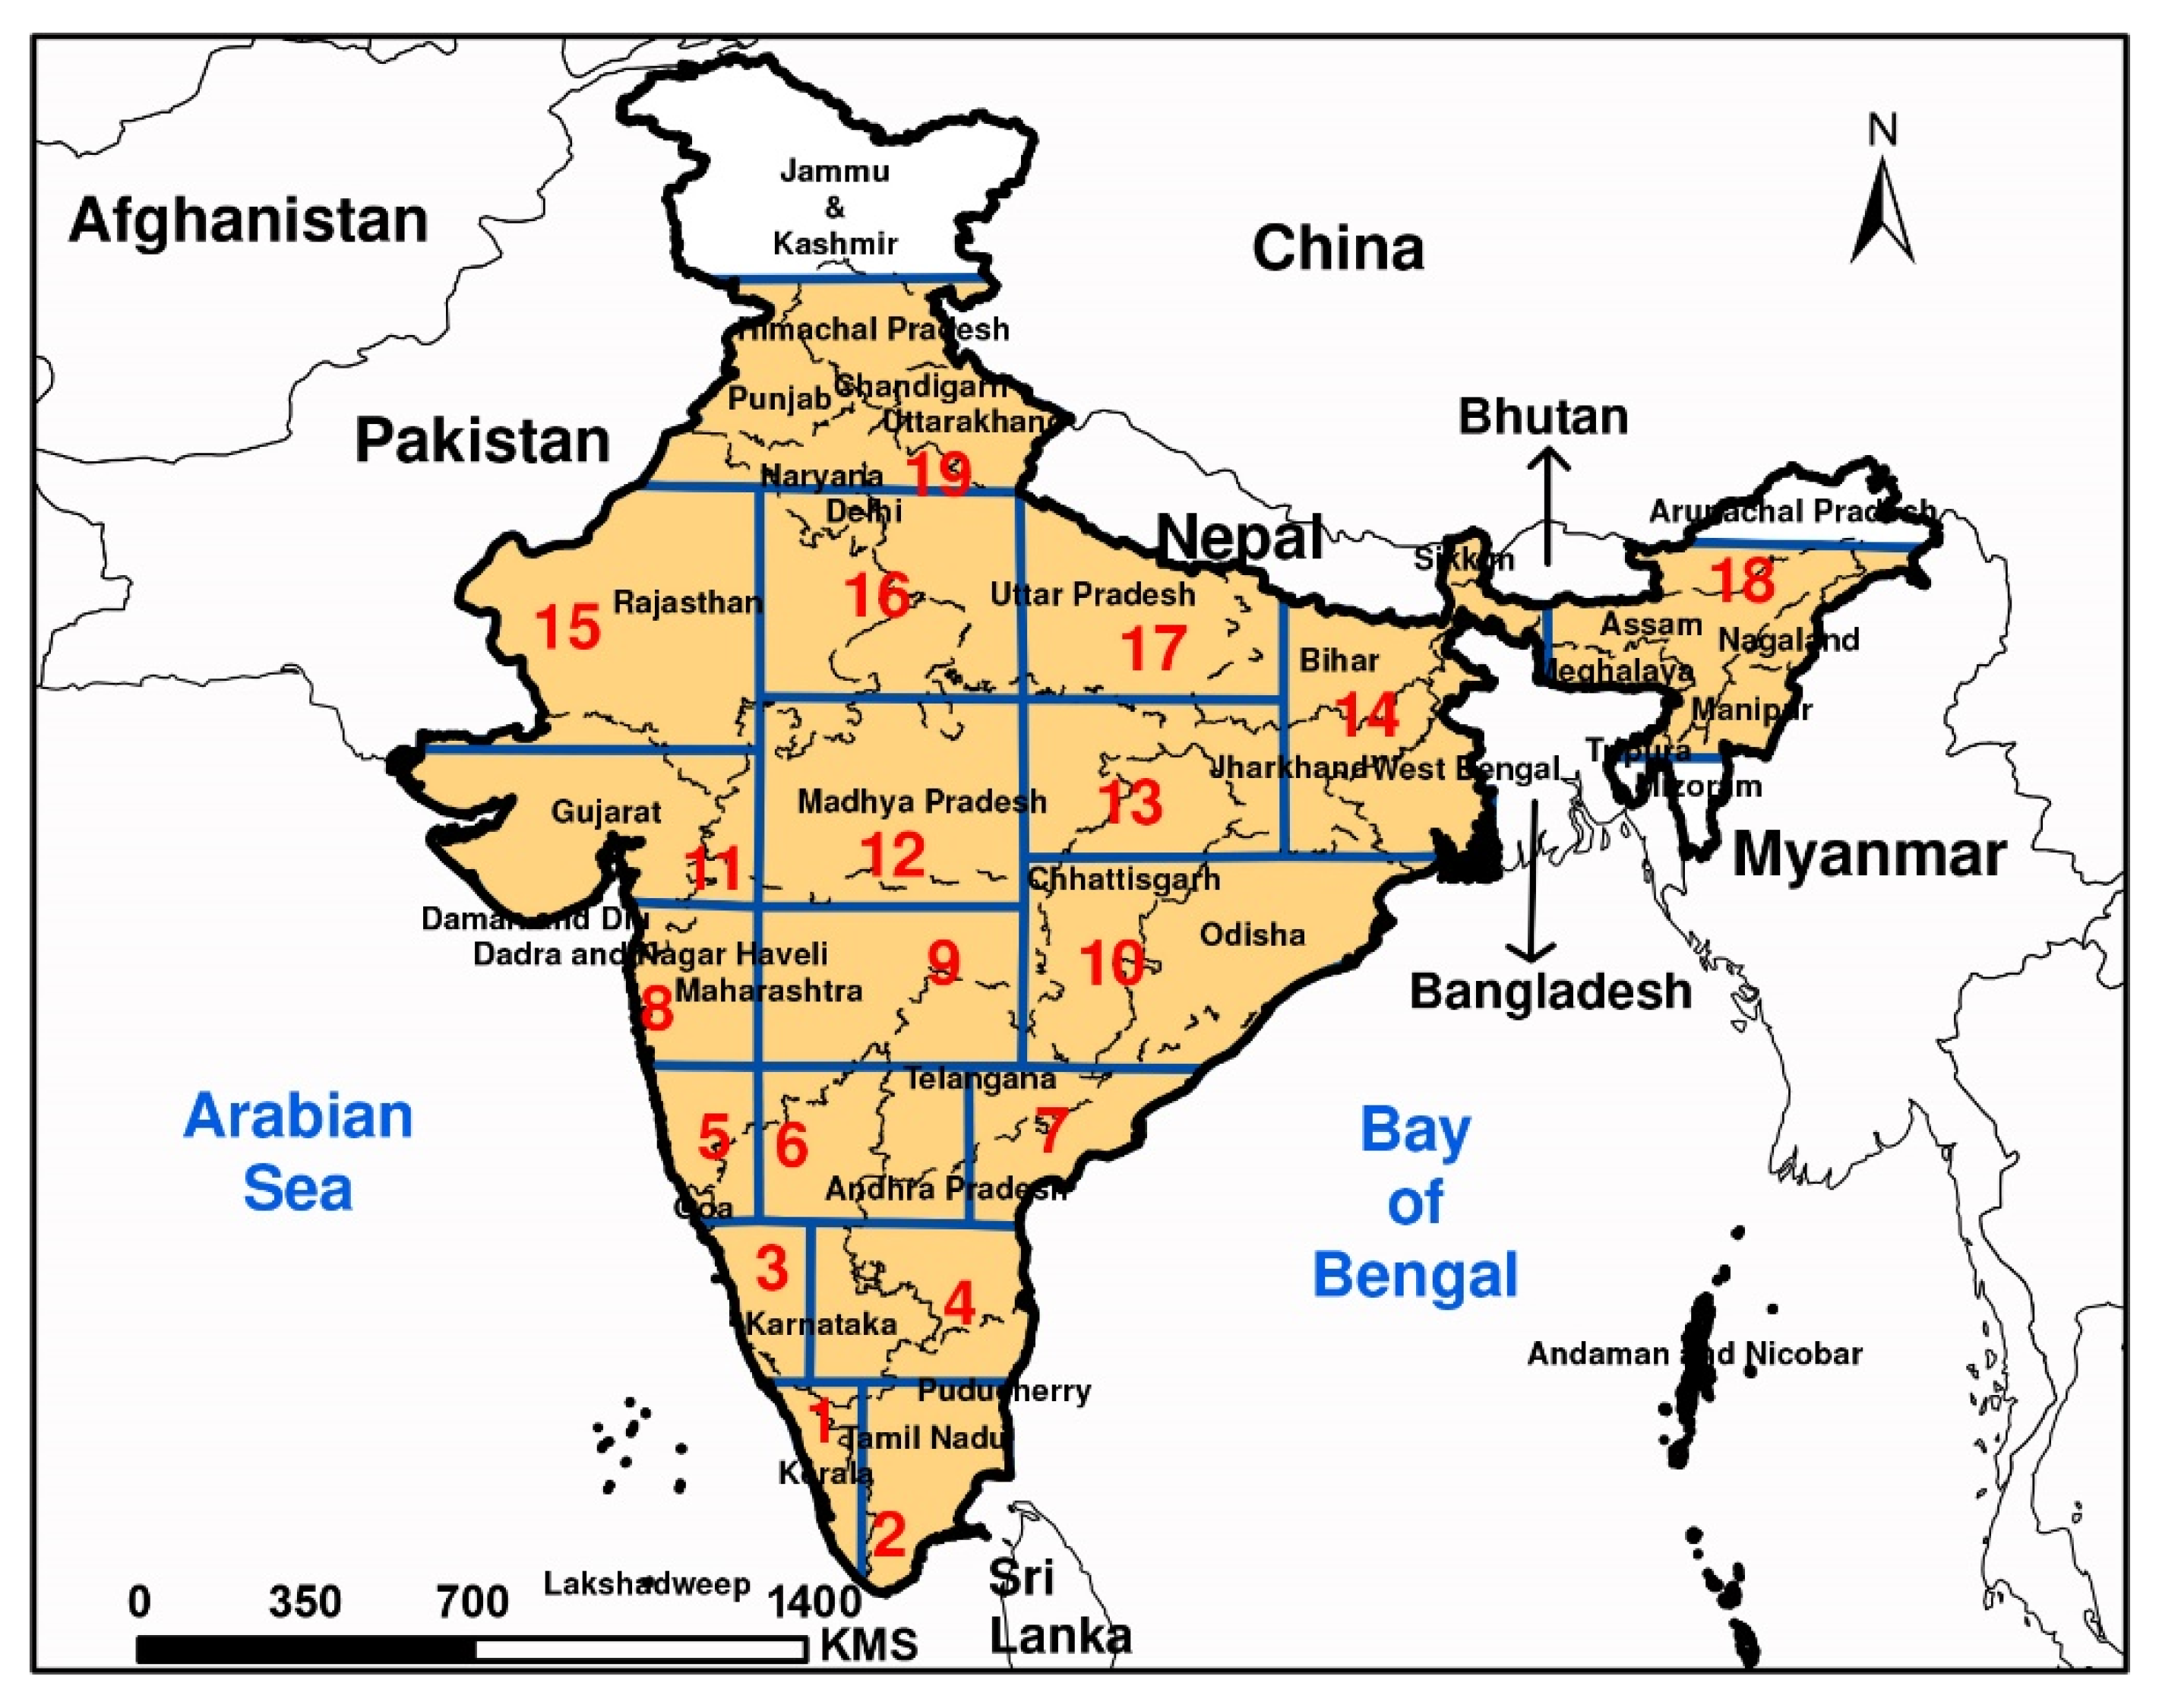
2.3. Spatial Variation and Analysis of Onset

To investigate the variation in onset dates and to find the most probable date of onset, we calculated the standard deviation (σ) and percentiles at different levels, i.e., 40th, 60th, and 80th percentiles (Figure 2). We started the level of the percentiles with an interval of 20, initiating with the 40th percentile, as it may not coincide with the mean expected with the 50th percentile. Percentiles were adopted in many previous studies as a method to find out the confidence in the occurrence of an event. The function is an important measure to calculate the occurrence probability of a particular incident. Therefore, 31 May as the value of the 60th percentile means a 60% chance of the occurrence of a particular onset date on 31 May or before. For the 60th percentile, it can be explained simply by arranging all data values in ascending order as per their rank, and 60% from the start will be part of the 60th percentile.

3. Results

India is a vast country and therefore, differences in onset dates are natural when comparing regions in different geographical locations. The onset dates in each SR of India (Figure 1) were analyzed for different modes of climate variations as well as independent flood and drought years. It can be seen that not all flood and drought years are linked with the modes of climate variations (Table S1).

3.1. Modes of Climate Variations
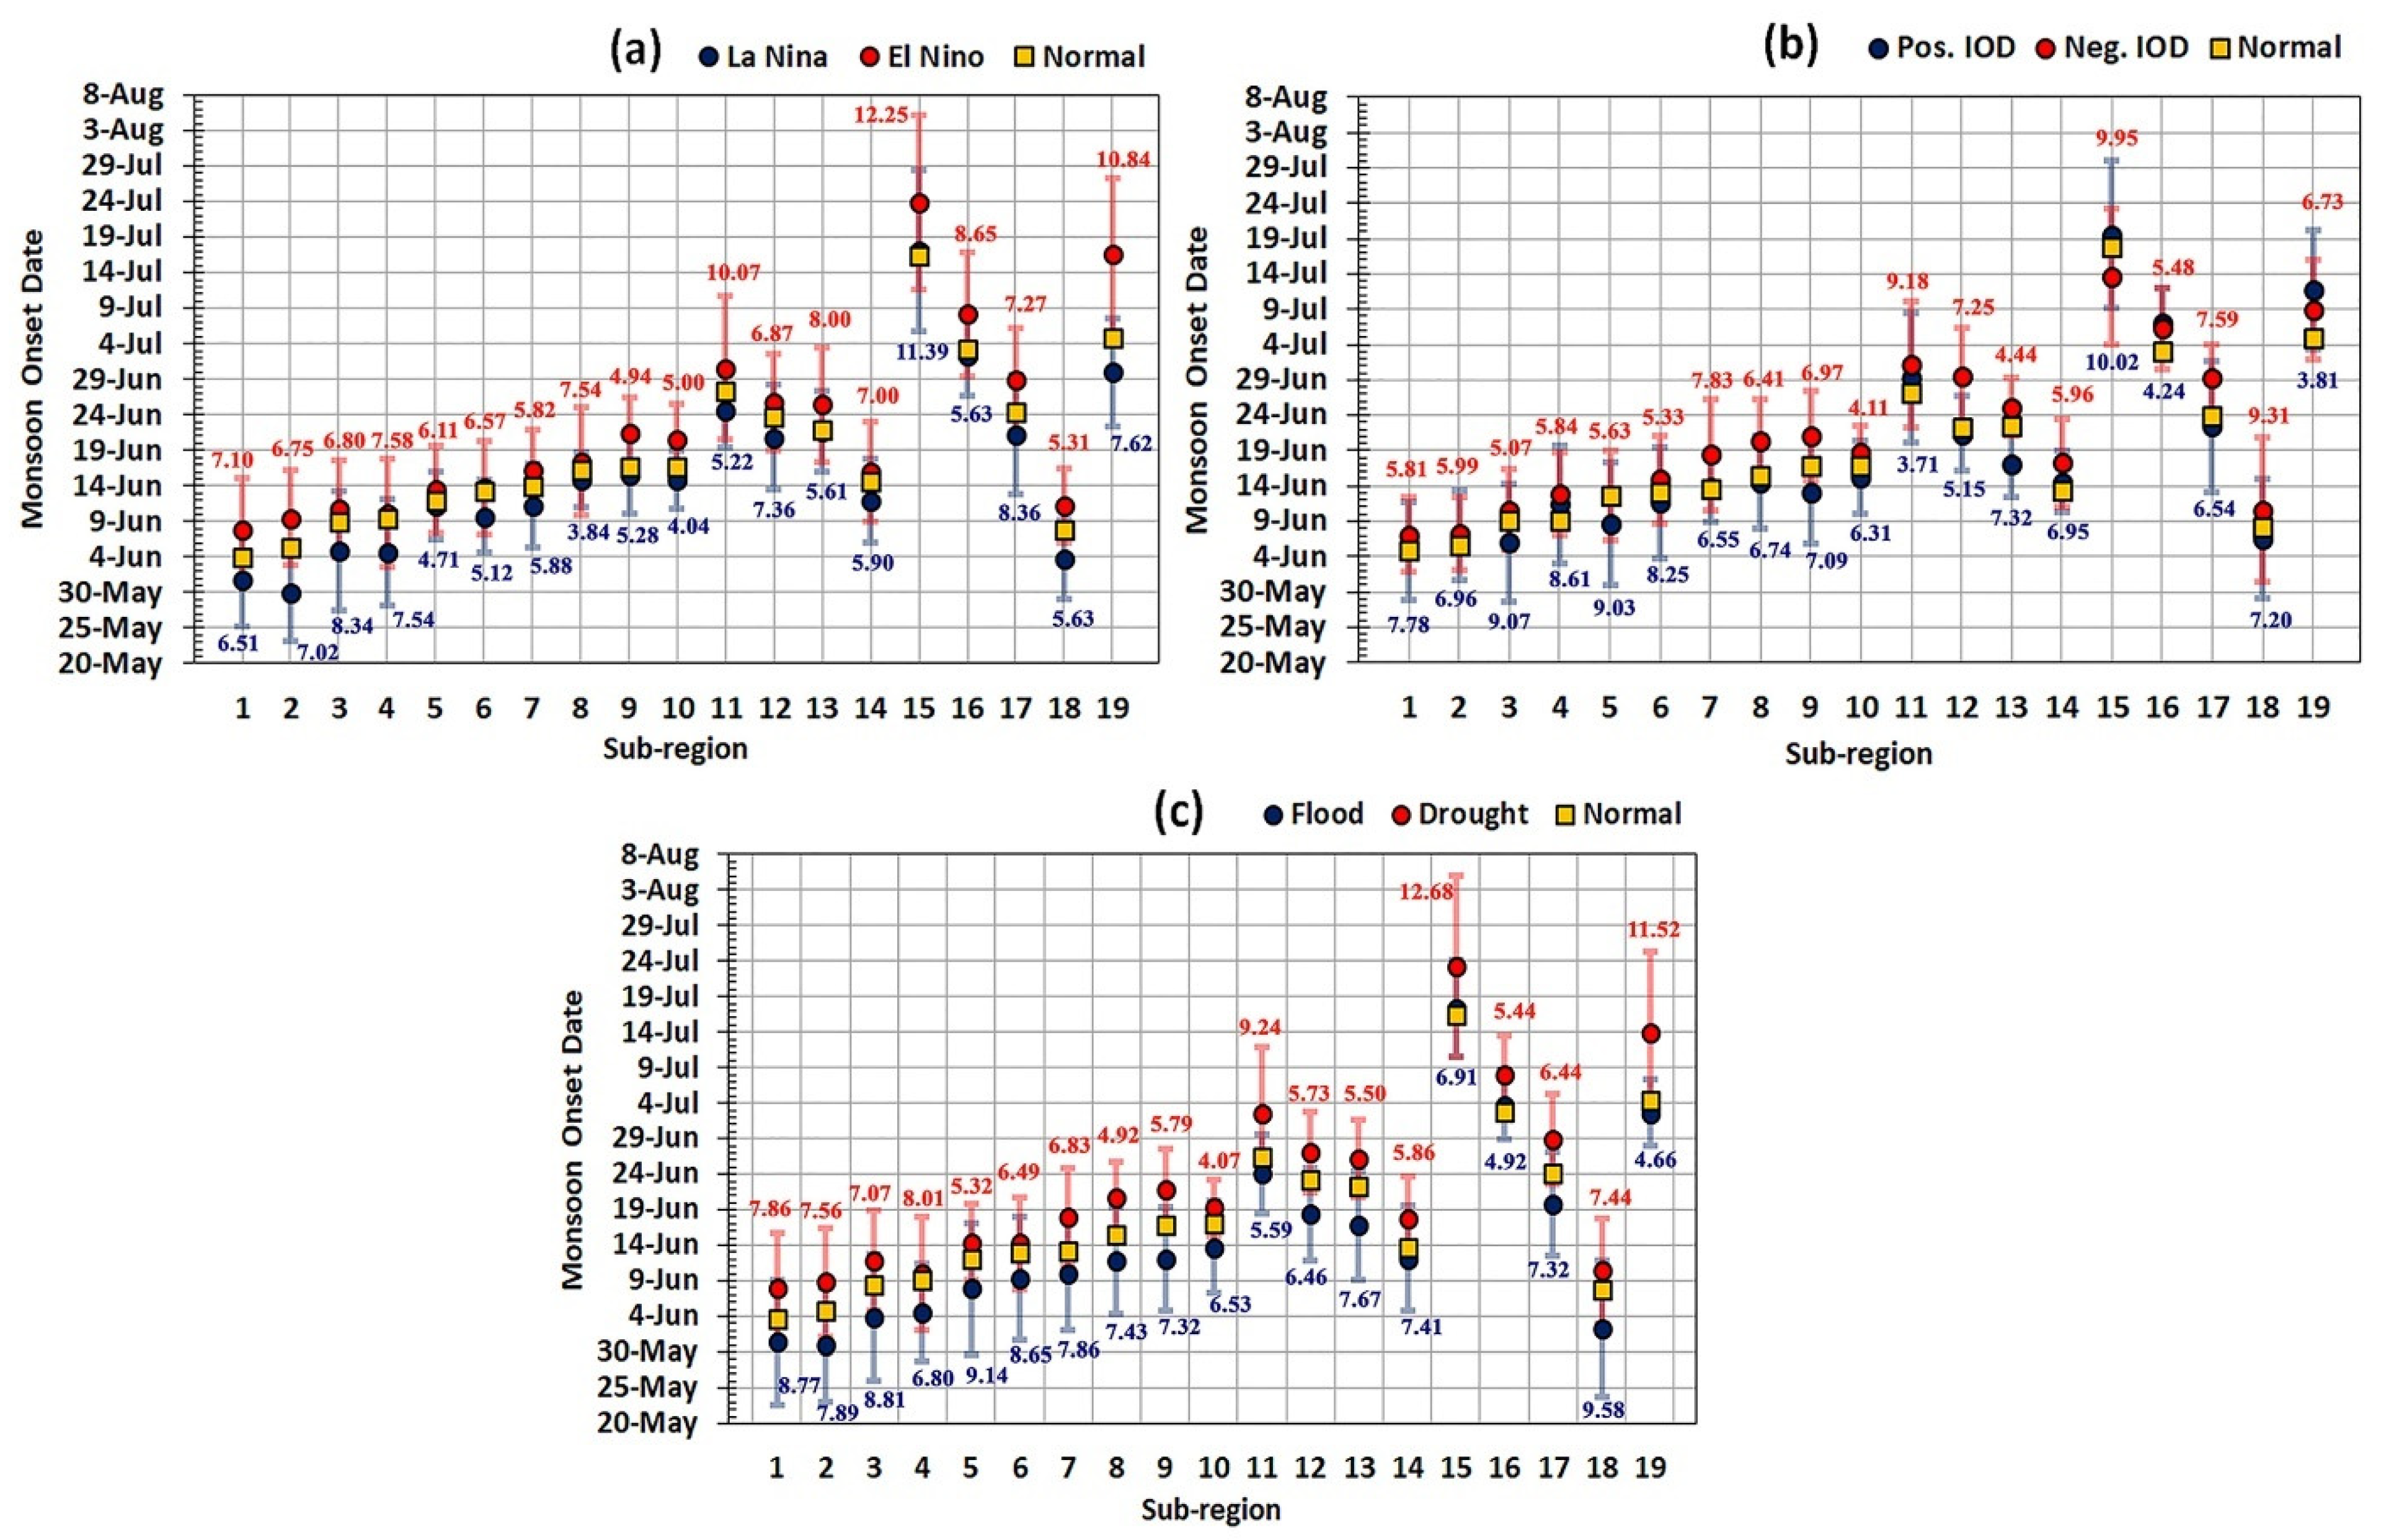
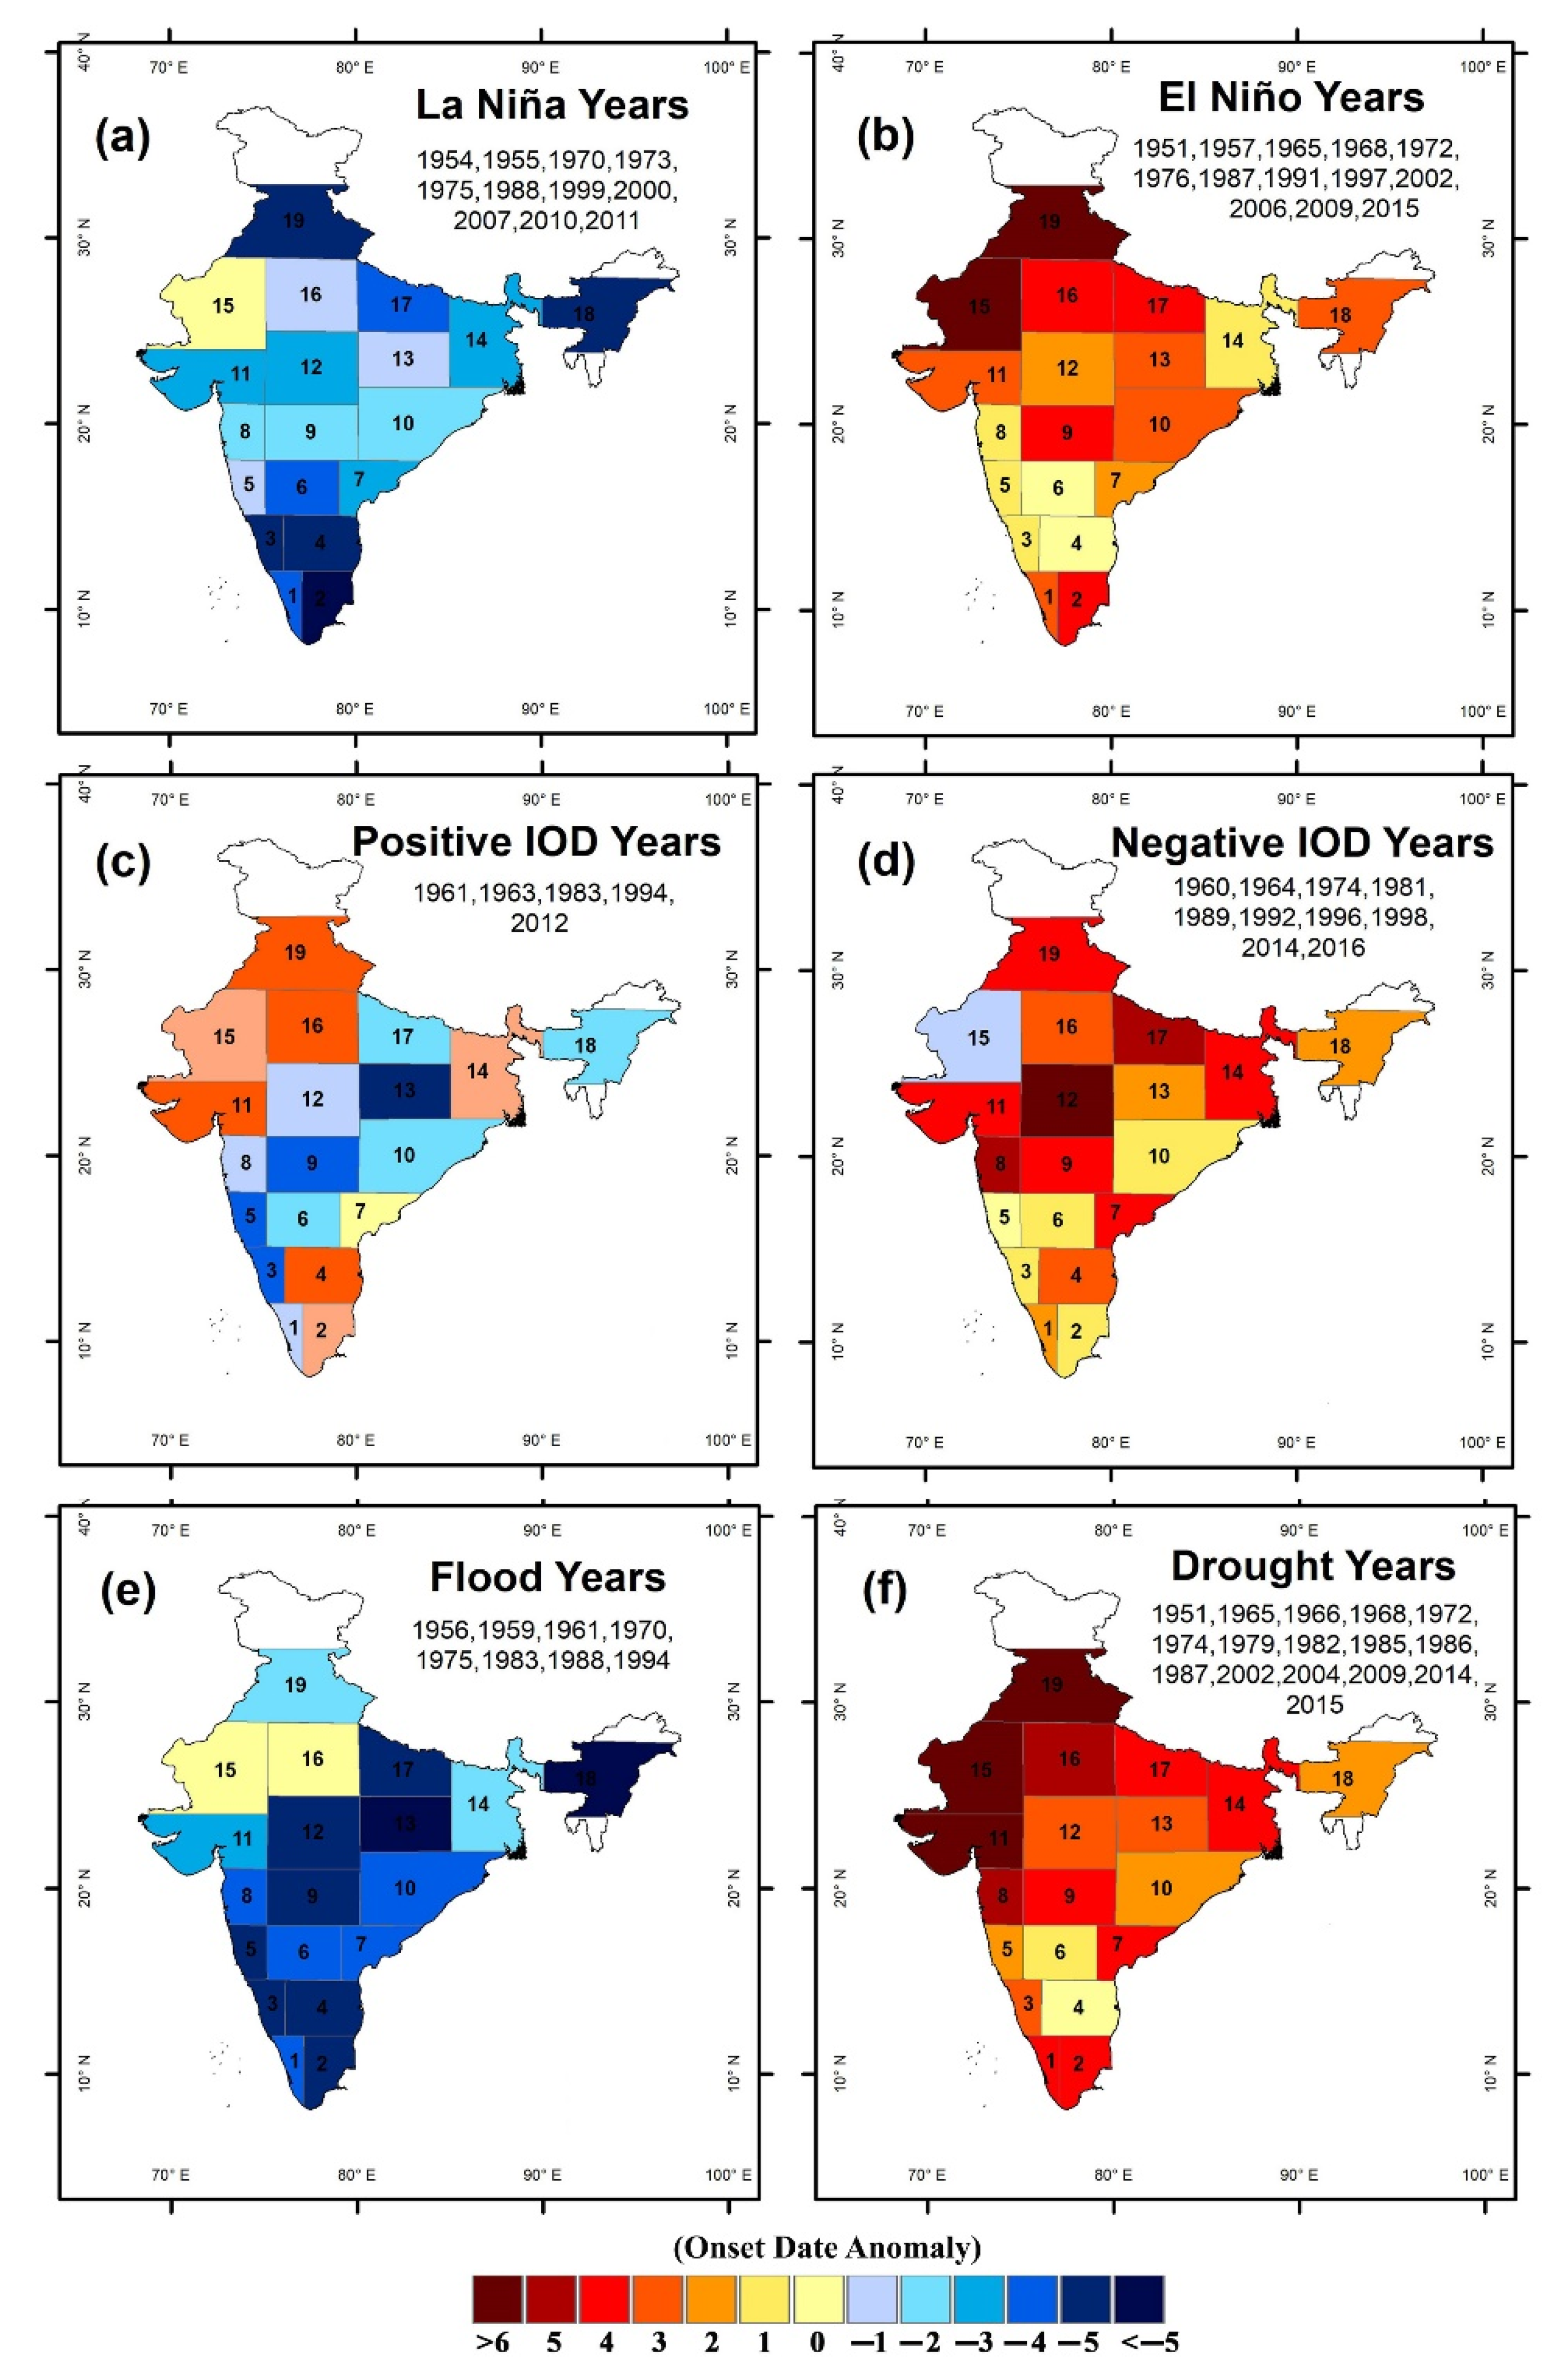
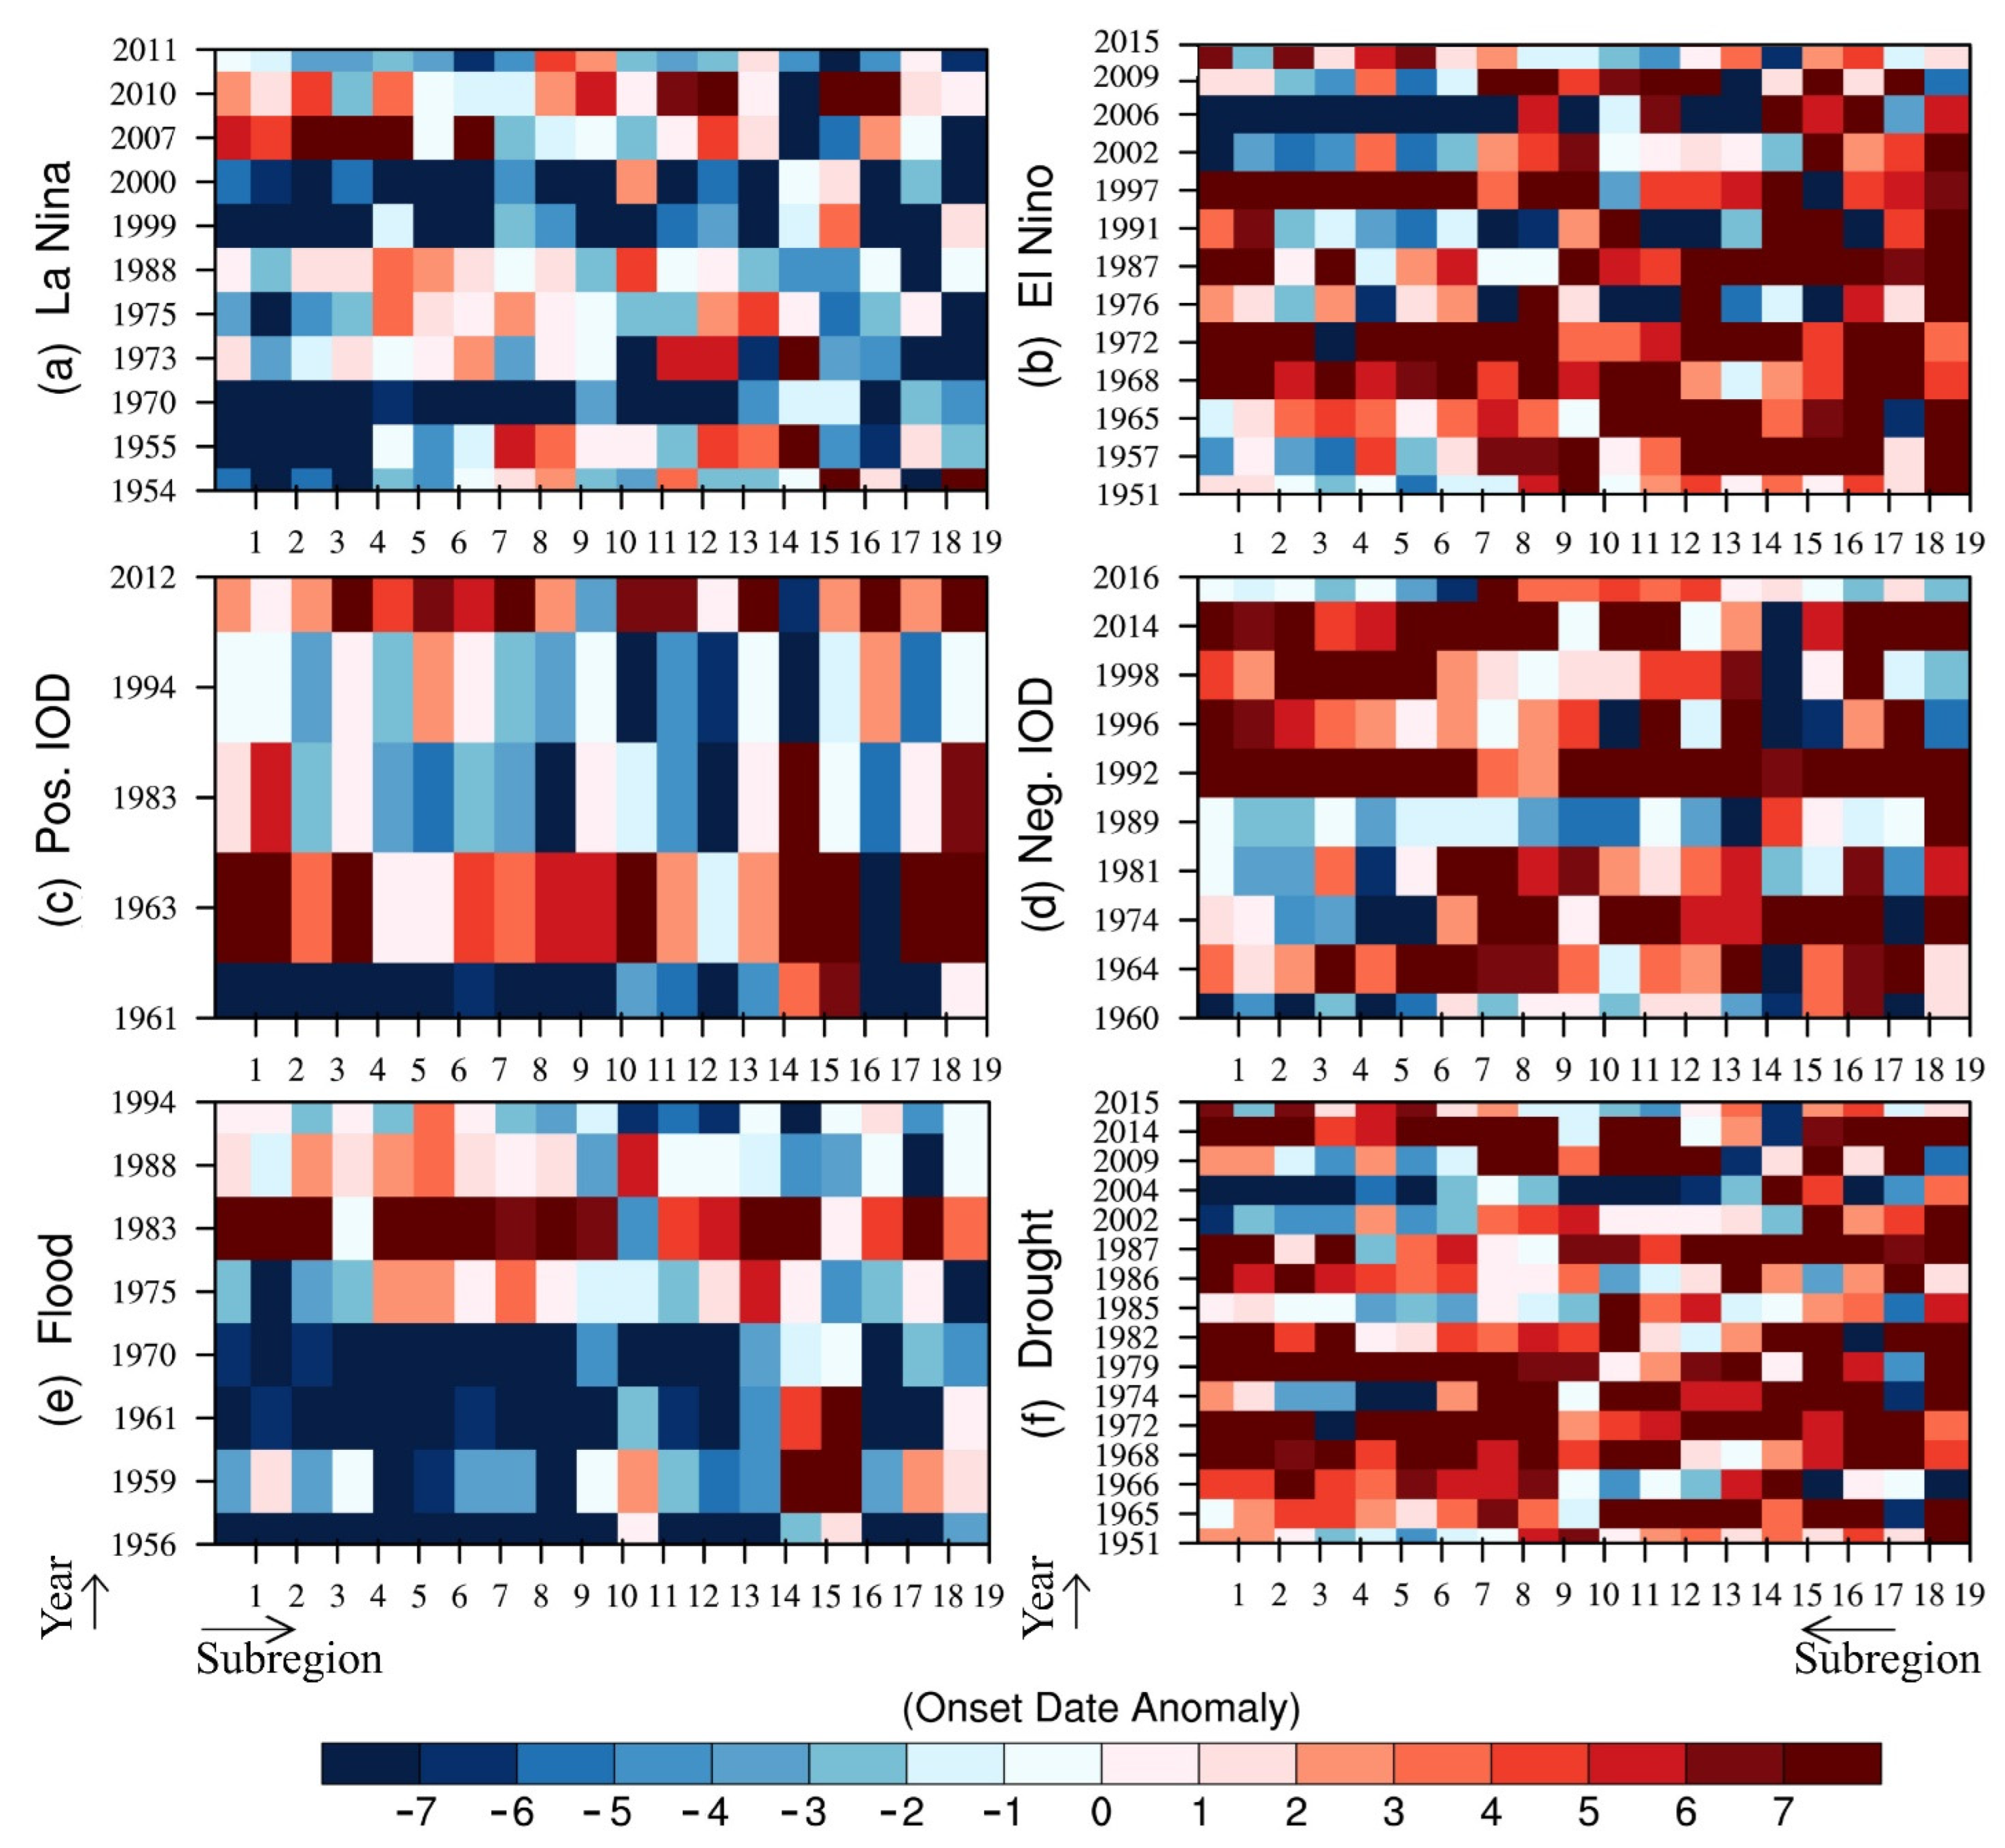
3.1.1. La Niña

In general, this is the phase that is generally known for above-normal rainfall; however, many important studies suggest uncertainty in its absolute association [42,43,44,45]. Compared with the mean onsets, we found early onsets during La Niña years in all SRs except SR15, which followed the normal onset date (Figure 3a). Except for the western part of India, SRs in the north, south, and northeast had early onsets of at least five days (Figure 3a). Further, the variability of 11.39, 7.62, and 7.36 days in the northern northwestern, extreme northern, and west-central (SR15, 19, and 12, respectively) parts of the country was much higher than the mean variability of seven days in southern India (SR1, 2, 3, and 4). This indicates the uncertainty of the early onsets in the northwestern, extreme northern, and west-central parts of the country; however, the actual number of early monsoon onset days varied greatly. The composite event map in Figure 4a shows early onset in all SRs except SR15. As per the 60th percentile value, almost all SRs had early onsets (Figure 2a). Concerning the late onsets, the only four regions with late onsets of ≥2 days in the 60th percentile were SRs 1, 9, 13, and 14. SR9 (i.e., Vidarbha region) had a mere 36% of cases lying in the early-onset category, and some other SRs, i.e., 13 and 14, had ≤54% occurrences (Figure 4a). Early onsets of ≥5 days were not very prominent, and more than 50% of cases of such a category existed in SR2 only. Therefore, we calculated the chances of early onsets of ≥4 days, and more than 50% chances were found for SR2, SR3, SR17, and SR19 only. Event-to-event progress of the monsoon onset for the different SRs did not show much homogeneity in the magnitude of the monsoon onset (Figure 4a), which might be due to the regional stochastic or synoptic events discussed in Section 1.

3.1.2. El Niño

Many similarities were found in the cases of El Niño and drought phases. Therefore, a comparative analysis of both is discussed here. Early onsets in all SRs except SRs in the north northwest and extreme north (SR15 and SR19) were noted in El Niño years compared to drought years (Figure 3a,c). SRs 15, 19, and 11 had a very high σ value. SR15 remained common with the same magnitude of a late-onset anomaly in El Niño and drought years. SR15 had high variability but no early onset in any of the phases. The pattern of monsoon onset in the 60th percentile in the El Niño case was similar to that of the drought case (Figure 2b,f).
Based on the composite of El Niño, the west coast of India had a comparatively early onset of >2 days (Figure 4b) as compared to the drought years (Figure 4f). However, SRs 19, 16, 15, 17, and 9 had anomalously late onsets (Figure 4b) similar to drought years. SR17 depends on monsoon rainfall for agriculture [46], and late onsets might be responsible for a huge loss due to the scarcity of rainfall in most cases. SRs 15–19 including SR9 (Vidarbha region) behaved almost the same in all El Niño years (Figure 5b). Events with late onsets of ≥5 days were very well spread across SR19, SR9, SR16, SR10, SR15, and SR17, with occurrences of ≥50% of the cases since 1951. SR19 (consisting of Himachal Pradesh, Punjab, Haryana, Uttarakhand, and Delhi) was highly associated with El Niños, with more than 70% of cases having onsets delayed by ≥5 days.

3.1.3. Positive and Negative IOD

Positive IOD years in India are known to have an association with good rainfall, but recently, ref. [43] suggested an asymmetric response of monsoon rainfall between the two phases of the IOD [44]. Hence, different regions of India experience different rainfall anomalies during positive and negative IODs. In general, we found early mean onsets for positive IOD years and late mean onsets for negative IOD years as compared to the normal years (Figure 3b). Almost all SRs of negative IODs had a confidence level ≥ 60% for delayed onsets with an average σ value of six days for all SRs. Only SR15 had early onset by a minimal margin of one day. Generally, it is noted that the early/late mean onsets for both phases of IODs (Figure 3b) were lower than those of flood/drought years (Figure 3c). The spatial pattern of the late onset in negative IOD was somewhat similar to that of the drought years and El Niño years, with SR15 being an exception (Figure 4d). Further, the most delayed onset in SRs 8, 12, and 17 was slightly different under a negative IOD. Quantitatively, SR17, SR14, SR8, SR12, and SR19 had late onsets in ≥50% of cases for ≥4 days in negative IOD years. In particular, SR17 had late onsets in 70% of cases and SR14 in 60% of cases. Furthermore, more than 66% of blocks in Figure 5d indicate the late onset in the event-by-event progression of onsets during negative IOD years. At the 60th percentile value, we found a delay in the onset in all SRs, and the mean delay was four days with a mean σ of six days (Figure 4d). A contiguous spatial pattern of early onset was seen with SRs 1, 3, 5, and 8 (the Western Ghats), SRs 6, 9, and 12 (Deccan plateau), SRs 17, 13, and 10 (Bihar, Jharkhand, and Odisha, respectively), and SR18 (North East region) (Figure 4c). Due to fewer occurrences of positive IOD years and the filtration technique adopted (mentioned in Section 2.2), we had only five positive IOD years. Therefore, except for the spatial distribution pattern (Figure 4c) and yearly anomalous pattern in different SRs (Figure 5c), we do not have confidence in making a strong statement on the onset dates in the case of a positive IOD.

3.2. Flood and Drought (Irrespective of Climate Modes)

3.2.1. Flood

Among all SRs, comparatively high variability was observed in SR18 (9.58 days) and SR5 (9.14 days) along with low variability in SR16 (4.92 days) and SR19 (4.66 days) (Figure 3c). Further, it was found that the mean onset of most SRs (except for SR15) in flood years happened earlier than the calculated mean onsets in all normal years (i.e., average onsets of all normal years excluding flood/drought years) between 1951 and 2017. Along with SR18, SR13 (Jharkhand), SR17 (Bihar and eastern Uttar Pradesh), SR2, 3, 4, and 5 (southern states of India) and SR9 and 12 (central India) always had early onsets in flood years compared to the mean onsets of normal years.
During all the flood years between 1951 and 2017, more than 65% of the onset in all SRs was earlier than the calculated mean onset in the normal years, and this was also visible in all SRs as shown in Figure 2e. As per the 60th percentile, late onsets were found in SR6 (northern Karnataka), SR7, and SR15 (Rajasthan) only. The composite of flood years (Figure 4e) shows that most of the SRs had anomalous early onsets except for SR15 and SR16 (Rajasthan and parts of Haryana, Uttar Pradesh, and Delhi). More than 50% of SRs had early onsets of ≥5 days and seven SRs (SR2, SR3, SR4, SR9, SR12, SR13, SR18) covering southern and central India, the central Gangetic plain, and northeastern India had very early onsets of ≥5 days. The progress in the anomalous onset dates for each flood year among all SRs is shown in Figure 5e. Notably, the first four flood years (1956, 1959, 1961, and 1970) showed a general uniform pattern of early onset across all SRs except SR15, SR16, and SR19. The flood years after 1970 were not as coherent owing to synoptic atmospheric circulations at the regional scale. Their unusual behaviour is discussed in Section 4.

3.2.2. Drought

SRs 11, 15, and 19 showed the highest variations (12.68, 11.52, and 9.24 days) in the onset dates among all SRs (Figure 3c) associated with drought years. The high variability in these three SRs makes the analysis difficult as the judgment based on highly varying onsets is usually not that reliable. Interestingly, these SRs consisted of highly fertile agricultural land, which is hit by heat waves almost every year [47]. Delays in onset increase the severity of heat waves and the water demand. Moreover, regions in the southern tip of India, i.e., SRs 1, 2, 3, and 4, besides the northern northwestern (SR15) and extreme northern Indian (SR19) SRs, also had high variation, with σ of more than seven days. In more than 73% of cases (Figure 3c), the onsets were later than the calculated mean onsets of normal years. The value of the 60th percentile also supports the fact with a probability of more than 60%. The 60th percentile (Figure 2f) suggested the largest delays in SRs 19, 1, 11, and 16 (11.41, 8.22, 7.17, and 6.88, respectively, days).
The composite of onsets in drought years (Figure 4e) showed homogenous patterns of late onsets in almost all SRs. In particular, SR8, SR11, SR15, SR16, and SR19 had a delay of ≥5 days from 1951–2017. SR11, SR16, and SR19 had a high density of population with perennial rivers, canals, and underground water as the sources of irrigation. SR9 with long delays in onsets represents the Vidarbha region of Maharashtra, and this region is infamous for farmer suicide due to frequent droughts. SR15 did not have a comparatively large number of cases with a delay of ≥5 days (Figure 5f) in the onsets, but Figure 4f shows late onsets of ≥6 days. This might be due to the long delays in onset dates. As already stated earlier in this article, SR15 had the second-highest variability of monsoon onsets.

4. Discussion

A monsoon is a large-scale system mostly associated with the Sea Surface Temperature (SST) and land temperature. Therefore, SST-related modes of climate variation are important, but this study found that not all onsets can be explained by ENSO and IOD-related SSTs. Nevertheless, it confirms that early/late onsets lead to floods and droughts irrespective of their concurrences with ENSO and IOD for all SRs in India. Interestingly, SR13 showed a very early onset in flooding, and a positive IOD was associated with decreasing monsoon rainfall as per the 146-year trend (1871–2016) [4]. A general decrease in monsoon rainfall but relatively very early onset in flooding and positive IOD years may lead to severe extreme rainfall events in SR13 [3]. We found some exceptional years in contrast with the general result for all SRs, i.e., 1983 (Figure 5e), 2004 (Figure 5f), 2010 (Figure 5a), and 2012 (Figure 5c). For the year 1983, [48,49] found that the conditions in May were similar to those of a drought year, but the appearance of westward migrating cloud systems in the Bay of Bengal changed the course of the monsoon in June, and it turned out to be an above-normal year. Therefore, despite the pre-monsoon drought-like conditions and late onsets across India, events on the intra-seasonal scale caused the normal evolution of monsoon in that year [50].
The onsets could be associated with synoptic events though we discussed their general associations with interannual climate variations. Early onset in the year 2004 was due to a high-intensity cyclonic storm from 16–19 May in the Bay of Bengal [51]. However, the main reason for the late onset in 2012 over the majority of SRs was a blocking high located to the north as a result of a subdued convection process over the Arabian Sea [52,53]. In the year 2010, a severe cyclonic storm (31 May to 7 June) over the Arabian Sea delayed the movement of the onset due to a weak monsoonal current [54]. Thus, these synoptic events during onsets due to the differently originated disturbances in different regions play important roles in the timing of monsoon onsets. Early onsets in flood years compared with those in La Niñas and late onsets in drought years compared with those in El Niño years were observed. We noticed that several El Niño years coincided with drought years. However, the number of drought years was far higher than that of the El Niño years (Table S1). Hence, we used them separately in our analyses. The complex physical mechanism of monsoon onset at the SR-scale onset dates is the limitation of this study. A lot of scope is there to work on the prediction of the monsoon onset with the improvement in computer processing and technological upgradation. The prediction of the monsoon onset dates with high accuracy can help predict floods and droughts, which are not necessarily related to the ENSO and IOD. This study will be a supplement mainly for policymakers and stakeholders from the agricultural sector in India due to rainfed agriculture in the majority of the regions in India.

5. Conclusions

The role of different modes of climate variations in onset dates was investigated at the SR scale. During almost all phases of climate variations, northern India (especially northern northwest India, i.e., SR15) experienced late onset. SR15 and its adjacent SRs showed delays in monsoon onsets in drought and El Niño years, indicating late onsets. In particular, northern northwest India was highly susceptible to late onset during El Niño and drought years. In general, the association of drought and El Niño years with the late monsoon onsets had a >60% probability. A similar probability was also found for La Niña and flood cases with early onsets. On a regional and pan-India scale, synoptic events such as the cyclone in the Bay of Bengal, MJO, and Western disturbances have strong influences on the onset dates. Therefore, deviation from the actual behaviour of the onset dates owing to these synoptic disturbances on top of the inter-annual climate variations cannot be ignored. It may be noted that in this study, we had limitations while following the SR boundaries for the calculation of the onset dates, but these boundaries are not absolute. Therefore, adjacent SRs can have mixed onset behaviour. Furthermore, statistical confidence of 95% was obtained for all modes of climate variations except drought (70%) and positive IODs (60%). We suggest that if one can predict the onset dates, which are not necessarily always related to modes of climate variations (ENSO and IOD), it is possible to predict floods and droughts.

Supplementary Materials

The following supporting information can be downloaded at https://www.mdpi.com/article/10.3390/atmos13101581/s1, Table S1: Years of different climate modes as well as flood and drought from 1951–2017.

Author Contributions

Conceptualization: formal analysis, A.S. and N.S.; writing—original draft preparation, validation, software, A.S.; visualization, A.S., N.S., S.J. and S.K.M.; supervision, N.S.; methodology, A.S., S.K.M. and S.J.; resources, S.K.M.; writing—review and editing, S.B. and S.K.D. All authors have read and agreed to the published version of the manuscript.

Funding

This research received no external funding.

Institutional Review Board Statement

Not applicable.

Informed Consent Statement

Not applicable.

Data Availability Statement

Not applicable.

Acknowledgments

The objective method for the calculation of the monsoon onset was obtained from the research report (RR-124) released by the IITM, and a list of different monsoon years in India (flood, drought, El Niño, and La Niña) was also obtained from the IITM. Positive and negative IOD years were provided by BOM, the Australian Government. The authors are thankful to the India Meteorological Department for providing the high-resolution gridded rainfall data [39]. The global data of total cloud cover, geopotential height, zonal wind, and meridional wind were provided by NOAA/ESRL PSD, (https://www.esrl.noaa.gov/psd/data/gridded/data.ncep.reanalysis.html (accessed on 1 September 2019)) Boulder, Colorado, USA [41]. NCL, R language, and ArcGIS Version 10.2 were used to draw figures.

Conflicts of Interest

The authors declare no conflict of interest.

References

  1. Aijaz, R. Monsoon Variability and Agricultural Drought Management in India. ORF Issue Br. 2013, 51, 1–8. [Google Scholar]
  2. Saha, K.; Mooley, D.; Saha, S. The Indian Monsoon and Its Economic Impact. GeoJournal 1979, 3, 171–178. [Google Scholar] [CrossRef]
  3. Saini, A.; Sahu, N.; Duan, W.; Kumar, M.; Avtar, R.; Mishra, M.; Kumar, P.; Pandey, R.; Behera, S. Unraveling Intricacies of Monsoon Attributes in Homogenous Monsoon Regions of India. Front. Earth Sci. 2022, 10, 794634. [Google Scholar] [CrossRef]
  4. Saini, A.; Sahu, N. Decoding Trend of Indian Summer Monsoon Rainfall Using Multimethod Approach: (Century Long Indian Monsoon Rainfall Trend). Stoch. Environ. Res. Risk Assess. 2021, 35, 2313–2333. [Google Scholar] [CrossRef]
  5. Goswami, B.N.; Xavier, P.K. ENSO Control on the South Asian Monsoon through the Length of the Rainy Season. Geophys. Res. Lett. 2005, 32, L18717. [Google Scholar] [CrossRef]
  6. Abish, B.; Cherchi, A.; Ratna, S.B. ENSO and the Recent Warming of the Indian Ocean. Int. J. Climatol. 2017, 38, 203–214. [Google Scholar] [CrossRef]
  7. Bhatla, R.; Laxmi, U.; Singh, M. Droughts/Floods in Relation to El Niño/La Niña over All-India, East Uttar Pradesh and Some Stations of East Uttar Pradesh. J. Clim. Chang. 2017, 3, 27–35. [Google Scholar] [CrossRef]
  8. Varikoden, H.; Revadekar, J.V.; Choudhary, Y.; Preethi, B. Droughts of Indian Summer Monsoon Associated with El Niño and Non-El Niño Years. Int. J. Climatol. 2014, 35, 1916–1925. [Google Scholar] [CrossRef]
  9. Mooley, D.A.; Parthasarathy, B. Variability of the Indian Summer Monsoon and Tropical Circulation Features. Mon. Weather Rev. 1983, 111, 967–978. [Google Scholar] [CrossRef]
  10. Chakraborty, A.; Agrawal, S. Role of West Asian Surface Pressure in Summer Monsoon Onset over Central India. Environ. Res. Lett. 2017, 12, 74002. [Google Scholar] [CrossRef]
  11. Ashok, K.; Saji, N.H. On the Impacts of ENSO and Indian Ocean Dipole Events on Sub-Regional Indian Summer Monsoon Rainfall. Nat. Hazards 2007, 42, 273–285. [Google Scholar] [CrossRef]
  12. Ge, J.; You, Q.; Zhang, Y. Interannual Variation of the Northward Movement of the South Asian High towards the Tibetan Plateau and Its Relation to the Asian Summer Monsoon Onset. Atmos. Res. 2018, 213, 381–388. [Google Scholar] [CrossRef]
  13. Misra, V.; Bhardwaj, A. The Impact of Varying Seasonal Lengths of the Rainy Seasons of India on Its Teleconnections with Tropical Sea Surface Temperatures. Atmos. Sci. Lett. 2020, 21, e959. [Google Scholar] [CrossRef]
  14. Goswami, B.B.; Mani, N.J.; Mukhopadhyay, P.; Waliser, D.E.; Benedict, J.J.; Maloney, E.D.; Khairoutdinov, M.; Goswami, B.N. Monsoon Intraseasonal Oscillations as Simulated by the Superparameterized Community Atmosphere Model. J. Geophys. Res. Atmos. 2011, 116, D22104. [Google Scholar] [CrossRef]
  15. Yasunari, T. Cloudiness Fluctuations Associated with the Northern Hemisphere Summer Monsoon. J. Meteorol. Soc. Jpn. Ser. II 1979, 57, 227–242. [Google Scholar] [CrossRef]
  16. Sikka, D.R.; Gadgil, S. On the Maximum Cloud Zone and the ITCZ over Indian Longitudes during the Southwest Monsoon. Mon. Weather Rev. 1980, 108, 1840–1853. [Google Scholar] [CrossRef]
  17. Fennessy, M.J. The Simulated Indian Monsoon: A GCM Sensitivity Study. J. Clim. 1994, 7, 33–43. [Google Scholar] [CrossRef]
  18. Krishnamurthy, V.; Shukla, J. Intraseasonal and Interannual Variability of Rainfall over India. J. Clim. 2000, 13, 4366–4377. [Google Scholar] [CrossRef]
  19. Taraphdar, S.; Zhang, F.; Leung, L.R.; Chen, X.; Pauluis, O.M. MJO Affects the Monsoon Onset Timing Over the Indian Region. Geophys. Res. Lett. 2018, 45, 10011–10018. [Google Scholar] [CrossRef]
  20. Pottapinjara, V.; Girishkumar, M.S.; Ravichandran, M.; Murtugudde, R. Influence of the Atlantic Zonal Mode on Monsoon Depressions in the Bay of Bengal during Boreal Summer. J. Geophys. Res. Atmos. 2014, 119, 6456–6469. [Google Scholar] [CrossRef]
  21. Pottapinjara, V.; Girishkumar, M.S.; Sivareddy, S.; Ravichandran, M.; Murtugudde, R. Relation between the Upper Ocean Heat Content in the Equatorial Atlantic during Boreal Spring and the Indian Monsoon Rainfall during June-September. Int. J. Climatol. 2015, 36, 2469–2480. [Google Scholar] [CrossRef] [Green Version]
  22. Pottapinjara, V.; Girishkumar, M.S.; Murtugudde, R.; Ashok, K.; Ravichandran, M. On the Relation between the Boreal Spring Position of the Atlantic Intertropical Convergence Zone and Atlantic Zonal Mode. J. Clim. 2019, 32, 4767–4781. [Google Scholar] [CrossRef]
  23. Singh, N.; Ranade, A. The Wet and Dry Spells across India during 1951–2007. J. Hydrometeorol. 2010, 11, 26–45. [Google Scholar] [CrossRef]
  24. Wang, B.; Ding, Q.; Joseph, P.V. Objective Definition of the Indian Summer Monsoon Onset. J. Clim. 2009, 22, 3303–3316. [Google Scholar] [CrossRef]
  25. Fasullo, J.; Webster, P.J. A Hydrological Definition of Indian Monsoon Onset and Withdrawal. J. Clim. 2003, 16, 3200–3211. [Google Scholar] [CrossRef]
  26. Saini, A.; Sahu, N.; Kumar, P.; Nayak, S.; Duan, W.; Avtar, R.; Behera, S. Advanced Rainfall Trend Analysis of 117 Years over West Coast Plain and Hill Agro-Climatic Region of India. Atmosphere 2020, 11, 1225. [Google Scholar] [CrossRef]
  27. Flatau, M.K.; Flatau, P.J.; Rudnick, D. The Dynamics of Double Monsoon Onsets. J. Clim. 2001, 14, 4130–4146. [Google Scholar] [CrossRef]
  28. Bhowmik, S.R.; Roy, S.S.; Kundu, P.K. Analysis of Large-Scale Conditions Associated with Convection over the Indian Monsoon Region. Int. J. Climatol. 2008, 28, 797–821. [Google Scholar] [CrossRef]
  29. Mathew, T.; Malap, N.; Manoj, M.G.; Jayarao, Y.; Todekar, K.; Rakesh, V.; Rebello, R.; Mohankumar, K.; Thara, P. Pre-Monsoon Convective Events and Thermodynamic Features of Southwest Monsoon Onset over Kerala, India—A Case Study. Atmos. Res. 2020, 248, 105218. [Google Scholar] [CrossRef]
  30. Misra, V.; Bhardwaj, A.; Mishra, A. Local Onset and Demise of the Indian Summer Monsoon. Clim. Dyn. 2018, 51, 1609–1622. [Google Scholar] [CrossRef]
  31. Noska, R.; Misra, V. Characterizing the Onset and Demise of the Indian Summer Monsoon. Geophys. Res. Lett. 2016, 43, 4547–4554. [Google Scholar] [CrossRef]
  32. Pai, D.S.; Bandgar, A.; Devi, S.; Musale, M.; Badwaik, M.R.; Kundale, A.P.; Gadgil, S.; Mohapatra, M.; Rajeevan, M. Normal Dates of Onset/Progress and Withdrawal of Southwest Monsoon over India. Mausam 2020, 71, 553–570. [Google Scholar]
  33. Pradhan, M.; Rao, A.S.; Srivastava, A.; Dakate, A.; Salunke, K.; Shameera, K.S. Prediction of Indian Summer-Monsoon Onset Variability: A Season in Advance. Sci. Rep. 2017, 7, 14229. [Google Scholar] [CrossRef]
  34. IMD. Monsoon 2007 A Report (IMD Met. Monograph No.: Synoptic Meteorology No. 6/2008). 2008. Available online: https://www.tropmet.res.in/~kolli/MOL/Monsoon/year2007/Monsoon-2007.pdf (accessed on 17 September 2022).
  35. Ananthakrishnan, R.; Soman, M.K. The Onset of the Southwest Monsoon over Kerala: 1901–1980. J. Climatol. 1988, 8, 283–296. [Google Scholar] [CrossRef]
  36. Pai, D.S.; Nair, R.M. Summer Monsoon Onset over Kerala: New Definition and Prediction. J. Earth Syst. Sci. 2009, 118, 123–135. [Google Scholar] [CrossRef]
  37. Joseph, S.; Sahai, A.K.; Abhilash, S.; Chattopadhyay, R.; Borah, N.; Mapes, B.E.; Rajeevan, M.; Kumar, A. Development and Evaluation of an Objective Criterion for the Real-Time Prediction of Indian Summer Monsoon Onset in a Coupled Model Framework. J. Clim. 2015, 28, 6234–6248. [Google Scholar] [CrossRef]
  38. Singh, N.; Ranade, A. Determination of Onset and Withdrawal Dates of Summer Monsoon across India Using NCEP/NCAR Re-Analysis; Indian Institute of Tropical Meteorology: Pune, India, 2010. [Google Scholar]
  39. Pai, D.; Rajeevan, M.; Sreejith, O.; Mukhopadhyay, B.; Satbha, N. Development of a New High Spatial Resolution (0.25° × 0.25°) Long Period (1901–2010) Daily Gridded Rainfall Data Set over India and Its Comparison with Existing Data Sets over the Region. MAUSAM 2014, 65, 1–18. [Google Scholar] [CrossRef]
  40. Singh, D.; Ghosh, S.; Roxy, M.K.; Mcdermid, S. Indian Summer Monsoon: Extreme Events, Historical Changes, and Role of Anthropogenic Forcings. WIREs Clim. Chang. 2019, 10, e571. [Google Scholar] [CrossRef]
  41. Kalnay, E.; Kanamitsu, M.; Kistler, R.; Collins, W.; Deaven, D.; Gandin, L.; Iredell, M.; Jenne, R.; Joseph, D. The NCEP NCAR 40-Year Reanalysis Project. Bull. Am. Meteorol. Soc. 1996, 77, 437–472. [Google Scholar] [CrossRef]
  42. Chakraborty, A. Preceding Winter La Niña Reduces Indian Summer Monsoon Rainfall. Environ. Res. Lett. 2018, 13, 54030. [Google Scholar] [CrossRef]
  43. Behera, S.K.; Ratnam, J.V. Quasi-Asymmetric Response of the Indian Summer Monsoon Rainfall to Opposite Phases of the IOD. Sci. Rep. 2018, 8, 123. [Google Scholar] [CrossRef] [PubMed]
  44. Li, Z.; Cai, W.; Lin, X. Dynamics of Changing Impacts of Tropical Indo-Pacific Variability on Indian and Australian Rainfall. Sci. Rep. 2016, 6, 31767. [Google Scholar] [CrossRef] [PubMed]
  45. Roy, I.; Tedeschi, R.G.; Collins, M. ENSO Teleconnections to the Indian Summer Monsoon in Observations and Models. Int. J. Climatol. 2016, 37, 1794–1813. [Google Scholar] [CrossRef]
  46. Sahu, N.; Saini, A.; Behera, S.; Sayama, T.; Nayak, S.; Sahu, L.; Duan, W.; Avtar, R.; Yamada, M.; Singh, R.B.; et al. Impact of Indo-Pacific Climate Variability on Rice Productivity in Bihar, India. Sustainability 2020, 12, 7023. [Google Scholar] [CrossRef]
  47. Ratnam, J.V.; Behera, S.K.; Ratna, S.B.; Rajeevan, M.; Yamagata, T. Anatomy of Indian Heatwaves. Sci. Rep. 2016, 6, 24395. [Google Scholar] [CrossRef]
  48. Srinivasan, J.; Nanjundiah, R.S. The Evolution of Indian Summer Monsoon in 1997 and 1983. Meteorol. Atmos. Phys. 2002, 79, 243–257. [Google Scholar] [CrossRef]
  49. Jenamani, R.K.; Dash, S.K. A Study on the Role of Synoptic and Semi-Permanent Features of Indian Summer Monsoon on Itś Rainfall Variations during Different Phases of El-Niño. Mausam 2005, 56, 825–840. [Google Scholar] [CrossRef]
  50. Jenamani, R.K.; Dash, S.K. Inter-Annual and Intra-Seasonal Variation If Some Characteristics of Monsoon Disturbances Formed over the Bay. Mausam 1999, 50, 55–62. [Google Scholar]
  51. Jayanthi, N.; Mazumdar, A.B.; Devi, S.S. Weather in India Monsoon Season (June to September 2004). Mausam 2005, 56, 721–756. [Google Scholar]
  52. Rao, G.V.; Aksakal, A. Characteristics of Convection over the Arabian Sea during a Period of Monsoon Onset. Atmos. Res. 1994, 33, 235–258. [Google Scholar] [CrossRef]
  53. IMD. Monsoon 2012 A Report (IMD Met. Monograph No.: Synoptic Meteorology No. 13/2013). 2013. Available online: https://www.tropmet.res.in/~kolli/MOL/Monsoon/year2012/Monsoon-2012-NEW.pdf (accessed on 17 April 2022).
  54. IMD. Monsoon 2011 A Report (IMD Met. Monograph No.: Synoptic Meteorology No. 1/2012). 2012. Available online: https://www.tropmet.res.in/~kolli/MOL/Monsoon/year2011/Monsoon-2011-NEW.pdf (accessed on 17 April 2022).
Figure 1. All sub-regions (SRs) within India with a blue solid line and the red colour values within the SR boundary are representative of their respective SR. The thick solid line in black colour represents the political boundary of India, and the dashed line is the administrative boundary of the states of India. The 19 SRs in the figure are based on six factors and are considered per the scheme given by [23].
Atmosphere 13 01581 g001
Figure 2. Percentile value of the onset date at the 40th (cyan), 60th (green) and 80th (red) levels. Square markers (amber) represent the calculated normal onset date for different phases. The date label in the figure shows the onset date of the SR in the 60th percentile. (a) La Niña, (b) El Niño, (c) Positive IOD (d) Negative IOD, (e) Flood, and (f) Drought. The x-axis represents the SRs, and the y-axis shows the monsoon onset date.
Atmosphere 13 01581 g002
Figure 3. Normal onset date of different regions in the cases of (a) La Niña, El Niño and Normal, (b) Positive IOD, Negative IOD and Normal, and (c) Flood, Drought, and Normal. The x-axis represents the SRs as shown in Figure 1, and the y-axis is the monsoon onset date. Error bars in the figures represent the calculated σ, and the blue (red) error bar represents the phase colour of the dot in the respective plot.
Atmosphere 13 01581 g003
Figure 4. Anomalous monsoon onset for (a) La Niña, (b) El Niño, (c) Positive IOD, (d) Negative IOD, (e) Flood, and (f) Drought. Values above 95% confidence level from a two-tailed Student’s t-test are shown except for drought case 70% and positive IOD 60%.
Atmosphere 13 01581 g004
Figure 5. Year-wise anomaly of onset days for (a) La Niña, (b) El Niño, (c) Positive IOD, (d) Negative IOD, (e) Flood, and (f) Drought. The y-axis shows the years, and the x-axis represents the SR.
Atmosphere 13 01581 g005
Table 1. Details of the data used to obtain the monsoon onset.
VariableResolutionSourceRegionAuthor and Year
Rainfall0.25° × 0.25°IMDIndia[39]
Precipitable Water (PPW)2.5° × 2.5°NOAA (NCEP)India[41]
Total Cloud Cover2.5° × 2.5°NOAA (NCEP)India[41]
Geopotential Height 200 hPa2.5° × 2.5°NOAA (NCEP)25°–35° N; 50°–100° E[41]
Geopotential Height 200 hPa2.5° × 2.5°NOAA (NCEP)India[41]
Geopotential Height 850 hPa2.5° × 2.5°NOAA (NCEP)India[41]
Zonal Wind 200 hPa2.5° × 2.5°NOAA (NCEP)India[41]
Zonal Wind 850 hPa2.5° × 2.5°NOAA (NCEP)India[41]
Zonal Wind 850 hPa2.5° × 2.5°NOAA (NCEP)5°–15° N; 55°–70° E[41]
Meridional Wind 200 hPa2.5° × 2.5°NOAA (NCEP)India[41]
Meridional Wind 850 hPa2.5° × 2.5°NOAA (NCEP)India[41]
Meridional Wind 850 hPa2.5° × 2.5°NOAA (NCEP)10°–30° N; 90°–100° E[41]
Meridional Wind 850 hPa2.5° x 2.5°NOAA (NCEP)5° S–5° N; 100°–150° E[41]
Meridional Wind 850 hPa2.5° × 2.5°NOAA (NCEP)5° S–10° N; 45°–55° E[41]
Lower Tropospheric Thickness2.5° × 2.5°NOAA (NCEP)25°–35° N; 40°–75° E[41]
Upper Tropospheric Thickness2.5° × 2.5°NOAA (NCEP)25°–35° N; 60°–95° E[41]
Publisher’s Note: MDPI stays neutral with regard to jurisdictional claims in published maps and institutional affiliations.

