
Ozone-Induced Lung and Bronchial Injury: A Mouse Model Study
by
 , ,
, ,
Shi Liang
1,* ,
,
Yan Sha
1,
Chuanhong Yang
2,
Huangwen Lai
2,
Chong Sun
1,
Weisen Zhao
3,
An Zhang
4 ,
,
Qingwen Qi
4,* and
Ying Xie
1,* 1
National Key Clinical Specialty of Occupational Diseases, Shenzhen Prevention and Treatment Center for Occupational Diseases, Shenzhen 518020, China
2
Laboratory of Basic Medical Science, Liuhuaqiao Hospital, Guangzhou 510010, China
3
Department of Occupational and Environmental Health, School of Public Health, Jilin University, Changchun 130021, China
4
National Key Laboratory of Resources and Environmental Information System, Institute of Geographic Sciences and Natural Resources Research, Chinese Academy of Sciences, Beijing 100101, China
*
Authors to whom correspondence should be addressed.
Atmosphere 2022, 13(10), 1562; https://doi.org/10.3390/atmos13101562
Submission received: 12 August 2022
/
Revised: 15 September 2022
/
Accepted: 20 September 2022
/
Published: 24 September 2022
(This article belongs to the Special Issue Air Pollution in China (2nd Edition))
Abstract
:Ozone pollution is a prominent public health issue, but there are few studies on the effect of ozone on the ultrastructure of respiratory system; we conducted this research. Exposed to 1.1 ppm O3 4 h per day, the mice lungs and bronchi were taken on the 15th or 30th day. The sections stained with HE and immunohistochemical streptavidin–peroxidase methods for NQO1, Nrf2, and Keap1 were observed and measured under the optical microscope. TEM was used for ultrastructure observation. The animals’ serums were detected for CRP and IL-6 levels. The HE-stained sections showed no obvious micromorphological changes in the O3 exposure, but the NQO1 average optical density was higher than the control on the 15th day (p < 0.05). The ultrastructural changes were found in the O3 exposure group, such as bulges and vacuoles in type I alveolar cells, the increased evacuation of substance from lamellar bodies in the type II alveolar cells, the increased space around the goblet nucleus, binuclear goblet, and columnar cells. CRP and IL-6 levels increased compared with the control (p < 0.05). Although inhaling 1.1 ppm O3 had no significant effect on the micromorphology of the mice lungs and bronchi, it did affect the ultrastructure with oxidative stress and inflammatory responses.
1. Introduction
Air pollution is an important public health problem with annual costs of more than USD 4 trillion per year due to health costs and millions of people dying early because of illnesses associated with poor air quality [1]. The very intensive and powerful Chinese Clean Air Action Plan launched in 2013 led to a rapid decline in the concentrations of nitrogen dioxide (NO2), sulfur dioxide (SO2), and particulate matter (PM) [2,3,4]. At the same time, ozone (O3) pollution has become more prominent with the concentrations increased in major cities of China [5,6].
Despite being called “the umbrella of life on earth”, O3 is a strong oxidizing gas, mainly distributed in the stratosphere of the atmosphere. Ground level O3 is created by a series of complex nonlinear photochemical reactions between O3 precursors, namely, methane, carbon monoxide, volatile organic compounds (VOCs), and nitrogen oxides (NOX) [7].
As early as the 18th century, O3 was used to treat diseases because of its strong oxidizing properties [8]. Up to now, many institutions use O3 in clinical treatment, but it is a double-edged sword [9,10,11]. Among many life-related air pollutants, long-term exposure to O3 has become increasingly important in resulting to diseases progression and increased mortality [12]. Indeed, more recent studies have linked long-term exposure to O3 to reduced lung function and an increasing risk of developing emphysema irrespective of being a cigarette smoker [13,14]. Even short-term changes in O3 levels have been associated with increased mortality [15,16] and cause economic losses [17]. We also studied the correlation between the air pollutant levels and the number of hospitalized patients with respiratory diseases in Shenzhen City, which possesses a better air quality than that in most cities in China, and found O3 concentration impacting the hospitalization in a short period [18].
Inhalation of O3 has been shown to cause pulmonary inflammation [19,20,21,22], asthma [23,24,25,26], and chronic obstructive pulmonary disease (COPD) [27]; increase susceptibility to pathogen infection [28,29]; and exacerbate asthma and lung disease [23,25,30].
Most of these lesions are related to oxidative stress. The Kelch-like ECH-associated protein 1 (KEAP1)–nuclear factor erythroid 2-related factor 2 (NRF 2)–antioxidant response elements (ARE) pathway is one of the most important defense mechanisms against oxidative and electrophilic stresses, and it is closely associated with inflammatory diseases. Under normal conditions, the dimer formed by NRF2 and KEAP1 binds to actin in the cytoplasm and is anchored and ubiquitinated. When exposed to oxidative stress, NRF2 is translocated to the nucleus and activates an ARE-dependent gene expression of a series of antioxidative and cytoprotective proteins, such as NAD(P)H: quinone oxidoreductase 1 (NQO1). In addition, NRF2 can affect the expression of the proinflammatory factor C-reactive protein (CRP) and interleukin 6 (IL-6) content [31,32,33].
We can easily find articles on the effects of ozone on respiratory pathology and pathophysiology, but few in combination with ultrastructural studies. Therefore, in this paper, based on the study of pathology and pathophysiology, we focused on ultrastructural research using transmission electron microscopy (TEM), hoping to make new discoveries.
2. Materials and Methods
2.1. Experimental Animal Exposures
A total of 48 specific pathogen-free (SPF) C57BL/6 mice, 8–10 weeks, 18.0–22.0 g, 50% and 50% for male and female, provided by Guang Dong Medical Laboratory Animal Center (GDMLAC), were nourished and tested in a standard animal laboratory. Animals were fasted and water-free during the period of exposure, ate, and drank freely during the rest of the time. The mice were randomized into 4 groups after passing the quarantine. The model groups were exposed to O3 (1.1 ppm, 2.14 mg/m3, equivalent to 150 times the second-level daily standard of the National Ambient Air Quality Standard in China) induced by the whole-body inhalation poison control instrument (HOPE-MED 8050F/54, Tianjin Hope Industry & Trade Co., Ltd., Tianjin, China) in a closed 60 L box for 4 h a day. The control groups were placed in the same closed air box. Samples were taken for testing on 15th and 30th days.
2.2. Histopathological Observation
The left lungs and bronchi were collected, fixed in 10% formaldehyde solution for 48 h, routinely dehydrated (LEICA® automatic dehydration machine ASP300S), transparent, soaked in wax, embedded (LEICA® biological tissue embedding machine, EG1150), and cut into 5 μm paraffin sections (LEICA® Rotary Microtome, RM2235), they were stained with hematoxylin–eosin (HE) (LEICA® automatic dyeing machine, Auto Stainer-XL) and observed for pathological changes under a microscope (OLYMPUS® biomicroscope-BX43 with OLYMPUS® Micrographic software, CellSens Dimension).
2.3. TEM Specimen Processing and Observation
Operating at 4 °C, the lung tissue was made into the specimens with a size of 1–2 mm2, and the alveolar tissue and bronchiole were sure to be cut from each slice simultaneously.
Fixation: The specimens were added into 3% glutaraldehyde within 1 min, and were rinsed twice with 0.1 mol/L PBS for 10 min 2 to 4 h later. 1% osmium acid for 2 h, 0.1 mol/L PBS rinsed twice for 5 min.
Dehydration: The specimens were dehydrated by 50% and 70% ethanol step by step (each step was 10 min) and dehydrated by 80%, 90%, and 100% acetone step by step (each step was 10 min × 2 times).
Replacement: 100% acetone: an epoxy resin (Epon 812) embedding agent was mixed 1:1 and replaced for 40 min.
Soaking: epoxy resin (Epon 812) embedding agent at 37 °C soaked through the night.
Embedding: The samples were embed with Epon 812 embedding agent in the embedding mold and polymerized at 60 °C for 48 h.
The tissue block was trimmed and smoothed under a dissecting microscope. The tissue was exposed and trimmed into a trapezoid, square, or rectangle according to the shape of the tissue surface.
HE stained, positioned under a dissecting microscope and an ordinary microscope, the cut surface after positioning is 0.09 mm2.
The tissue was cut into 40–60 nm ultrathin sections with a LEICA® ultrathin sectioning machine, and the sections were fished with a copper mesh.
Electronic dyeing: The sections were dyed with saturated uranyl acetate prepared in 70% ethanol for 3 min, rinsed with double distilled water, dyed with lead dye solution for 3 min, and rinsed with double distilled water.
The sections were observed with a Hitachi H-7650 transmission electron microscope (TEM) after drying.
2.4. Immunohistochemistry
The left lungs’ tissue slices were detected by the immunohistochemical SP (streptavidin–peroxidase) method for NQO1, NRF2, and KEAP1, according to the kit (Abcam <Shanghai> Trading Co., Ltd., Shanghai, China) instructions. The slices were observed, and the optical density was detected with a microscope (OLYMPUS® biomicroscope, BX43, with OLYMPUS® Micrographic software, CellSens Dimension).
2.5. Assays for CRP and IL-6 Levels
An amount of 3 mL of blood was taken from the carotid artery of the every mouse into the blood collection tubes immediately before sacrifice. The blood was centrifuged at 1500 rpm for 5 min to isolate serum, which was used for measuring CRP and IL-6 with ELISA kits (Wuhan Huamei, Wuhan, China) according to the manufacturer instructions.
2.6. Statistical Analysis
Two independent samples t-tests were performed on the significance of the difference between the experimental group and the control group’s detection values with SPSS software (IBM SPSS Statistics 19.0, Armonk, NY, USA), and the results were considered statistically significant at p-values < 0.05.
3. Results
3.1. Micromorphological Observation under the Optical Microscope with HE Staining
3.2. TEM Observation
Alveolus of the normal control group (Figure 3): Type I alveolar epithelial cells are smooth and flat, and the basement membrane is intact. Type II alveolar epithelial cells have no obvious emptying of lamellar bodies, and capillaries are normal.
Bronchus of the normal control group (Figure 4): goblet cells and columnar cells have no abnormalities, and tight junctions are intact.
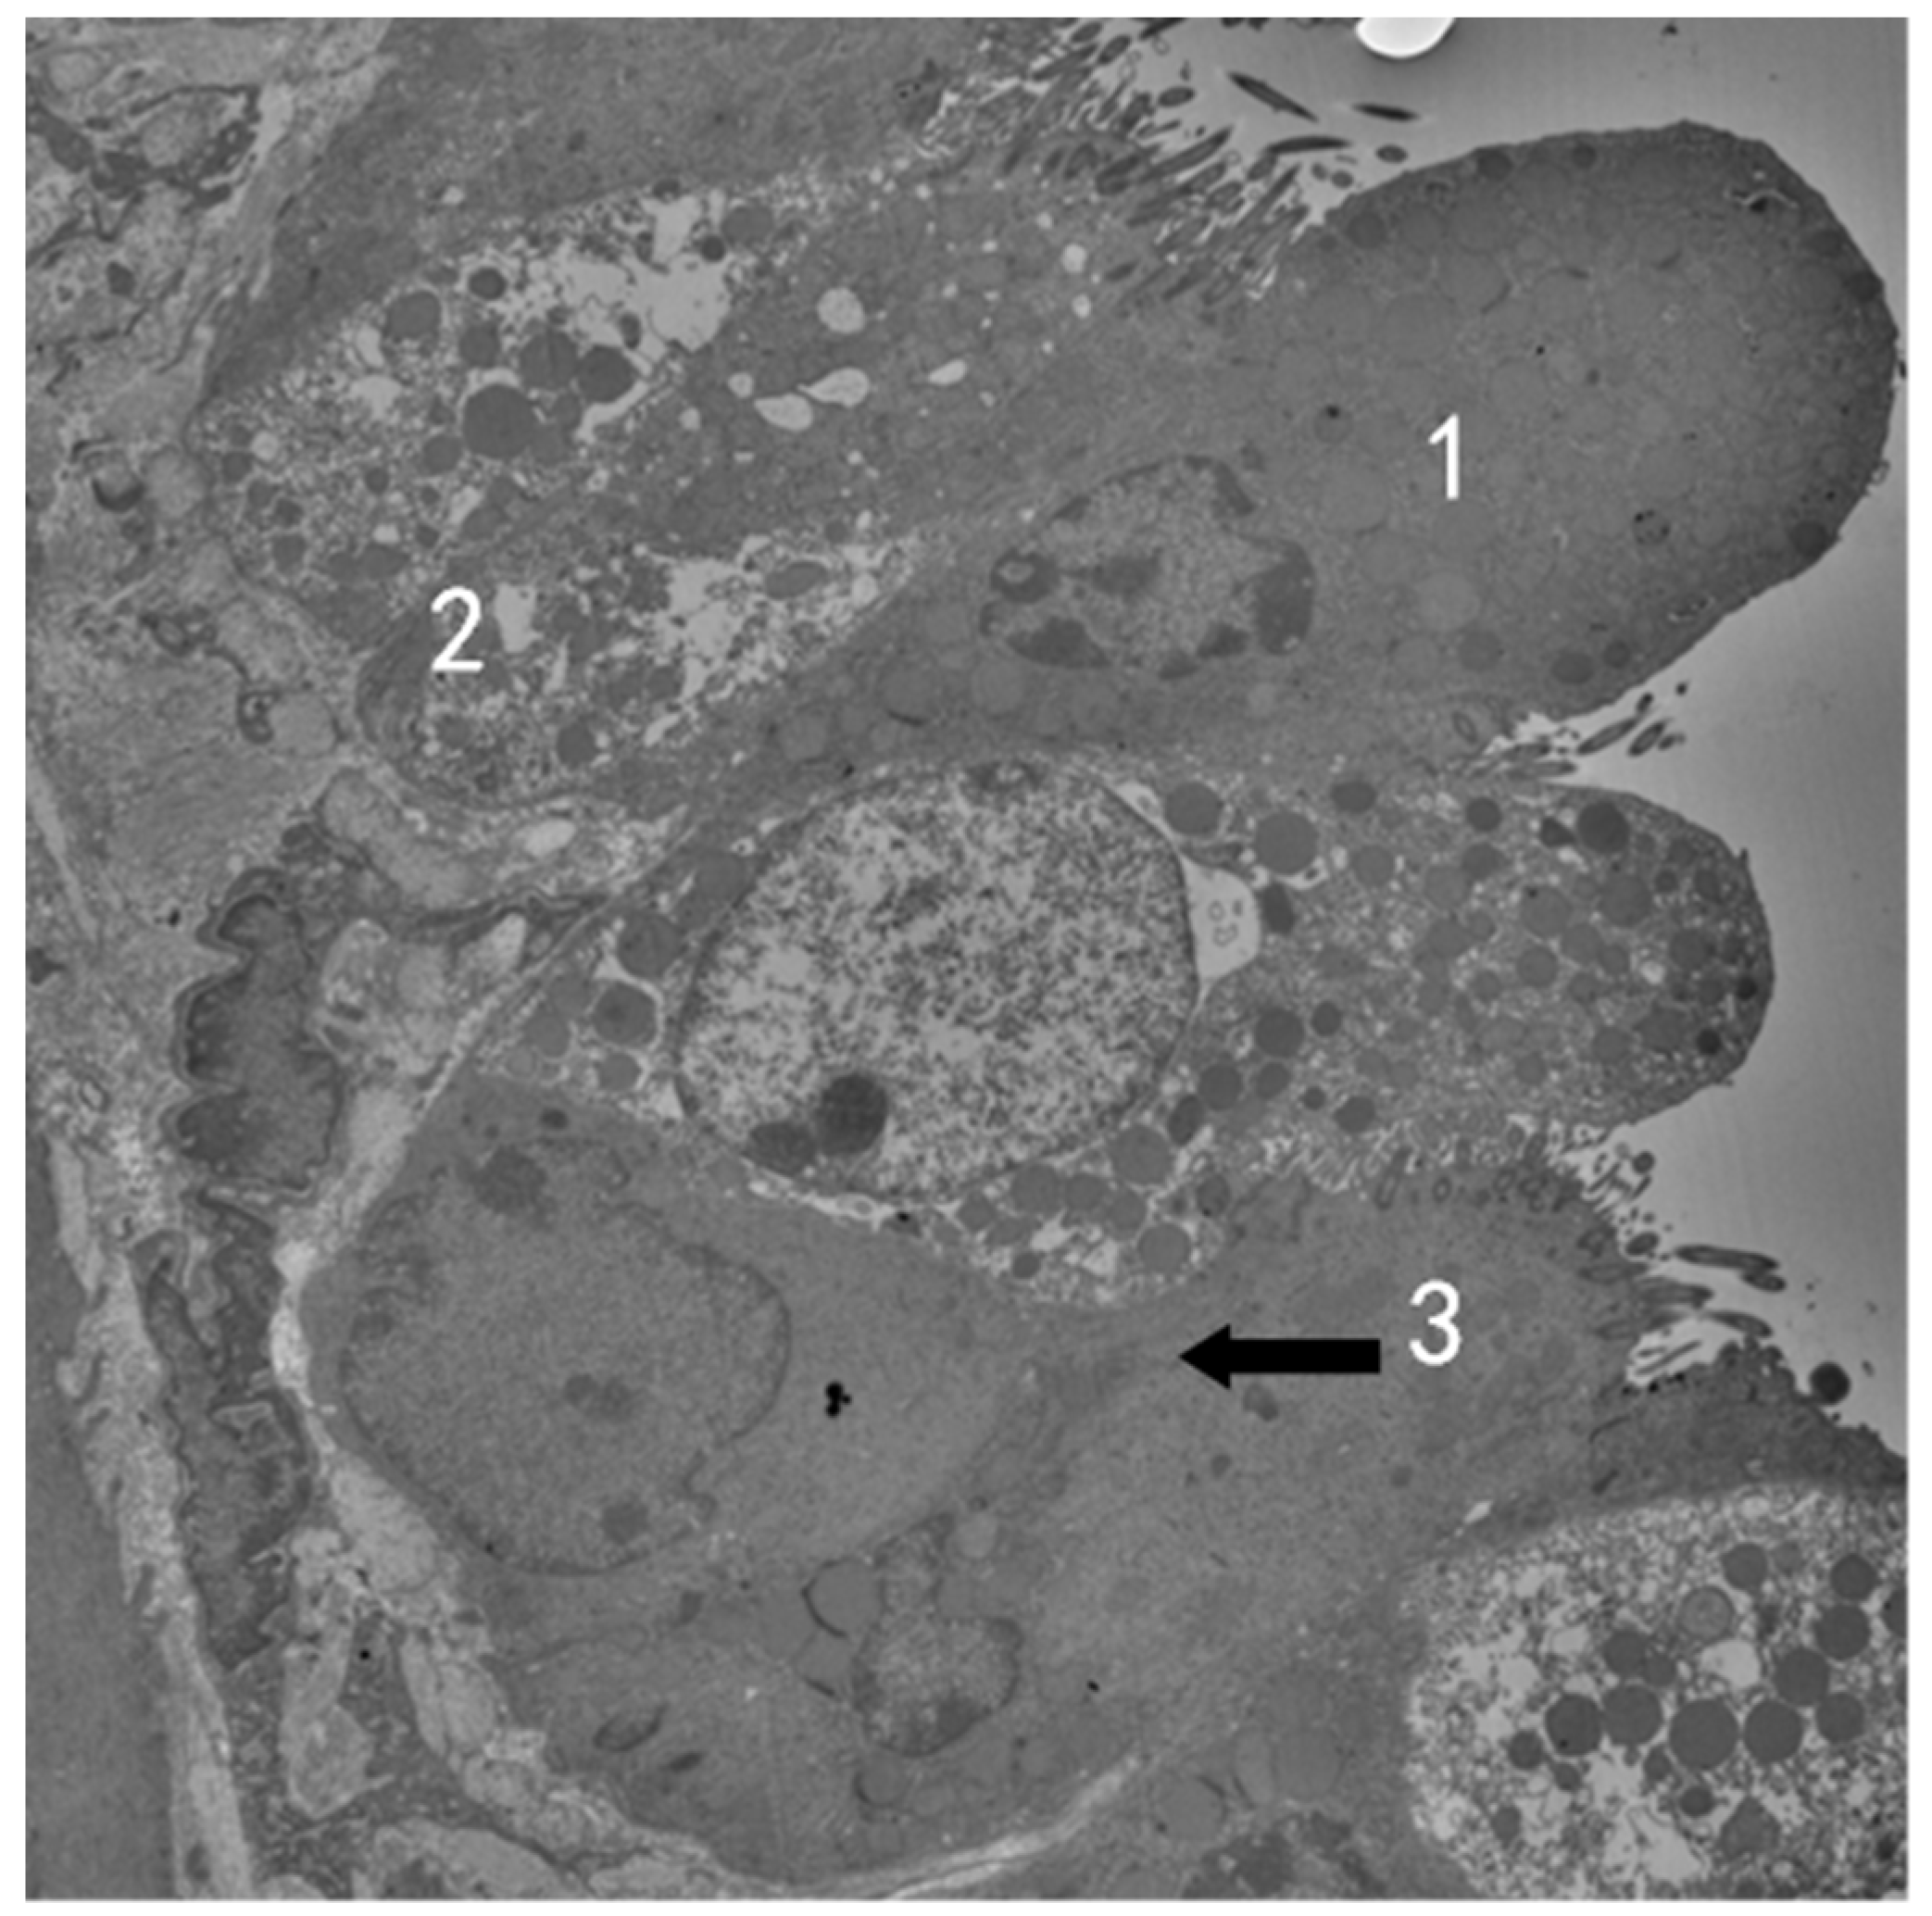
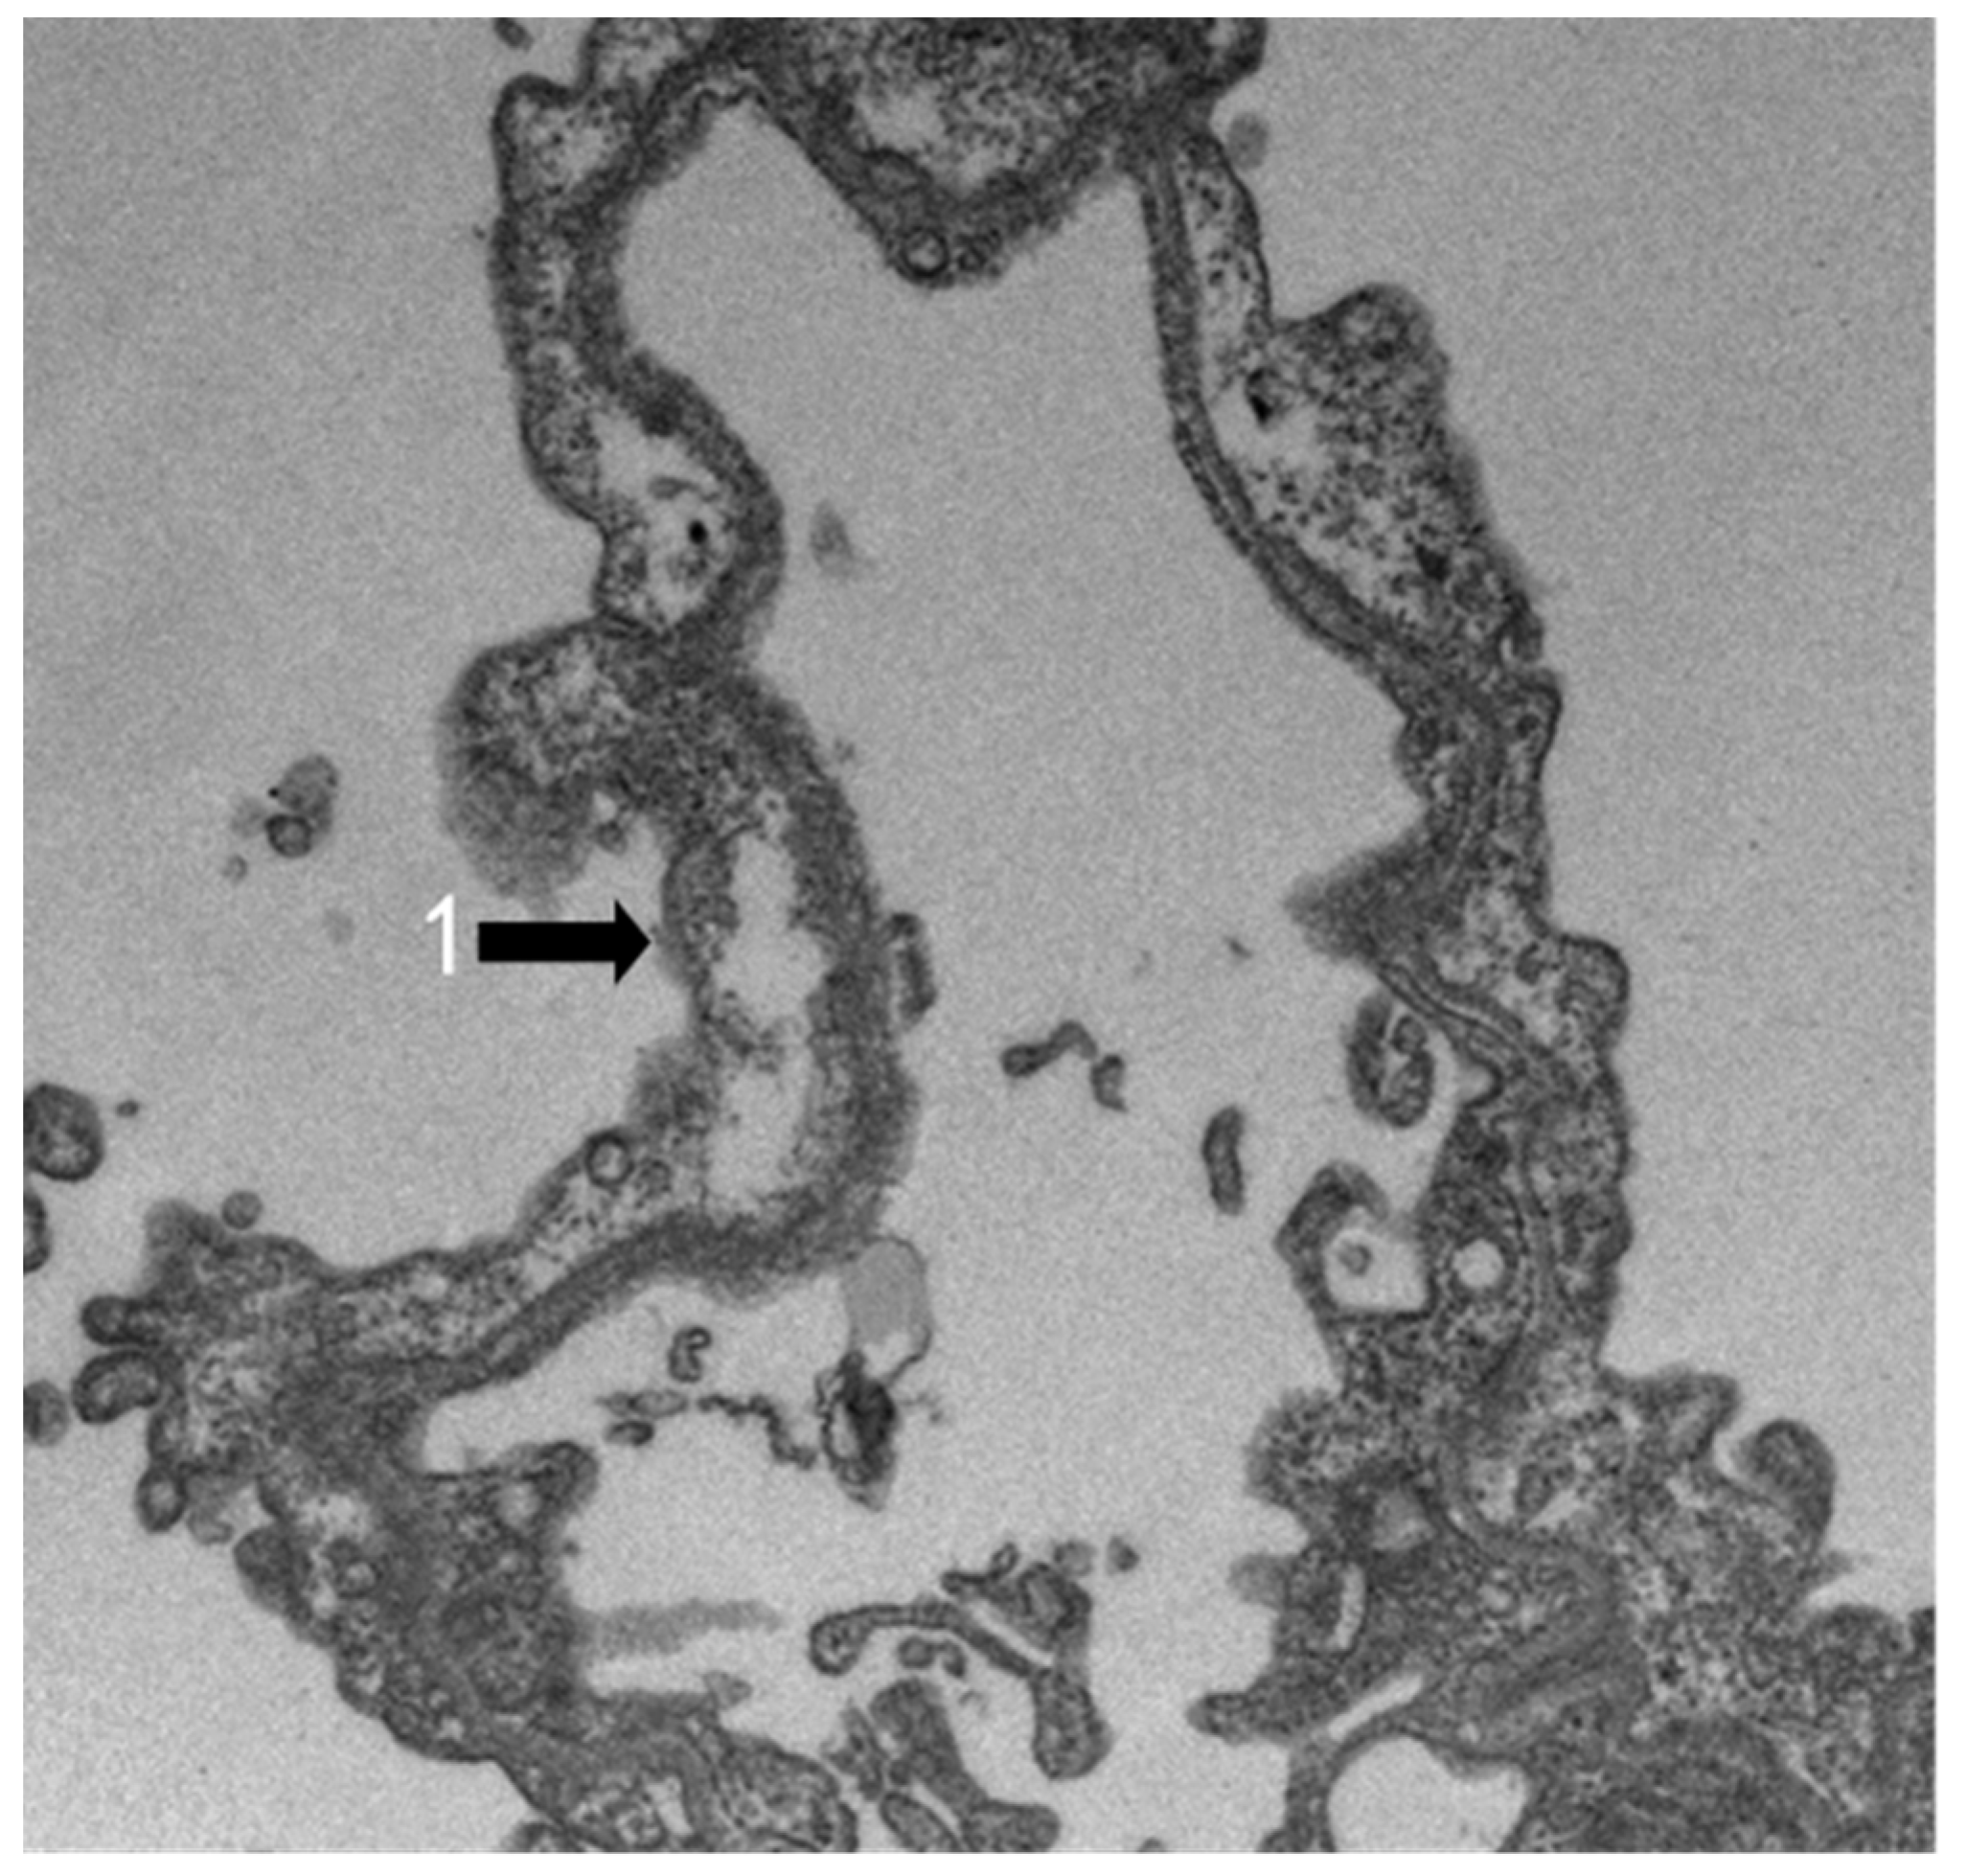
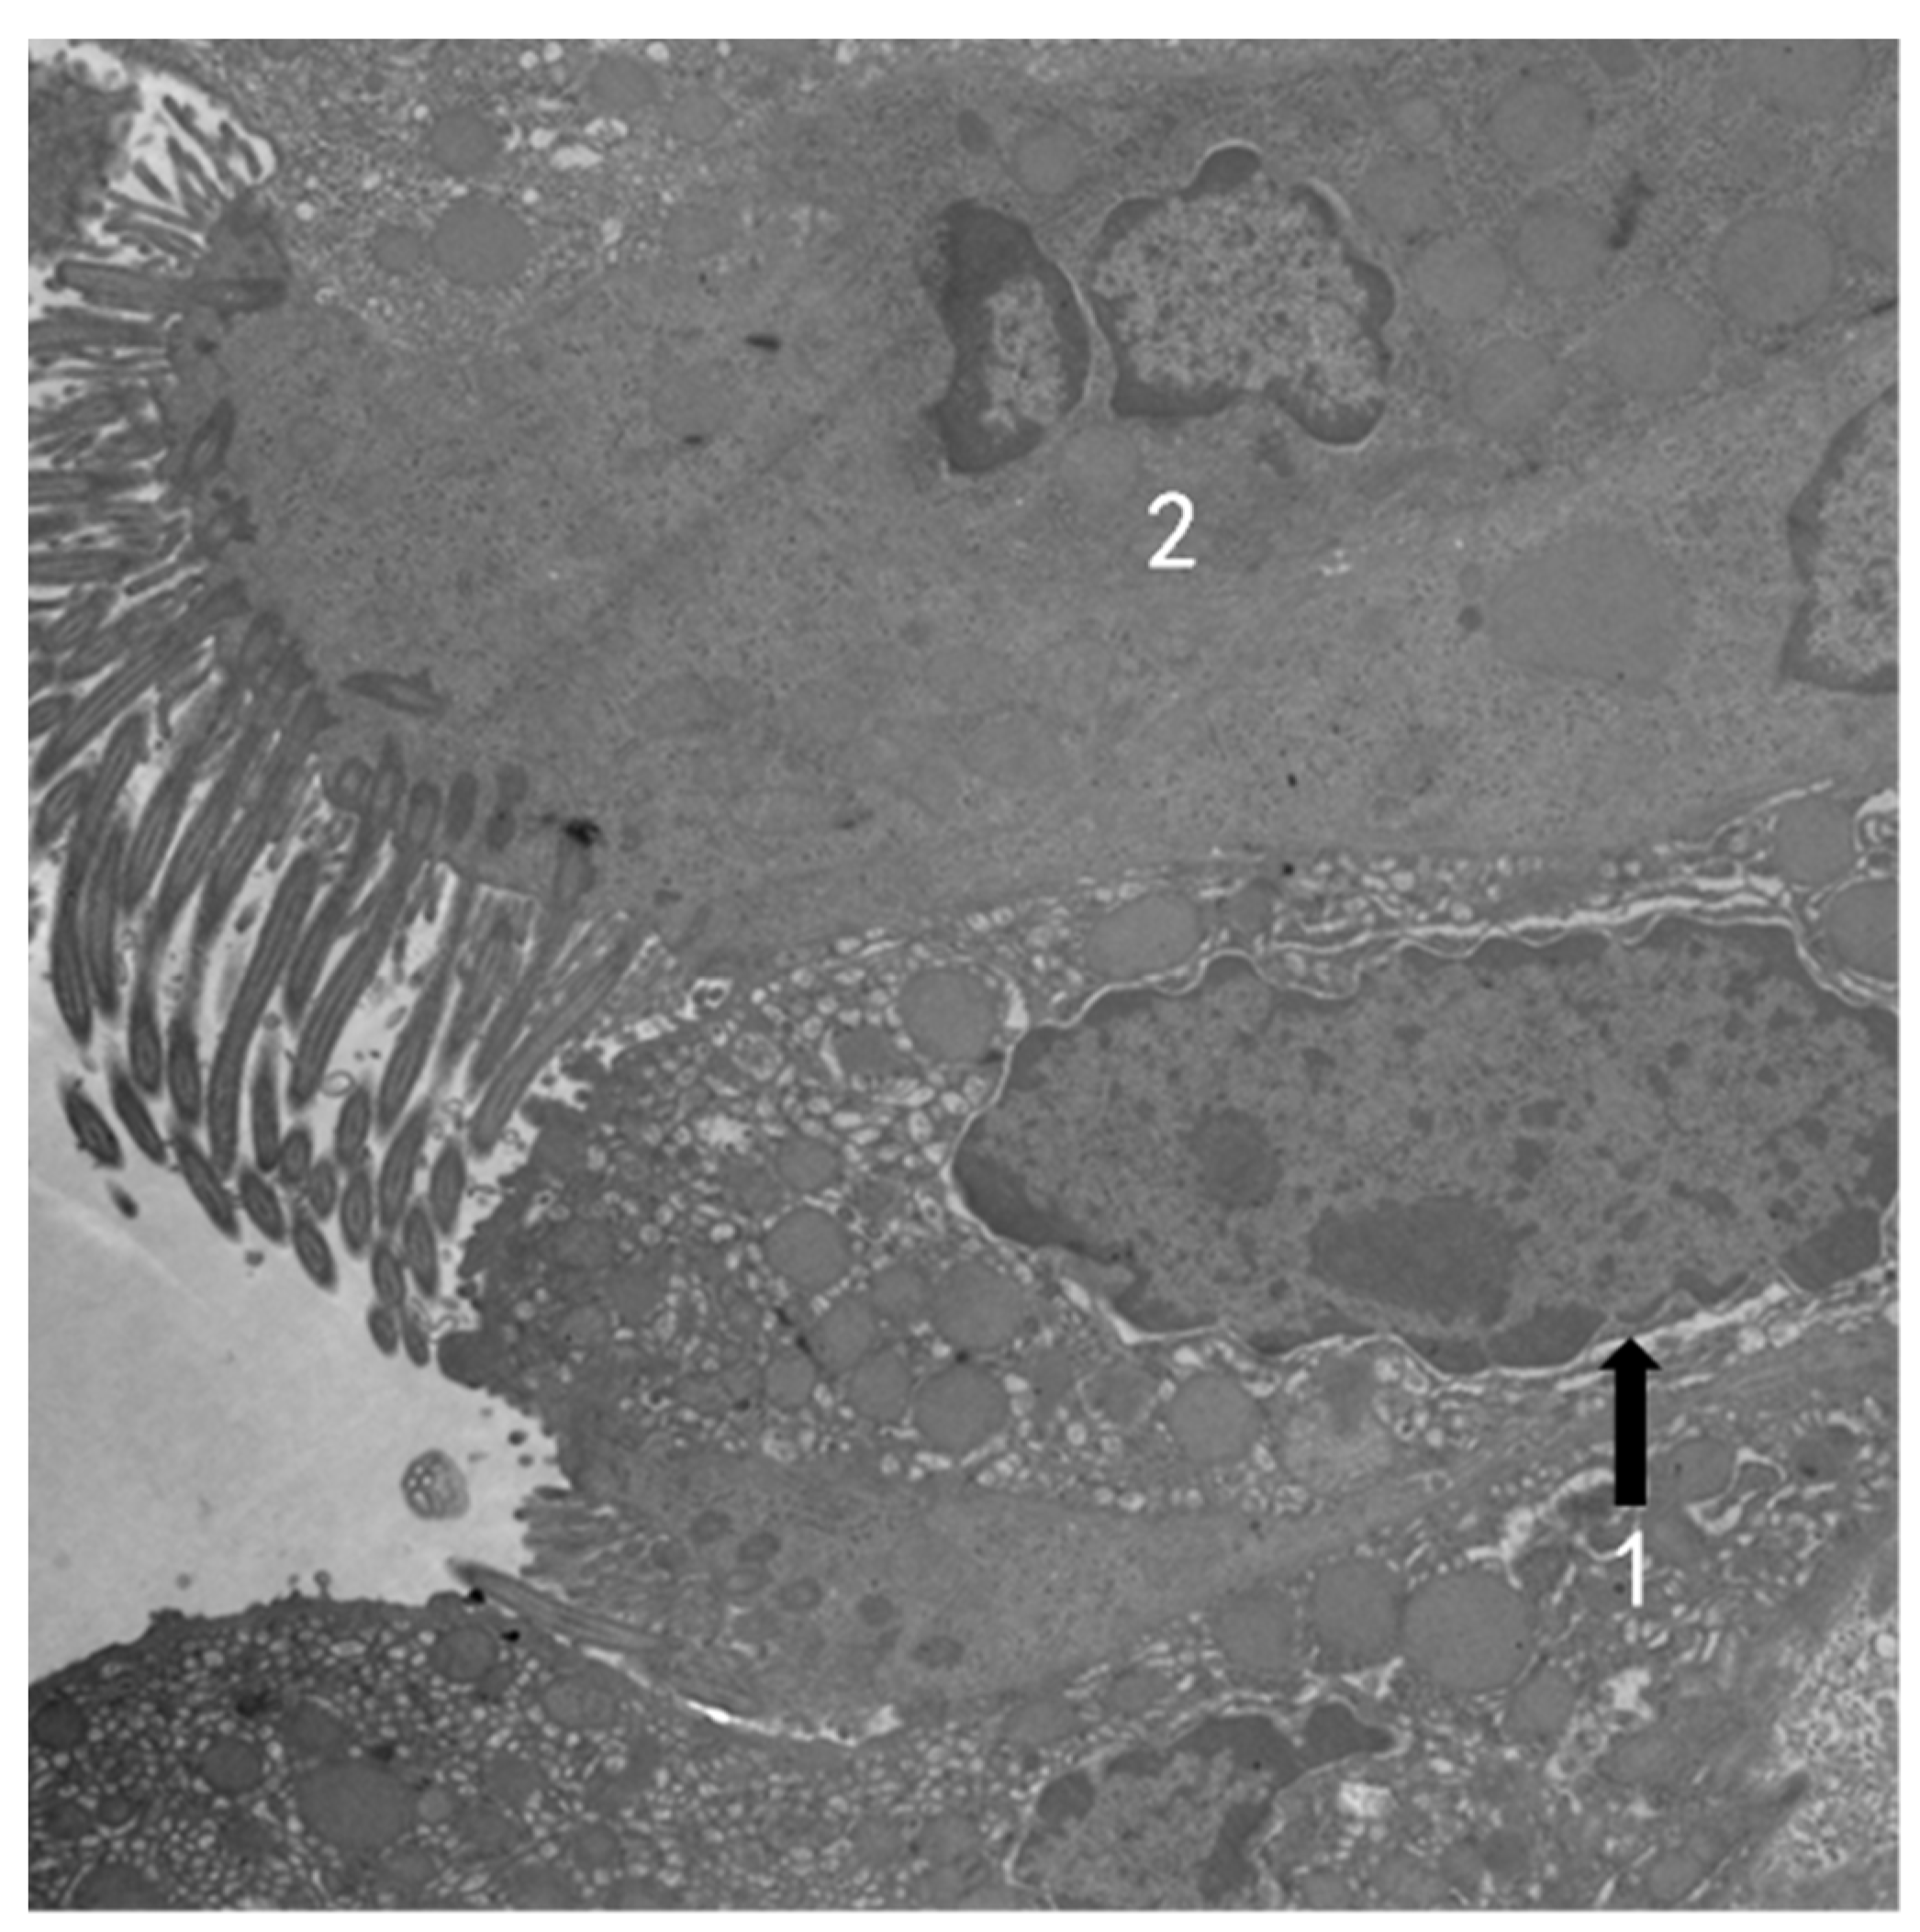
Exposed to 1.1 ppm O3 4 h per day for 15 days, the mouse type I alveolar epithelial cells swell with irregular edges, and many small vacuoles can be seen in the cytoplasm (Figure 5 and Figure 6). Type II alveolar epithelial cells are obviously emptying of lamellar bodies (Figure 6). Telangiectasia and congestion can be observed (Figure 7). Bronchus in the O3 model group: The goblet cell nuclear space is slightly widened, and binuclear columnar cells can be seen (Figure 8). Binuclear goblet cells can be seen, and damaged tight junctions between cells were observed (Figure 9).
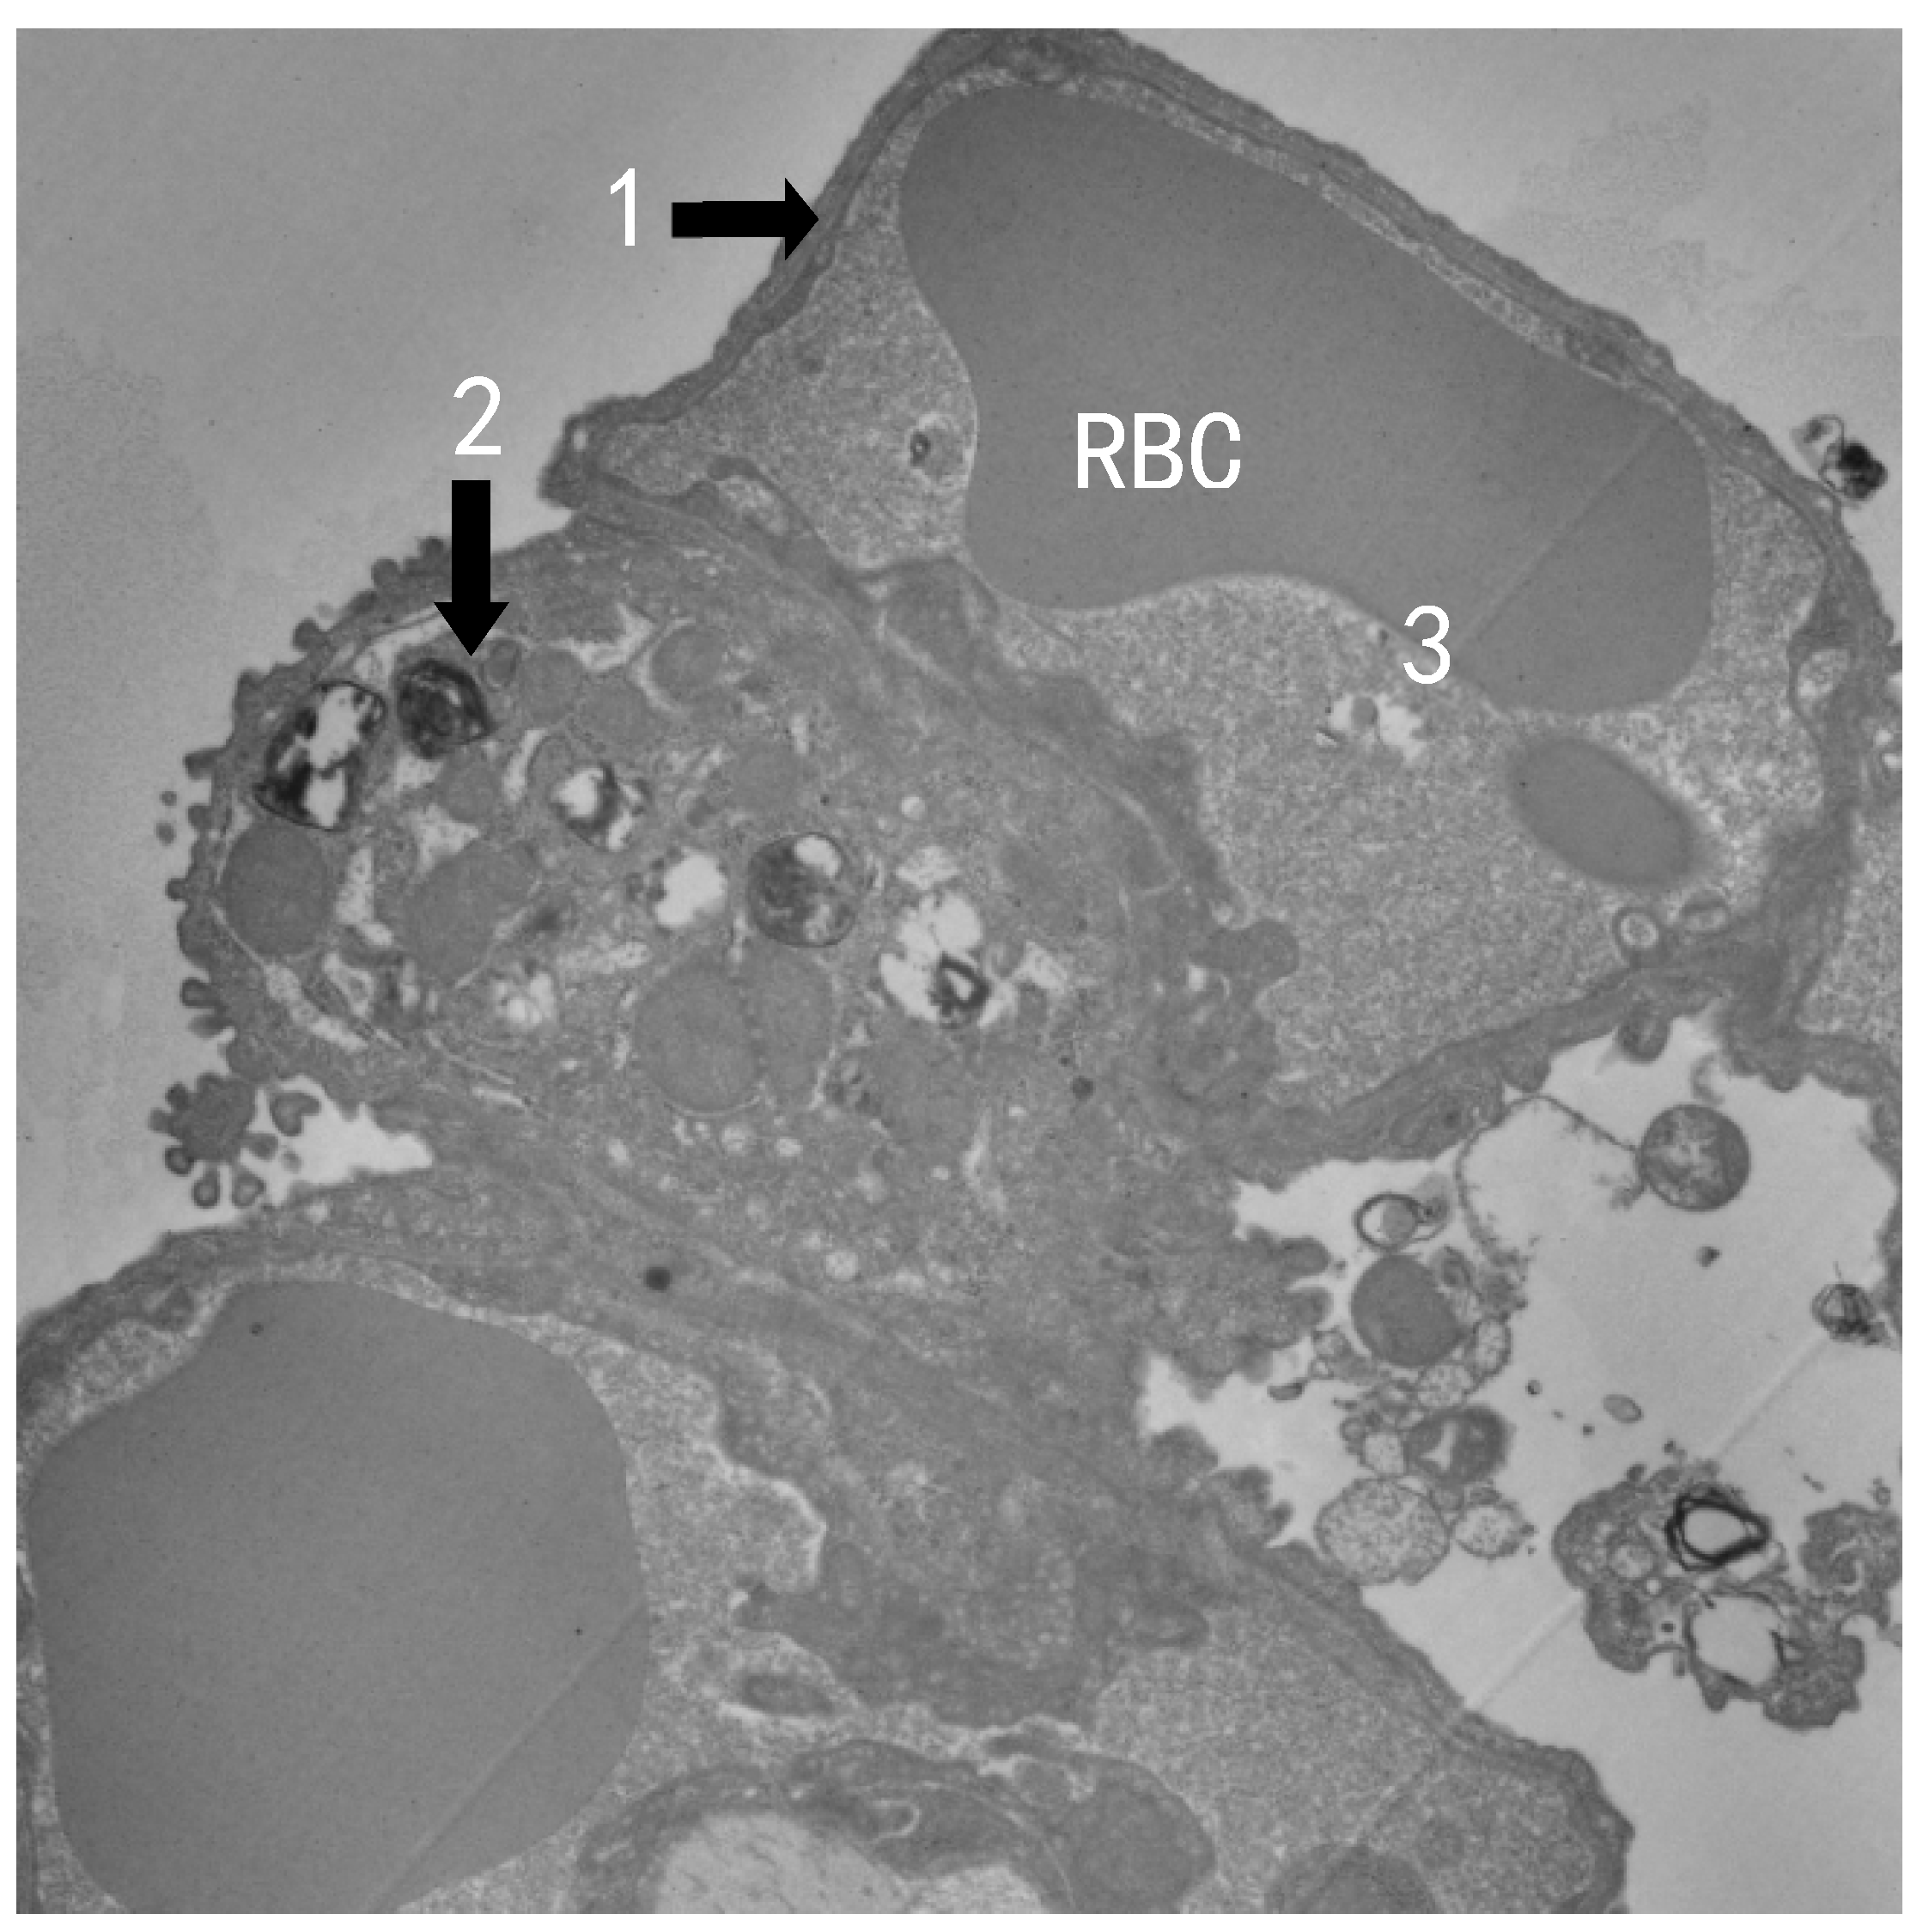
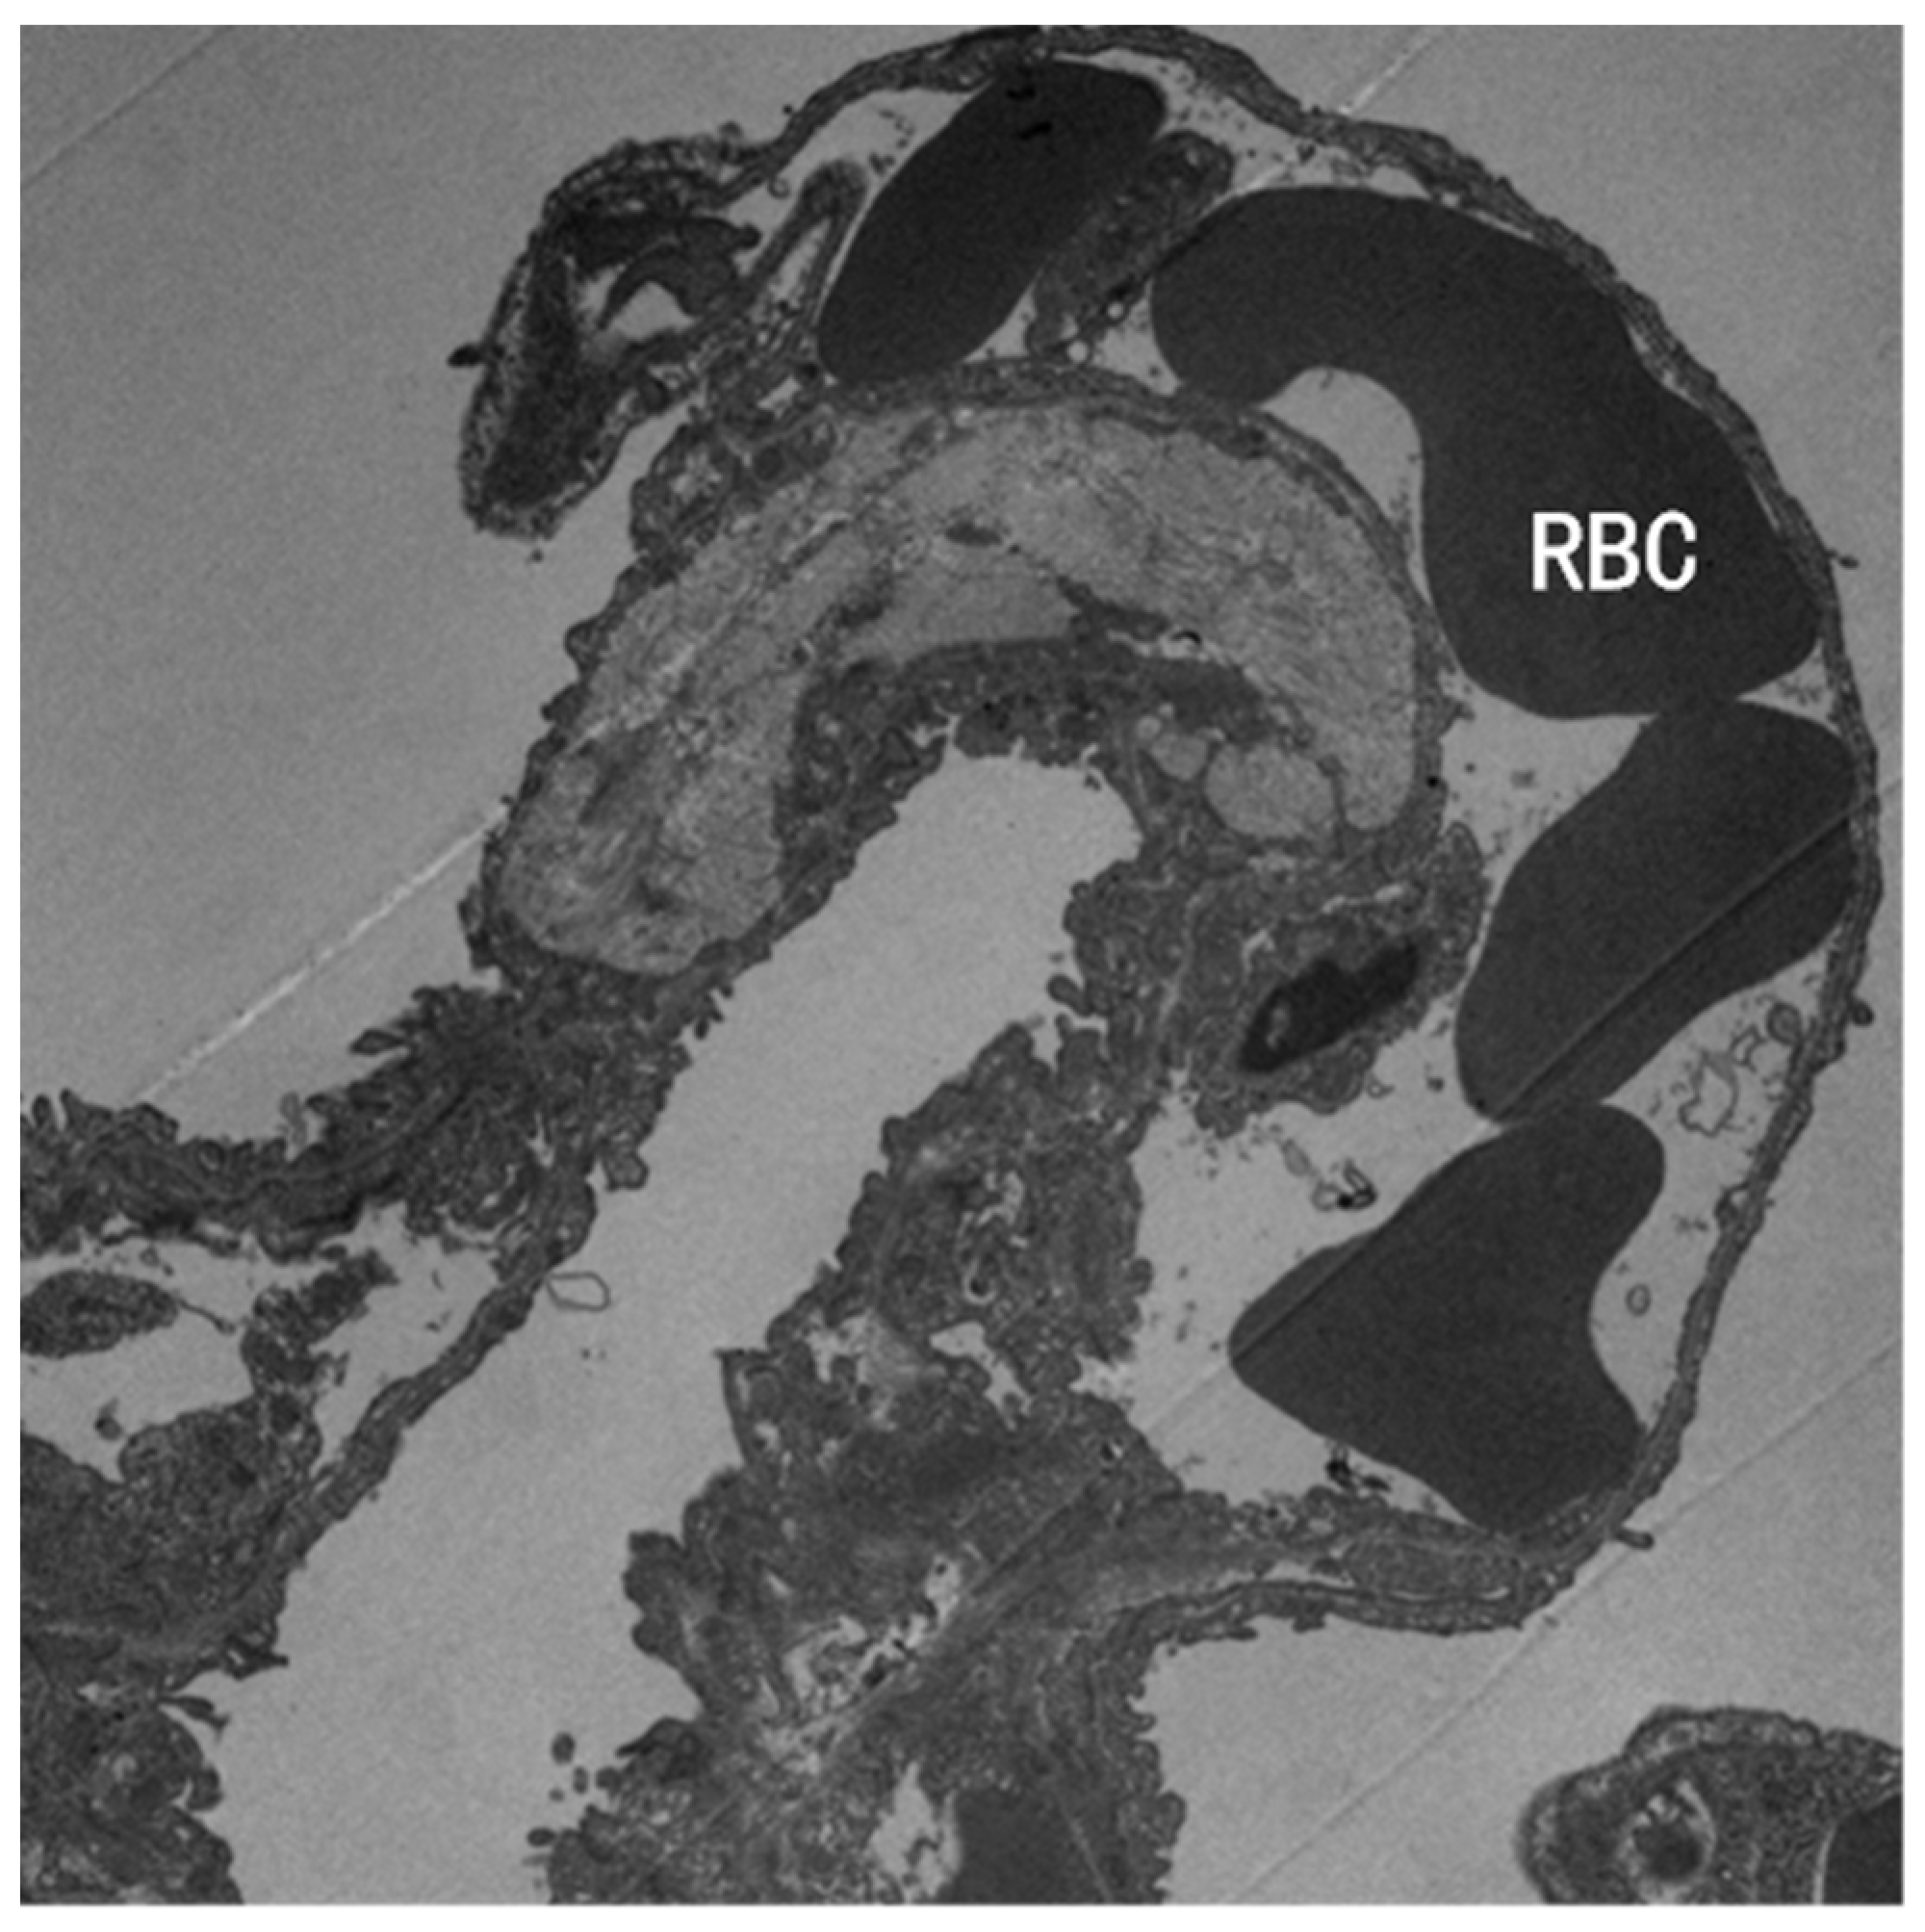
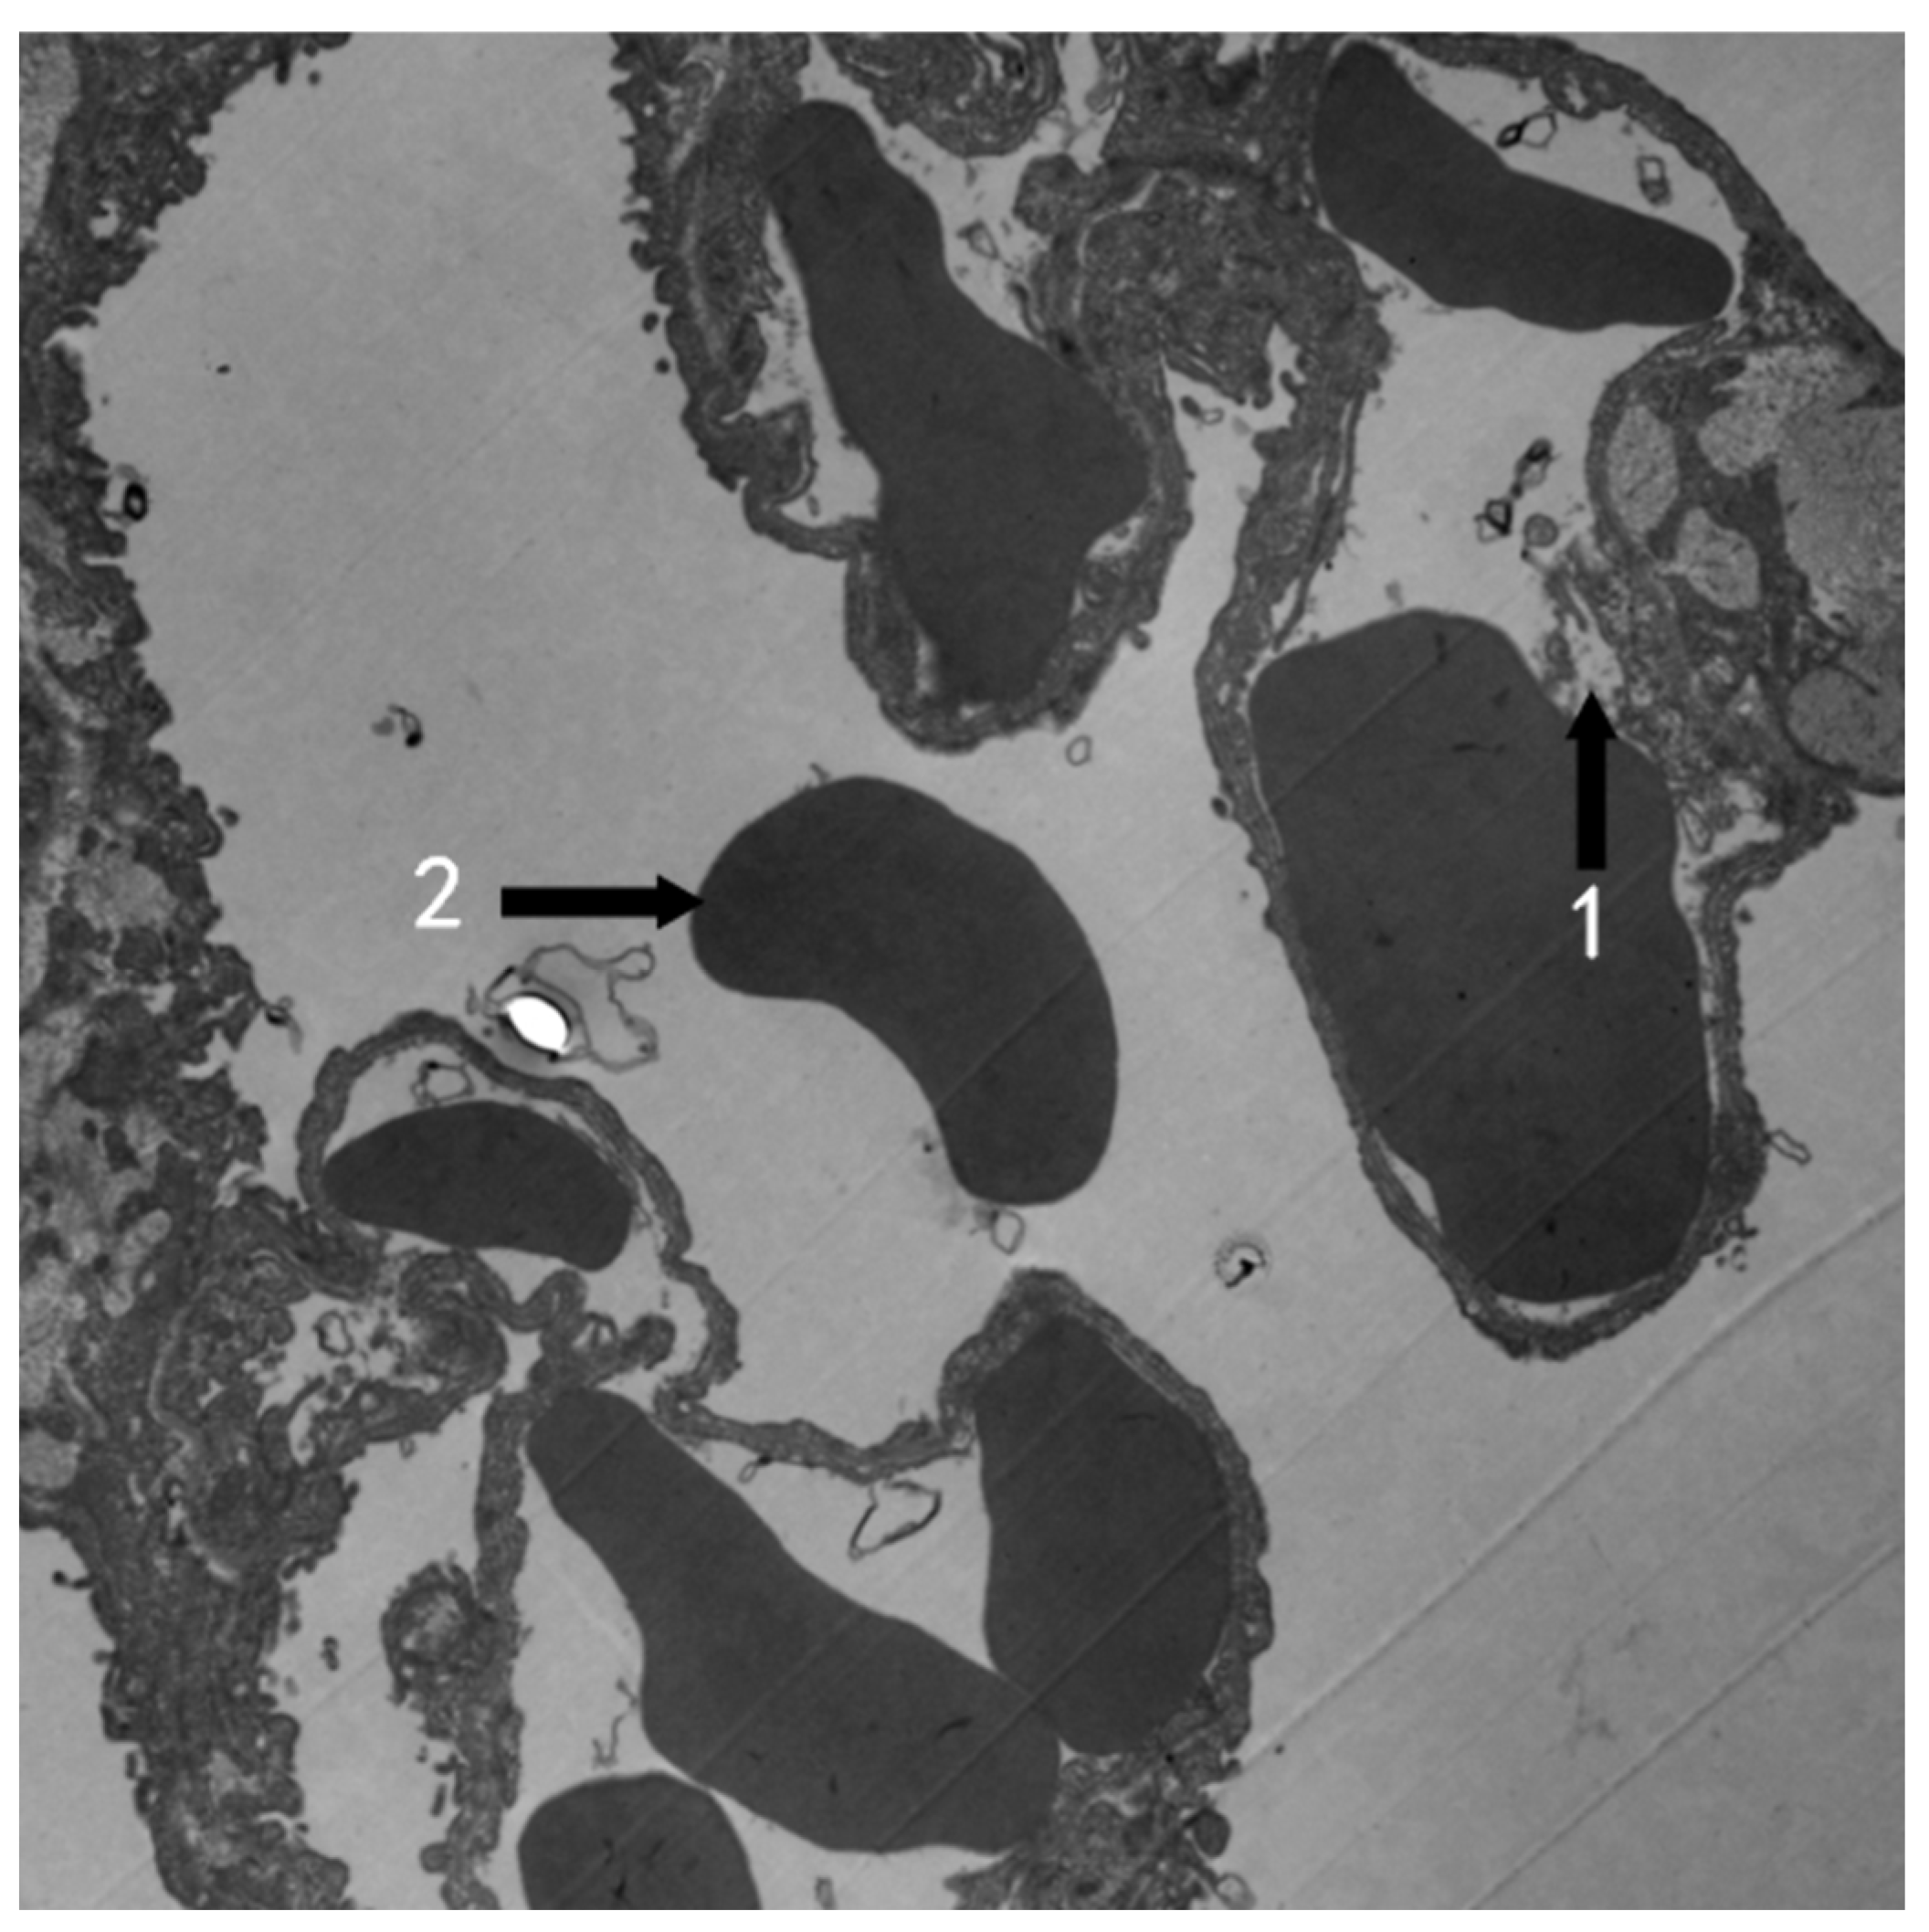
Exposed to 1.1 ppm O3 4 h per day for 30 days, shed endothelial cells were observed from the alveolar capillaries of mouse. Red blood cell was found in the alveolar space, suggesting possible bleeding (Figure 10).
3.3. The Optical Density of NQO1, NRF2, and KEAP1 Immunohistochemistry Staining
With the 1.1 ppm O3 inhalation 4 h per day for 15 days, the exposure group’s NQO1 optical density (3.46 ± 1.80) × 10−3 increased significantly (p < 0.05), but the 30 days’ exposure group’s optical density (2.83 ± 1.09) × 10−3 did not increase (p > 0.05) compared with their respective control (1.36 ± 1.14) × 10−3 and (2.77 ± 1.26) × 10−3 (Table 1, Figure 11). No meaningful changes in NRF2 and KEAP1 immunohistochemistry staining optical density were detected (Figure 11).
3.4. Effect of O3 Exposure on the Serum CRP and IL-6 Levels in Mice
The serum CRP and IL-6 levels were detected. The results showed that CRP and IL-6 levels increased in the exposed group (p < 0.05), both male and female, compared with the respective control group (Table 2).
4. Discussion
The U.S. Environmental Protection Agency considered O3 to be harmful to human health at concentrations of 0.25–0.4 ppm (average over an 8 h period), but no airway responses or inflammation were observed when mice received 0.4 ppm or less [34]. Differences in responses between mice and humans have been attributed to lung O3 deposition, which is approximately fourfold lower in resting rodents than in exercising humans [35], and higher levels of antioxidants in the mouse airway, which would have a neutralizing effect on O3 [36]. We set the O3 exposure level at 1.1 ppm (2.14 mg/m3), which is equivalent to 150 times the second-level daily standard of China’s National Ambient Air Quality Standard and almost four times the concentration that is harmful to humans considered by the U.S. Environmental Protection Agency.
Exposed to 1.1 ppm O3 4 h per day for 15 days or 30 days, the bronchus and lung in each animal had no obvious changes to be observed under an optical microscope compared with the control in our research. In Gross and White’s research [37], the rat lung after exposure to 0.5 ppm O3 for 6 months showed no evidence of classic emphysema. However, in a portion of the alveolar duct, there is alveolar thickening, which consists of loose collagen connective tissue. Many of these areas contain mononuclear chronic inflammatory cells, but no polymorphonuclear leukocytes were observed. In rat lung after 12 months’ exposure to 0.5 ppm O3, followed by a 6 month recovery in clean air, little inflammation or thickening of septa was seen. We had not seen the alveolar duct and alveolar thickening, perhaps due to the much shorter exposure time in our research than theirs. We also did not find the obvious alveolar inflammatory cell infiltrating. However, O3 does have a damaging effect on human lung cells. The IMR-90 cell line, which is more sensitive than primary cells exposed to 0.3 ppm O3 for 8 days, showed no measurable growth inhibition and no distinguishable morphologic characteristic changes. After exposure to 0.5 ppm O3 for 7 days, morphologic changes were observed, but there was no growth inhibition. Fifty percent growth inhibition was measured in the cells exposed to 0.8 ppm O3 for 8 days. Vacuole formation, a typical morphologic change, was observed in these cells [38]. In Coen H. Wiegman’s research [21], C57BL/6 mice were exposed to 3 ppm O3 for 3 h a day twice a week for a period of 1, 3, or 6 weeks. Bronchoalveolar lavage total cell counts were increased in all O3-exposed groups (2.7-fold–3.4-fold) due to increased numbers of neutrophils and macrophages. The inflammation scores increased 4.7-fold after 6 weeks’ exposure, and the chronic inflammation was associated with emphysematous changes in the lung. We did not find the same changes, probably because the O3 concentration was only 1.1 PPM in our research, lower than their 3 ppm.
Although we did not observe obvious differences between the ozone group and the control group under light microscopy, we did see significant changes under TEM (Figure 5, Figure 6, Figure 7 and Figure 10 compared with Figure 3, Figure 8 and Figure 9 compared with Figure 4). Type I alveolar epithelial cells swell with irregular edges, and more small vacuoles can be seen in the cytoplasm. Stephens et al. [39] also found that type I alveolar epithelium in rat showed marked swelling with irregular edges after 2 hours’ exposure to 0.5 ppm O3, but no vacuoles were found in the cytoplasm, perhaps due to the lower O3 density and much more shorter exposure time than that in our research.
We also found the damaged tight junctions between cells in the mouse bronchus exposure to O3 (Figure 9), prompting that the bronchus was injured. The slightly widened goblet cell nuclear space and binuclear columnar cells and goblet cells prompted the active cell proliferation to repair damaged bronchi.
Boatman and Frank [40] observed an alveolar area of rabbit exposed to 1.0 ppm O3 for 3 h per day. On day 2, the type 1 epithelium was found to show focal swelling and the capillary endothelium was disrupted. Type 2 cells showed cytoplasmic changes similar to our finding (in Figure 7, type II alveolar epithelial cells are apparently emptying of lamellar bodies). We also found telangiectasia and congestion (Figure 7), and the capillary shed endothelial cells and red blood cells in the alveolar cavity, prompting that there may be bleeding (Figure 10).
The damage of ozone to lung tissue has also been shown in other studies. The embryonic rats’ lung may be hurt with the mother’s exposure to 1 ppm O3. Ultrastructural analysis evidenced swollen mitochondria, cytoplasmic vacuolization of the epithelial cells, and structural disorder caused by the oxidative stress [41]. High concentrations of O3 showed greater damage to the alveoli. Squirrel monkeys were exposed to 3 ppm O3 for 3 h with intermittent exercise. The damage was obvious on the first day. Most of the damage was sustained by the epithelial lining either degenerating or completely gone. In some places of interstitial edema, the blood–air barrier was thickened. Fibrin was present in many alveoli [42]. Importantly, combined exposure to both 0.1 ppm O3 and particulate matter (PM) resulted in an increased number of particles penetrating the A549 cells (human lung cancer adherent cells) and increased levels of lipid peroxidation markers 4-hydroxynonenal (4HNE), compared with PM exposure alone in TEM research [43].
We have some unique discoveries that have not been reported before. In mouse bronchus exposure to 1.1 ppm O3 4 h per day for 15 days, the goblet cell nuclear space was slightly widened, and binuclear columnar cells and binuclear goblet cells could be seen (Figure 8 and Figure 9). This suggests that cells are dividing more actively in response to injury.
Although micromorphology and ultrastructure were the focus of the study, we also examined the optical density of NQO1, NRF2, and KEAP1 immunohistochemistry stained mouse lung sections and the levels of the inflammatory cytokines CRP and IL-6 in plasma to understand whether the effects of ozone on ultrastructural changes in mouse lung and bronchus were accompanied by oxidative stress and inflammatory responses.
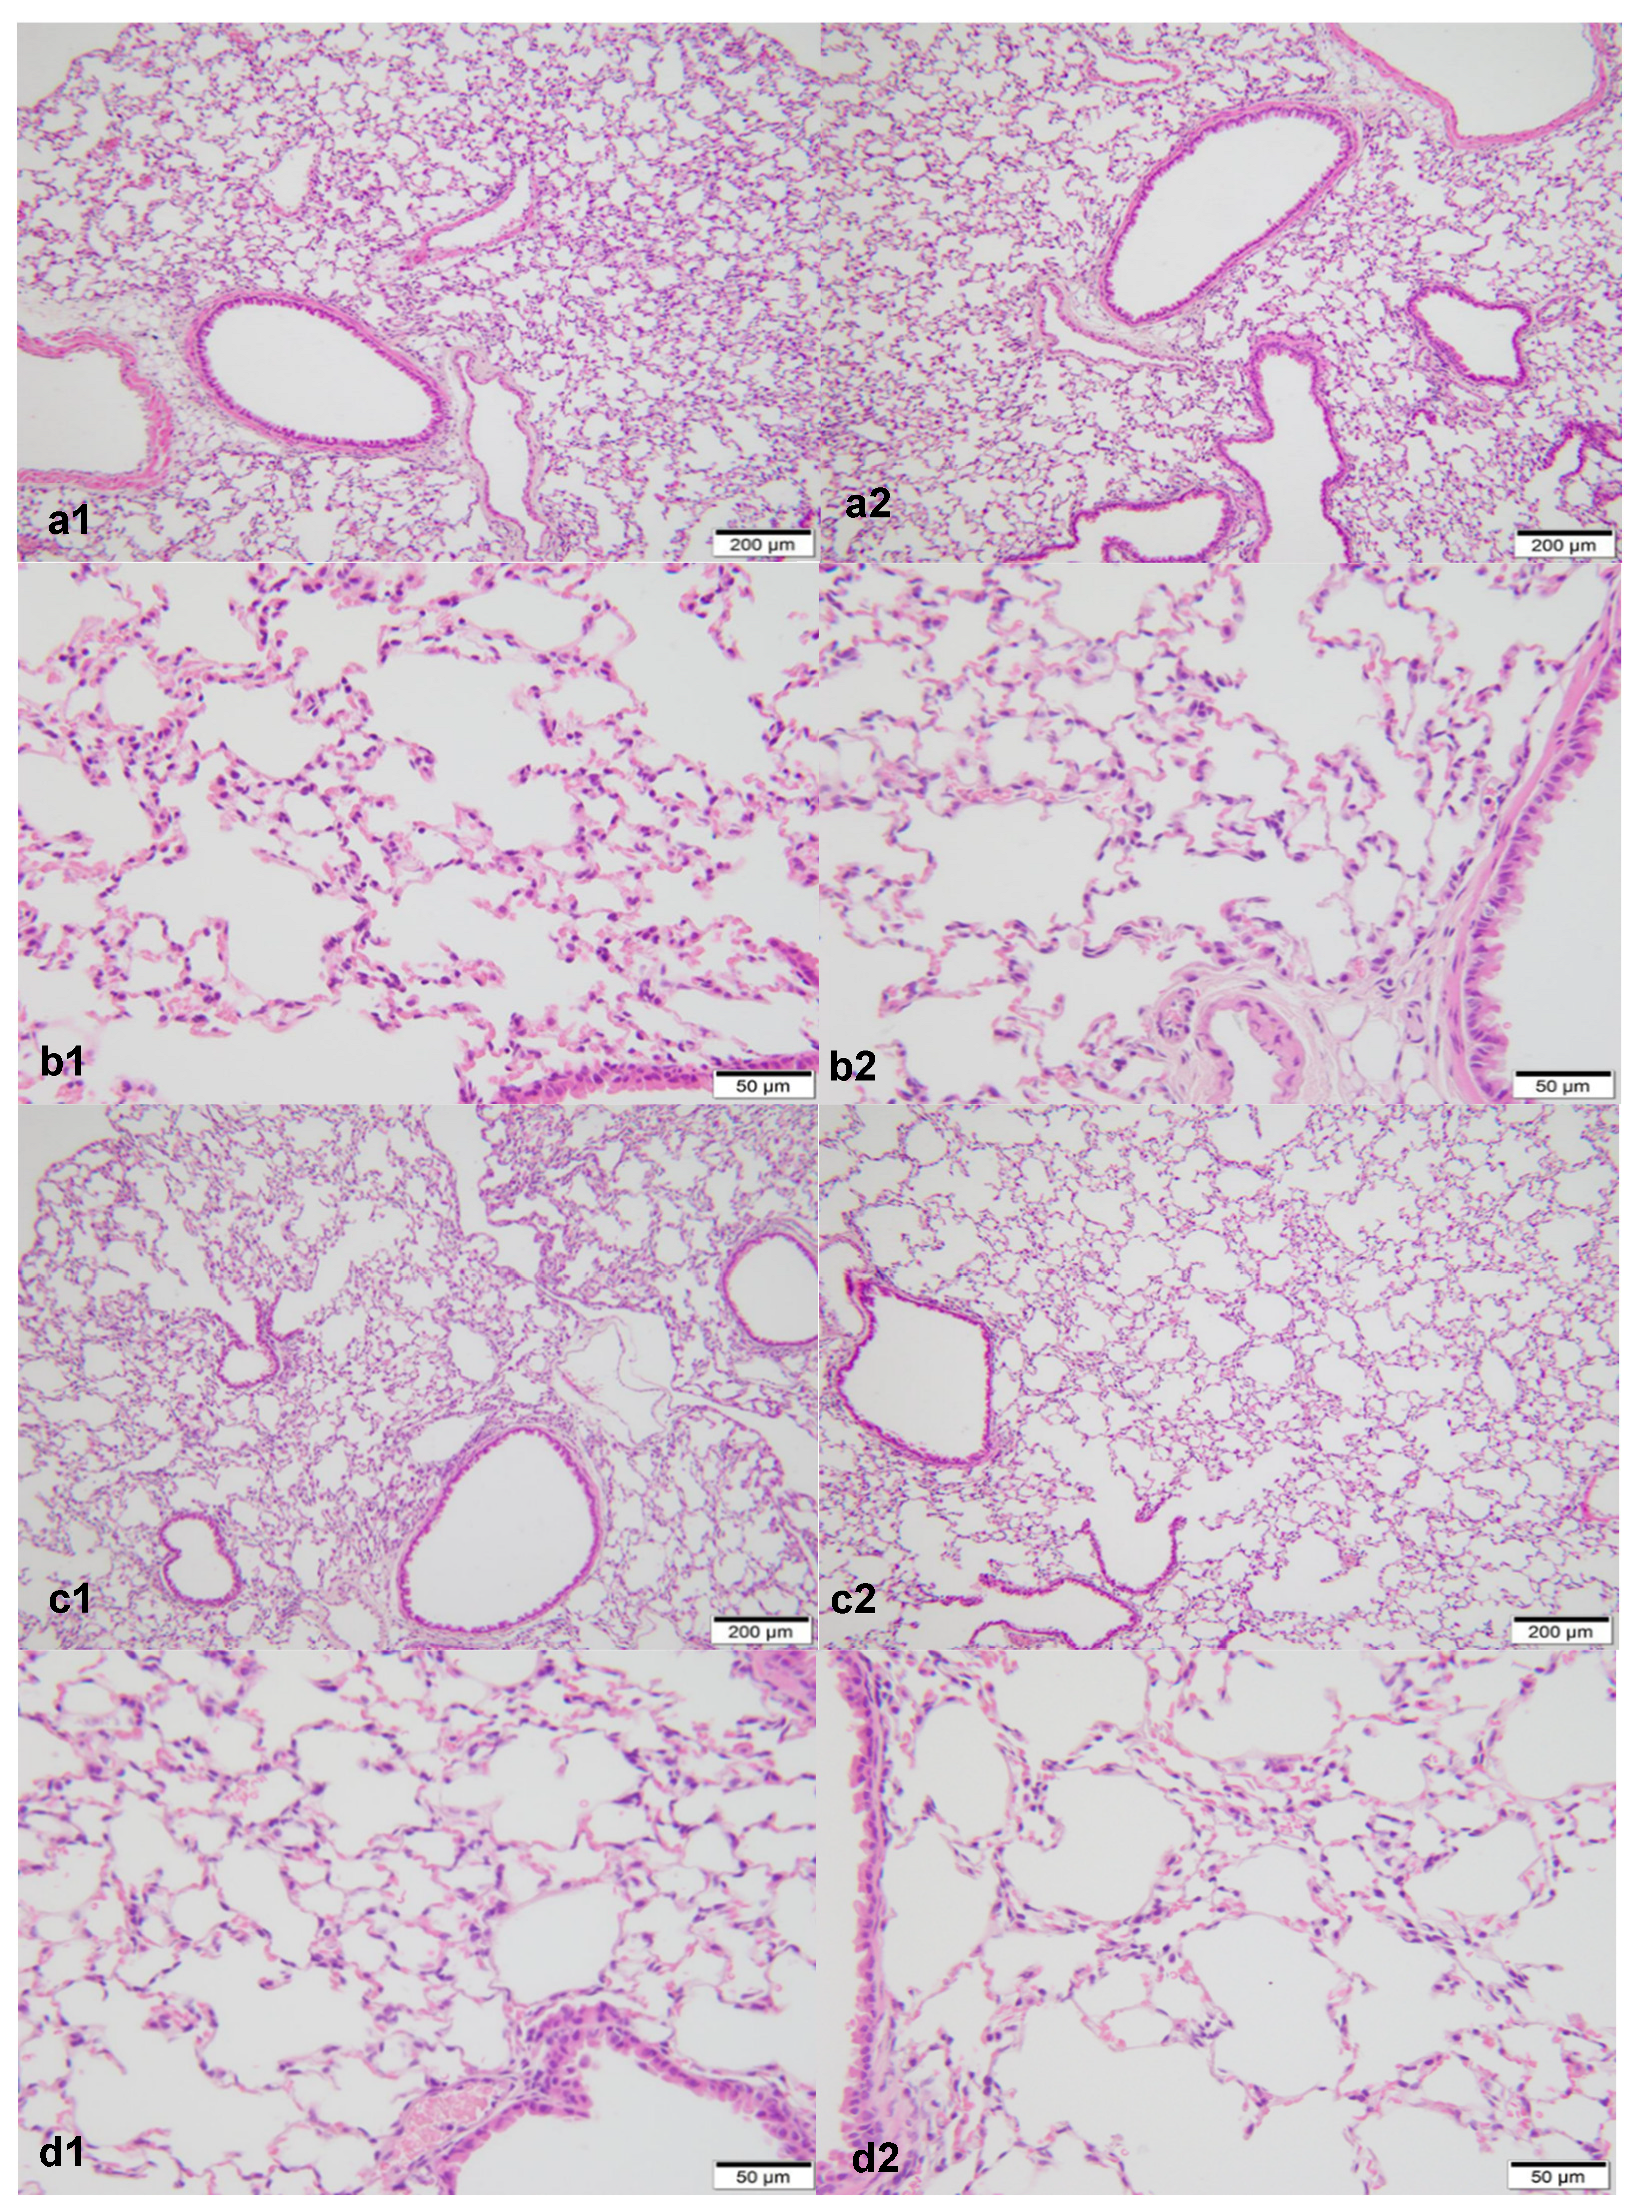
NQO1 is a major susceptibility gene for O3-induced pulmonary toxicity [44]. We found that the NQO1 increased in the mouse lung exposed to 1.1 ppm O3 4 h per day for 15 days, but did not increase in the same exposure for 30 days significantly compared with the controls (Table 1, Figure 11). Zhu et al. [45] found that NRF2 and NQO1 did not increase in mouse lungs exposed to 1 ppm O3 for a week, but both of them increased in mouse lungs with the same exposure for a week with vitamin E administration. Their results suggested that vitamin E activated the NRF2 pathway in the oxidative stress. Although we observed HE-stained mouse lung slices under an optical microscope and found no obvious damage caused by exposure to O3 (Figure 1 and Figure 2), and no meaningful changes in NRF2 and Keap1 immunohistochemistry staining optical density were detected, the increased optical density of NQO1 indicated that it did experience oxidative stress to a certain extent (Figure 11, Table 1).
Wiegman et al. exposed mice to 3 ppm O3 for 3 h a day twice a week, and BALF IL-6 levels increased 3.9-, 1.9-, and 2.0-fold in the 1-, 3-, and 6-week exposure groups, respectively [21]. In our research, the serum inflammatory cytokines CRP and IL-6 levels were increased in the O3 exposure group compared with the control (Table 2) (p < 0.05). The results hint that the mice in the O3 exposure group suffered from inflammation in their lungs.
O3 can cause damage to the respiratory system when it reaches a certain concentration, and bring diseases and economic burden. Some institutions still use O3 for clinical treatment [46] and environmental disinfection [47]. Especially, ultraviolet disinfection is widely used in wards, classrooms, and other places, and O3 is also generated during disinfection [48]. The US FDA has warned that the agency has not cleared any devices that use ozone gas or UV light to clean, sanitize, or disinfect continuous positive airway pressure (CPAP) devices, and there are 11 reports from patients who developed breathing discomfort or headache when they used ozone-gas-based products to clean, sanitize, or disinfect their CPAP devices and accessories [49]. Sufficient attention should be paid to this problem, and corresponding measures should be taken to protect personnel to prevent ozone from harming the public and workers.
We focused our research on ultrastructural changes in this article. Using TEM for research, changes in cell structure can be observed more intuitively and clearly. We measured the optical density of NQO1, NRF2, and KEAP1 histochemically stained sections by light microscopy, a convenient method that has the limitation of being less sensitive than genetic testing.
5. Conclusions
Although inhaling 1.1 ppm O3 4 h per day for 15 or 30 days had no significant effect on the micromorphology of mice lungs and bronchi, it did have an effect on ultrastructural changes in lungs and bronchi accompanied by oxidative stress and inflammatory responses. The damage of ozone to the human body is easily overlooked. Sufficient attention should be paid to this problem.
Author Contributions
Conceptualization, S.L. and Q.Q.; data curation, Y.S.; formal analysis, S.L.; funding acquisition, S.L., Y.S. and Q.Q.; investigation, Y.S., C.Y., H.L., C.S. and Y.X.; methodology, S.L., Y.S., C.Y. and H.L.; project administration, S.L.; resources, S.L. and Q.Q.; validation, S.L.; visualization, C.Y., H.L. and C.S.; writing—original draft, Y.X.; writing—review and editing, S.L., W.Z. and A.Z. All authors have read and agreed to the published version of the manuscript.
Funding
This research was funded by the National Natural Science Foundation of China under grant number 41471414 and the Natural Science Foundation of Guangdong Province, China, under grant numbers 2018A0303130226 and 2019A1515011679.
Institutional Review Board Statement
The study was conducted according to the guidelines of the Declaration of Helsinki, and approved by the Ethics Committee of Shenzhen Occupational Diseases Prevention and Treatment Center, Shenzhen 518020, China (protocol code: LL-202147, September 15th, 2021).
Informed Consent Statement
Not applicable.
Data Availability Statement
Not applicable.
Acknowledgments
Thanks to the staff of the Guangdong Medical Laboratory Animal Center, especially Zhiyong Zhong. They provided and raised animals and provided pathology laboratory equipment and technical support.
Conflicts of Interest
No potential conflicts of interest were reported by the authors. The funder had no role in the design of the study; in the collection, analyses, or interpretation of data; in the writing of the manuscript; or in the decision to publish the results.
References
- Erickson, L.E.; Newmark, G.L.; Higgins, M.J.; Wang, Z.X. Nitrogen oxides and ozone in urban air: A review of 50 plus years of progress. Environ. Prog. Sustain. Energy 2020, 39, e13484. [Google Scholar] [CrossRef]
- Li, W.; Shao, L.; Wang, W.; Li, H.; Wang, X.; Li, Y.; Li, W.; Jones, T.; Zhang, D. Air quality improvement in response to intensified control strategies in Beijing during 2013–2019. Sci. Total Environ. 2020, 744, 140776. [Google Scholar] [CrossRef]
- Qu, L.; Liu, S.; Ma, L.; Zhang, Z.; Du, J.; Zhou, Y.; Meng, F. Evaluating the meteorological normalized PM trend (2014–2019) in the “2+26” region of China using an ensemble learning technique. Environ. Pollut. 2020, 266, 115346. [Google Scholar] [CrossRef]
- Zheng, B.; Tong, D.; Li, M.; Liu, F.; Hong, C.; Geng, G.; Li, H.; Li, X.; Peng, L.; Qi, J.; et al. Trends in China’s anthropogenic emissions since 2010 as the consequence of clean air actions. Atmos. Chem. Phys. 2018, 18, 14095–14111. [Google Scholar] [CrossRef]
- Zhao, S.; Yin, D.; Yu, Y.; Kang, S.; Qin, D.; Dong, L. PM2.5 and O3 pollution during 2015–2019 over 367 Chinese cities: Spatiotemporal variations, meteorological and topographical impacts. Environ. Pollut. 2020, 264, 114694. [Google Scholar] [CrossRef]
- Ziemke, J.R.; Oman, L.D.; Strode, S.A.; Douglass, A.R.; Olsen, M.A.; McPeters, R.D.; Bhartia, P.K.; Froidevaux, L.; Labow, G.J.; Witte, J.C.; et al. Trends in global tropospheric ozone inferred from a composite record of TOMS/OMI/MLS/OMPS satellite measurements and the MERRA-2 GMI simulation. Atmos. Chem. Phys. 2019, 19, 3257–3269. [Google Scholar] [CrossRef]
- Sillman, S. The relation between ozone, NOx and hydrocarbons in urban and polluted rural environments. Atmos. Environ. 1999, 33, 1821–1845. [Google Scholar] [CrossRef]
- Galiè, M.; Covi, V.; Tabaracci, G.; Malatesta, M. The Role of NRF2 in the Antioxidant Cellular Response to Medical Ozone Exposure. Int. J. Mol. Sci. 2019, 20, 4009. [Google Scholar] [CrossRef]
- Hernández Rosales, F.A.; Calunga Fernández, J.L.; Turrent Figueras, J.; Menéndez Cepero, S.; Montenegro Perdomo, A. Ozone therapy effects on biomarkers and lung function in asthma. Arch. Med. Res. 2005, 36, 549–554. [Google Scholar] [CrossRef]
- Bocci, V.; Borrelli, E.; Travagli, V.; Zanardi, I. The ozone paradox: Ozone is a strong oxidant as well as a medical drug. Med. Res. Rev. 2009, 29, 646–682. [Google Scholar] [CrossRef]
- Santana-Rodríguez, N.; Llontop, P.; Clavo, B.; Fiuza-Pérez, M.D.; Zerecero, K.; Ayub, A.; Alshehri, K.; Yordi, N.A.; Re, L.; Raad, W.; et al. Ozone Therapy Protects Against Rejection in a Lung Transplantation Model: A New Treatment? Ann. Thorac. Surg. 2017, 104, 458–464. [Google Scholar] [CrossRef] [PubMed]
- Turner, M.C.; Jerrett, M.; Pope, I.I.I.C.A.; Krewski, D.; Gapstur, S.M.; Diver, W.R.; Beckerman, B.S.; Marshall, J.D.; Su, J.; Crouse, D.L.; et al. Long-Term Ozone Exposure and Mortality in a Large Prospective Study. Am. J. Respir. Crit. Care Med. 2016, 193, 1134–1142. [Google Scholar] [CrossRef] [PubMed]
- Paulin, L.M.; Gassett, A.J.; Alexis, N.E.; Kirwa, K.; Kanner, R.E.; Peters, S.; Krishnan, J.A.; Paine, R.; Dransfield, M.; Woodruff, P.G.; et al. Association of Long-term Ambient Ozone Exposure with Respiratory Morbidity in Smokers. JAMA Intern. Med. 2020, 180, 106–115. [Google Scholar] [CrossRef]
- Wang, M.; Aaron, C.P.; Madrigano, J.; Hoffman, E.A.; Angelini, E.; Yang, J.; Laine, A.; Vetterli, T.M.; Kinney, P.L.; Sampson, P.D.; et al. Association Between Long-term Exposure to Ambient Air Pollution and Change in Quantitatively Assessed Emphysema and Lung Function. JAMA 2019, 322, 546–556. [Google Scholar] [CrossRef]
- Bell, M.L.; McDermott, A.; Zeger, S.L.; Samet, J.M.; Dominici, F. Ozone and short-term mortality in 95 US urban communities, 1987–2000. JAMA 2004, 292, 2372–2378. [Google Scholar] [CrossRef] [PubMed]
- Vicedo-Cabrera, A.M.; Sera, F.; Liu, C.; Armstrong, B.; Milojevic, A.; Guo, Y.; Tong, S.; Lavigne, E.; Kyselý, J.; Urban, A.; et al. Short term association between ozone and mortality: Global two stage time series study in 406 locations in 20 countries. BMJ 2020, 368, m108. [Google Scholar] [CrossRef] [PubMed]
- Zhang, Z.; Yao, M.; Wu, W.; Zhao, X.; Zhang, J. Spatiotemporal assessment of health burden and economic losses attributable to short-term exposure to ground-level ozone during 2015–2018 in China. BMC Public Health 2021, 21, 1069. [Google Scholar] [CrossRef]
- Liang, S.; Sun, C.; Liu, C.; Jiang, L.; Xie, Y.; Yan, S.; Jiang, Z.; Qi, Q.; Zhang, A. The Influence of Air Pollutants and Meteorological Conditions on the Hospitalization for Respiratory Diseases in Shenzhen City, China. Int. J. Environ. Res. Public Health 2021, 18, 5120. [Google Scholar] [CrossRef] [PubMed]
- Li, F.; Xu, M.; Wang, M.; Wang, L.; Wang, H.; Zhang, H.; Chen, Y.; Gong, J.; Zhang, J.J.; Adcock, I.M.; et al. Roles of mitochondrial ROS and NLRP3 inflammasome in multiple ozone-induced lung inflammation and emphysema. Respir. Res. 2018, 19, 230. [Google Scholar] [CrossRef]
- Bromberg, P.A. Mechanisms of the acute effects of inhaled ozone in humans. Biochim. Biophys. Acta 2016, 1860, 2771–2781. [Google Scholar] [CrossRef] [PubMed]
- Wiegman, C.H.; Li, F.; Clarke, C.J.; Jazrawi, E.; Kirkham, P.; Barnes, P.J.; Adcock, I.M.; Chung, K.F. A comprehensive analysis of oxidative stress in the ozone-induced lung inflammation mouse model. Clin. Sci. 2014, 126, 425–440. [Google Scholar] [CrossRef]
- Chung, K.F.; Togbe, D.; Ryffel, B. Editorial: Ozone as a Driver of Lung Inflammation and Innate Immunity and as a Model for Lung Disease. Front. Immunol. 2021, 12, 714161. [Google Scholar] [CrossRef]
- Dai, Y.; Qiu, H.; Sun, S.; Yang, Y.; Lin, H.; Tian, L. Age-dependent effect of ambient ozone on emergency asthma hospitalizations in Hong Kong. J. Allergy Clin. Immunol. 2018, 141, 1532–1534.e5. [Google Scholar] [CrossRef] [PubMed]
- Moore, K.; Neugebauer, R.; Lurmann, F.; Hall, J.; Brajer, V.; Alcorn, S.; Tager, I. Ambient ozone concentrations cause increased hospitalizations for asthma in children: An 18-year study in Southern California. Environ. Health Perspect. 2008, 116, 1063–1070. [Google Scholar] [CrossRef]
- Li, X.; Chen, Q.; Zheng, X.; Li, Y.; Han, M.; Liu, T.; Xiao, J.; Guo, L.; Zeng, W.; Zhang, J.; et al. Effects of ambient ozone concentrations with different averaging times on asthma exacerbations: A meta-analysis. Sci. Total Environ. 2019, 691, 549–561. [Google Scholar] [CrossRef] [PubMed]
- Shmool, J.L.C.; Kinnee, E.; Sheffield, P.E.; Clougherty, J.E. Spatio-temporal ozone variation in a case-crossover analysis of childhood asthma hospital visits in New York City. Environ. Res. 2016, 147, 108–114. [Google Scholar] [CrossRef]
- Gao, H.; Wang, K.; WAu, W.; Zhao, W.; Xia, Z.-L. A Systematic Review and Meta-Analysis of Short-Term Ambient Ozone Exposure and COPD Hospitalizations. Int. J. Environ. Res. Public Health 2020, 17, 2130. [Google Scholar] [CrossRef]
- Kesic, M.J.; Meyer, M.; Bauer, R.; Jaspers, I. Exposure to ozone modulates human airway protease/antiprotease balance contributing to increased influenza A infection. PLoS ONE 2012, 7, e35108. [Google Scholar] [CrossRef] [PubMed]
- Purvis, M.R.; Miller, S.; Ehrlich, R. Effect of atmospheric pollutants on susceptibility to respiratory infection. I. Effect of ozone. J. Infect. Dis. 1961, 109, 238–242. [Google Scholar] [CrossRef] [PubMed]
- Farhat, S.C.L.; Almeida, M.B.; Silva-Filho, L.V.R.F.; Farhat, J.; Rodrigues, J.C.; Braga, A.L.F. Ozone is associated with an increased risk of respiratory exacerbations in patients with cystic fibrosis. Chest 2013, 144, 1186–1192. [Google Scholar] [CrossRef]
- Tu, W.; Wang, H.; Li, S.; Liu, Q.; Sha, H. The Anti-Inflammatory and Anti-Oxidant Mechanisms of the KEAP1/NRF2/ARE Signaling Pathway in Chronic Diseases. Aging Dis. 2019, 10, 637–651. [Google Scholar] [CrossRef] [PubMed]
- Bellezza, I.; Giambanco, I.; Minelli, A.; Donato, R. NRF2-KEAP1 signaling in oxidative and reductive stress. Biochim. Biophys. Acta Mol. Cell Res. 2018, 1865, 721–733. [Google Scholar] [CrossRef] [PubMed]
- Lu, M.-C.; Ji, J.-A.; Jiang, Z.-Y.; You, Q.-D. The KEAP1-NRF2-ARE Pathway as a Potential Preventive and Therapeutic Target: An Update. Med. Res. Rev. 2016, 36, 924–963. [Google Scholar] [CrossRef] [PubMed]
- Erickson, M.A.; Jude, J.; Zhao, H.; Rhea, E.M.; Salameh, T.S.; Jester, W.; Pu, S.; Harrowitz, J.; Nguyen, N.; Banks, W.A.; et al. Serum amyloid A: An ozone-induced circulating factor with potentially important functions in the lung-brain axis. FASEB J. 2017, 31, 3950–3965. [Google Scholar] [CrossRef] [PubMed]
- Hatch, G.E.; Slade, R.; Harris, L.P.; McDonnell, W.F.; Devlin, R.B.; Koren, H.S.; Costa, D.L.; McKee, J. Ozone dose and effect in humans and rats. A comparison using oxygen-18 labeling and bronchoalveolar lavage. Am. J. Respir. Crit. Care Med. 1994, 150, 676–683. [Google Scholar] [CrossRef]
- Slade, R.; Stead, A.G.; Graham, J.A.; Hatch, G.E. Comparison of lung antioxidant levels in humans and laboratory animals. Am. Rev. Respir. Dis. 1985, 131, 742–746. [Google Scholar] [CrossRef]
- Gross, K.B.; White, H.J. Functional and pathologic consequences of a 52-week exposure to 0.5 PPM ozone followed by a clean air recovery period. Lung 1987, 165, 283–295. [Google Scholar] [CrossRef]
- Hagar, W.L.; Sweet, W.E.; Sweet, F. An in vitro system for assessing lung cell response to ozone. J. Air Pollut. Control. Assoc. 1981, 31, 933–935. [Google Scholar] [CrossRef]
- Stephens, R.J.; Evans, M.J.; Sloan, M.F.; Freeman, G. A comprehensive ultrastructural study of pulmonary injury and repair in the rat resulting from exposures to less than one PPM ozone. Chest 1974, 65, 11S–13S. [Google Scholar] [CrossRef]
- Boatman, E.S.; Frank, R. Morphologic and ultrastructural changes in the lungs of animals during acute exposure to ozone. Chest 1974, 65, 9S–11S. [Google Scholar] [CrossRef]
- López, I.; Sánchez, I.; Bizarro, P.; Acevedo, S.; Ustarroz, M.; Fortoul, T. Ultrastructural alterations during embryonic rats’ lung development caused by ozone. J. Electron. Microsc. 2008, 57, 19–23. [Google Scholar] [CrossRef] [PubMed]
- Bils, R.F. Effects of nitrogen dioxide and ozone on monkey lung ultrastructure. Pneumonologie 1974, 150, 99–111. [Google Scholar] [CrossRef] [PubMed]
- Cervellati, F.; Woodby, B.; Benedusi, M.; Ferrara, F.; Guiotto, A.; Valacchi, G. Evaluation of oxidative damage and NRF2 activation by combined pollution exposure in lung epithelial cells. Environ. Sci. Pollut. Res. Int. 2020, 27, 31841–31853. [Google Scholar] [CrossRef]
- Kummarapurugu, A.B.; Fischer, B.M.; Zheng, S.; Milne, G.L.; Ghio, A.J.; Potts-Kant, E.N.; Foster, W.M.; Soderblom, E.J.; Dubois, L.G.; Moseley, M.A.; et al. NADPH:quinone oxidoreductase 1 regulates host susceptibility to ozone via isoprostane generation. J. Biol. Chem. 2013, 288, 4681–4691. [Google Scholar] [CrossRef]
- Zhu, Y.; Li, J.; Wu, Z.; Lu, Y.; You, H.; Li, R.; Li, B.; Yang, X.; Duan, L. Acute exposure of ozone induced pulmonary injury and the protective role of vitamin E through the NRF2 pathway in Balb/c mice. Toxicol. Res. 2015, 5, 268–277. [Google Scholar] [CrossRef]
- Shah, M.; Captain, J.; Vaidya, V.; Kulkarni, A.; Valsangkar, K.; Nair, P.M.; Ganu, G. Safety and efficacy of ozone therapy in mild to moderate COVID-19 patients: A phase 1/11 randomized control trial (SEOT study). Inter. Immunopharmacol. 2021, 91, 107301. [Google Scholar] [CrossRef] [PubMed]
- Epelle, E.I.; Macfarlane, A.; Cusack, M.; Burns, A.; Thissera, B.; Mackay, W.; Rateb, M.E.; Yaseen, M. Bacterial and fungal disinfection via ozonation in air. J. Microbiol. Methods 2022, 194, 106431. [Google Scholar] [CrossRef]
- Wu, Q.; Wan, M.; Li, Q.; Fu, Z. Study on the measurement method of vacuum ultraviolet (185 nm) radiation and ozone output production characteristics of ultraviolet lamps. China Lighting Electr. Appl. 2021, 8, 20. [Google Scholar]
- Voelker, R. Warning about cleaning CPAP devices with ozone gas, UV light. JAMA 2020, 323, 1236. [Google Scholar] [CrossRef]
Figure 1.
The effect of 1.1 ppm O3 exposure 4 h/day for 15 or 30 days on the micromorphological changes of lungs in experimental mice. (a1) Control, 15 days, HE, ×100; (a2) O3, 15 days, HE, ×100. (b1) Control, 15 days, HE, ×400; (b2) O3, 15 days, HE, ×400. (c1) Control, 30 days, HE, ×100; (c2) O3, 30 days, HE, ×100. (d1) Control, 30 days, HE, ×400; (d2) O3, 30 days, HE, ×400. Compared with the controls, there was no obvious abnormality to be observed in the O3 exposure groups in the structures of the bronchial tubes at all levels in the lung seemed normal, and there were no expansion or contraction of the alveolar cavity, no inflammatory cells, no expansion or stenosis of the interstitial blood vessels, and no inflammatory cell infiltration.

Figure 2.
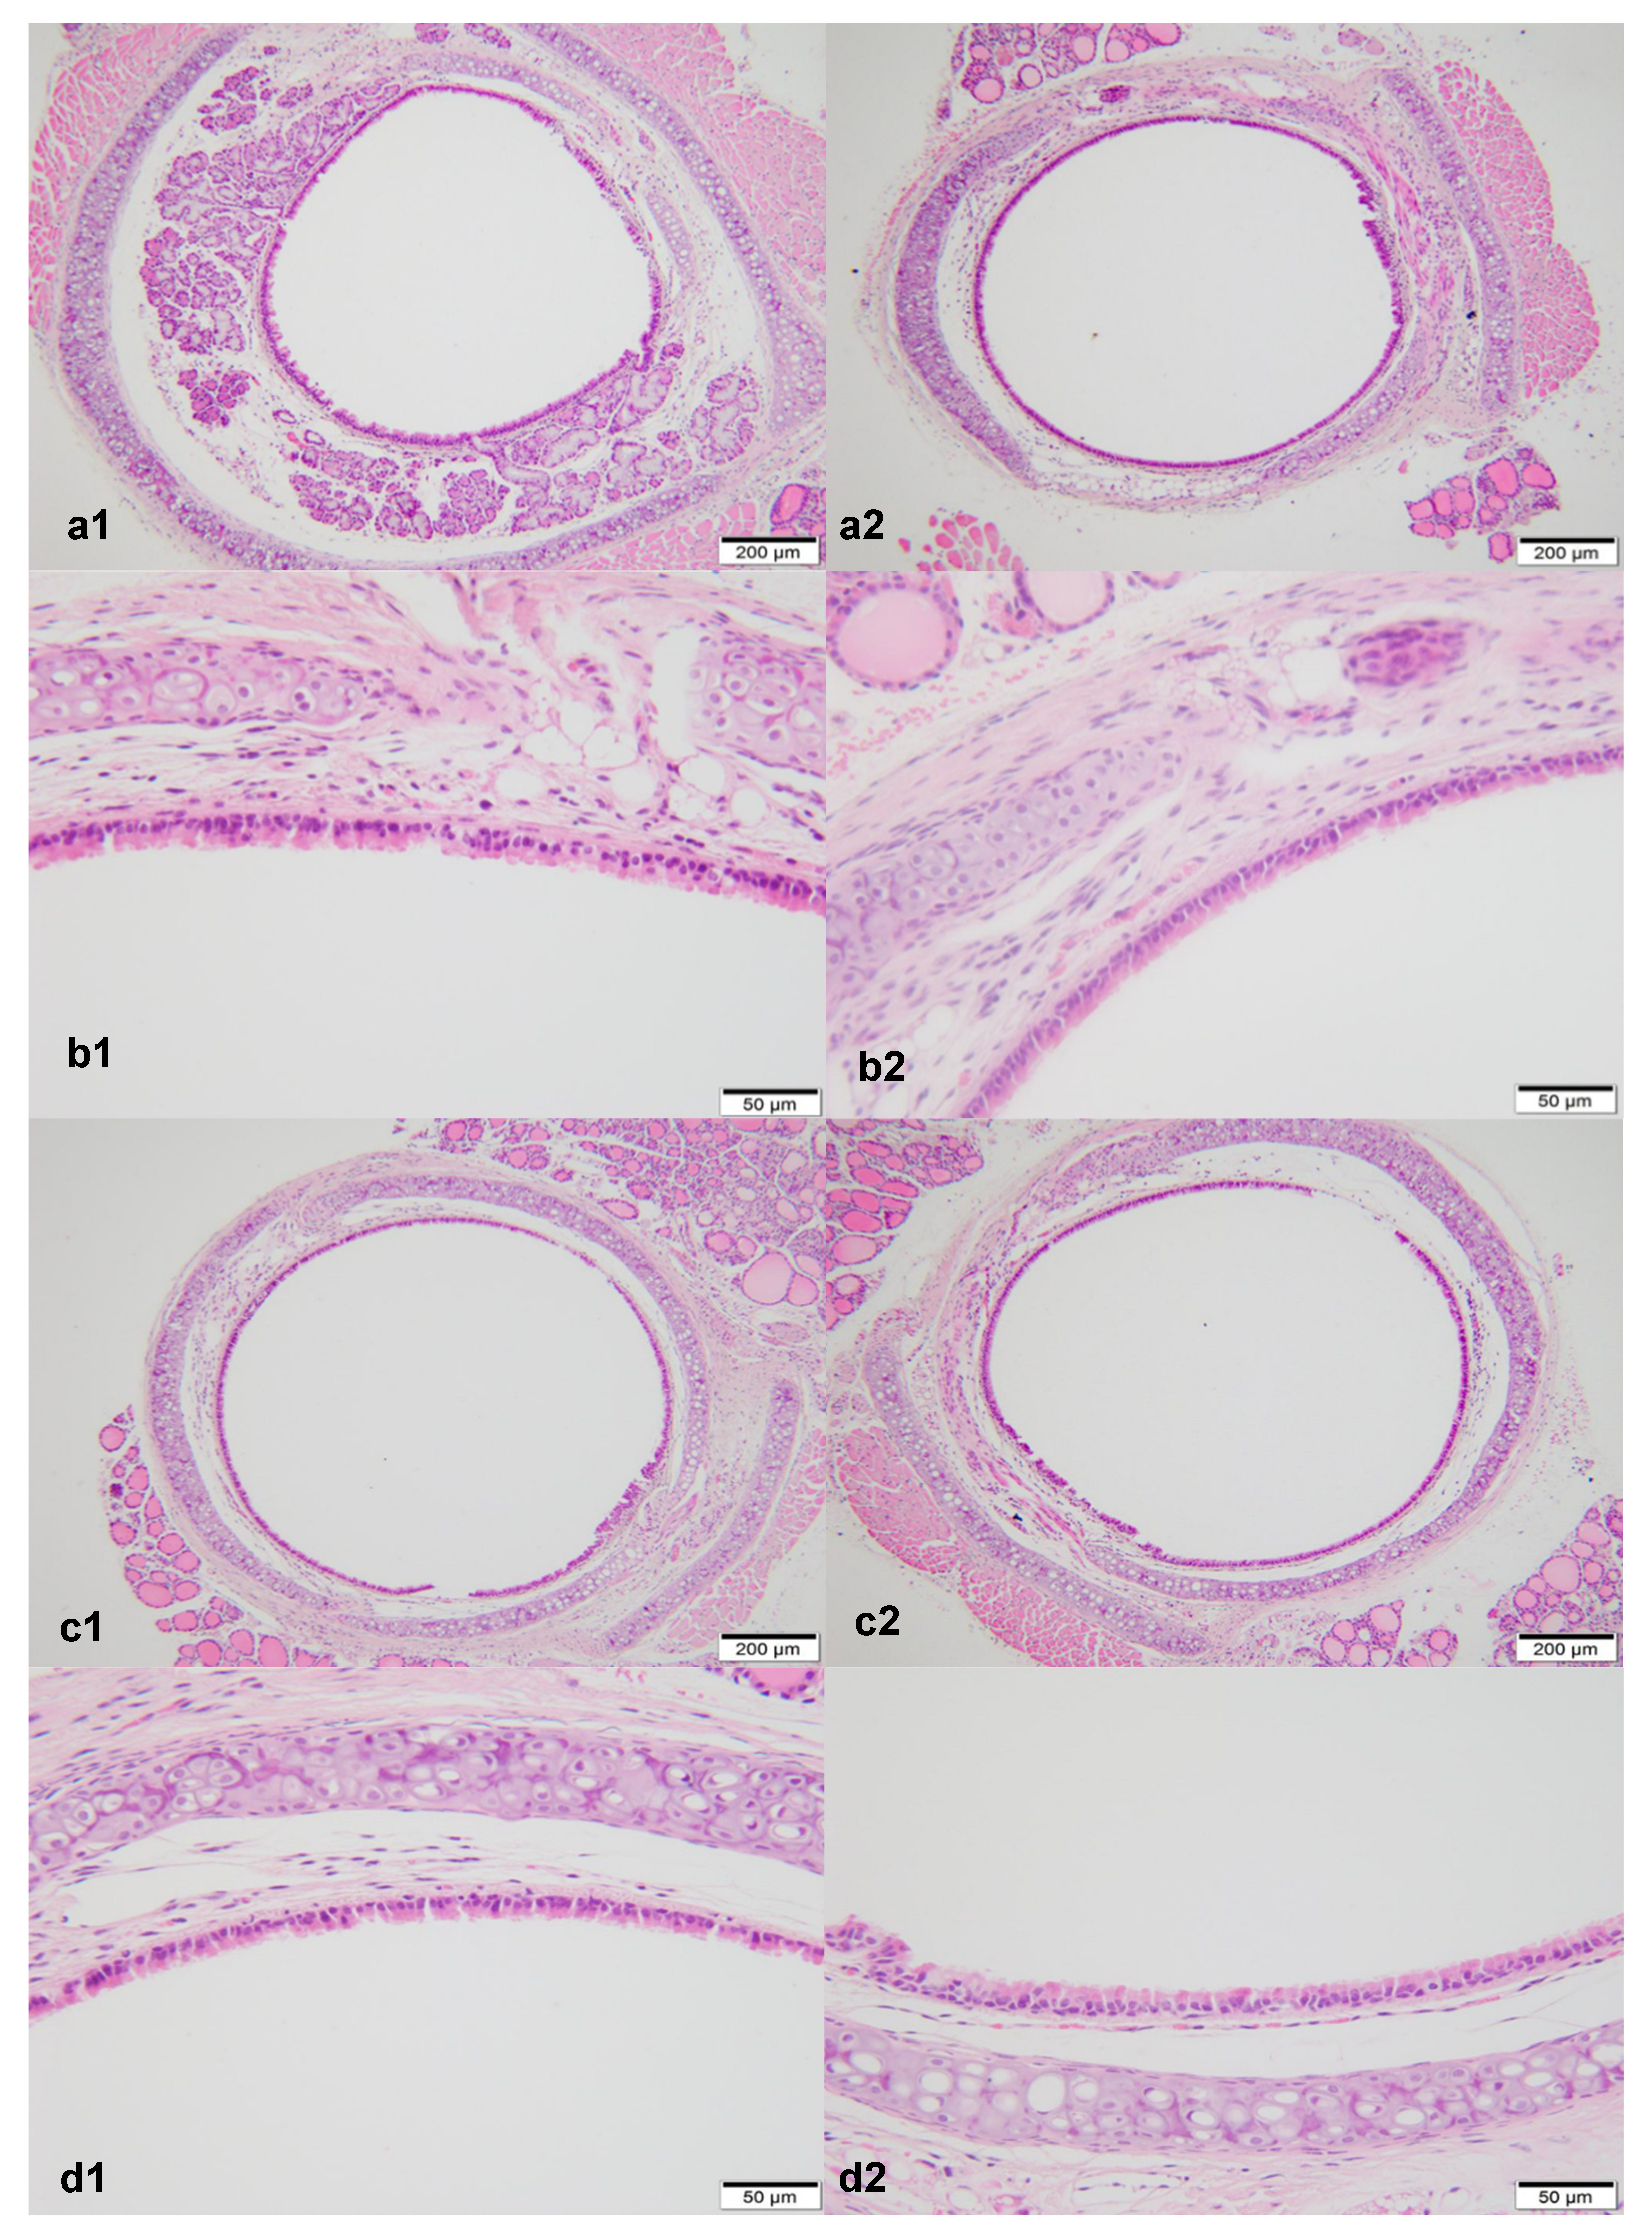
The effect of 1.1 ppm O3 exposure 4 h/day for 15 or 30 days on the micromorphological changes of bronchi in experimental mice. (a1) Control, 15 days, HE, ×100; (a2) O3, 15 days, HE, ×100. (b1): Control, 15 days, HE, ×400; (b2) O3, 15 days, HE, ×400. (c1) Control, 30 days, HE, ×100; (c2) O3, 30 days, HE, ×100. (d1) Control, 30 days, HE, ×400; (d2) O3, 30 days, HE, ×400. Compared with the controls, there was no obvious abnormality to be observed in the O3 exposure groups, and there were no damaged or shed epithelial cells, no vasodilation in the interstitium, and no infiltration of inflammatory cells.
Figure 2.
The effect of 1.1 ppm O3 exposure 4 h/day for 15 or 30 days on the micromorphological changes of bronchi in experimental mice. (a1) Control, 15 days, HE, ×100; (a2) O3, 15 days, HE, ×100. (b1): Control, 15 days, HE, ×400; (b2) O3, 15 days, HE, ×400. (c1) Control, 30 days, HE, ×100; (c2) O3, 30 days, HE, ×100. (d1) Control, 30 days, HE, ×400; (d2) O3, 30 days, HE, ×400. Compared with the controls, there was no obvious abnormality to be observed in the O3 exposure groups, and there were no damaged or shed epithelial cells, no vasodilation in the interstitium, and no infiltration of inflammatory cells.

Figure 3.
The mouse alveolus of the control (×10,000). Type I alveolar epithelial cells (1) are smooth and flat, and the basement membrane is intact. Type II alveolar epithelial cells (2) have no obvious emptying of lamellar bodies, and capillaries (3) are normal. There is no epithelial shed.
Figure 3.
The mouse alveolus of the control (×10,000). Type I alveolar epithelial cells (1) are smooth and flat, and the basement membrane is intact. Type II alveolar epithelial cells (2) have no obvious emptying of lamellar bodies, and capillaries (3) are normal. There is no epithelial shed.

Figure 4.
The mouse bronchus of the control (×10,000). Goblet cells (1) and columnar cells (2) have no abnormalities, and tight junctions (3) between the cells are intact.
Figure 4.
The mouse bronchus of the control (×10,000). Goblet cells (1) and columnar cells (2) have no abnormalities, and tight junctions (3) between the cells are intact.

Figure 5.
Mouse alveoli exposure to 1.1 ppm O3 4 h/day for 15 days (×15,000). Type I alveolar epithelial cells (1) swell with irregular edges, and many small vacuoles can be seen in the cytoplasm.
Figure 5.
Mouse alveoli exposure to 1.1 ppm O3 4 h/day for 15 days (×15,000). Type I alveolar epithelial cells (1) swell with irregular edges, and many small vacuoles can be seen in the cytoplasm.

Figure 6.
Mouse alveoli exposure to 1.1 ppm O3, 4 h/day for 15 days (×10,000). Type II alveolar epithelial cells are obviously emptying of lamellar bodies (1). Type I alveolar epithelial cells have irregular edges and vacuoles in the cytoplasm (2).
Figure 6.
Mouse alveoli exposure to 1.1 ppm O3, 4 h/day for 15 days (×10,000). Type II alveolar epithelial cells are obviously emptying of lamellar bodies (1). Type I alveolar epithelial cells have irregular edges and vacuoles in the cytoplasm (2).

Figure 7.
Mouse alveolus exposure to 1.1 ppm O3 4 h/day for 15 days (×10,000). Telangiectasia and congestion.
Figure 7.
Mouse alveolus exposure to 1.1 ppm O3 4 h/day for 15 days (×10,000). Telangiectasia and congestion.

Figure 8.
Mouse bronchus exposure to 1.1 ppm O3 4 h/day for 15 days (×10,000). The goblet cell nuclear space is slightly widened (1), and binuclear columnar cells can be seen (2).
Figure 8.
Mouse bronchus exposure to 1.1 ppm O3 4 h/day for 15 days (×10,000). The goblet cell nuclear space is slightly widened (1), and binuclear columnar cells can be seen (2).

Figure 9.
Mouse bronchus exposure to 1.1 ppm O3 4 h/day for 15 days (×10,000). Binuclear goblet cells can be seen (1). Damaged tight junctions between cells were observed (2).
Figure 9.
Mouse bronchus exposure to 1.1 ppm O3 4 h/day for 15 days (×10,000). Binuclear goblet cells can be seen (1). Damaged tight junctions between cells were observed (2).

Figure 10.
Mouse alveolus exposure to 1.1 ppm O3 4 h/day for 30 days (×10,000). Capillary shed endothelial cells (1). Red blood cells (2) were found in the alveolar cavity, possibly bleeding.
Figure 10.
Mouse alveolus exposure to 1.1 ppm O3 4 h/day for 30 days (×10,000). Capillary shed endothelial cells (1). Red blood cells (2) were found in the alveolar cavity, possibly bleeding.

Figure 11.
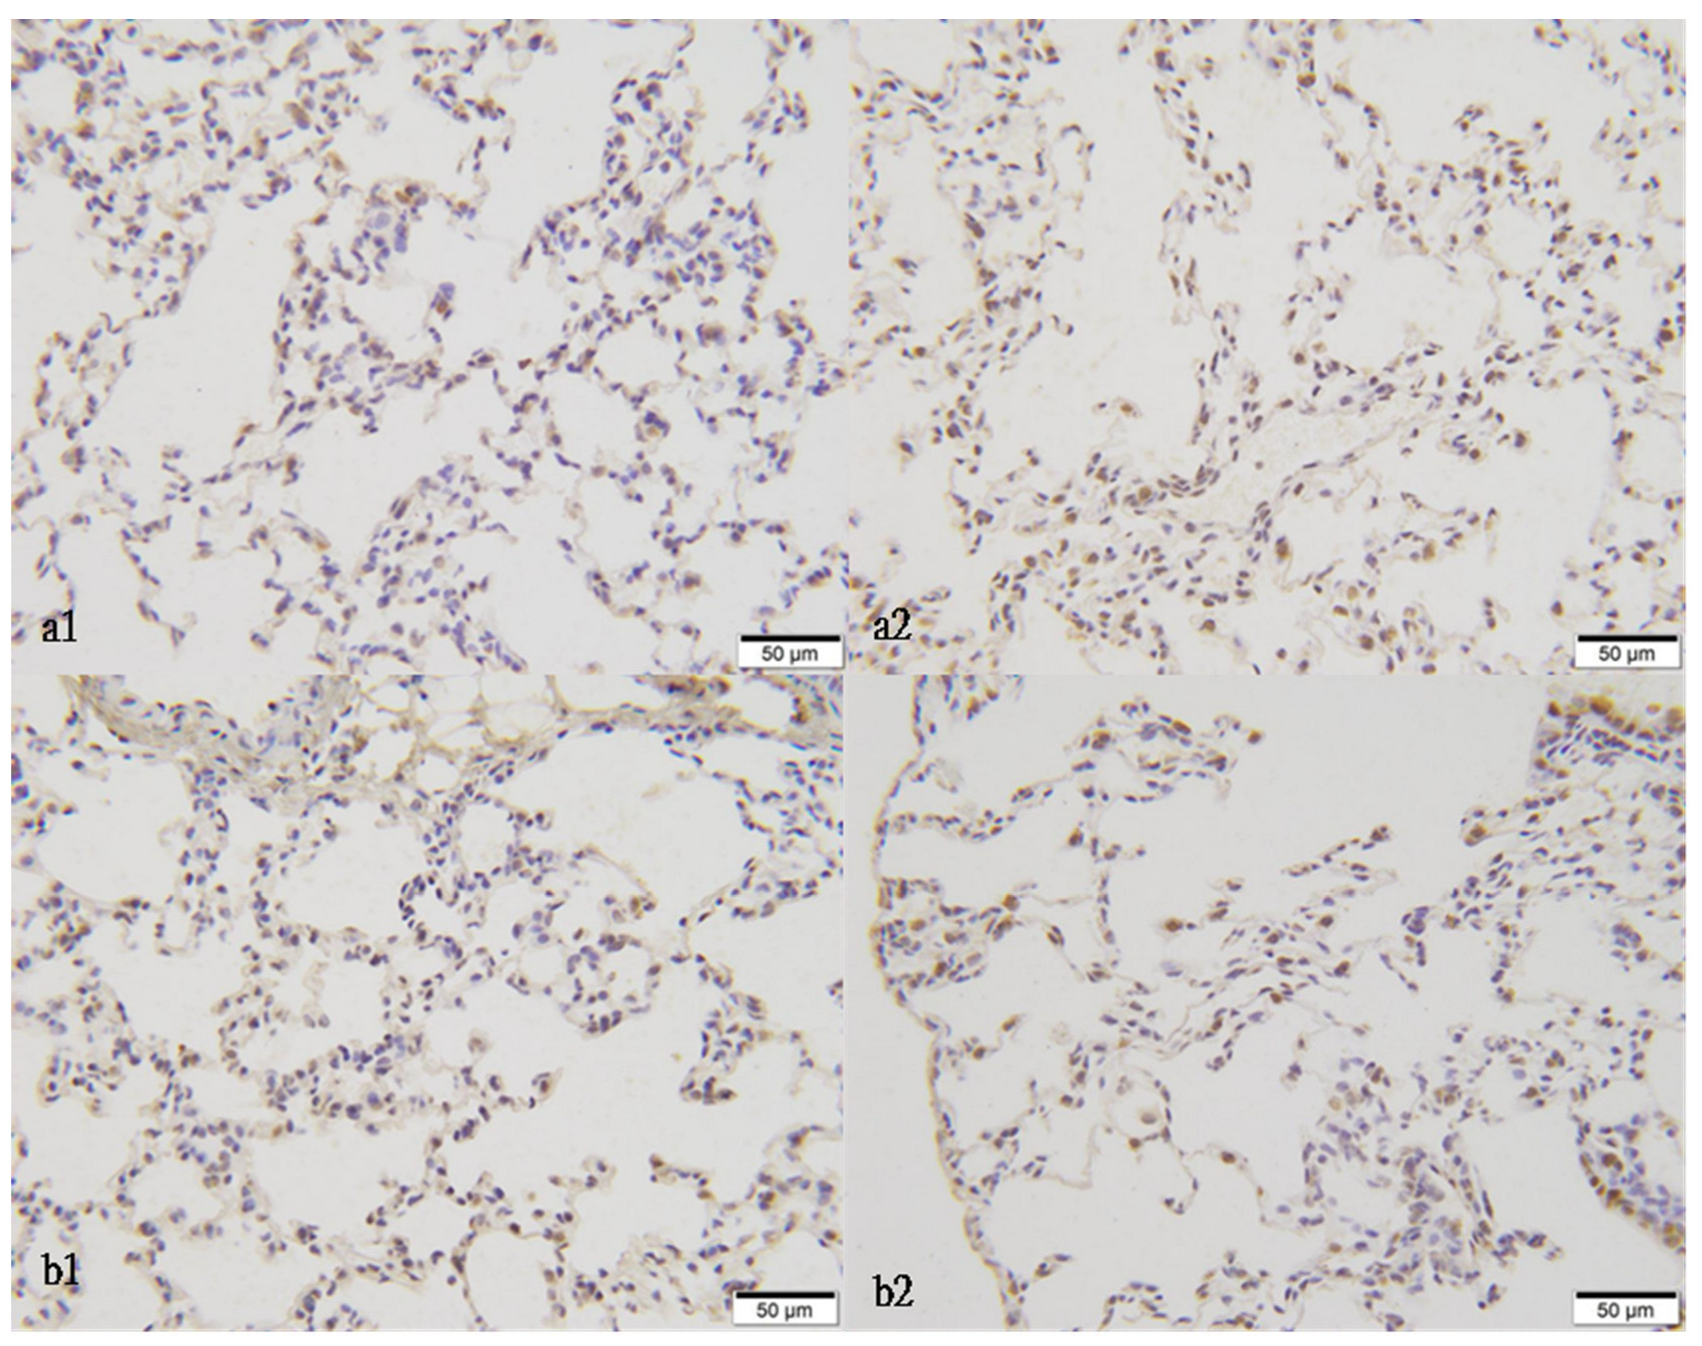
The effect of 1.1 ppm O3 exposure 4 h/day for 15 or 30 days on the micromorphological changes of lung in experimental mice (NQO1 immunohistochemistry staining, ×400). (a1) The control, 15 days; (a2) the model, 15 days; (b1) the control, 30 days; (b2) the model, 30 days.
Figure 11.
The effect of 1.1 ppm O3 exposure 4 h/day for 15 or 30 days on the micromorphological changes of lung in experimental mice (NQO1 immunohistochemistry staining, ×400). (a1) The control, 15 days; (a2) the model, 15 days; (b1) the control, 30 days; (b2) the model, 30 days.


Table 1.
The optical density of NQO1, NRF2, KEAP1 immunohistochemistry staining in each group of the mouse lungs’ slices under a light microscope (, n = 6).
Table 1.
The optical density of NQO1, NRF2, KEAP1 immunohistochemistry staining in each group of the mouse lungs’ slices under a light microscope (, n = 6).
| Exposure Days | Groups | NQO1 | NRF2 | KEAP1 |
|---|---|---|---|---|
| 15 | control | 1.36 ± 1.14 | 1.12 ± 0.40 | 1.84 ± 1.29 |
| O3 | 3.46 ± 1.80 * | 2.49 ± 2.25 | 2.41 ± 0.98 | |
| 30 | control | 2.83 ± 1.09 | 2.27 ± 0.80 | 1.96 ± 0.46 |
| O3 | 2.77 ± 1.26 | 1.74 ± 1.26 | 1.73 ± 1.17 |
Note. * p < 0.05, compared with the control.
Table 2.
Effect of O3 exposure on serum CRP, TNF-α, and IL-6 levels ( ± s, n = 6) (pg/mL) in mice.
| Group | 15 Days | 30 Days | ||
|---|---|---|---|---|
| CRP | IL-6 | CRP | IL-6 | |
| Control | ||||
| Female | 421.48 ± 43.18 | 32.49 ± 3.57 | 425.68 ± 45.75 | 33.28 ± 3.69 |
| Male | 419.24 ± 39.28 | 32.49 ± 3.57 | 435.76 ± 42.71 | 33.28 ± 3.23 |
| O3 | ||||
| Female | 569.51 ± 41.23 * | 67.57 ± 6.51 * | 651.37 ± 46.27 * | 53.24 ± 7.54 * |
| Male | 567.47 ± 40.21 * | 62.91 ± 5.79 * | 629.69 ± 45.15 * | 69.38 ± 6.67 * |
Note. * p < 0.05, compared with the control.
Publisher’s Note: MDPI stays neutral with regard to jurisdictional claims in published maps and institutional affiliations. |
© 2022 by the authors. Licensee MDPI, Basel, Switzerland. This article is an open access article distributed under the terms and conditions of the Creative Commons Attribution (CC BY) license (https://creativecommons.org/licenses/by/4.0/).
Share and Cite
MDPI and ACS Style
Liang, S.; Sha, Y.; Yang, C.; Lai, H.; Sun, C.; Zhao, W.; Zhang, A.; Qi, Q.; Xie, Y. Ozone-Induced Lung and Bronchial Injury: A Mouse Model Study. Atmosphere 2022, 13, 1562. https://doi.org/10.3390/atmos13101562
AMA Style
Liang S, Sha Y, Yang C, Lai H, Sun C, Zhao W, Zhang A, Qi Q, Xie Y. Ozone-Induced Lung and Bronchial Injury: A Mouse Model Study. Atmosphere. 2022; 13(10):1562. https://doi.org/10.3390/atmos13101562
Chicago/Turabian StyleLiang, Shi, Yan Sha, Chuanhong Yang, Huangwen Lai, Chong Sun, Weisen Zhao, An Zhang, Qingwen Qi, and Ying Xie. 2022. "Ozone-Induced Lung and Bronchial Injury: A Mouse Model Study" Atmosphere 13, no. 10: 1562. https://doi.org/10.3390/atmos13101562
Note that from the first issue of 2016, this journal uses article numbers instead of page numbers. See further details here.