Article

Variation in Extreme Temperature and Its Instability in China

1
State Key Laboratory of Cryospheric Science, Northwest Institute of Eco-Environment and Resources, Chinese Academy of Sciences, Lanzhou 730000, China
2
Key Laboratory of Ecohydrology of Inland River Basin, Northwest Institute of Eco-Environment and Resources, Chinese Academy of Sciences, Lanzhou 730000, China
3
University of Chinese Academy of Sciences, Beijing 100049, China
4
College of Resource and Environment, University of Chinese Academy of Sciences, Beijing 100049, China
5
China-Pakistan Joint Research Center on Earth Sciences, CAS-HEC, Islamabad 45320, Pakistan
6
Institute for Disaster Management and Reconstruction, Sichuan University, Chengdu 610200, China
7
Key Laboratory of Mountain Hazards and Earth Surface Process, Institute of Mountain Hazards and Environment, Chinese Academy of Sciences, Chengdu 610041, China
*
Author to whom correspondence should be addressed.
Atmosphere 2022, 13(1), 19; https://doi.org/10.3390/atmos13010019
Submission received: 20 November 2021 / Revised: 16 December 2021 / Accepted: 19 December 2021 / Published: 23 December 2021

Abstract

:
In this study, the instability of extreme temperatures is defined as the degree of perturbation of the spatial and temporal distribution of extreme temperatures, which is to show the uncertainty of the intensity and occurrence of extreme temperatures in China. Based on identifying the extreme temperatures and by analyzing their variability, we refer to the entropy value in the entropy weight method to study the instability of extreme temperatures. The results show that TXx (annual maximum value of daily maximum temperature) and TNn (annual minimum value of daily minimum temperature) in China increased at 0.18 °C/10 year and 0.52 °C/10 year, respectively, from 1966 to 2015. The interannual data of TXx’ occurrence (CTXx) and TNn’ occurrence (CTNn), which are used to identify the timing of extreme temperatures, advance at 0.538 d/10 year and 1.02 d/10 year, respectively. In summary, extreme low-temperature changes are more sensitive to global warming. The results of extreme temperature instability show that the relative instability region of TXx is located in the middle and lower reaches of the Yangtze River basin, and the relative instability region of TNn is concentrated in the Yangtze River, Yellow River, Langtang River source area and parts of Tibet. The relative instability region of CTXx instability is distributed between 105° E and 120° E south of the 30° N latitude line, while the distribution of CTNn instability region is more scattered; the TXx’s instability intensity is higher than TNn’s, and CTXx’s instability intensity is higher than CTNn’s. We further investigate the factors affecting extreme climate instability. We also find that the increase in mean temperature and the change in the intensity of the El Niño phenomenon has significant effects on extreme temperature instability.

1. Introduction

The Sixth Assessment Report of the Intergovernmental Panel on Climate Change (IPCC) shows that global surface temperatures are 1.09 [0.95 to 1.20] °C warmer in 2011–2020 than in 1850–1900, with a greater increase on land (1.59 [1.34 to 1.83] °C) than over the oceans (0.88 [0.68 to 1.01] °C), according to paleoclimate data, global surface temperatures have increased faster (with high confidence) since 1970 than in any other 50-year period over at least the last 2000 years [1]. The IPCC releases “Managing the Risks of Extreme Events and Disasters to Advance Climate Change Adaptation (SREX),” which suggests that climate change will lead to an increase in the frequency, intensity, duration, and spatial extent of extreme weather [2]. In addition, climate change has significant impacts on plant phenology and its spatial distribution, natural ecosystems, economic production activities, and human life [3,4,5,6]. Over the past decade, there has been considerable literature around the topics of climate change and extreme climate change. Currently, the main approaches to the topic include: (1) studies of the mean changes in climate elements based on annual or monthly time scales [7,8,9,10]; (2) studies of the spatial and temporal variability of extreme climate based on the definition of extreme climate indices [11,12,13,14]; (3) studies delineating climate zones based on the spatial and temporal variability of climate elements or extreme climate elements [15,16,17,18]; (4) predicting future climate change based on experimental data from the Coupled Model Comparison Project (CMIP) organized by the World Climate Research Program (WCRP) [19,20,21,22,23]. Meanwhile, the issue of climate instability has attracted a lot of attention from scientists. The current research on climate instability focuses on two aspects. (1) Reconstructing paleoclimate from ice cores, lake sediments, stalagmites, and marine sediments to study paleoclimate fluctuations at different time scales [24,25,26]. (2) To explore the intrinsic factors and driving mechanisms of climate fluctuations. Currently, studies of climate instability focus on paleoclimate, which is discussed on longer time scales (centennial to millennial time) [27,28,29]. The instability of extreme climate elements on short time scales has considerable importance for socio-economic development. For example, annual maximum values of daily maximum temperature (TXx) may cause heatwaves, and if the interannual variability in the period when TXx occurs and in the intensity of TXx is small, this facilitates prevention and adaptation to heatwaves. The reverse is also true if the interannual variability is large. However, studies on the instability of extreme temperature elements are often not available.
Generally, China is the most serious natural disaster in the world, one of the few countries especially vulnerable to climate change. The frequency of extreme temperature events has changed significantly over the past 60 years [30,31]. To further investigate the characteristics of extreme temperature changes, we use the instability of extreme temperatures as a viewpoint and calculated the annual maximum value of daily maximum temperature (TXx) and the annual minimum value of daily minimum temperature (TNn) based on daily measurements from 778 meteorological stations in China from 1966 to 2015. Then, the intensity, date of occurrence, instability of intensity, and instability of date of occurrence of TXx and TNn were investigated, and the factors influencing the instability of this variability were discussed.

2. Materials and Methods
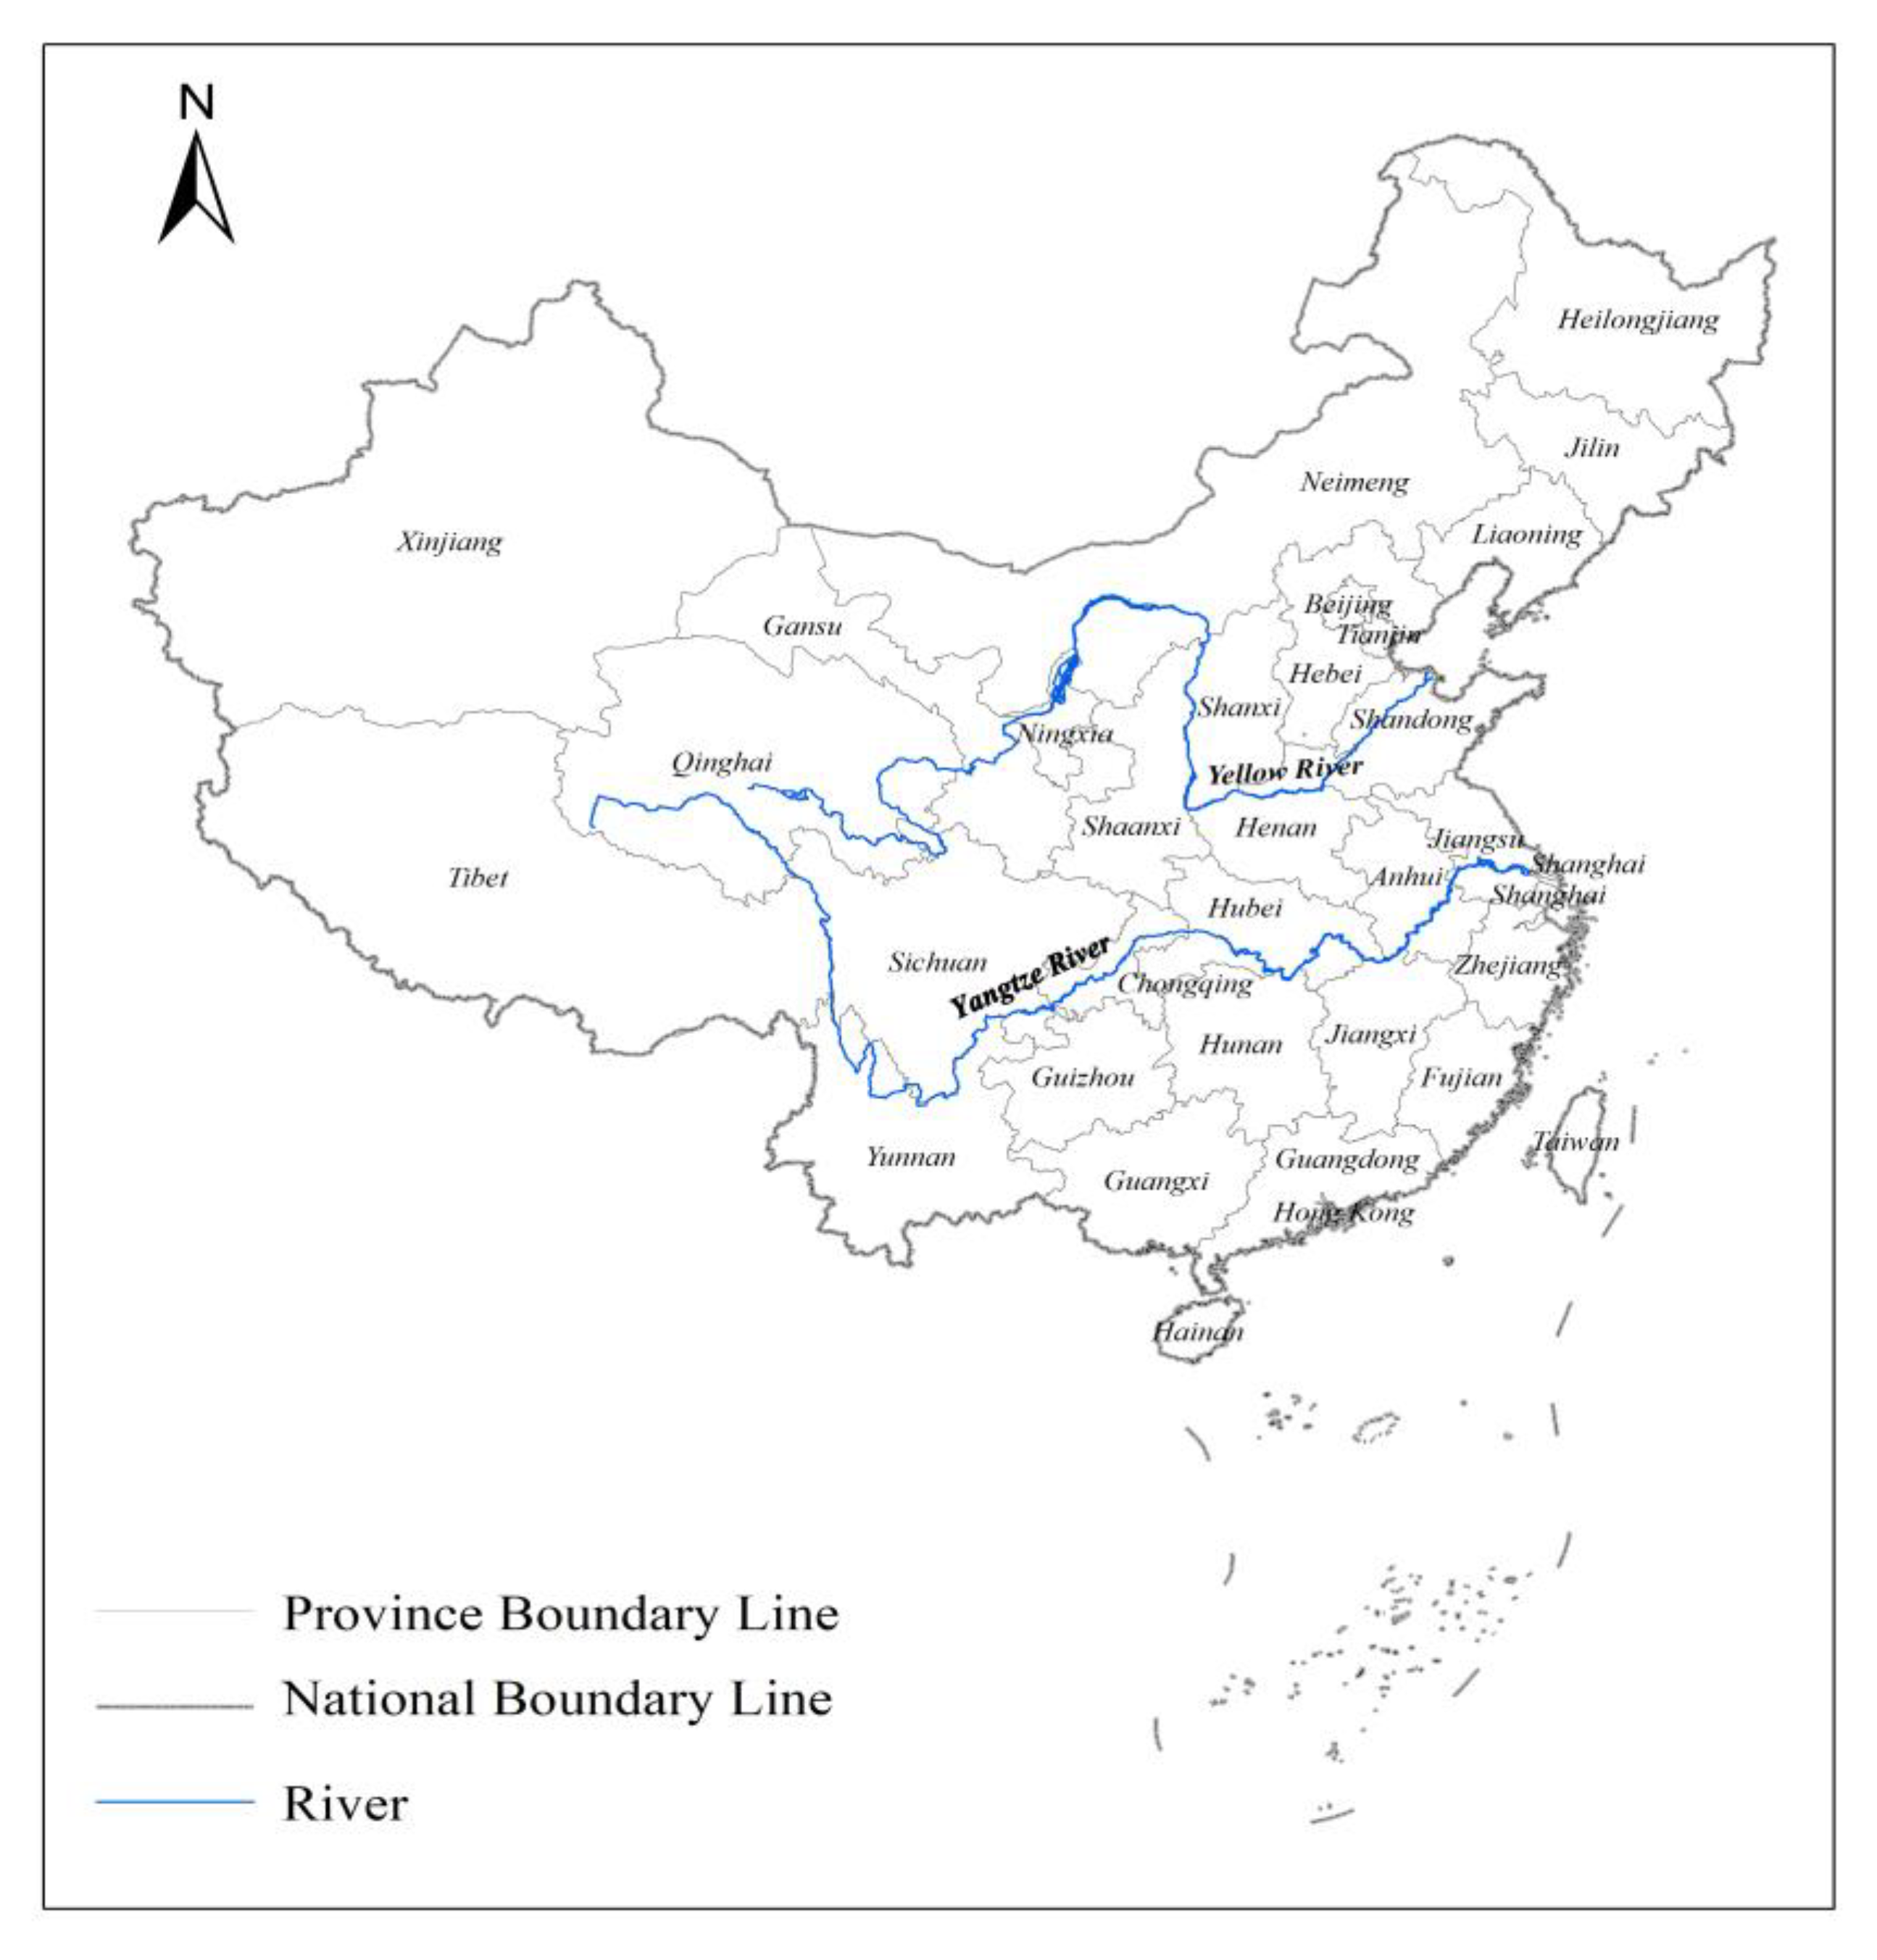
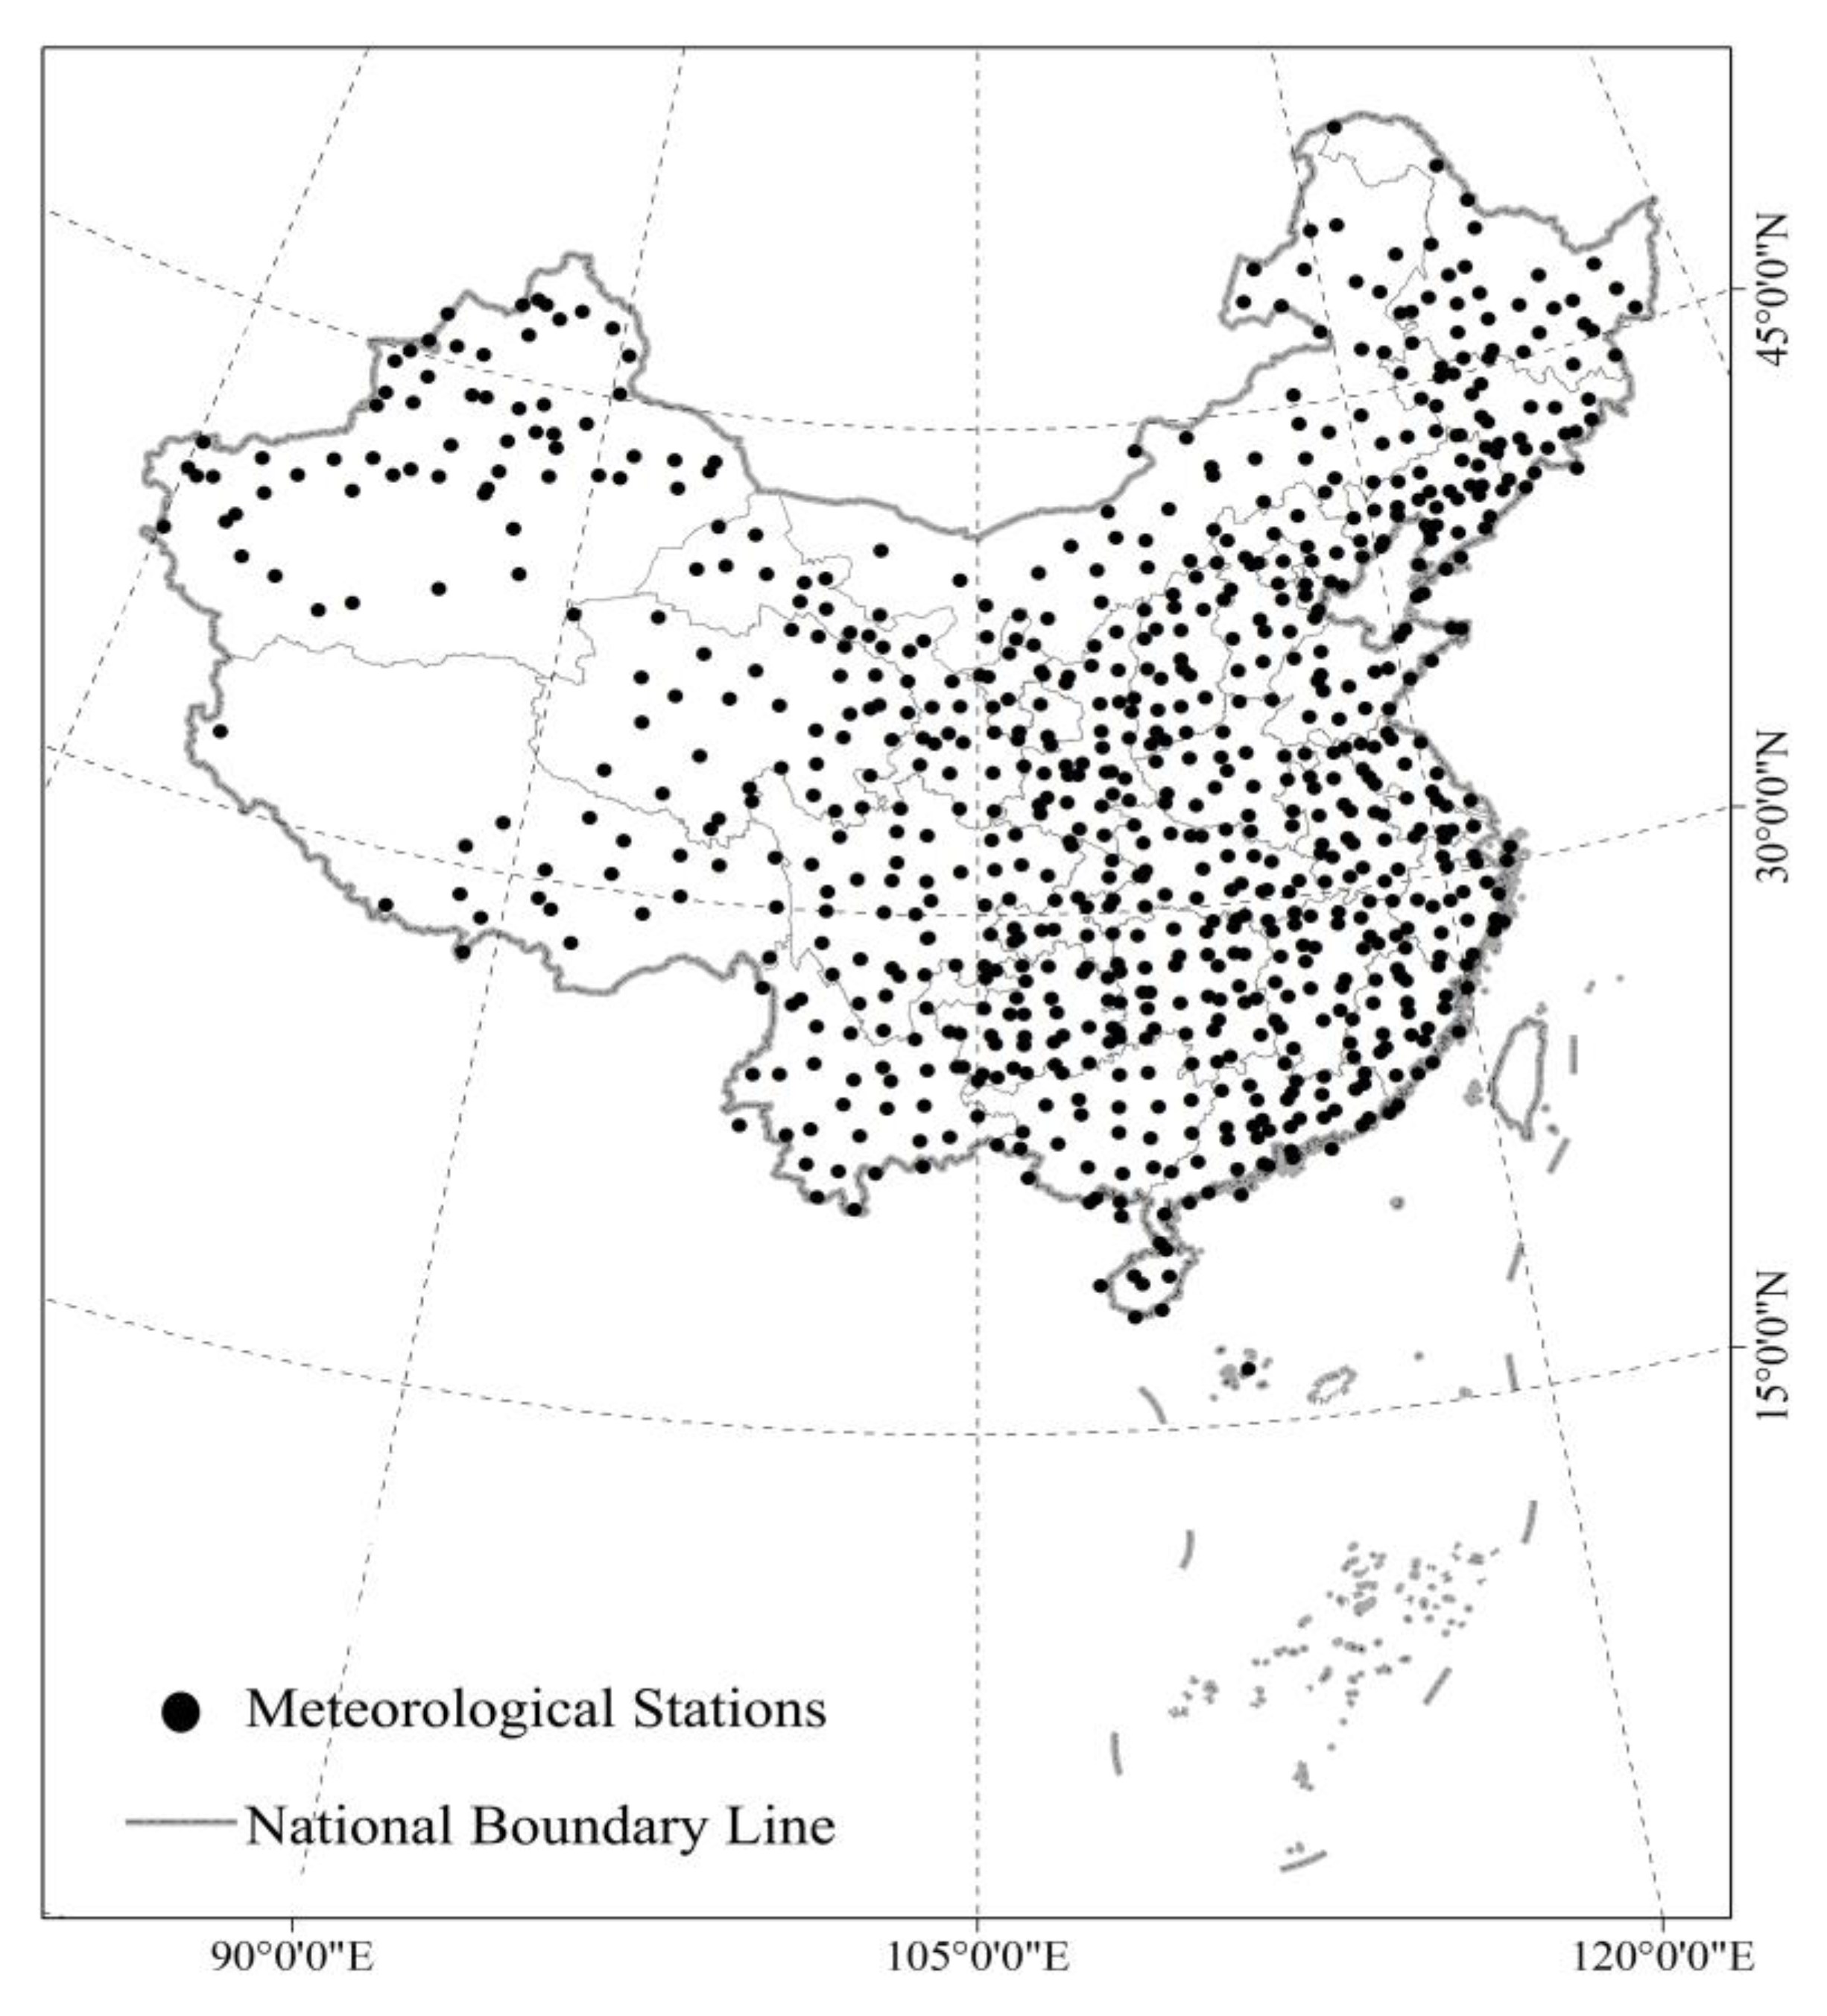
2.1. Data

Data on the administrative divisions of China are provided by the National Geographic Information Center of China (13 March 2021: http://www.ngcc.cn/), which contains information on the spatial distribution of the provincial administrative divisions of China (Figure 1) (geographic coordinates are listed in Table S1).
Meteorological station data (1966–2015) were provided by the National Meteorological Science Data Center of China (13 March 2021: http://data.cma.cn/) and contained information on daily maximum and daily minimum temperatures. The spatial distribution of meteorological stations is illustrated (Figure 2).
The Atmospheric Circulation Index (1966–2015) is provided by the Climate Prediction Center (13 March 2021: https://www.cpc.ncep.noaa.gov), the North Atlantic Oscillation (NAO), the Pacific-North American model (PNA), the Arctic Oscillation (AO), and the Pacific Interannual Oscillation (PDO) for the period 1966–2015.
El Niño T-index (1966–2015) extracted the in a new index for El Niño [32]. The definition of El Niño T-index is according to the regional average monthly Sea Surface Temperature Anomaly (SSTA) distance in the above sea area in the (5° S–5° N, 180°–90° W) region. This index not only permits more comprehensive monitoring of the different types of El Niño events that have occurred in history but also provides a reasonable classification of the intensity of El Niño events.

2.2. Selection of Extreme Climate Indices

The Expert Group on Climate Change Detection and Indices (ETCCDI), jointly established by the World Meteorological Organization (WMO) Climate Committee and the Climate Variability and Predictability Research Program (CLIVAR), has proposed 27 climate indices. In this paper, TNn and TXx were selected as the subjects of extreme temperature changes, and, at the same time, their occurrence cycles were investigated (Table 1).

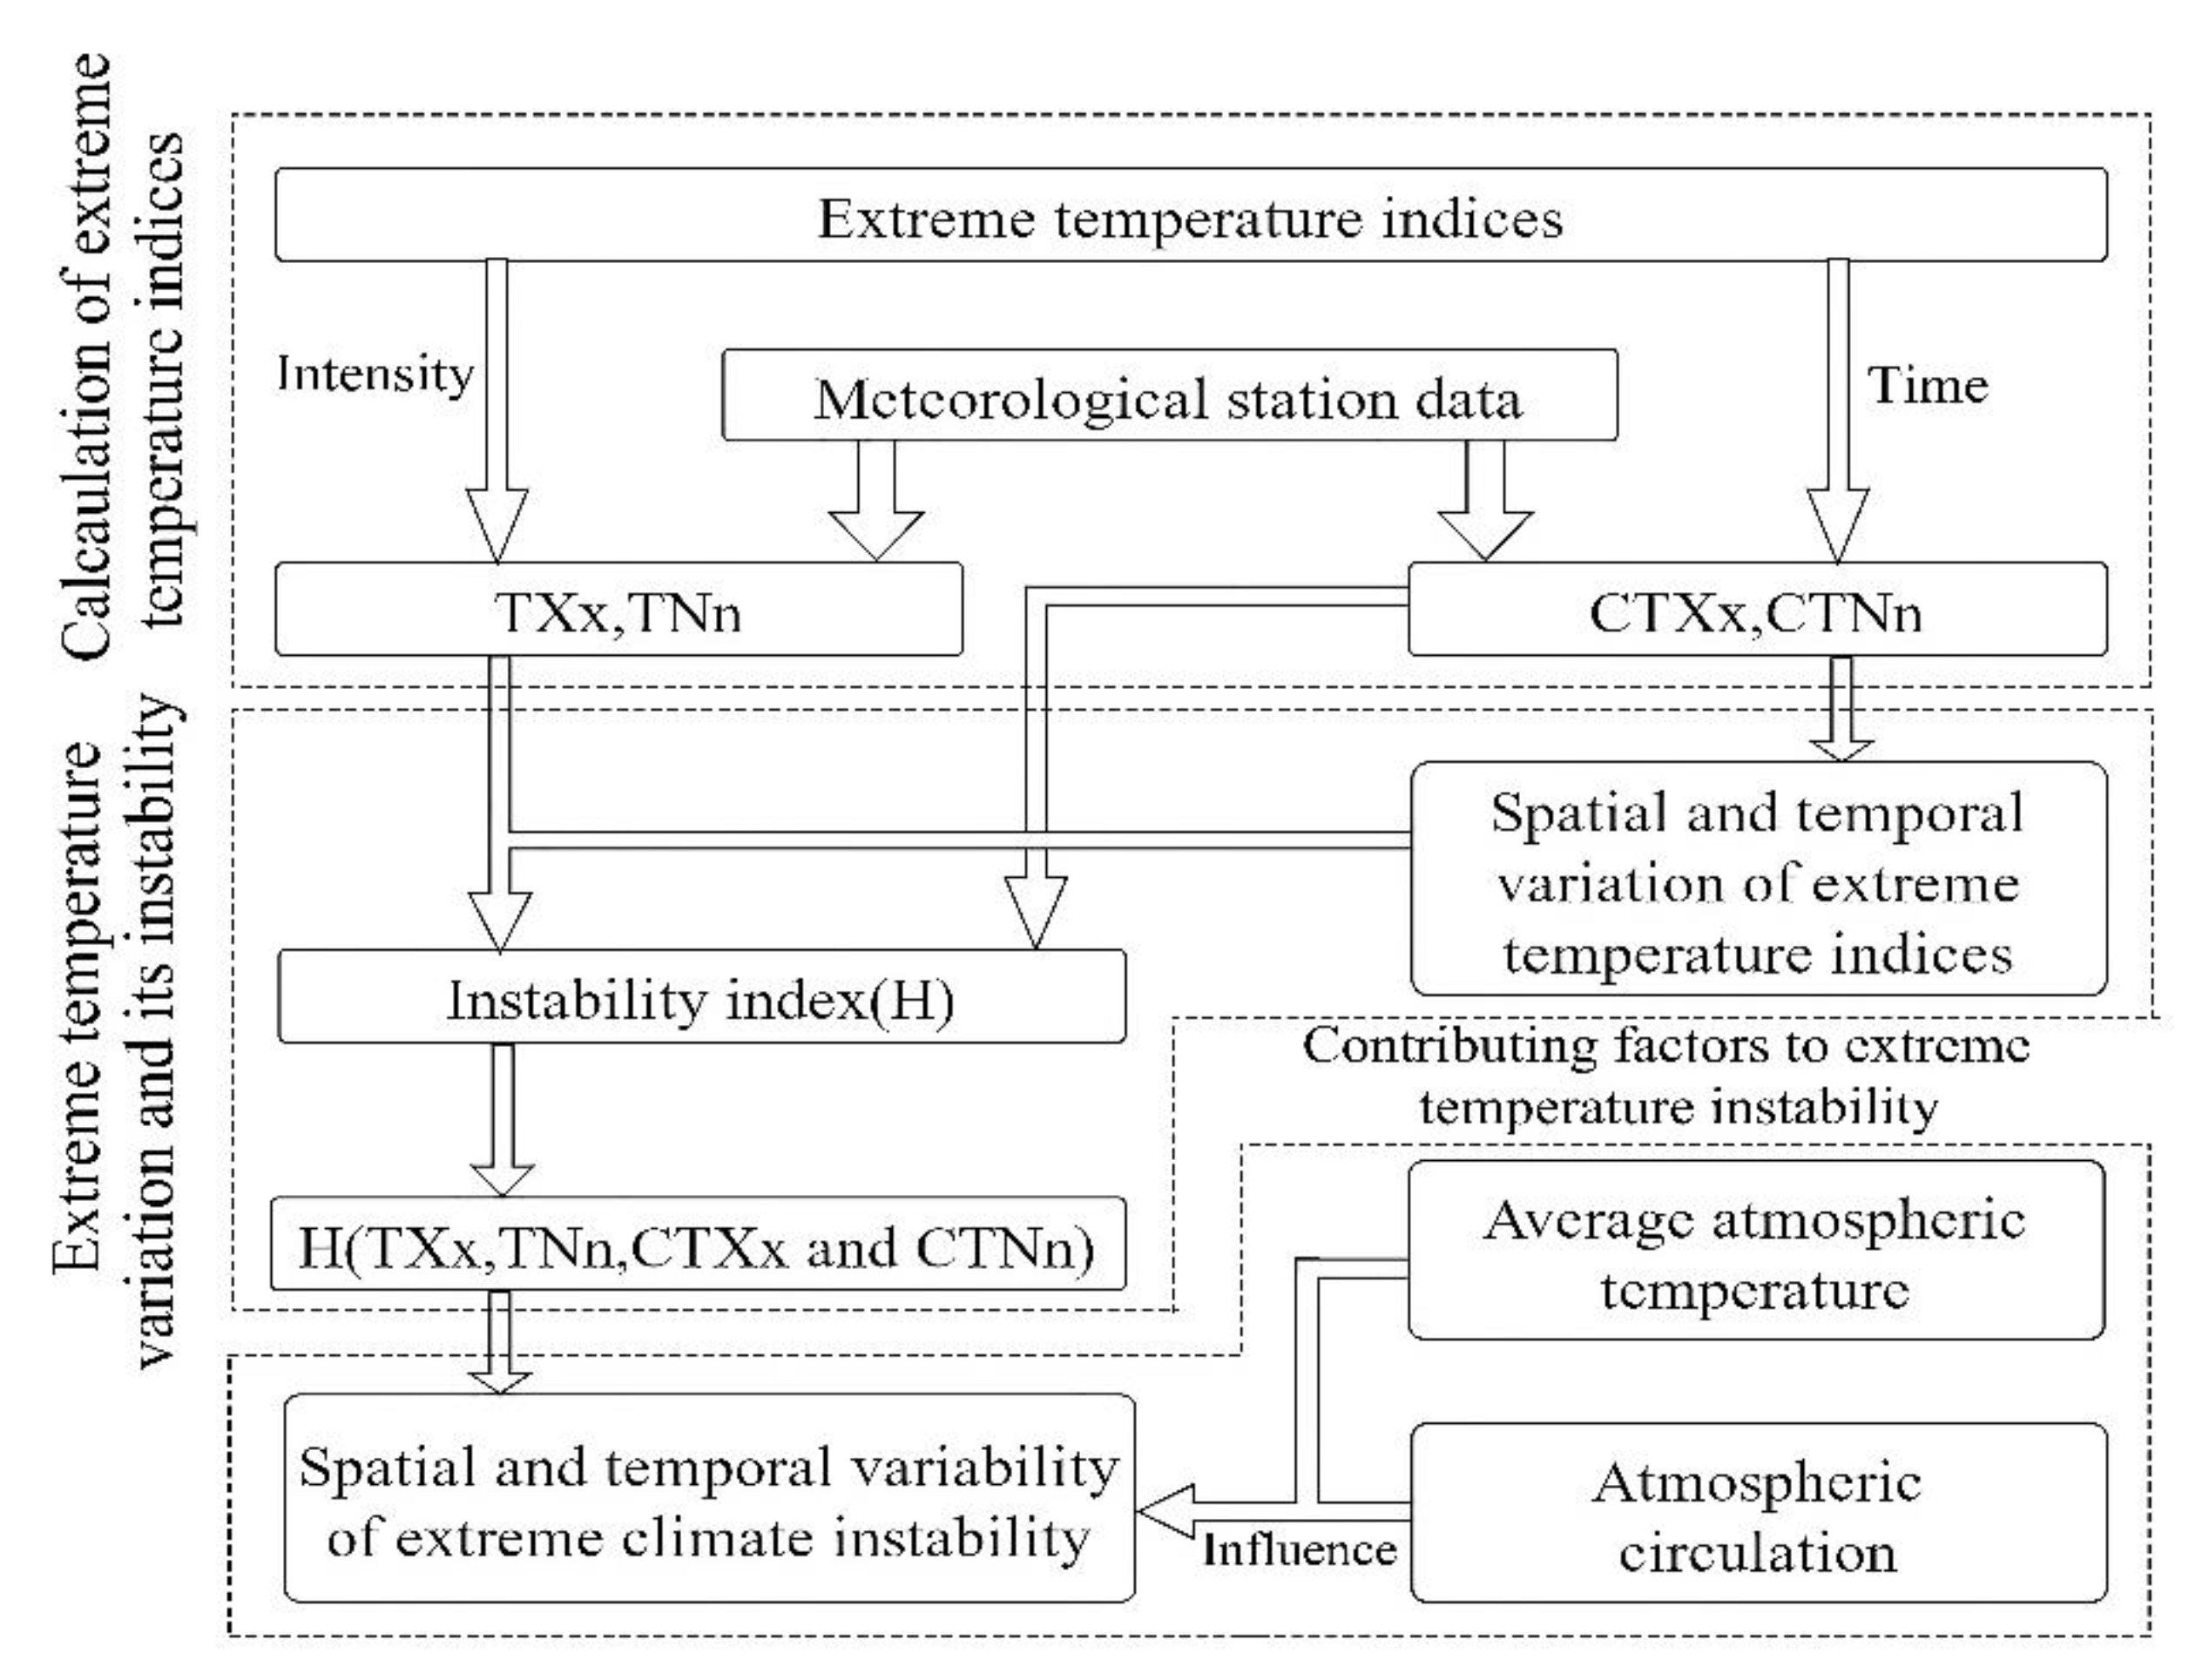
2.3. Methodology for the Study of Extreme Temperature Instability

Extreme temperature variability and its instability have important implications for the occurrence of extreme temperature events; however, there were spatial and temporal differences in extreme temperature variability and its instability. To clarify this discrepancy, we studied extreme temperature variability and extreme temperature fluctuations (their instability) in both space and time. In this context, the instability of extreme temperatures was defined as the degree of disturbance in the spatial and temporal distribution of extreme temperatures, and the greater the interannual or regional variability in the intensity of extreme temperatures and the date of occurrence of extreme temperatures, the greater the instability of extreme temperatures. The process is shown in Figure 3.
First, extreme temperature indices were identified using weather station data, and the types identified include TXx, TNn, CTXx, and CTNn. The indices were calculated by using the ClimPACT2 software (13 March 2021: https://github.com/ARCCSS-extremes).
The Entropy Weight Method was used to determine the weight of an indicator in a comprehensive evaluation based on the variability of the indicator [33]. The higher the entropy value, the greater the degree of variation the indicator deserves, the more information it provides, the greater the role it can play in the comprehensive evaluation, and the greater its weight. In this paper, we have drawn on the definition of entropy in the Entropy Weight Method for the study of extreme temperature instability.
The procedure is as follows.
r ( i ) = x ( i ) min ( x ) max ( x ) min ( x )
where r is the standardized station extreme temperature index, i is the year (or weather station code), and x is the extreme temperature index (TXx, TNn, CTXx, and CTNn) before standardization, min(x) is the minimum value of the station multi-year extreme temperature index (or the minimum value of the extreme temperature index for all stations in a year), and max(x) is the maximum value of the station multi-year extreme temperature index (or the maximum value of the extreme temperature index for all stations in a year).
p i = r i / i = 1 m r i
where i is the year (or weather station index), m is the total number of years (or total number of weather stations), and p is the ratio of the extreme temperature index to the sum of extreme temperatures for a given year (or the ratio of the extreme temperature index at a station to the sum of the extreme temperature indices at all stations). Where e is the entropy value of the extreme climate index.
e = 1 ln   m i = 1 m p i · lnp i
where H is the instability index.
H = 1 e
The larger the H value, the more unstable the extreme temperature, while the smaller the H value, the opposite.
The instability of extreme temperatures was studied in both space and time. (i) Spatial instability refers to the instability study of extreme temperatures at each station. (ii) Temporal instability refers to instability studies of extreme temperatures at all stations on an annual basis.

3. Results

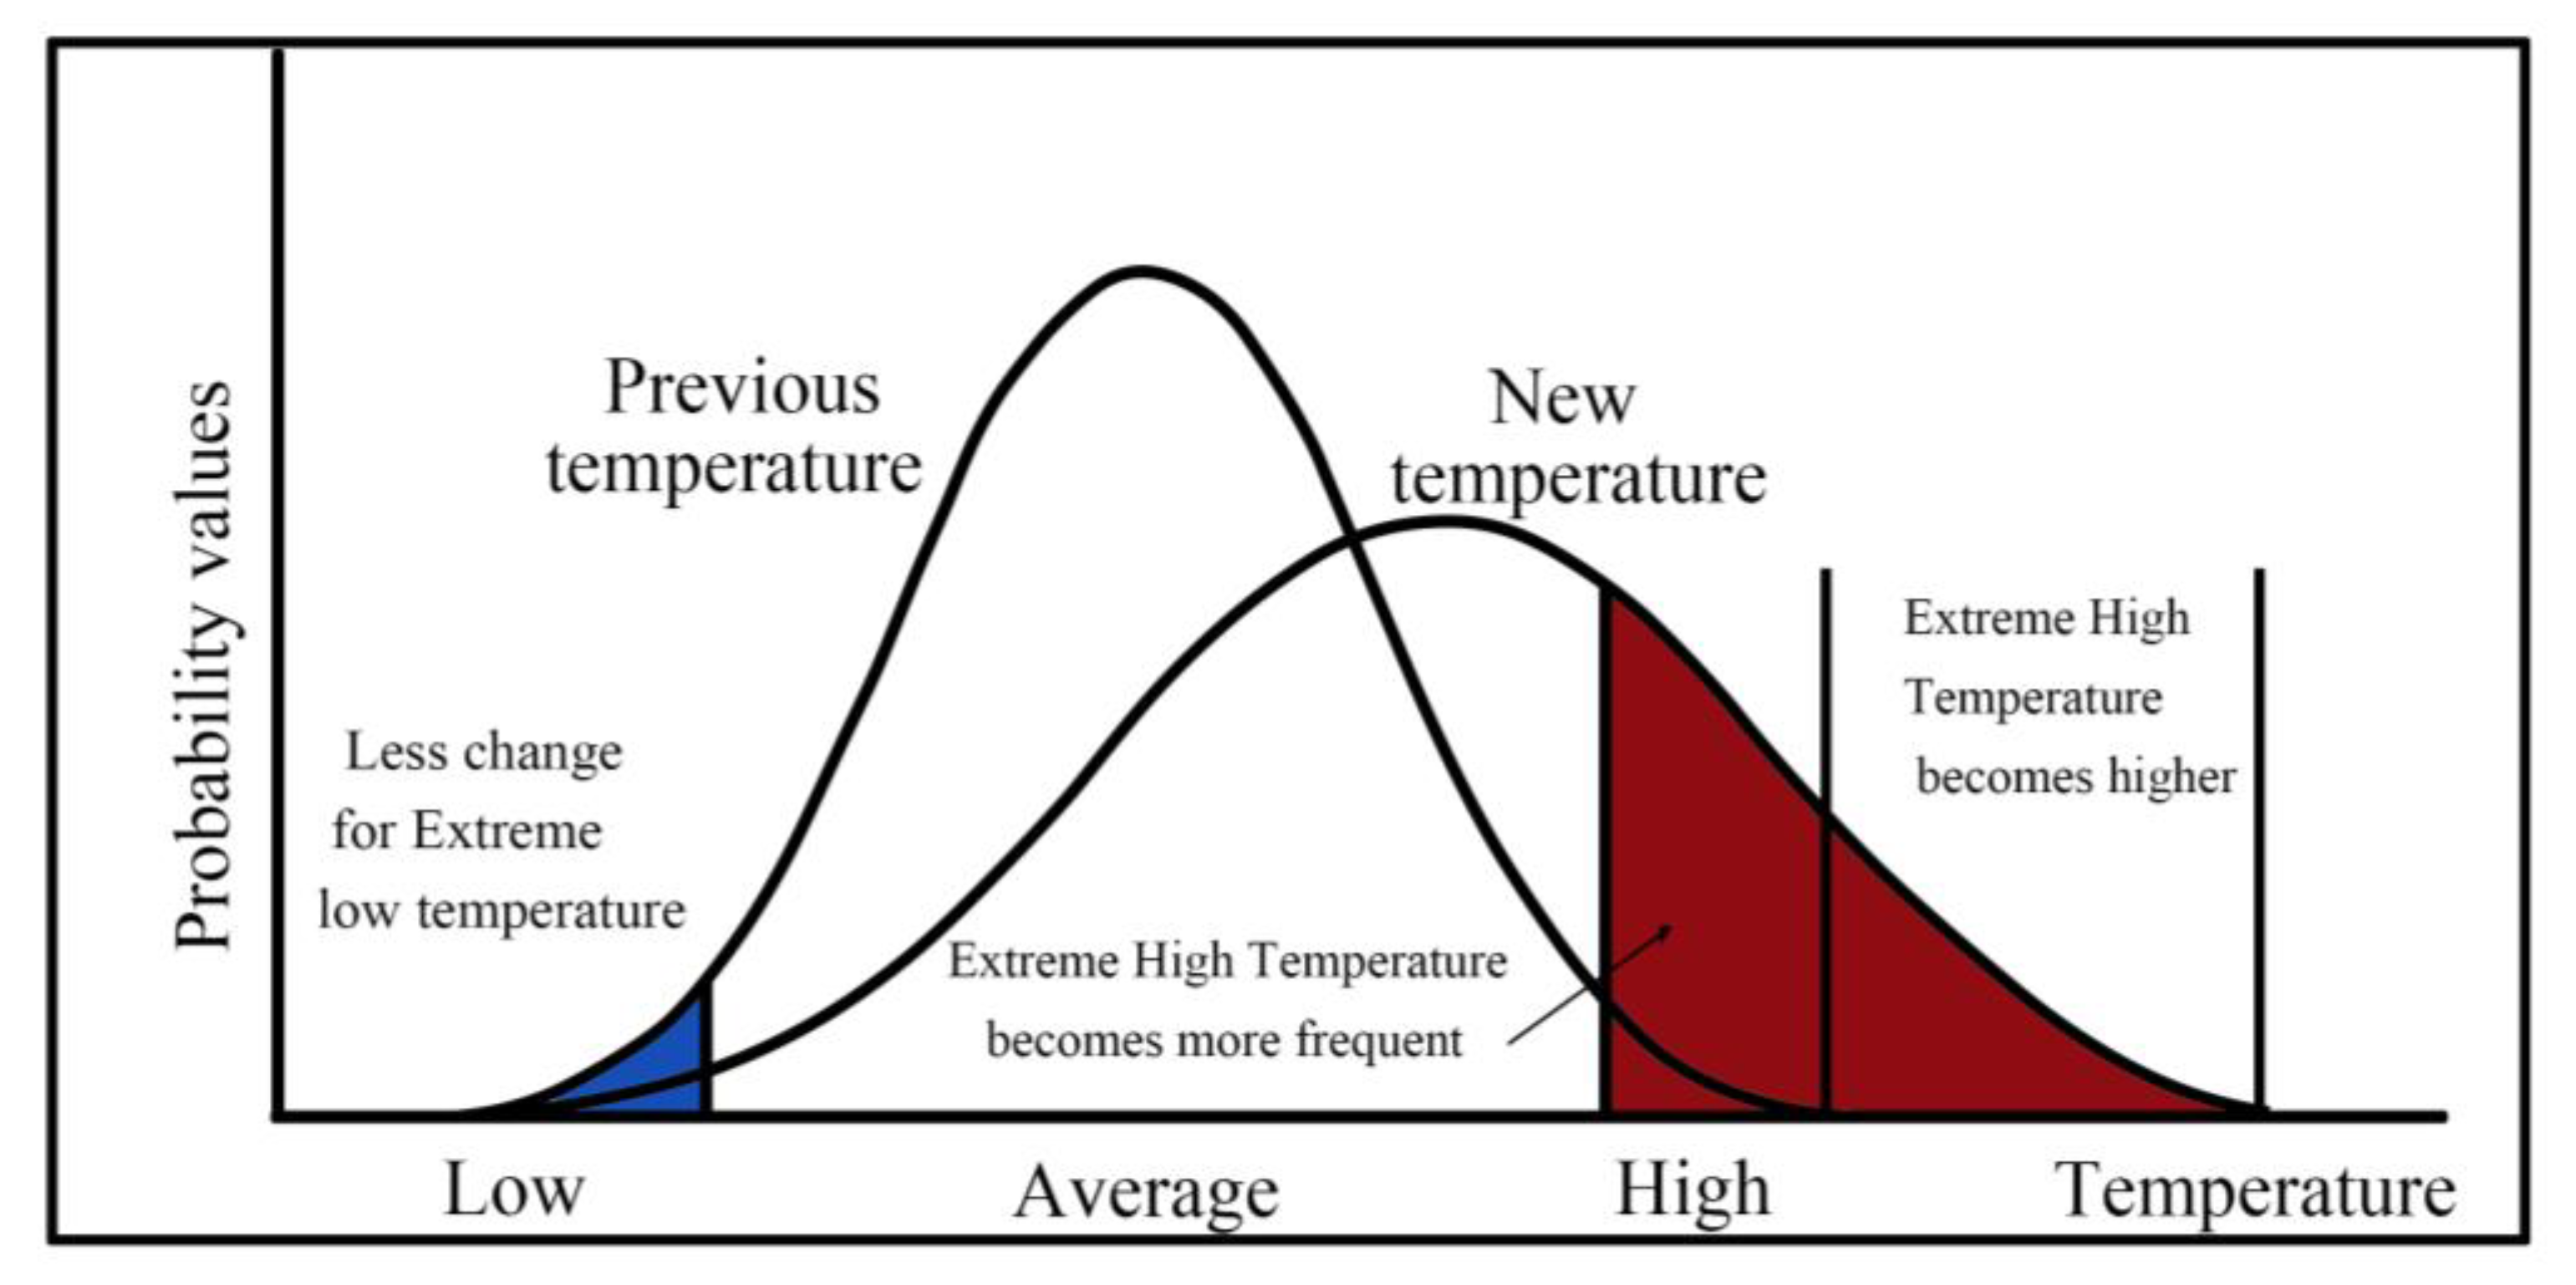
3.1. Extreme Low Temperatures Are More Sensitive to Global Warming

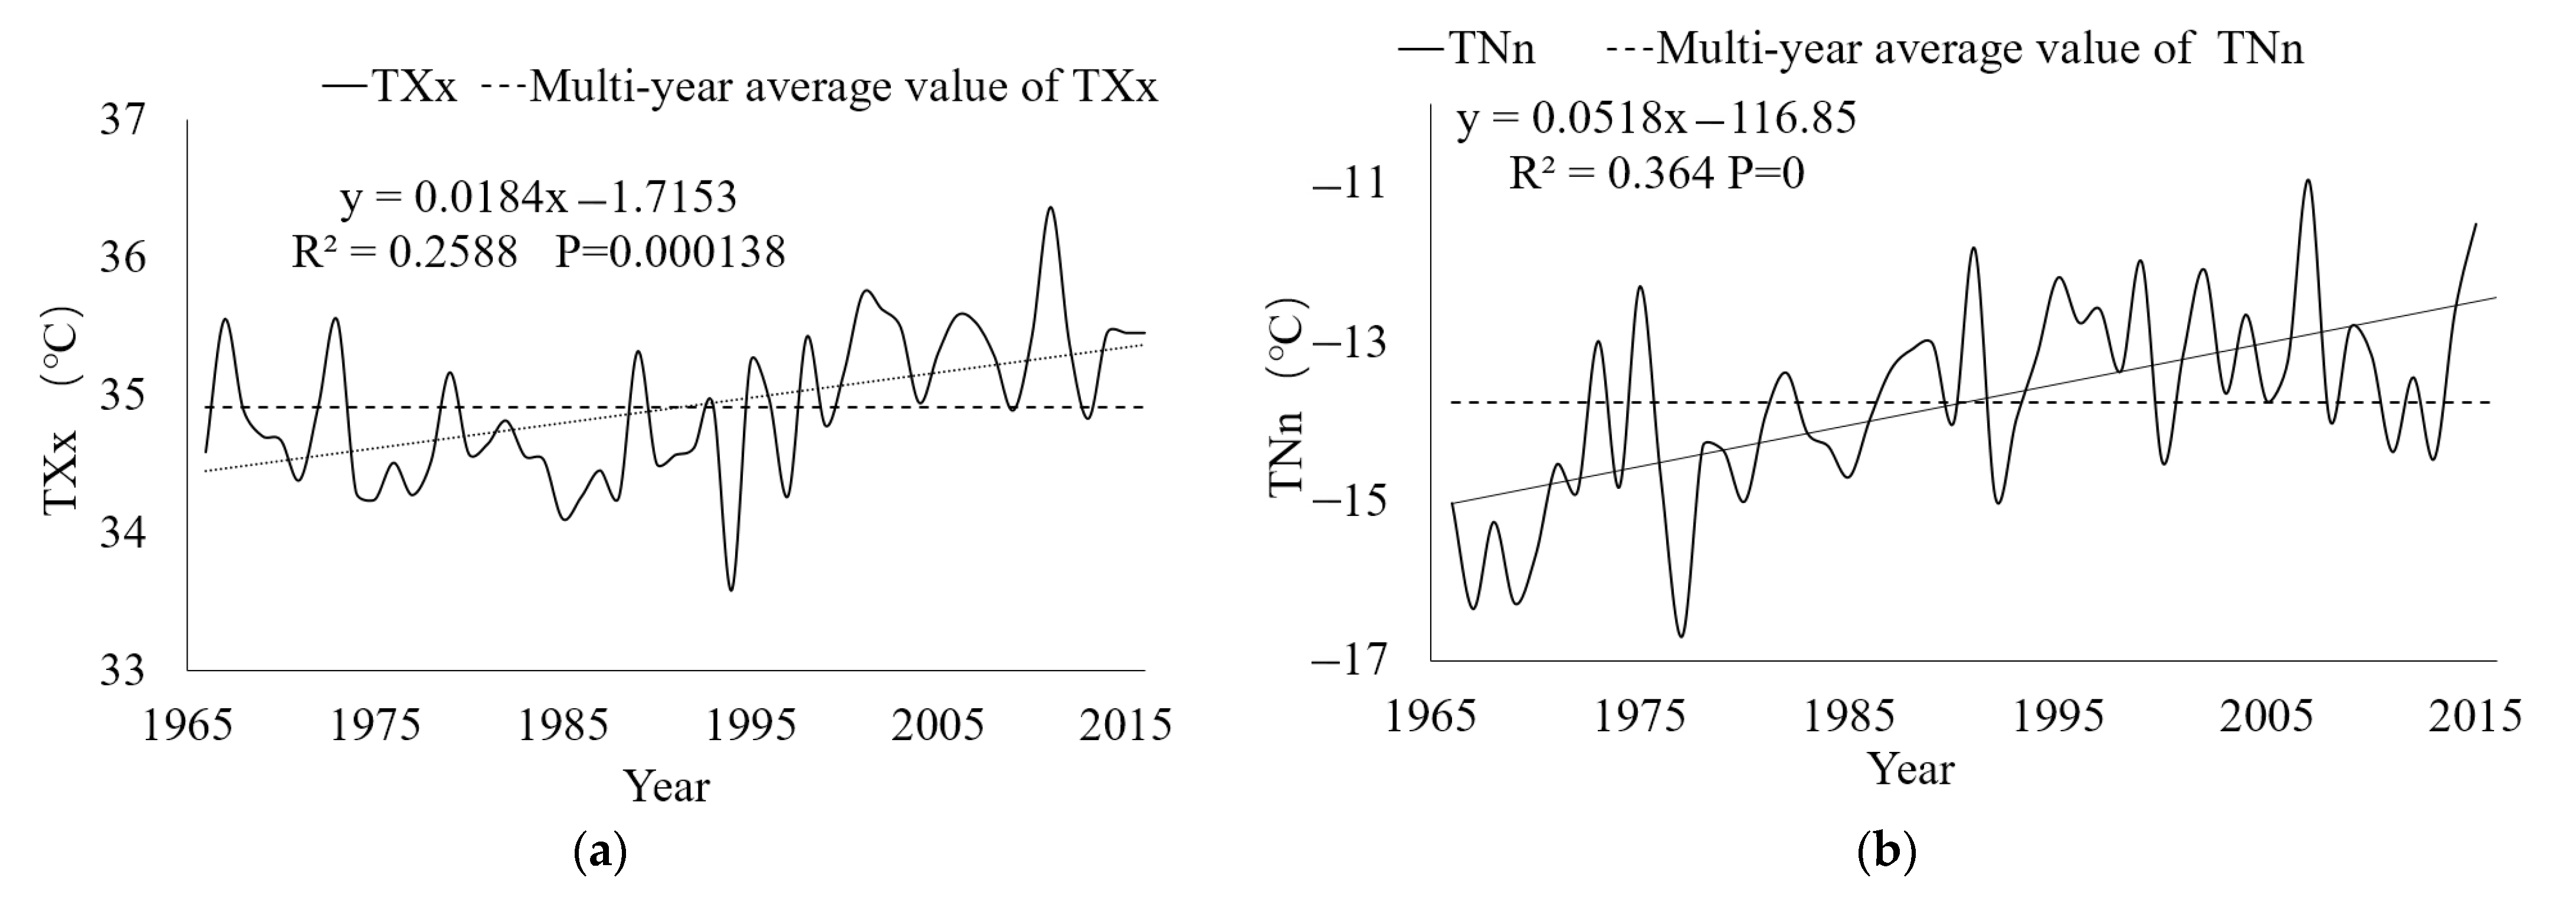
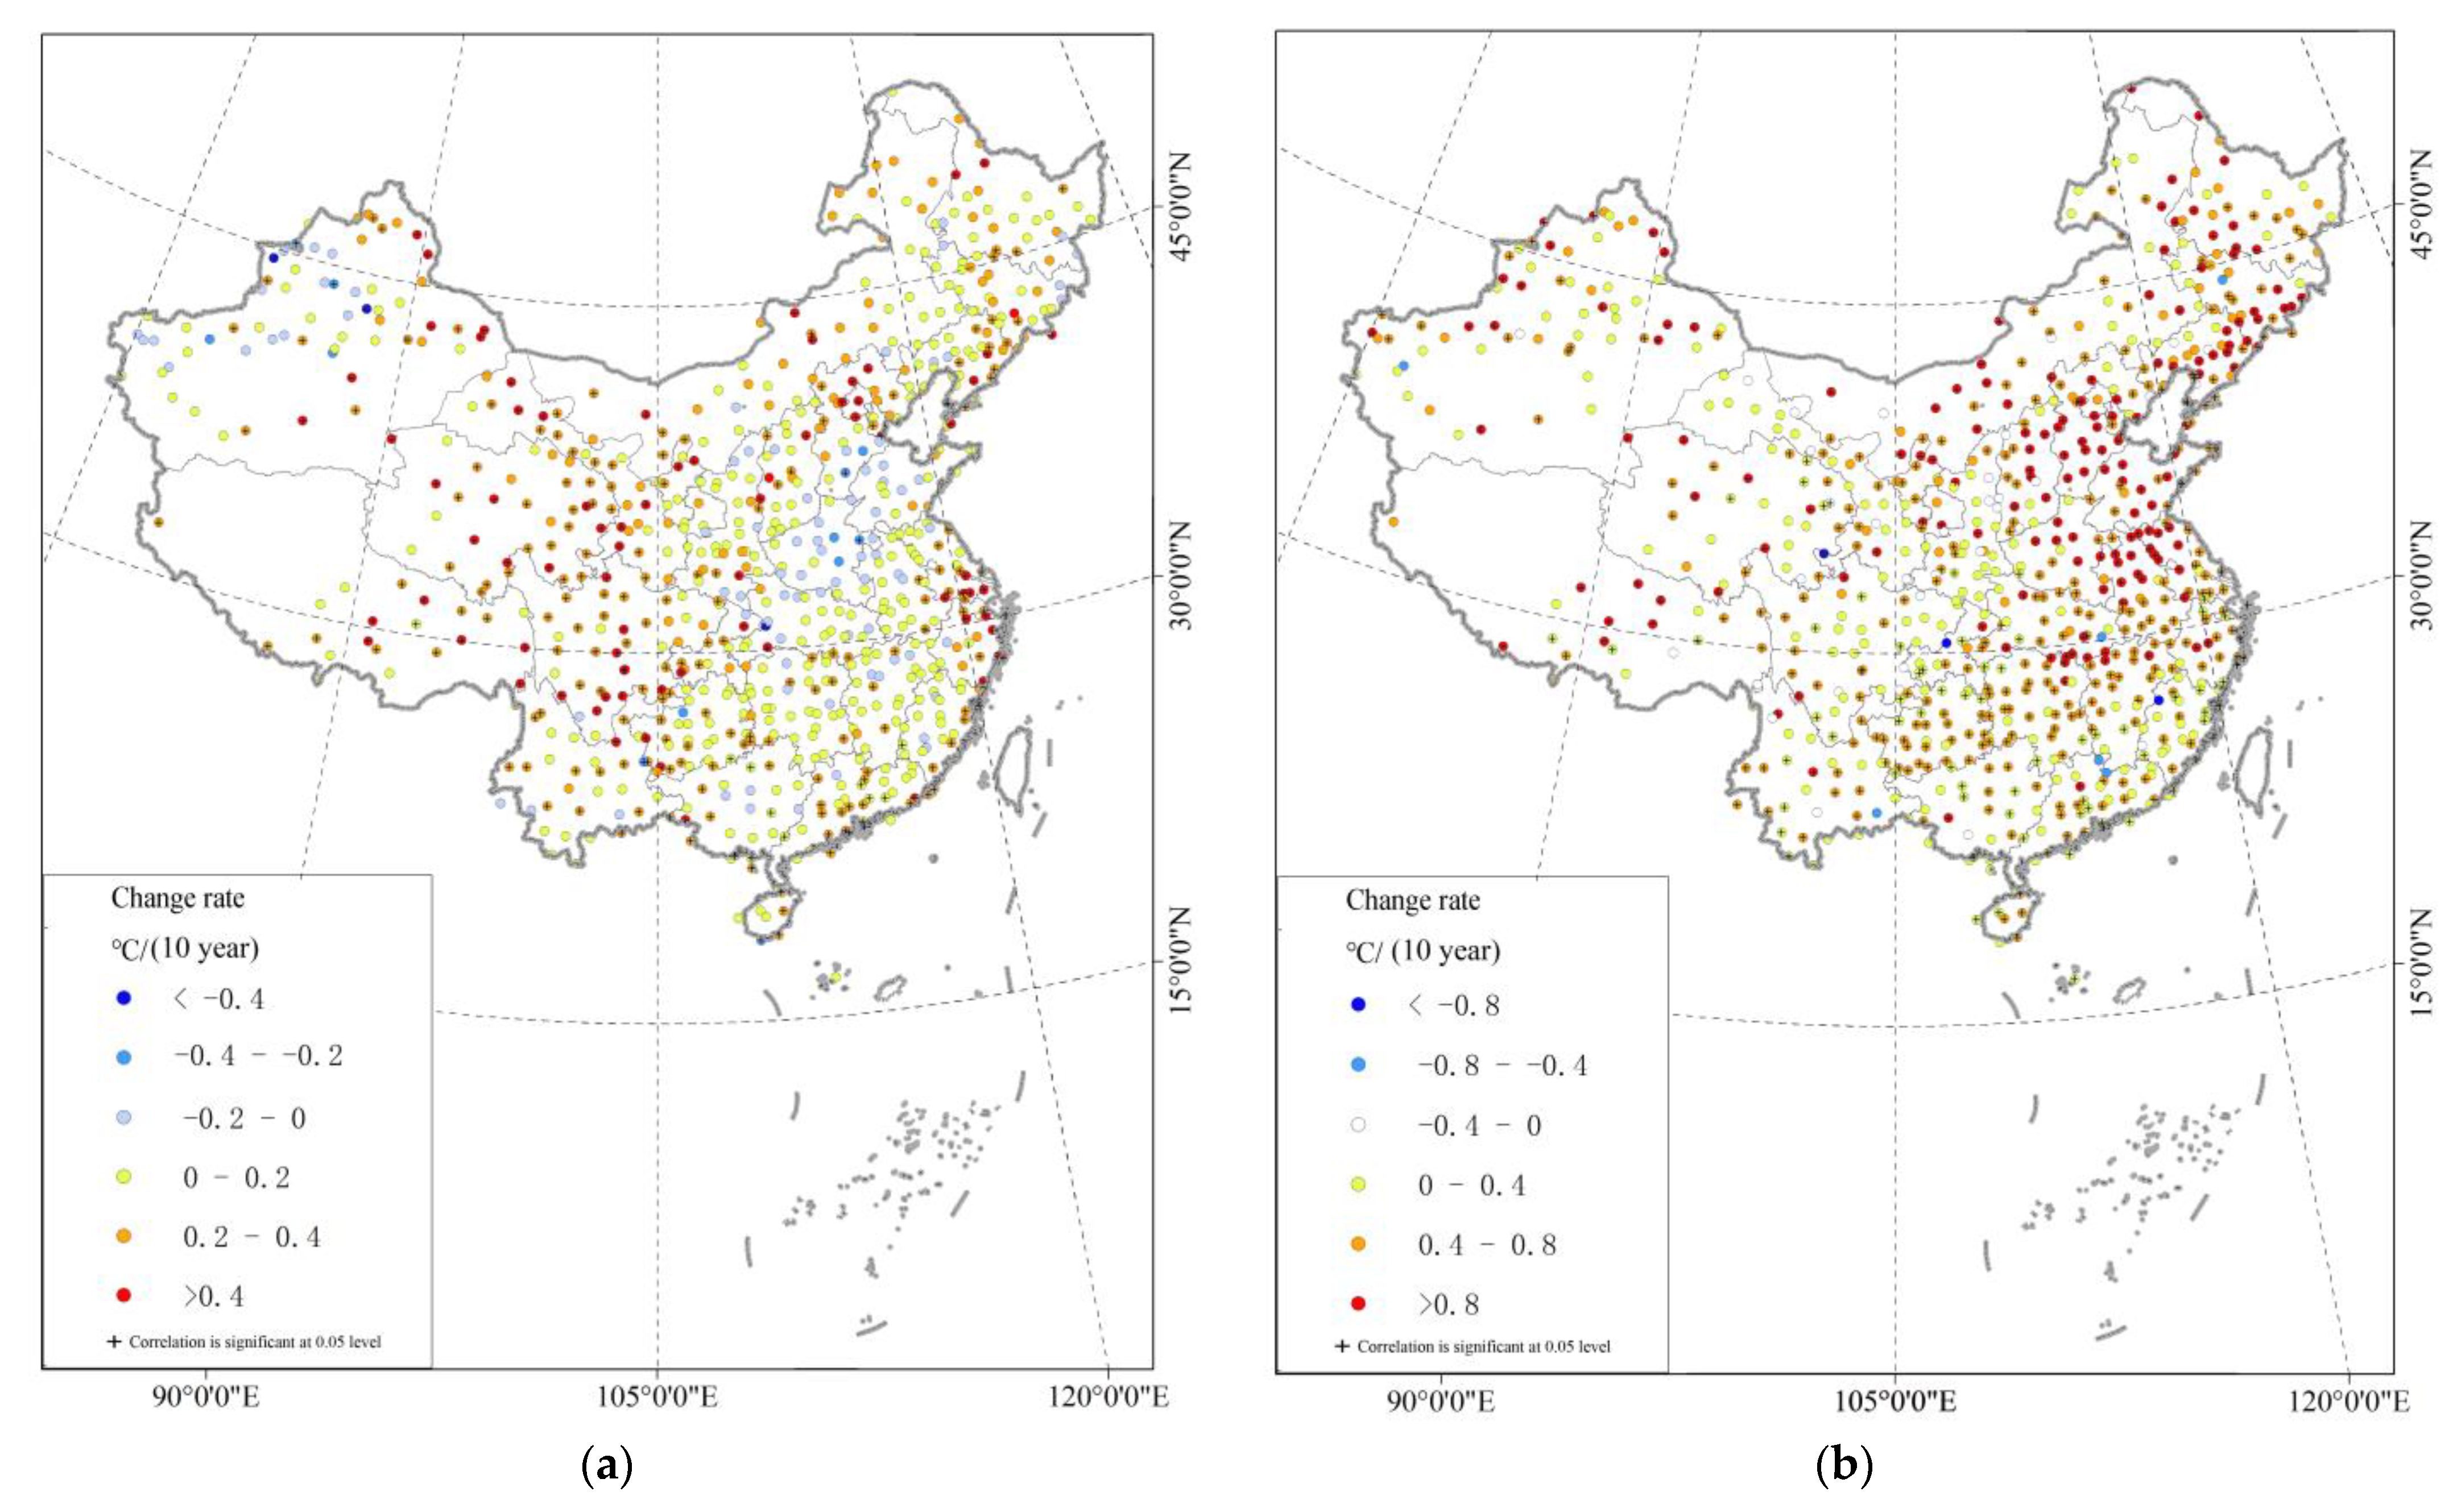
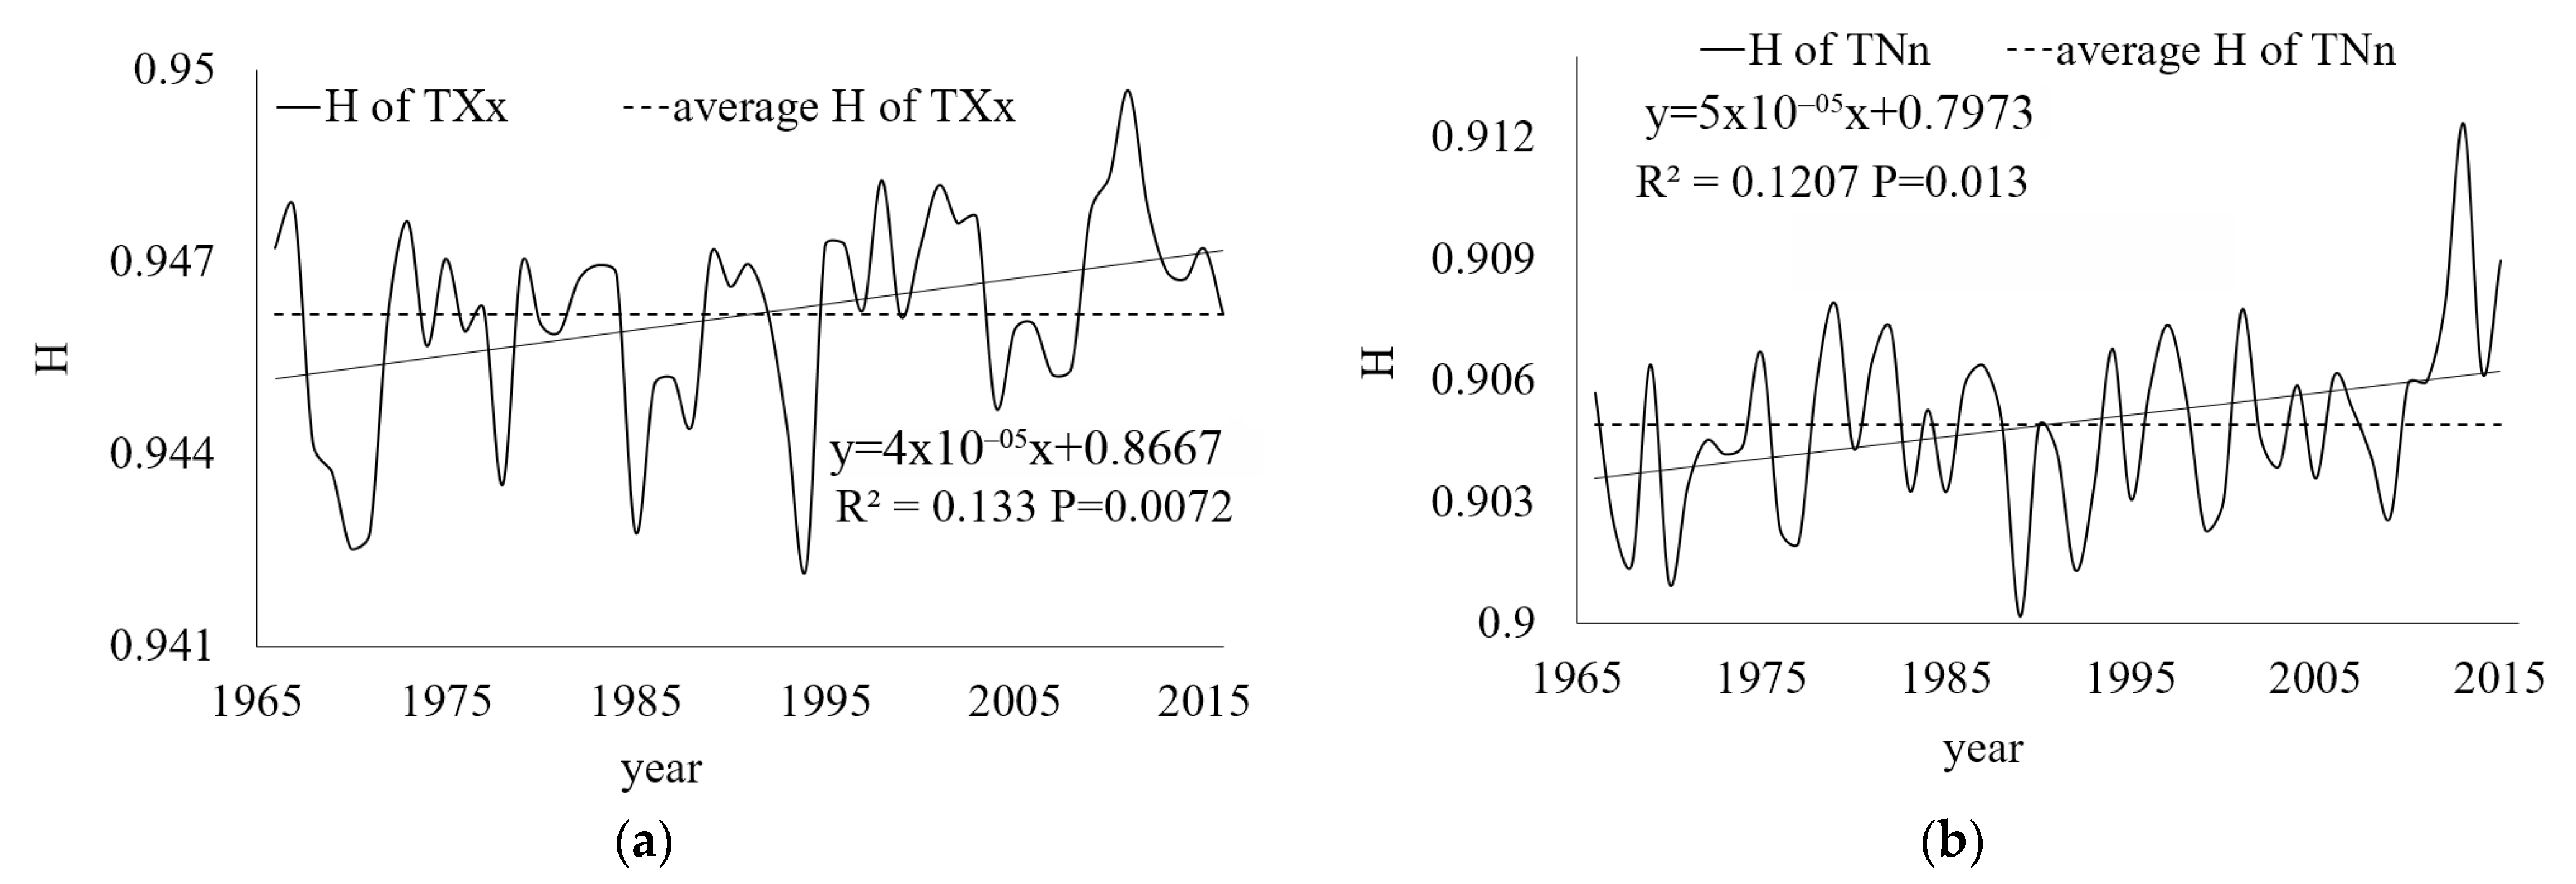
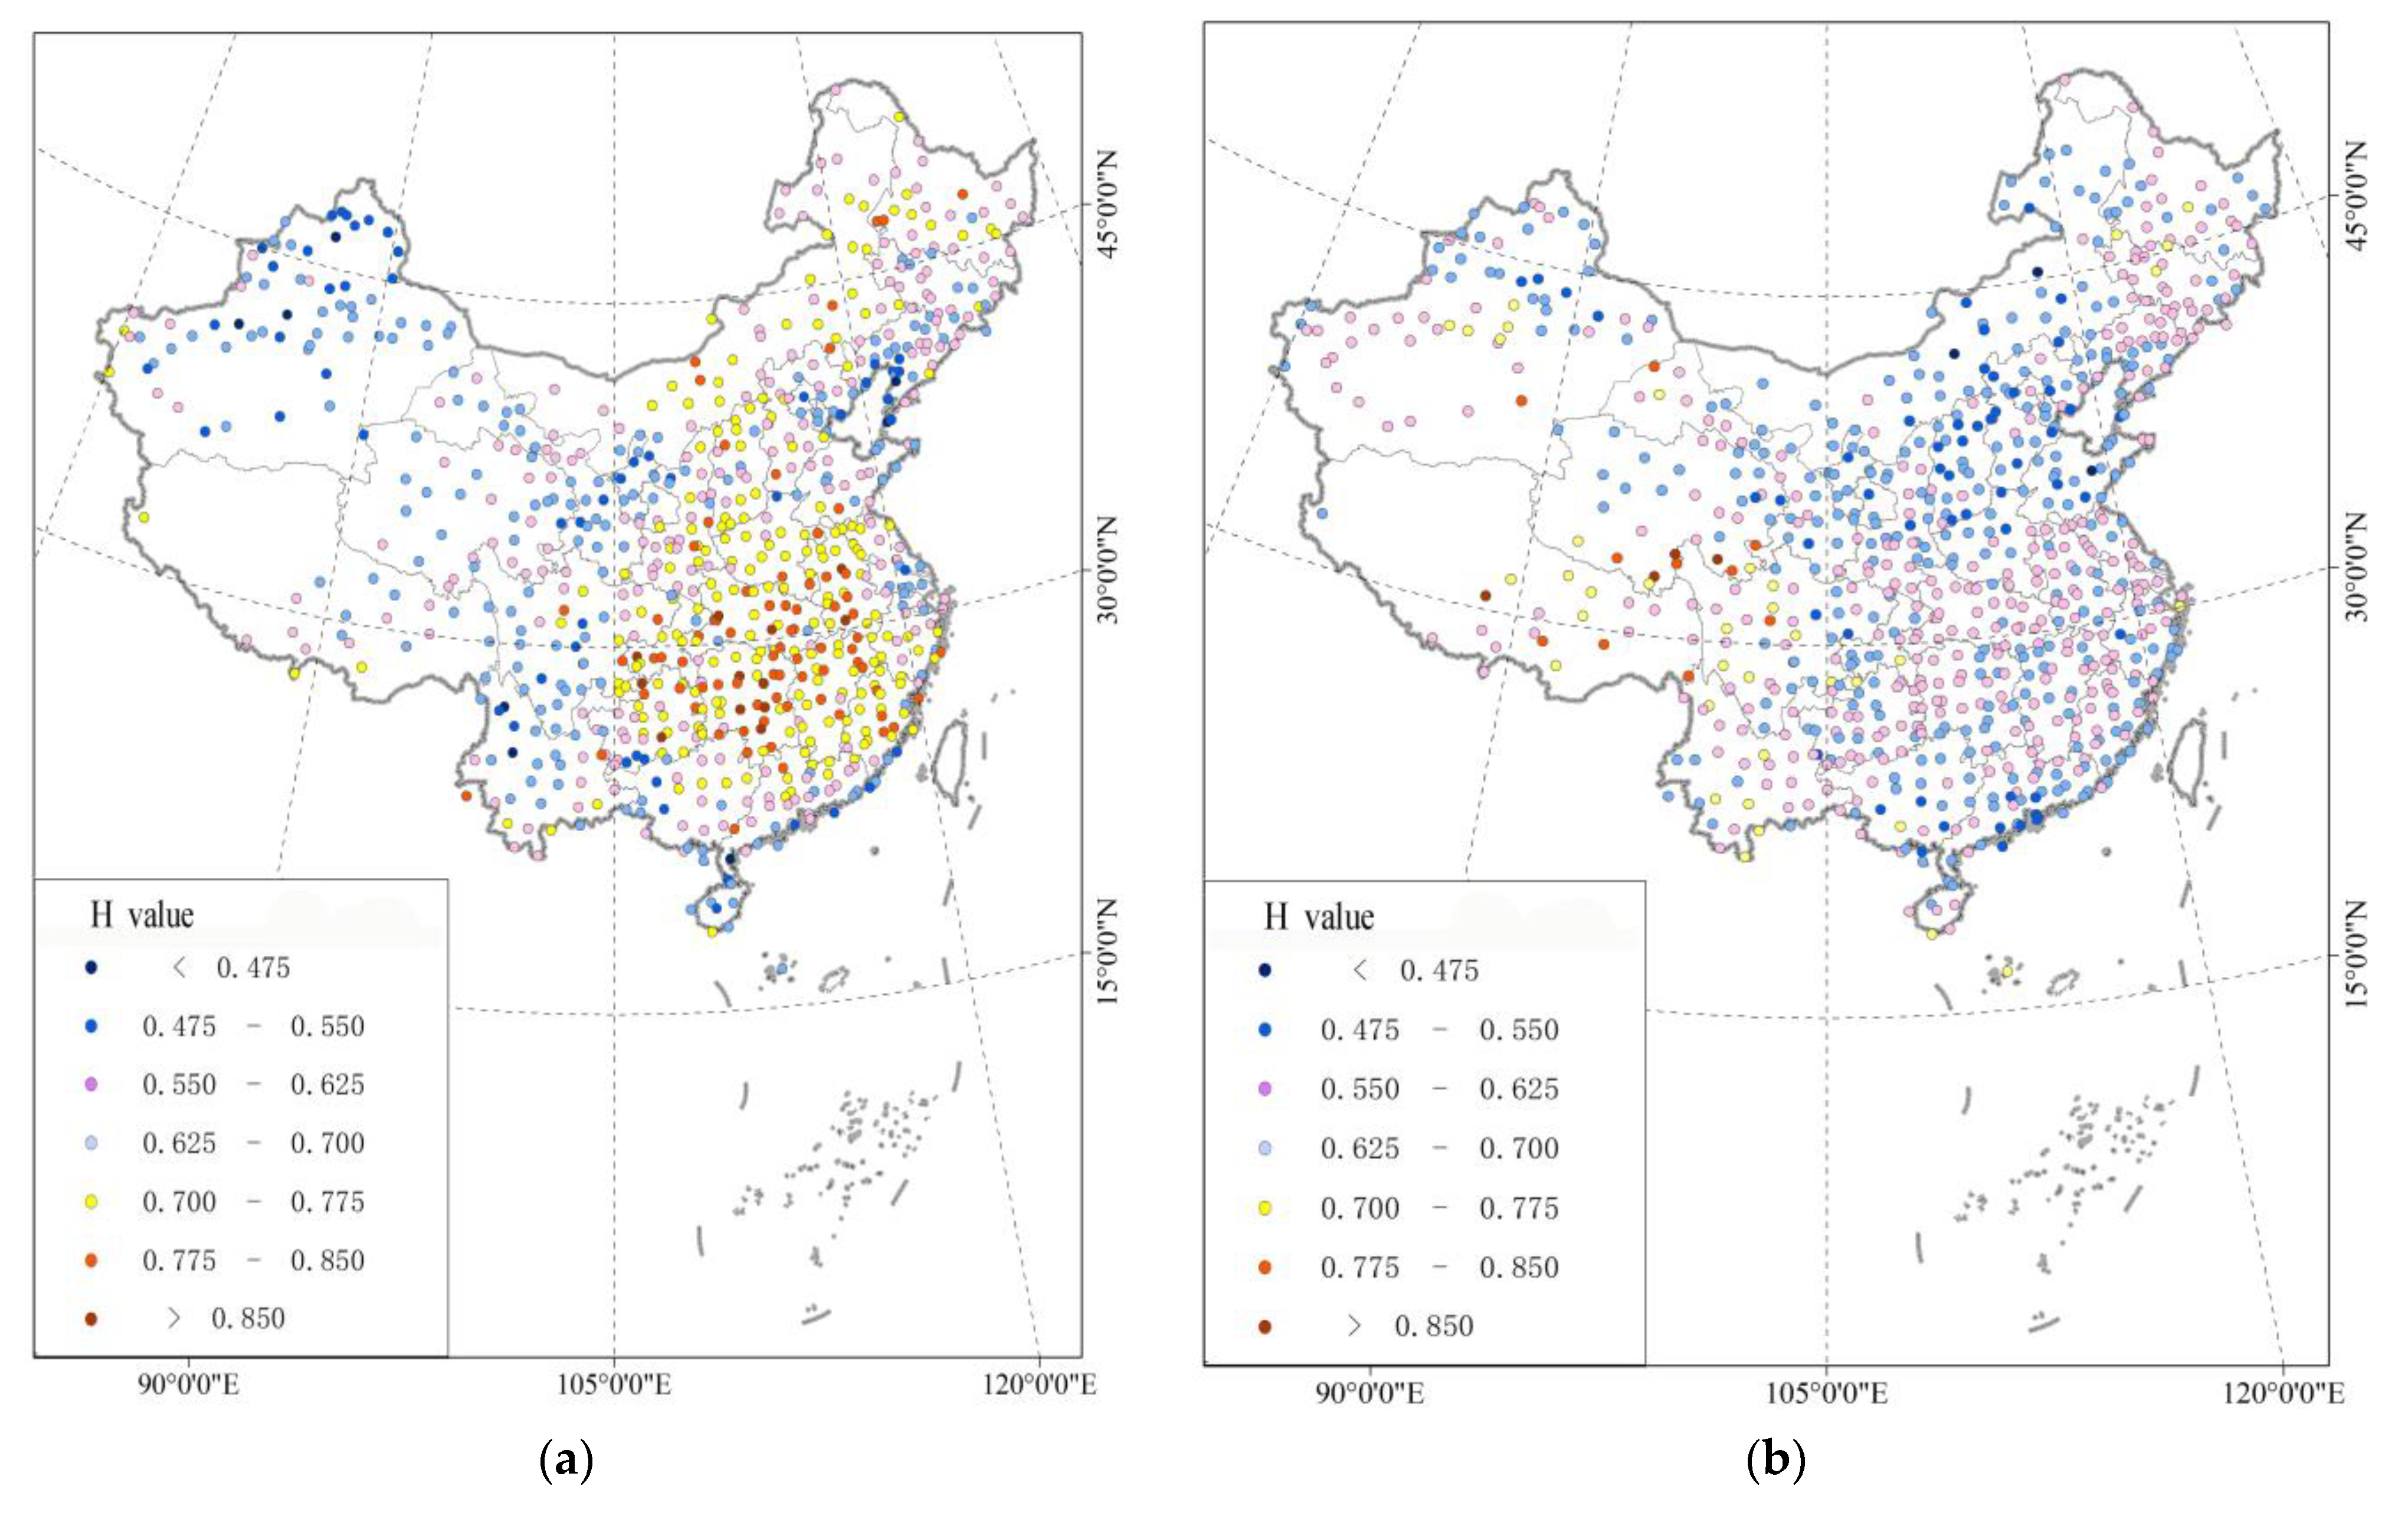
3.1.1. Spatial and Temporal Variation of TXx and TNn

By calculating the annual average of the extreme temperature indices for all stations, we obtained the results that both TXx and TNn in China showed an increasing trend from 1966–2015, with an increased rate of 0.184 °C/10 year and 0.518 °C/10 year, respectively. TXx showed a clear upward trend since 1985, while TNn had a significant increase from 1966–2000 (Figure 4). During the increase in TNn, maximum values occurred in 1975, 1991, and 2007. However, the reason for this phenomenon is not clear.
Figure 5 shows that TXx displays a rising trend in all regions of China except for local areas in Henan, Shandong, and western Xinjiang. The rise in TXx was more pronounced in the Qinghai-Tibet Plateau and surrounding areas, the Beijing-Tianjin-Hebei region, and the Yangtze River Delta region. TNn shows a rising trend throughout China, and in the Qinghai-Tibet Plateau region, Hubei-Hunan border region, local areas in eastern China, northern China, and Liaoning province, where the rising trend was most obvious.

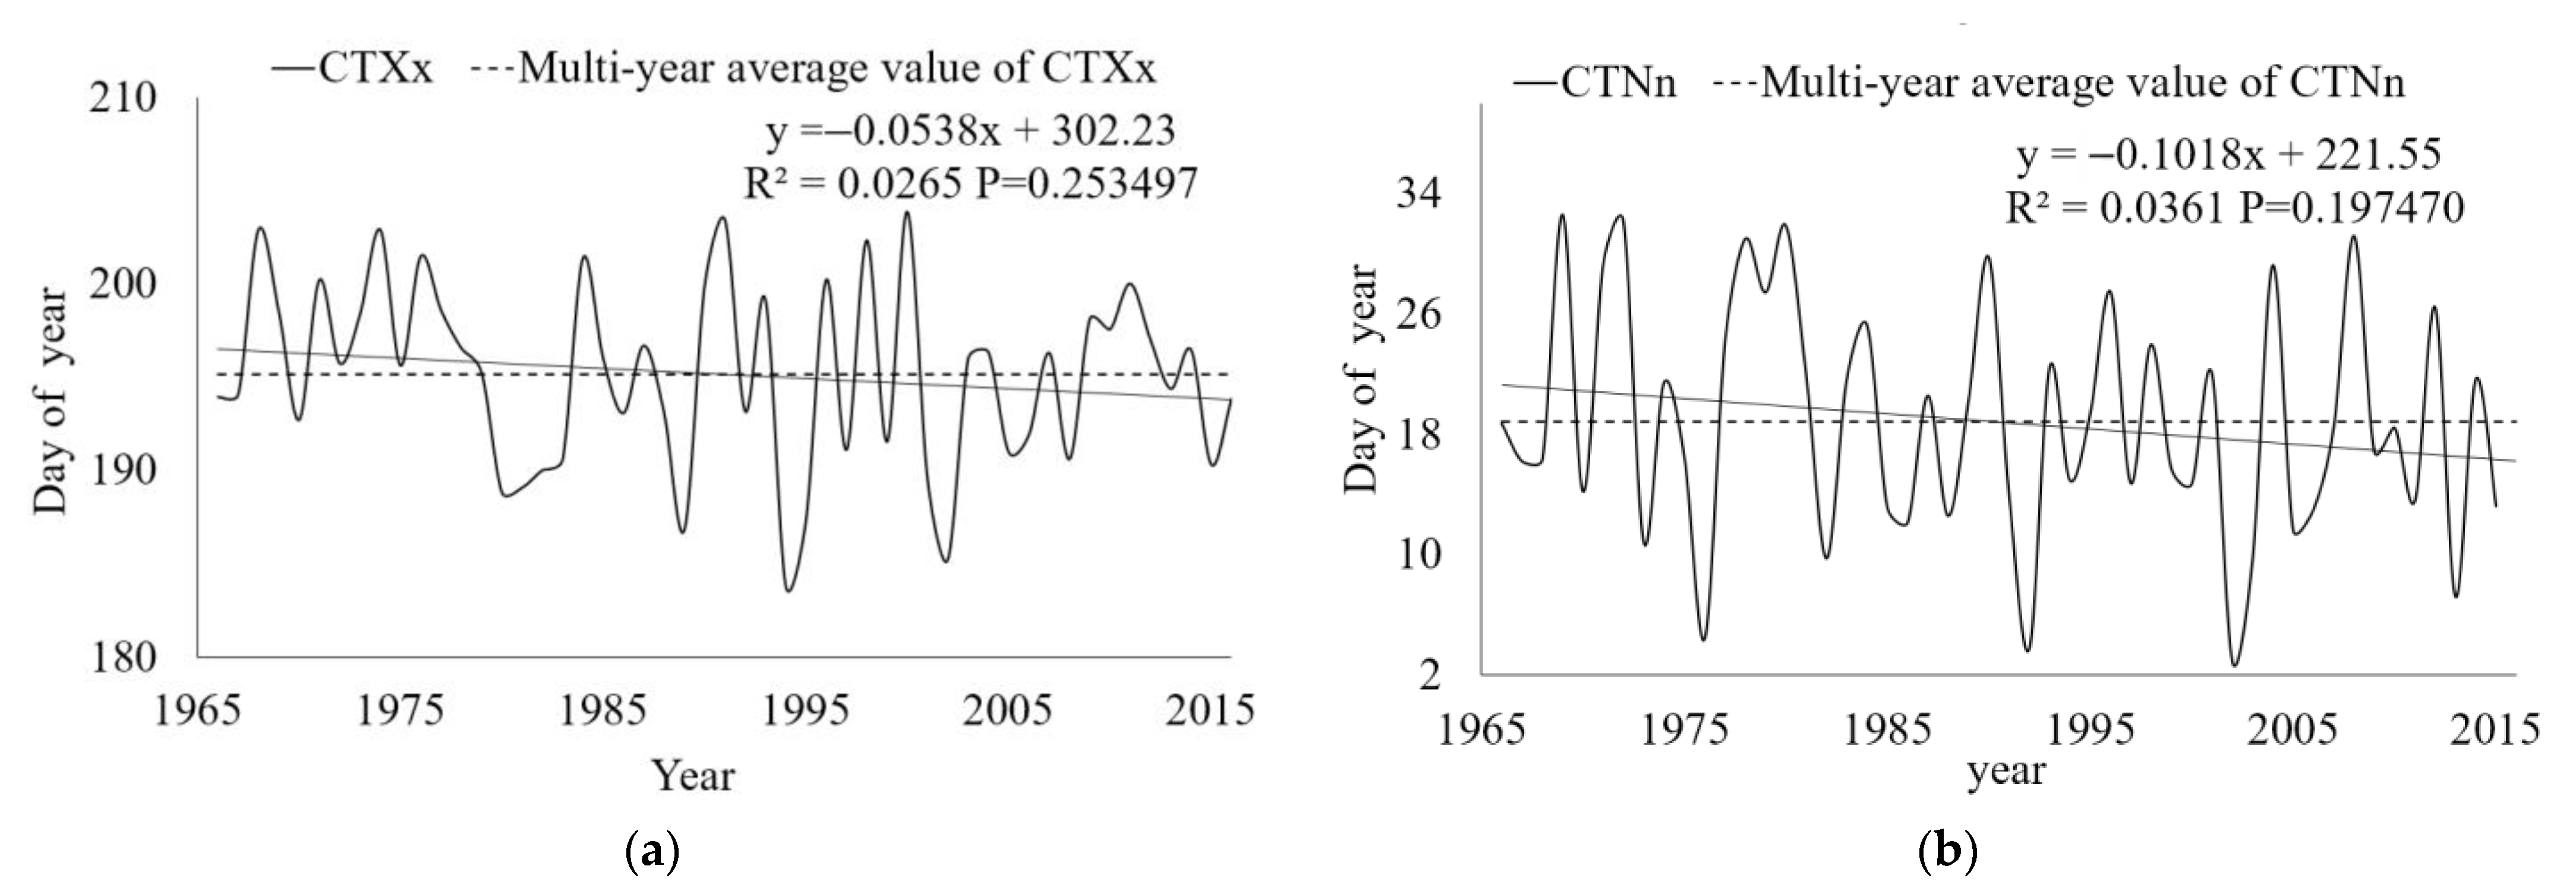
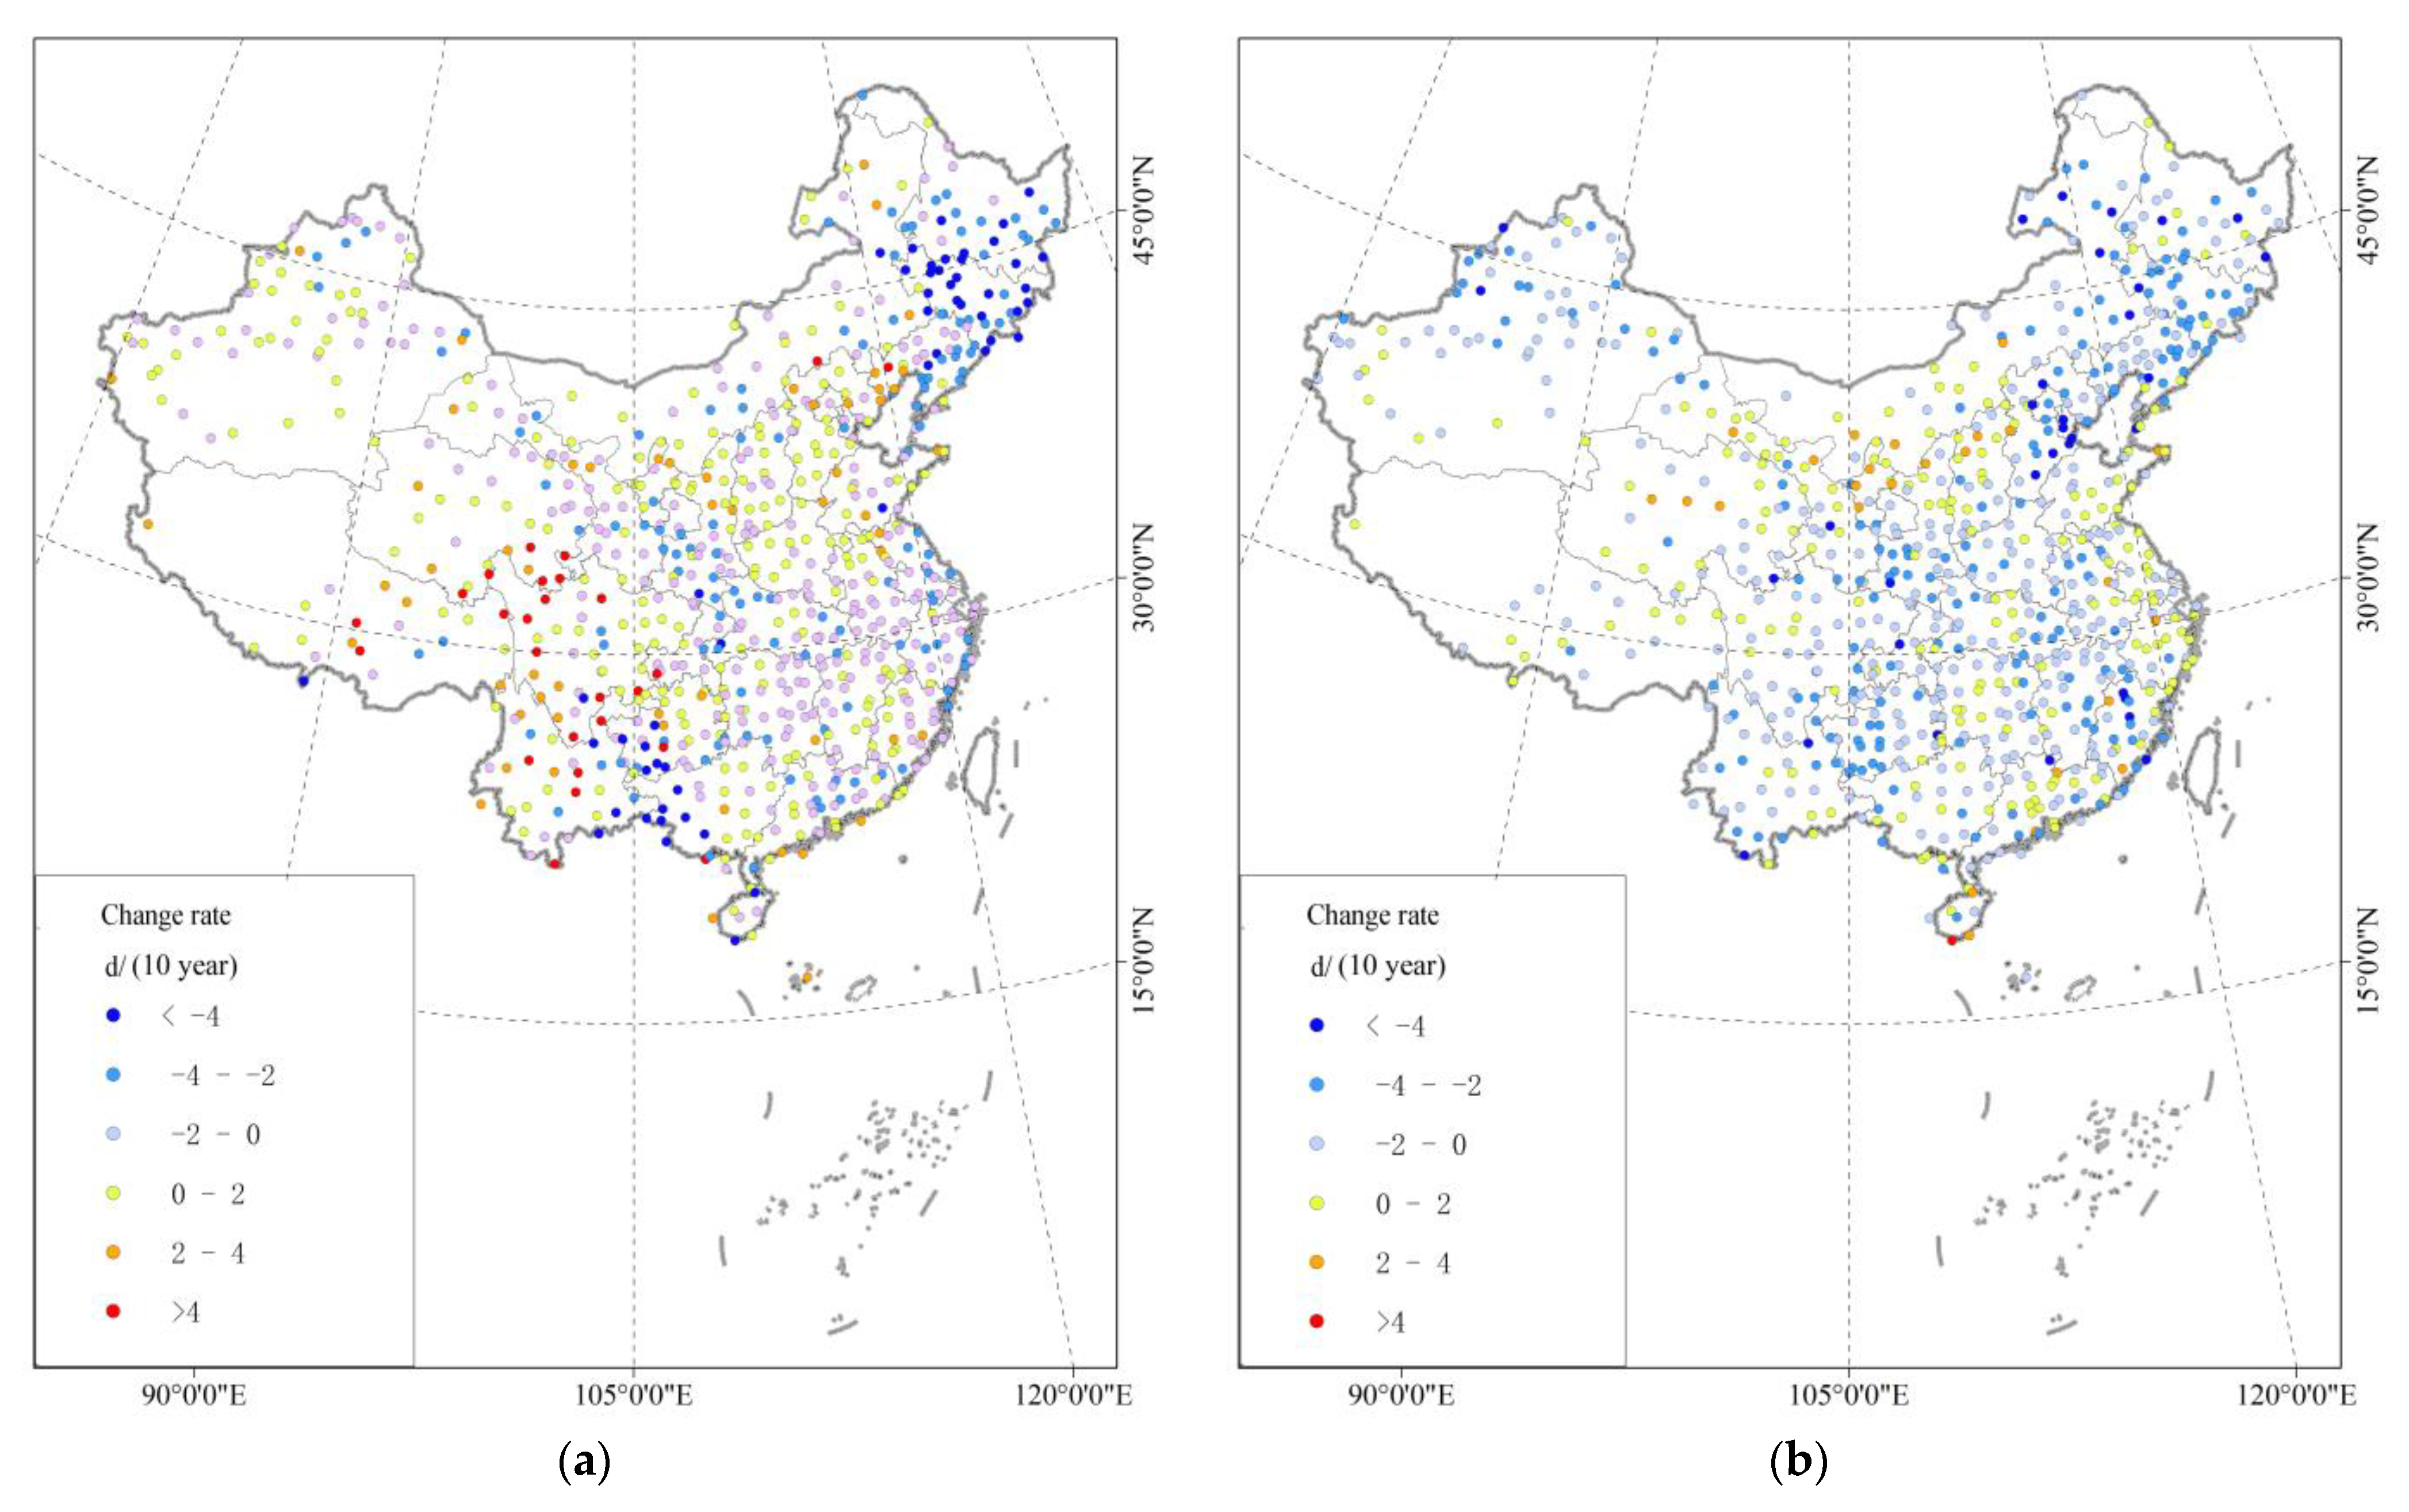
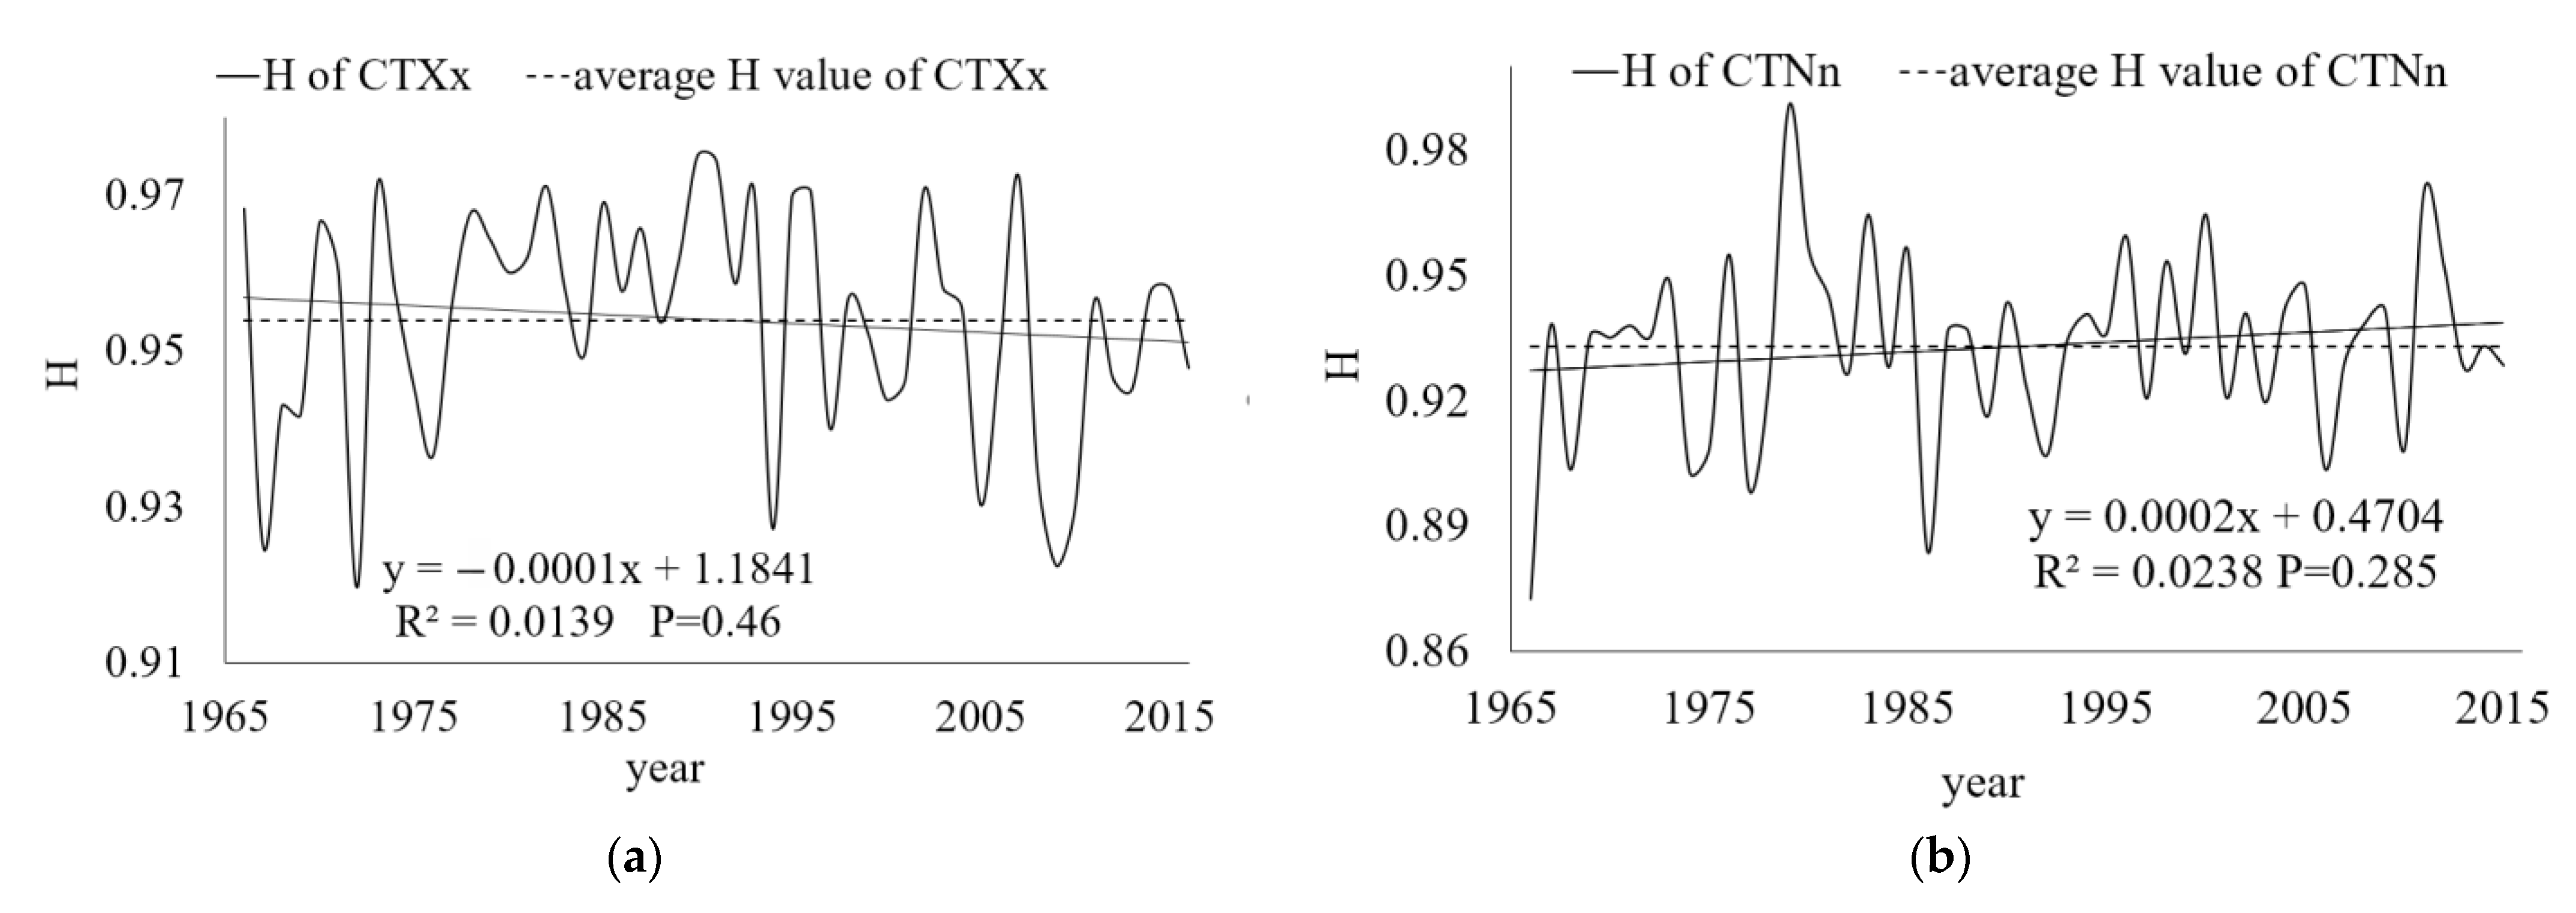
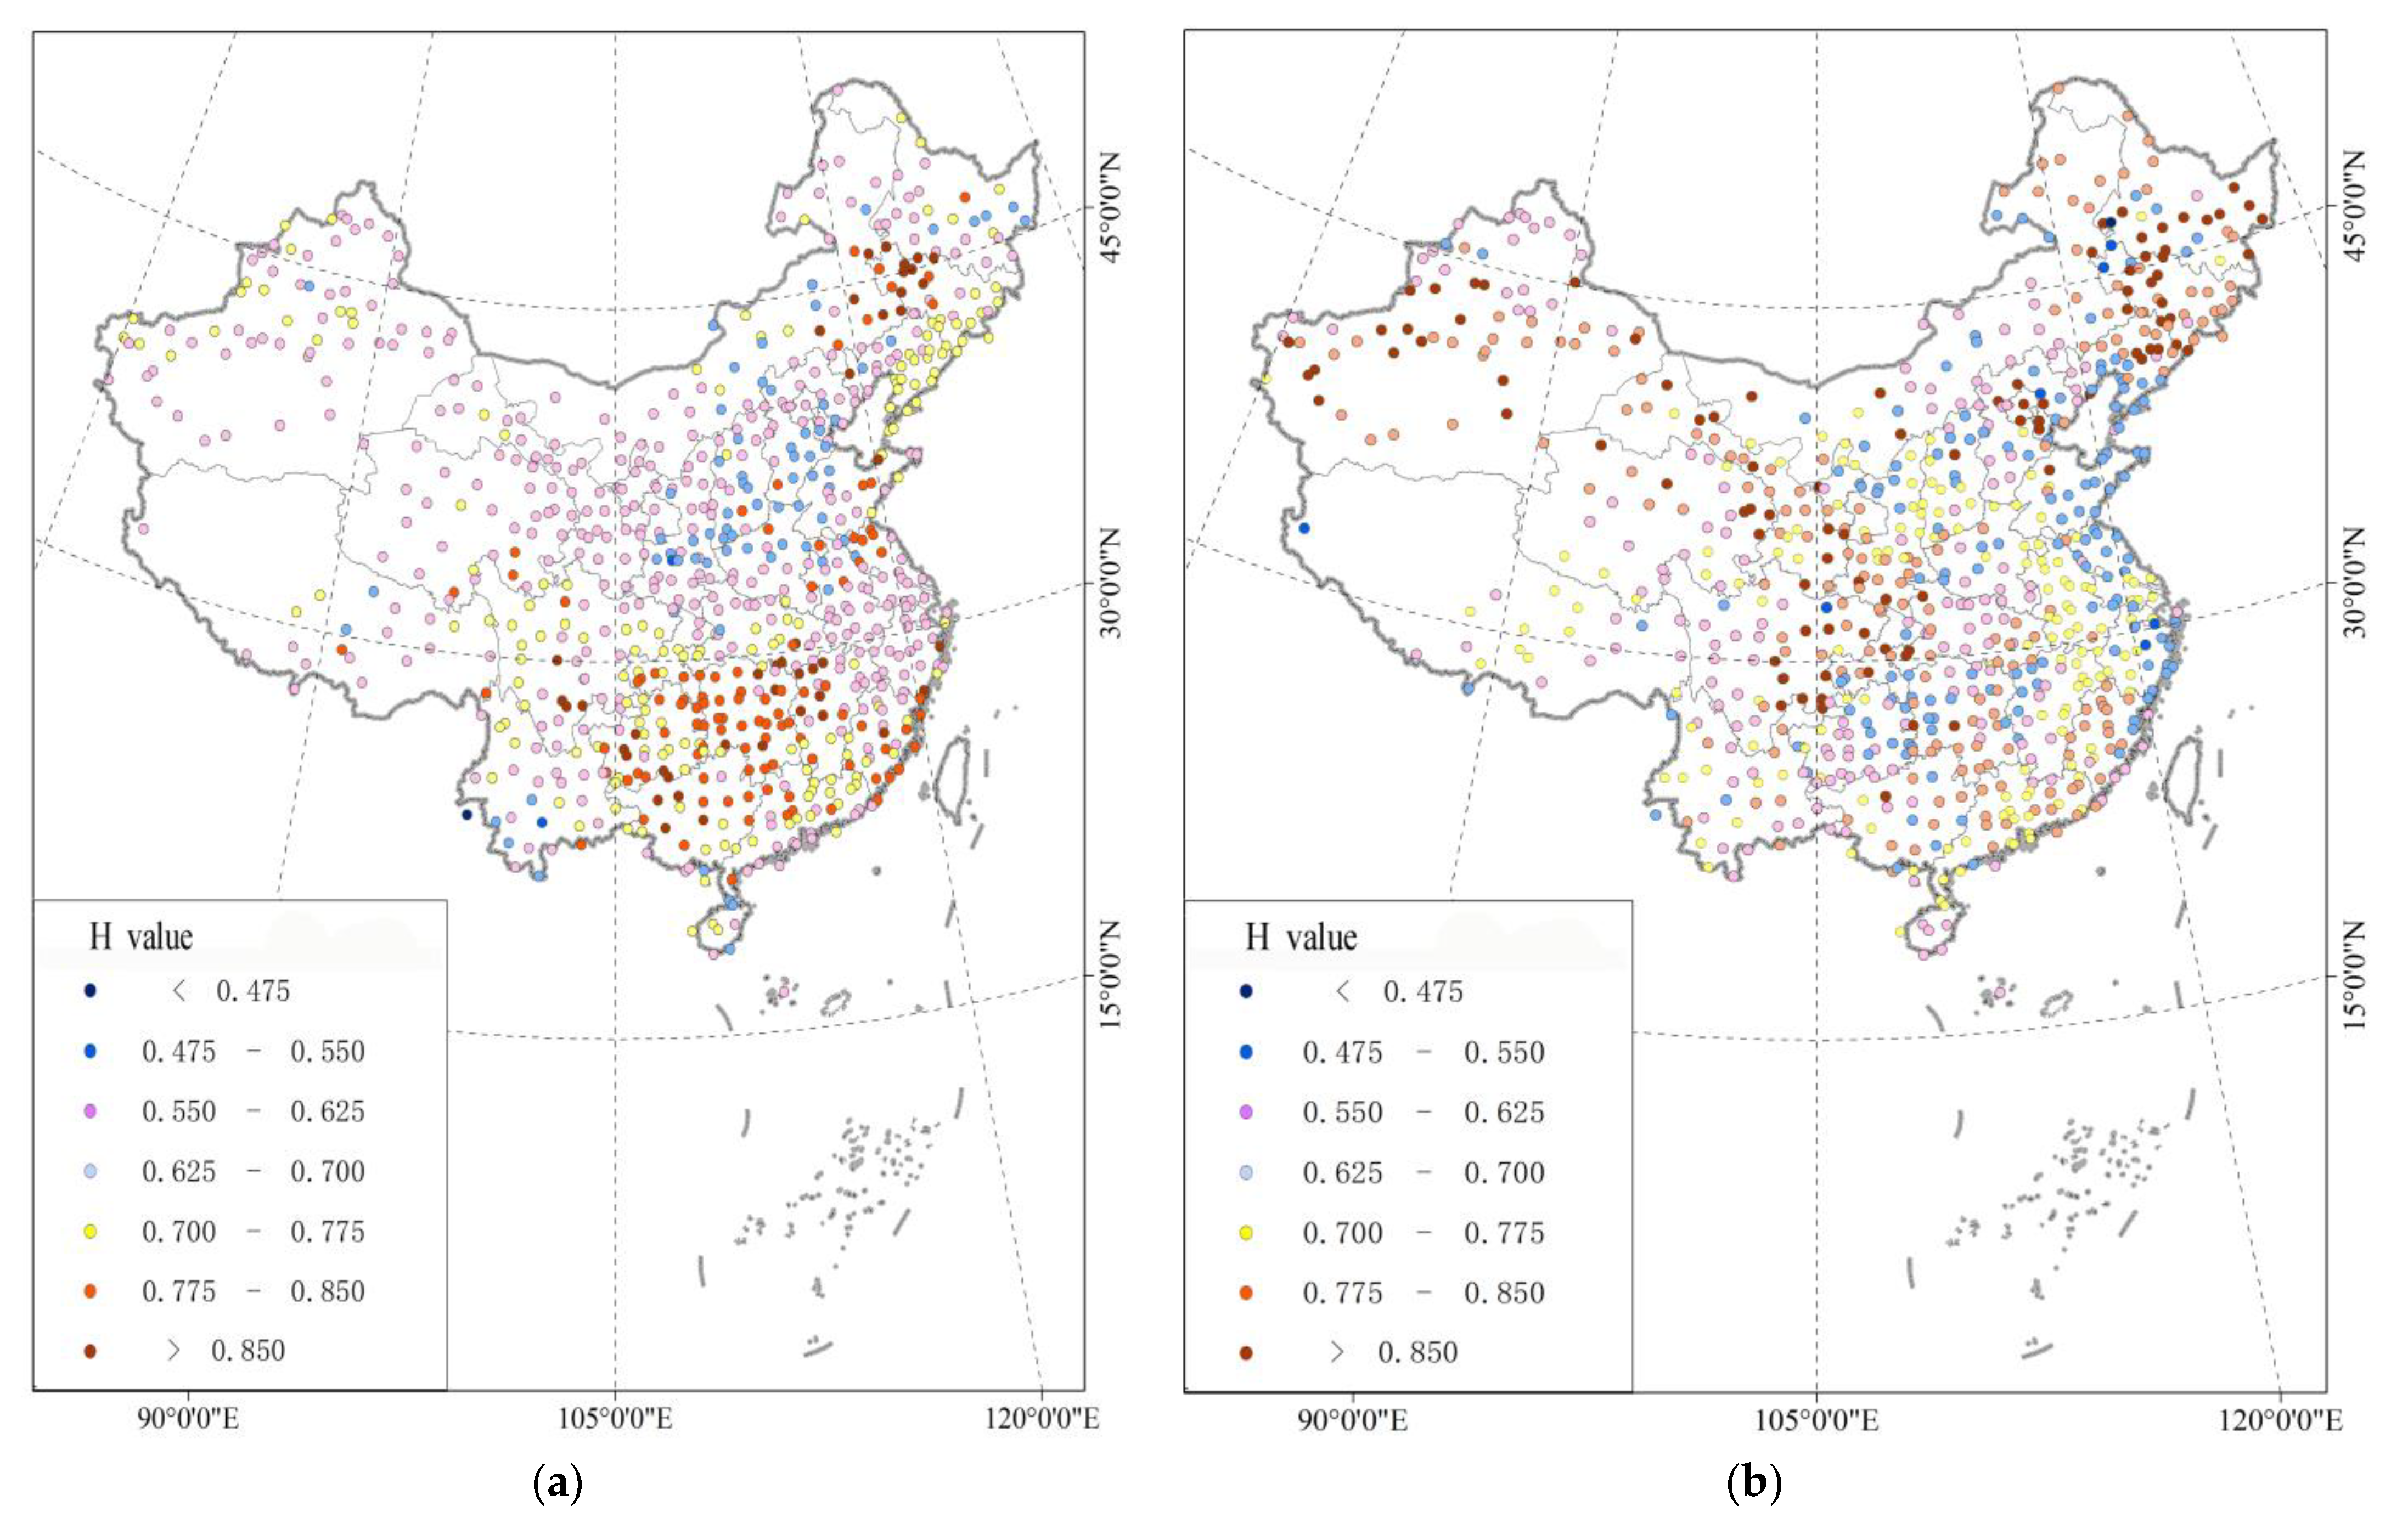
3.1.2. Spatial and Temporal Variation of CTXx and CTNn

By analyzing the interannual dates of extreme temperatures and calculating the annual average of the extreme temperature indices for all stations, we can conclude that CTXx and CTNn in China show a clear forward trend from 1966 to 2015, advancing by 0.538 d/10 year and 1.02 d/10 year, respectively. Nevertheless, this change was not significant (Figure 6). The advance of CTNn was almost twice as fast as that of CTXx.
Spatially, CTXx is significantly delayed in the Qinghai-Tibet Plateau, northern China, southern Xinjiang, and northeast China, and significantly advanced in the central Yunnan, Guizhou, and Guangxi junctions.The CTNn delayed arrival region was distributed in the Qinghai-Tibet Plateau, Gansu Hexi Corridor, northern Ningxia, northern Shaanxi, northern Shanxi and western Inner Mongolia, while the advance of CTNn was mainly in the northeast, Beijing-Tianjin-Hebei region and the Sichuan, Yunnan and Guizhou (Figure 7).

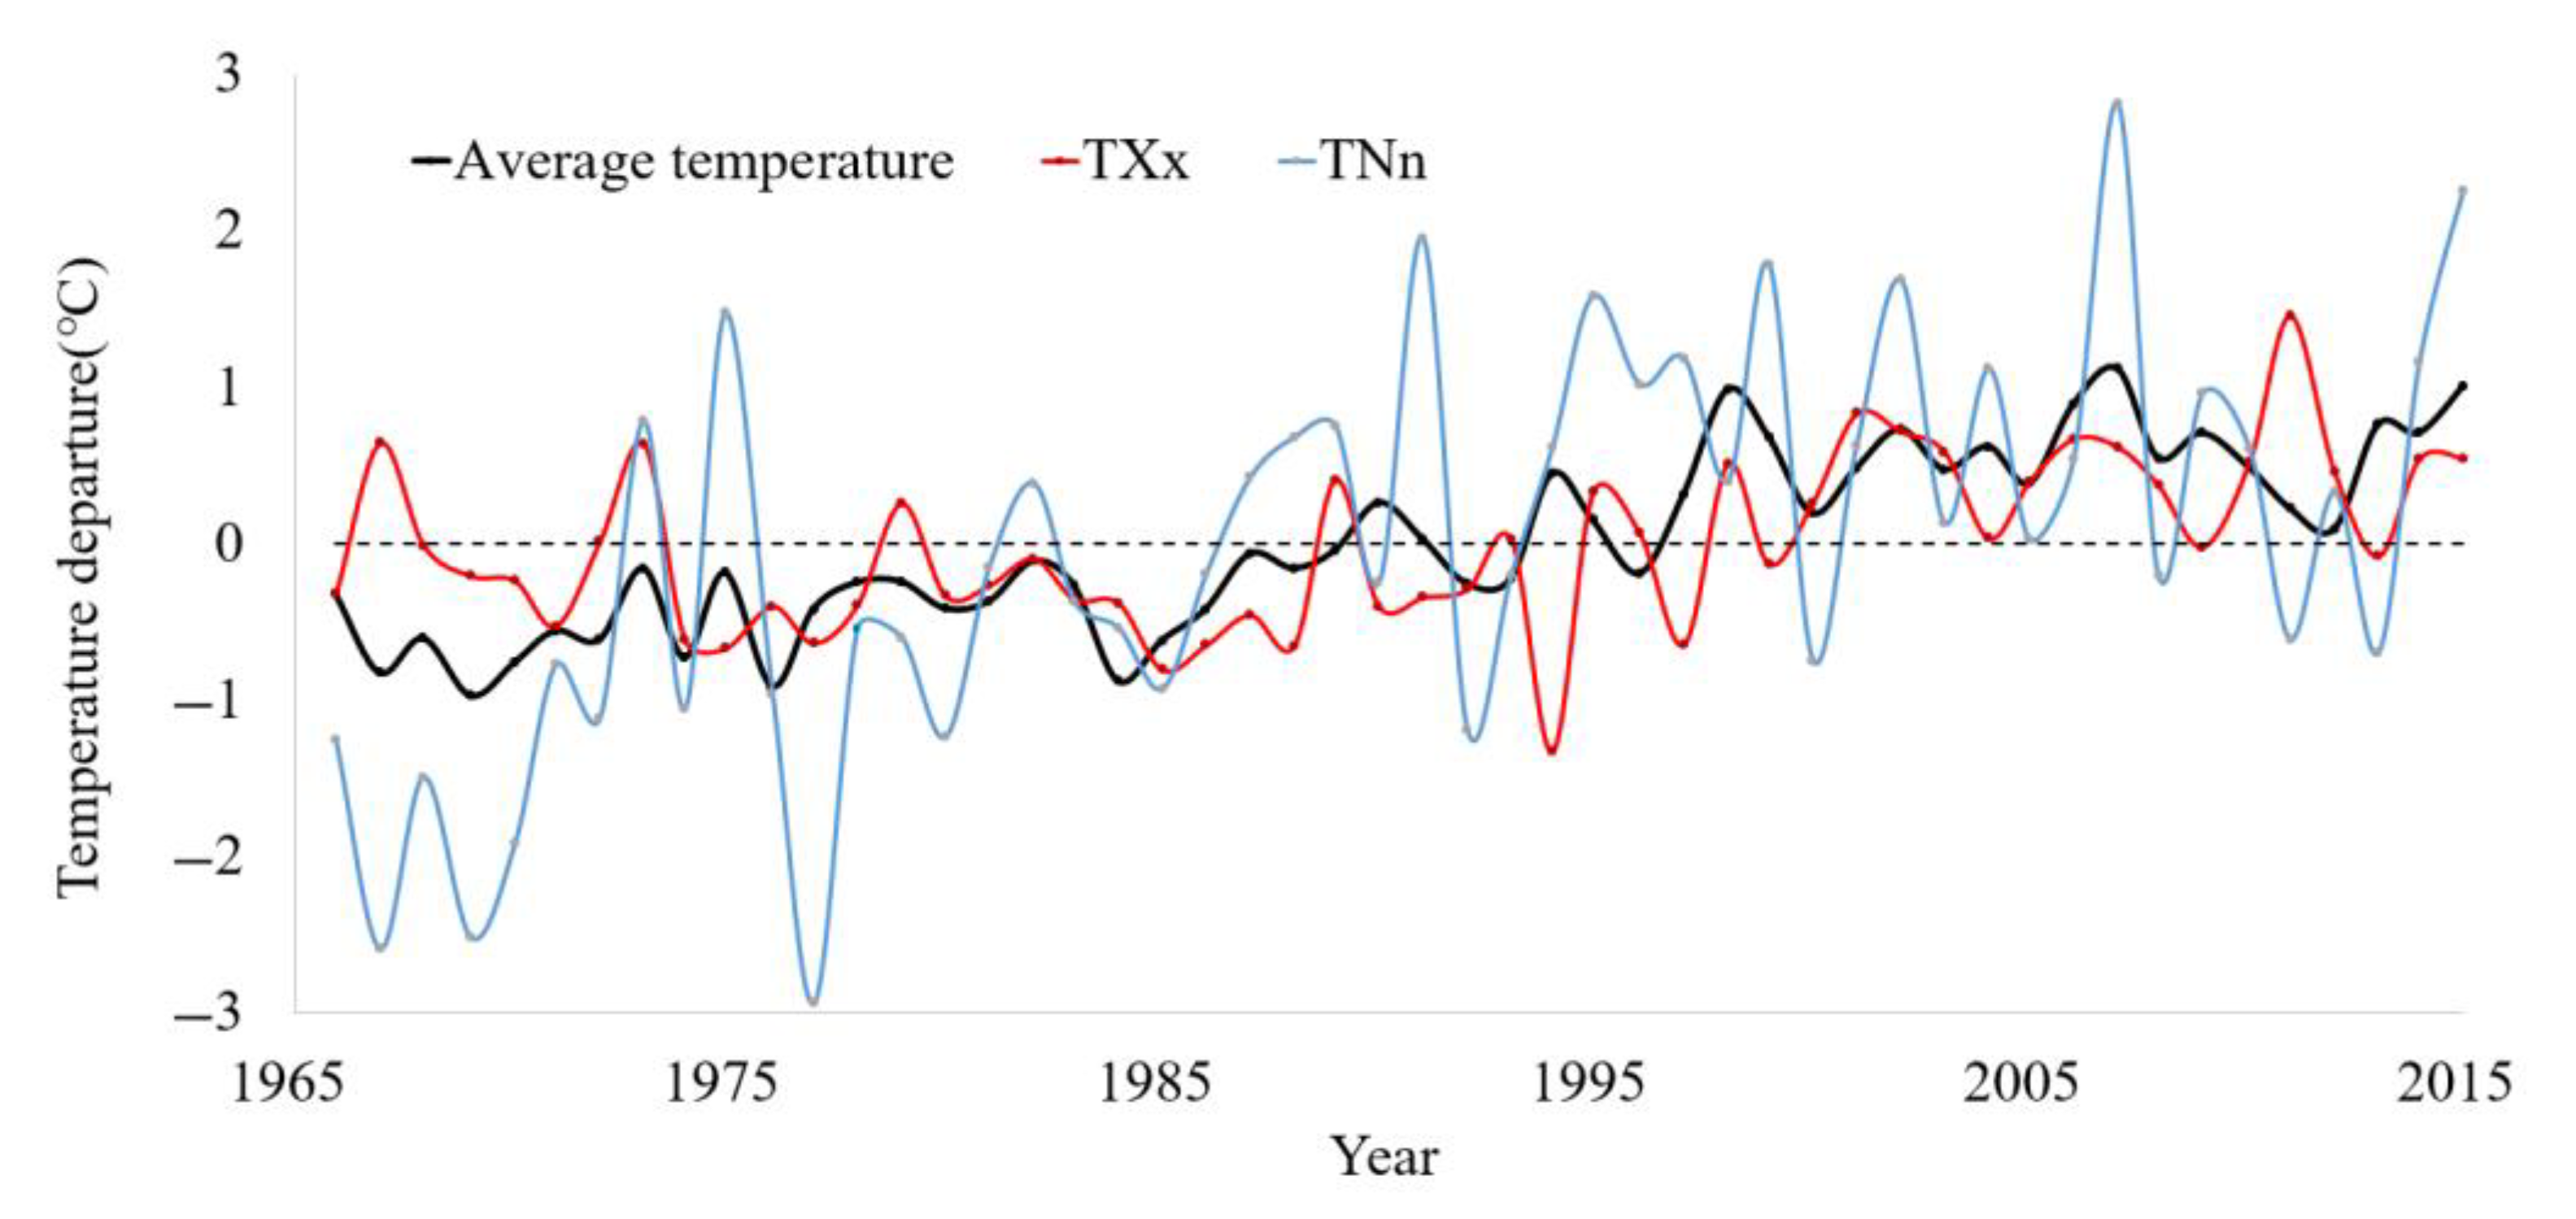
3.1.3. Extreme Temperature Changes Corresponding to Global Warming

The Second National Climate Change Assessment Report published by China showed a trend of 0.23 °C/10 year for surface temperature in China from 1951 to 2009 [34]. Contemporary studies of extreme temperatures showed trends of 0.184 °C/10 year and 0.518 °C/10 year for TXx and TNn, respectively, from 1966 to 2015. The trends in extreme temperatures were the same as the trends in average temperatures, but the magnitudes of the trends in extreme and average temperatures were different. The trend in TXx was slightly lower than the surface temperature trend in China, while the trend in TNn was surface temperature trend by a factor of 2.25. Moreover, the advance of CTNn was almost twice as fast as CTXx. In addition, we found that the correlation coefficient between TXx and the average annual average temperature was 0.47 (p < 0.01), while the correlation coefficient between TNn and the average annual average temperature was 0.71 (p < 0.01).
Since the beginning of this century, several recent studies have shown that there was an insignificant global surface temperature warming trend since 1998, and they proposed the idea of global warming stagnation [35,36,37]. The IPCC’s Fifth Assessment Report makes a similar argument [38]. In this study, we set out to analyze the trends in polar temperature over time. Figure 8 shows that the trend in TNn responds to the stagnant global warming trend around 2000. However, TXx did not respond to the stagnant global warming trend until around 2005 (Figure 8). As mentioned above, we can conclude that the extreme low temperatures in China were more sensitive to global warming than extreme high temperatures.

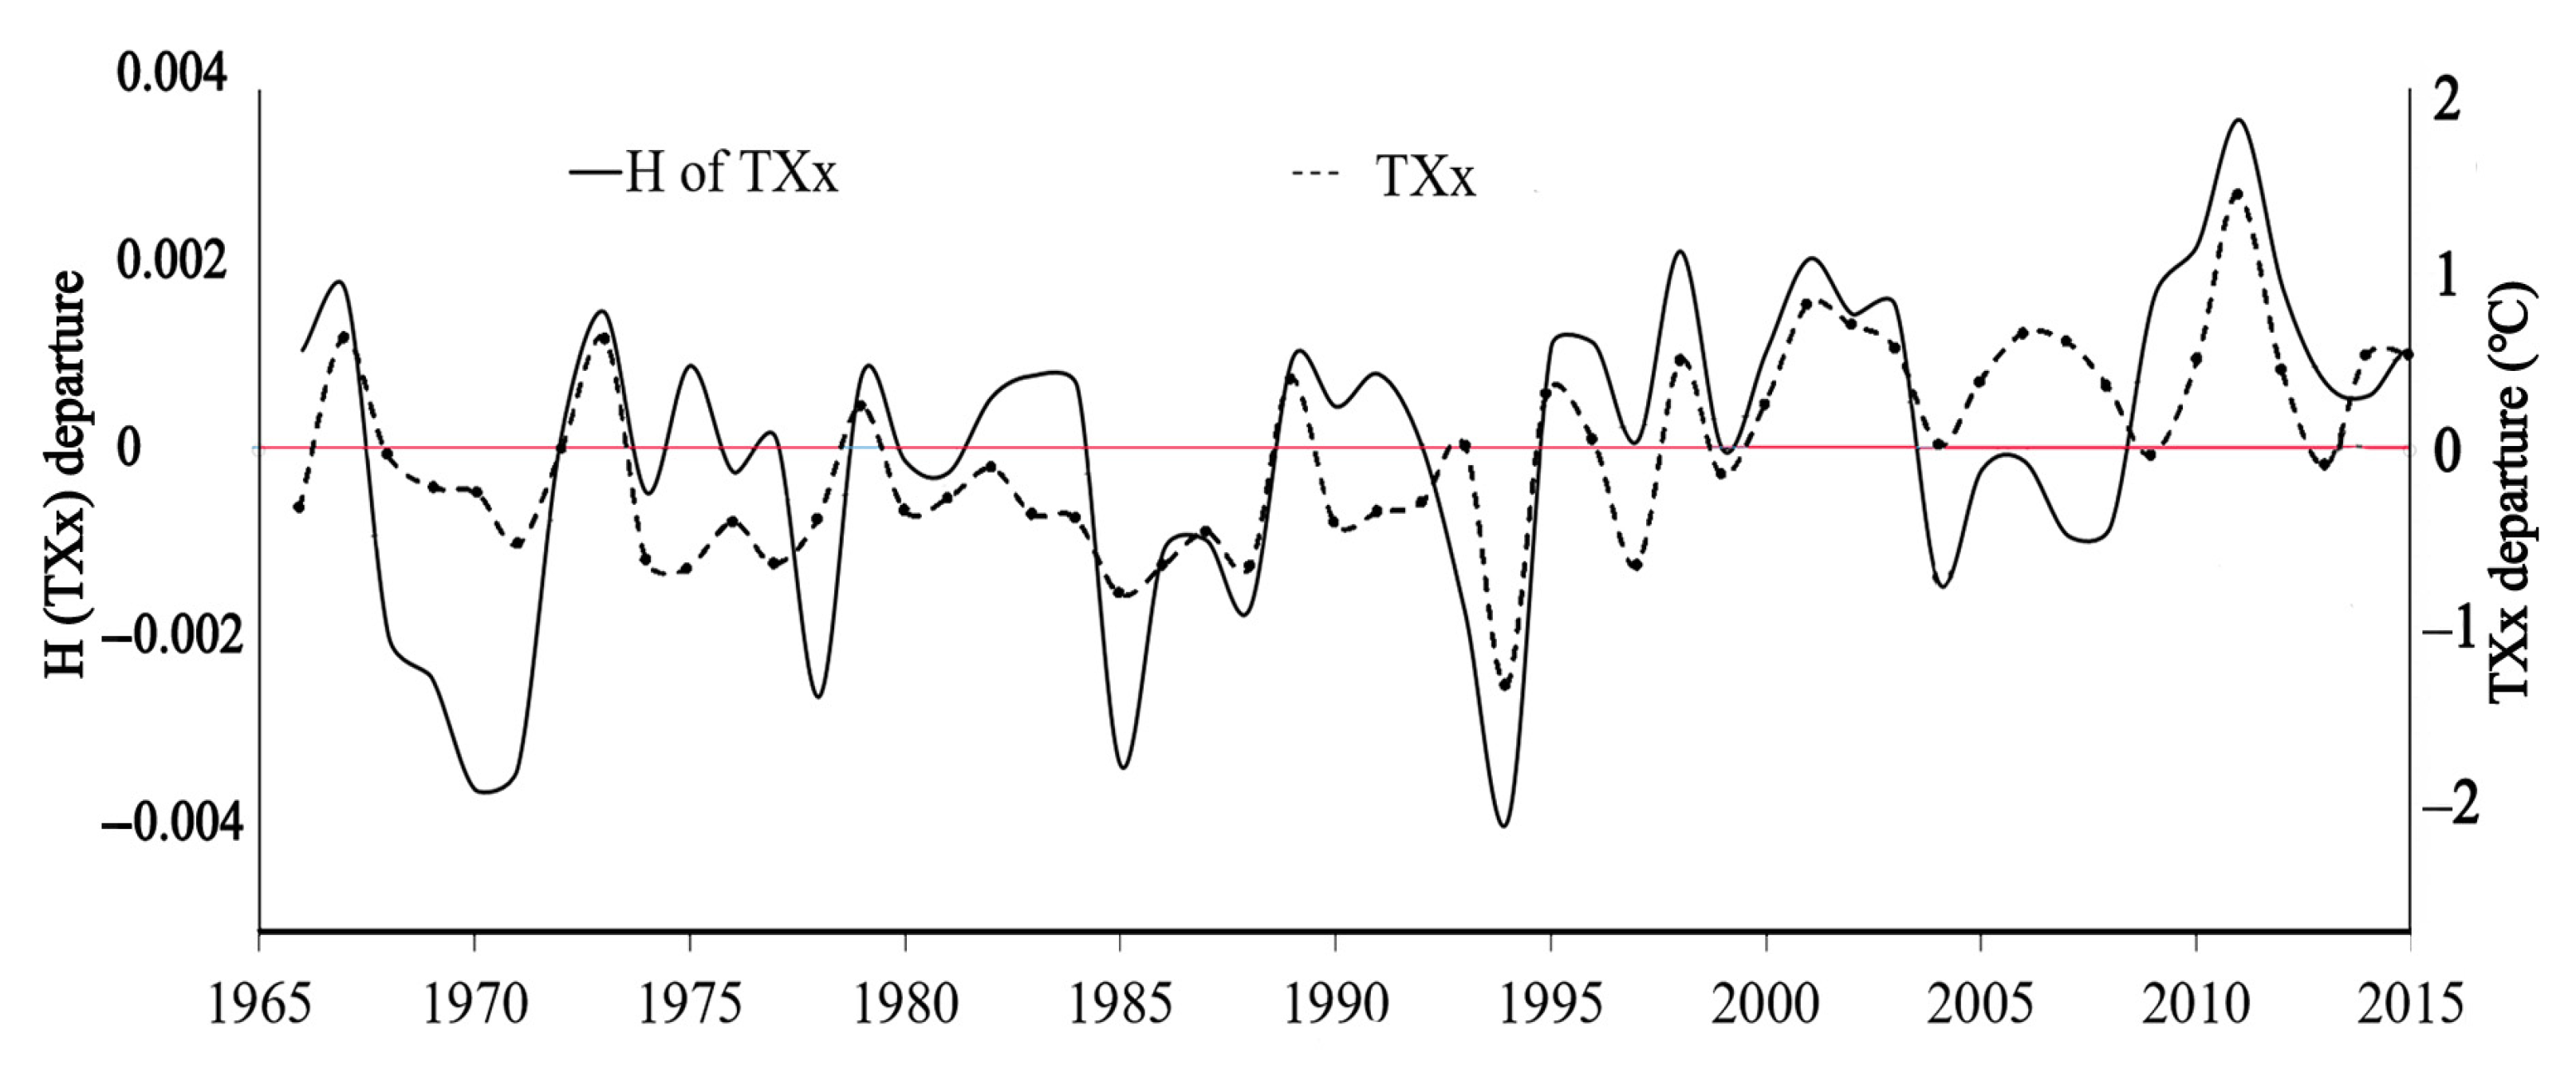
3.2. Instability of the Extreme Temperature Intensity

Figure 9 shows that the H values of TXx and TNn in China display an increasing trend from 1966 to 2015. The increase of H(TXx) was much earlier than the increase of H(TNn). The instability of TXx increased significantly after 1996, and the instability of TNn increased significantly after 2005. We also obtained that the instability strength of TXx was stronger than that of TNn, with multi-year averages of H for TXx, and TNn of 0.946 and 0.905, respectively.
Spatially, regions with relatively instable TXx include Inner Mongolia, Henan, Anhui, Hubei, Chongqing, Hunan, Jiangxi, and Fujian. In general, the instability of TXx was stronger in the middle and lower reaches of the Yangtze River than in other regions of China. TNn shows stronger instability in the Yangtze River headwaters region, the Yellow River and Lancang River regions, and parts of Tibet (Figure 10).

3.3. Instability of Extreme Temperature Occurrence
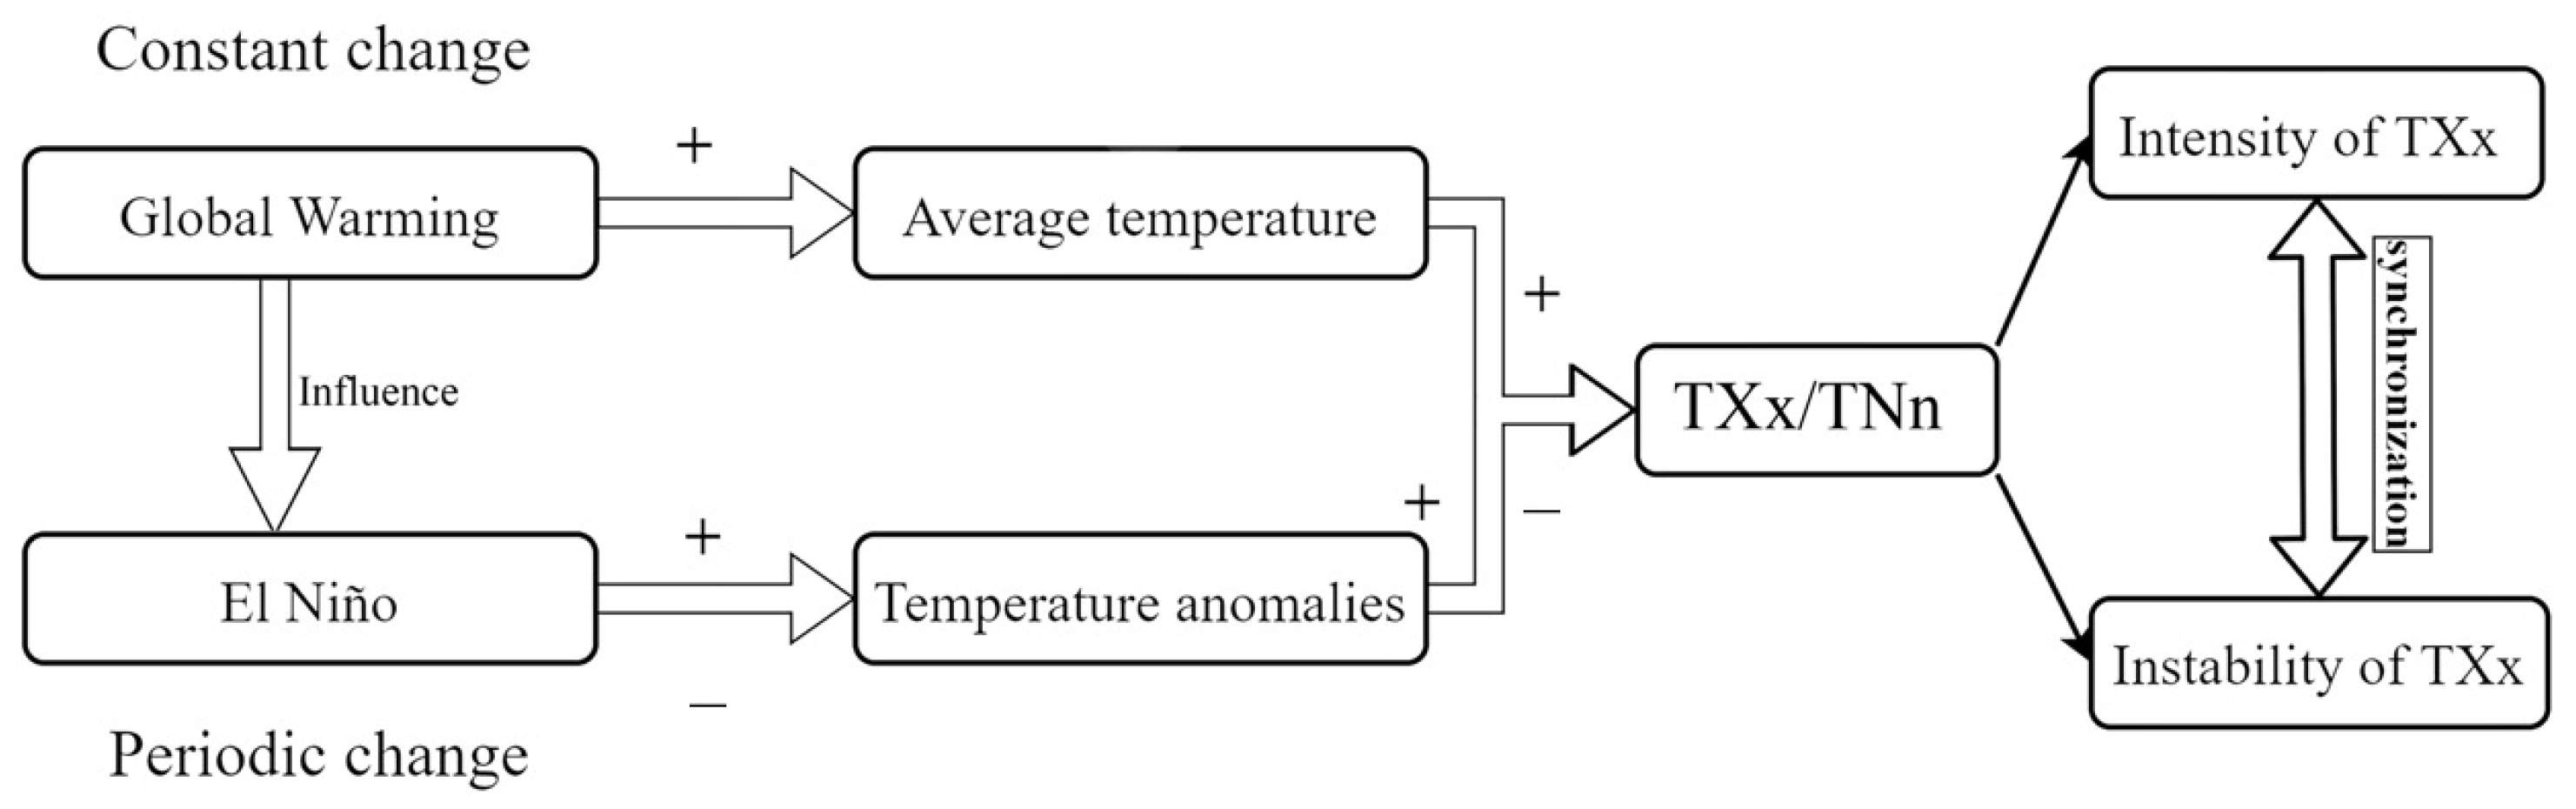
Figure 11 shows the temporal variation of H (CTXx and CTNn), with opposite trends for CTXx and CTNn, with a decreasing trend for CTXx and an increasing trend for CTNn from 1966–2015. We also obtained a higher instability intensity for CTXx than CTNn, with multi-year average H values of 0.954 and 0.933 for TXx and TNn, respectively.
Figure 12 shows the results of CTXx relatively instable regions include Chongqing, Guizhou, Jiangxi, Fujian, Guangdong, Guangxi, and Jilin provinces. These provinces were mainly located south of 30° N and between 105° and 120° E. The regions with high H values of CTNn were the Jilin-Liaoning border area, the surrounding area of Beijing, the southern Tianshan region of Xinjiang, the Shaanxi-Sichuan border area, Guangdong and Fujian provinces, which show a fragmented spatial distribution.

4. Discussion

4.1. Effect of Temperature Change on Extreme Temperature Instability

Managing the Risks of Extreme Events and Disasters to Advance Climate Change Adaptation, published by the IPCC, shows that a changing climate can lead to an increase in the frequency, intensity, duration, and spatial extent of extreme weather [2]. How does extreme temperature instability, a key property of extreme temperatures, respond to changes in annual average temperature? To clarify this interconnection, we calculated the correlation coefficient between the extreme climate instability index and annual average temperature. The results (Table 2) show that the average annual average temperature has a high positive correlation with both H(TXx) and H(TNn), while the most significant positive correlation exists between TXx and H(TXx) (Table 2, Figure 13).
To elucidate the relationship between climate change and extreme climate change, scientists discuss typical values of climate variables and the relative frequency of these values. The statistical characteristics of weather and climate events can be influenced by climate change. For example, as temperature changes move in a warmer direction, they cause changes in the location, magnitude, and shape of the distribution of climate variable values [39,40] (Figure 14). At the same time, the dispersion of the distribution of TXx and TNn values becomes larger. Thus, the spatial and temporal variability of TXx and TNn will increase with a warmer climate. The instability of TXx will become more pronounced. This finding is consistent with the result of a significant positive correlation between mean temperature and H(TXx)/H(TNn) in this study. Combined with the findings of [3.1(3)], we can also conclude that changes in the intensity of extreme temperatures and changes in the instability of extreme temperatures are consistent in time and intensity and are both influenced by an increase in mean temperature.

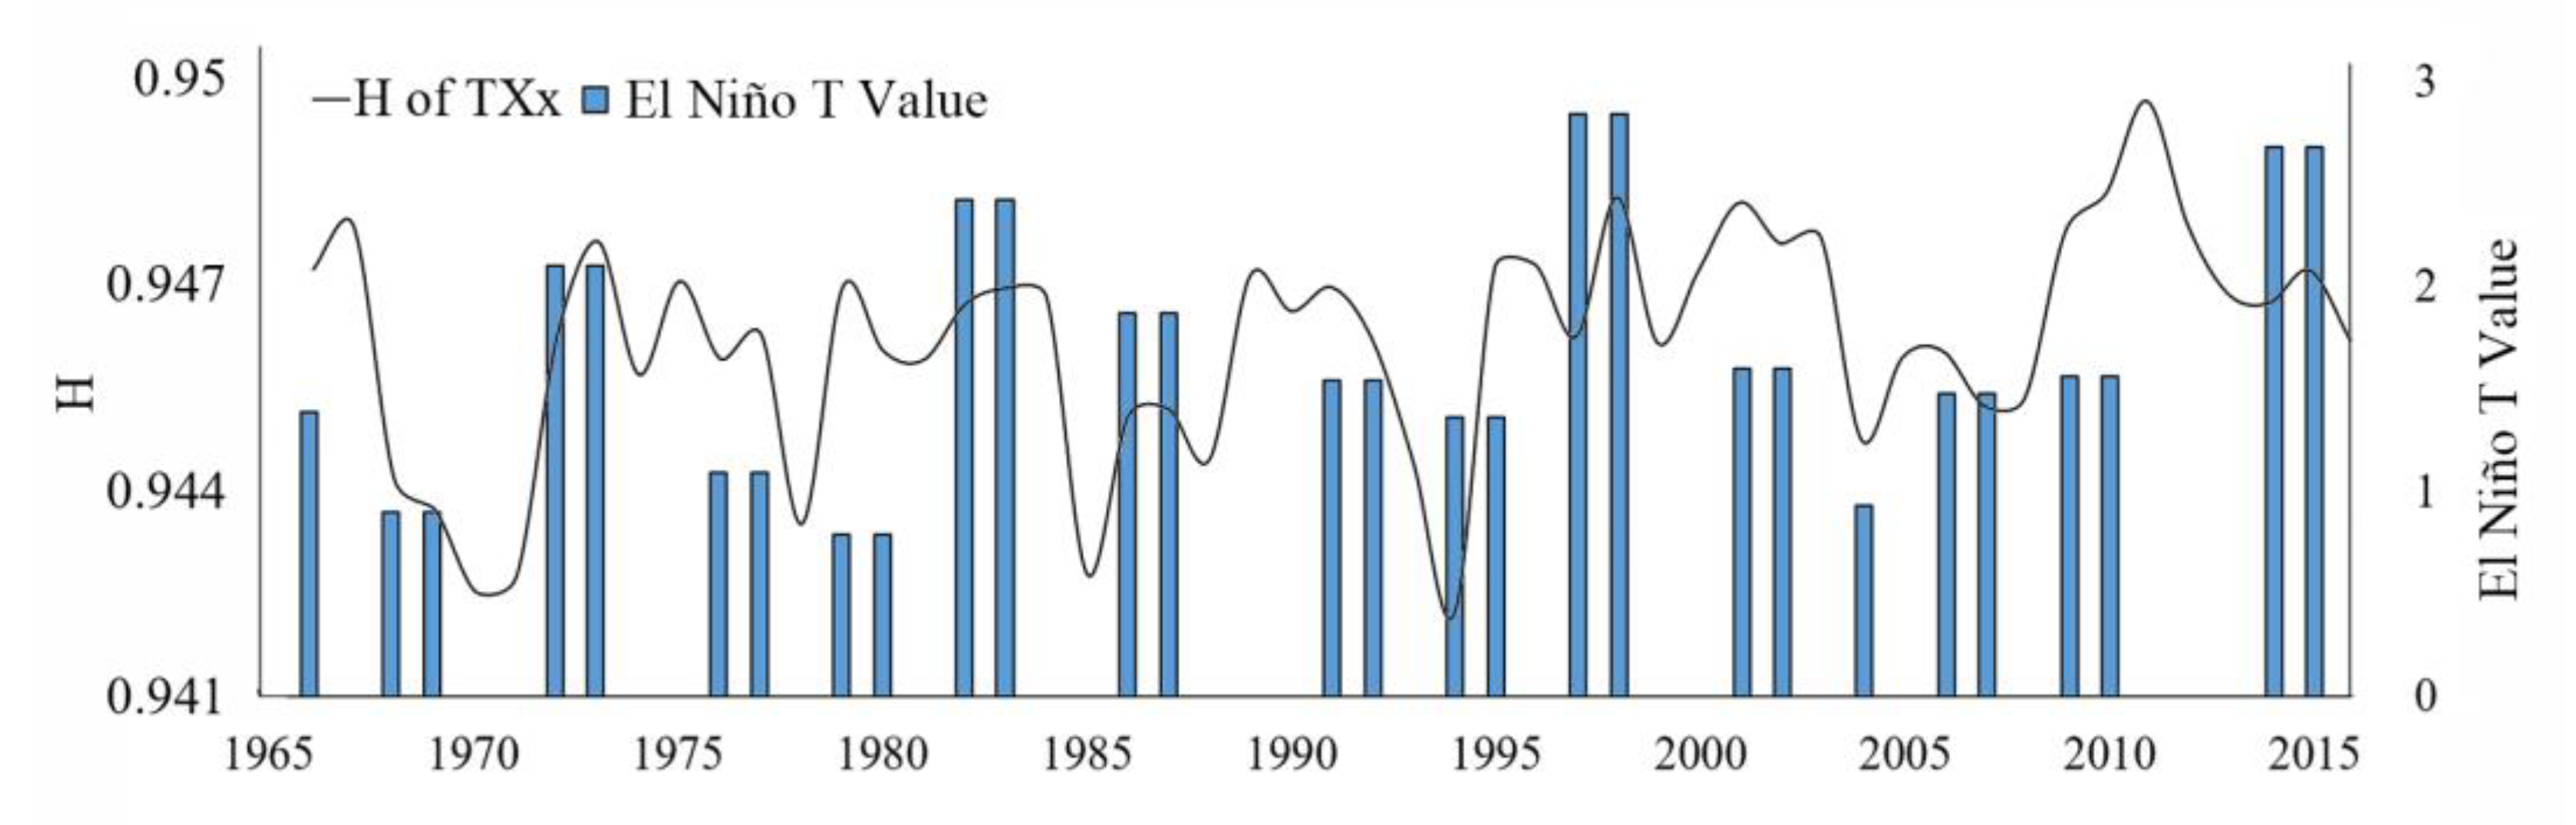
4.2. Effects of Atmospheric Circulation on Extreme Temperature Instabilities

Previous studies have identified important effects of atmospheric circulation on the occurrence of extreme climate events [41,42], and this section will discuss whether atmospheric circulation has an impact on the instability of extreme temperatures. Table 3 and Figure 15 shows a positive correlation between H(TXx) and El Niño T, while H(CTXx) is significantly correlated with PDO. Overall, the correlation between ENSO and H(TXx) is the most pronounced, with a correlation coefficient of 0.39.
El Niño is mainly a climatic phenomenon characterized by an abnormal increase in sea surface temperature in the eastern equatorial Pacific Ocean. El Niño is a natural cyclical phenomenon that has important effects on climate change in China, such as temperature and precipitation anomalies. Combined with the conclusion that temperature variations lead to more instability in temperature extremes [4.1], we can conclude that El Niño-induced temperature anomalies will likely be an important factor in TXx instability.
El Niño is a natural cyclical phenomenon that occurs approximately every seven years. Thus, the instability of extreme temperatures caused by El Niño is also a natural phenomenon. Current research shows that the global warming caused by greenhouse gas emissions will significantly increase the frequency of super El Niño events. Global warming not only directly affects extreme temperature instability but also reinforces the impact of El Niño on extreme temperature instability. From the above analysis of the factors influencing extreme climate instability, we obtain that the instability of extreme temperatures (especially TXx) is not the result of the influence of a single factor but the result of a combination of multiple factors. Figure 16 composes the process of multiple influencing factors on extreme temperatures.

5. Conclusions

Previous studies of extreme temperatures have had a single methodological approach, with more focus on the tendency characteristics of extreme temperature changes. We have studied both the trend variability of extreme temperatures and the instability of extreme temperatures. Based on the extreme temperature index calculation using data from 778 meteorological stations, we further investigated the spatial and temporal variation of the extreme climate index and the instability of the extreme temperature index in China from 1966 to 2015.
It can be concluded that there is a clear upward trend for TXx (annual maximum value of daily maximum temperature) and TNn (annual minimum value of daily minimum temperature), and a notable advancing trend for the interannual data of TXx’ occurrence (CTXx) and TNn’ occurrence (CTNn); the results of instability studies show that the H values of TXx and TNn in China show an upward trend, and the H values of CTXx and CTNn show an opposite trend, with CTXx decreasing and CTNn increasing. In China, the relative instability regions of TXx are located in the middle and lower reaches of the Yangtze River basin, while the relative instability region of TNn is concentrated in the source areas of the Yangtze, Yellow, and Langtang rivers and parts of Tibet. The relative instability region of CTXx instability is distributed between 105° E and 120° E south of the 30° N latitude line, while the distribution of CTNn instability is more dispersed; the instability of TXx is higher than TNn and CTXx instability is higher than CTNn. In addition, we conclude that TXx instability is most likely to be influenced by El Niño and mean annual average temperature variations.

Supplementary Materials

The following are available online at https://www.mdpi.com/article/10.3390/atmos13010019/s1, Table S1: Geographical locations of gauging stations used in the present study.

Author Contributions

Conceptualization and methodology: J.Y. and H.C.; data resources and curation: Q.H. and H.C.; analysis: H.C., C.T. and Q.H.; visualization: H.C., F.T. and J.Q.; writing—original draft preparation: H.C.; writing—review and editing: J.Y., Y.W., Q.G., C.T. and Q.H.; funding acquisition: J.Y.; Supervision and Project administration: Y.D. All authors have read and agreed to the published version of the manuscript.

Funding

This research was supported by the National Key Research and Development Program of China (Grant No. 2016YFA0602404) and the Strategic Priority Research Program of the Chinese Academy of Sciences (Grant No. XDA23060704).

Institutional Review Board Statement

Not applicable.

Informed Consent Statement

Not applicable.

Data Availability Statement

Not applicable.

Conflicts of Interest

The authors declare no conflict of interest.

References

  1. IPCC; Masson-Delmotte, V.; Zhai, P.; Pirani, A.; Connors, S.L.; Péan, C.; Berger, S.; Caud, N.; Chen, Y.; Goldfarb, L.; et al. Climate Change 2021: The Physical Science Basis. Contribution of Working Group I to the Sixth Assessment Report of the Intergovernmental Panel on Climate Change; Cambridge University Press: Cambridge, UK, 2021; ISBN 9781119130536. [Google Scholar]
  2. Murray, V.; Ebi, K.L. IPCC Special Report on Managing the Risks of Extreme Events and Disasters to Advance Climate Change Adaptation (SREX). J. Epidemiol. Community Health 2012, 66, 759–760. [Google Scholar] [CrossRef] [PubMed]
  3. Piao, S.; Ciais, P.; Huang, Y.; Shen, Z.; Peng, S.; Li, J.; Zhou, L.; Liu, H.; Ma, Y.; Ding, Y.; et al. The impacts of climate change on water resources and agriculture in China. Nature 2010, 467, 43–51. [Google Scholar] [CrossRef]
  4. Du, H.; Wu, Z.; Li, M. Interdecadal changes of vegetation transition zones and their responses to climate in Northeast China. Theor. Appl. Climatol. 2011, 106, 179–188. [Google Scholar] [CrossRef]
  5. Ge, Q.; Zhang, X.; Zheng, J. Simulated effects of vegetation increase/decrease on temperature changes from 1982 to 2000 across the Eastern China. Int. J. Climatol. 2014, 34, 187–196. [Google Scholar] [CrossRef]
  6. Hsiang, S.; Kopp, R.; Jina, A.; Rising, J.; Delgado, M.; Mohan, S.; Rasmussen, D.J.; Muir-Wood, R.; Wilson, P.; Oppenheimer, M.; et al. Estimating economic damage from climate change in the United States. Science 2017, 356, 1362–1369. [Google Scholar] [CrossRef] [PubMed] [Green Version]
  7. Yang, J.; Tan, C.; Zhang, T. Spatial and temporal variations in air temperature and precipitation in the Chinese Himalayas during the 1971-2007. Int. J. Climatol. 2013, 33, 2622–2632. [Google Scholar] [CrossRef]
  8. Du, Q.; Zhang, M.; Wang, S.; Che, C.; Ma, R.; Ma, Z. Changes in air temperature over China in response to the recent global warming hiatus. J. Geogr. Sci. 2019, 29, 496–516. [Google Scholar] [CrossRef] [Green Version]
  9. Yin, J.; Gentine, P.; Zhou, S.; Sullivan, S.C.; Wang, R.; Zhang, Y.; Guo, S. Large increase in global storm runoff extremes driven by climate and anthropogenic changes. Nat. Commun. 2018, 9, 4389. [Google Scholar] [CrossRef] [PubMed] [Green Version]
  10. Rai, A.; Joshi, M.K.; Pandey, A.C. Variations in diurnal temperature range over India: Under global warming scenario. J. Geophys. Res. Atmos. 2012, 117. [Google Scholar] [CrossRef]
  11. Karl, T.R.; Kukla, G.; Razuvayev, V.N.; Changery, M.J.; Quayle, R.G.; Heim, R.R.; Easterling, D.R.; Fu, C. Bin Global warming: Evidence for asymmetric diurnal temperature change. Geophys. Res. Lett. 1991, 18, 2253–2256. [Google Scholar] [CrossRef]
  12. Mori, N.; Yasuda, T.; Mase, H.; Tom, T.; Oku, Y. Projection of Extreme Wave Climate Change under Global Warming. Hydrol. Res. Lett. 2010, 4, 15–19. [Google Scholar] [CrossRef] [Green Version]
  13. Sillmann, J.; Roeckner, E. Indices for extreme events in projections of anthropogenic climate change. Clim. Chang. 2008, 86, 83–104. [Google Scholar] [CrossRef] [Green Version]
  14. Yu, Z.; Li, X. Recent trends in daily temperature extremes over northeastern China (1960-2011). Quat. Int. 2015, 380, 35–48. [Google Scholar] [CrossRef]
  15. Thornthwaite, C.W. An Approach toward a Rational Classification of Climate. Geogr. Rev. 1948, 38, 55. [Google Scholar] [CrossRef]
  16. Wu, S.; Pan, T.; Liu, Y.; Deng, H.; Jiao, K.; Lu, Q.; Feng, A.; Yue, X.; Yin, Y.; Zhao, D.; et al. Comprehensive climate change risk regionalization of China. Dili Xuebao/Acta Geogr. Sin. 2017, 72, 3–17. [Google Scholar] [CrossRef]
  17. Wang, T.; Wang, Y.; Cui, Y.; Xue, A.O.; Hou, Y.; Shen, Y.; Wang, X. The climate regionalization variation and its possible climate causes in Liaoning province over 1961-1987 and 1988-2014. Geogr. Res. 2019, 38, 794–806. [Google Scholar]
  18. Rodionov, S.N. A sequential algorithm for testing climate regime shifts. Geophys. Res. Lett. 2004, 31, 111–142. [Google Scholar] [CrossRef] [Green Version]
  19. Chen, H.P. Projected change in extreme rainfall events in China by the end of the 21st century using CMIP5 models. Chin. Sci. Bull. 2013, 58, 1462–1472. [Google Scholar] [CrossRef] [Green Version]
  20. Sui, Y.; Lang, X.; Jiang, D. Time of emergence of climate signals over China under the RCP4.5 scenario. Clim. Chang. 2014, 125, 265–276. [Google Scholar] [CrossRef]
  21. Yao, Y.; Luo, Y.; Huang, J. Bin Evaluation and projection of temperature extremes over China based on CMIP5 model. Adv. Clim. Chang. Res. 2012, 3, 179–185. [Google Scholar] [CrossRef]
  22. Zhou, T.; Yu, R. Twentieth-century surface air temperature over China and the globe simulated by coupled climate models. J. Clim. 2006, 19, 5843–5858. [Google Scholar] [CrossRef]
  23. Ying, Z. Projections of 2.0 °C Warming over the Globe and China under RCP4.5. Atmos. Ocean. Sci. Lett. 2012, 5, 514–520. [Google Scholar] [CrossRef]
  24. Bond, G.; Broecker, W.; Johnsen, S.; McManus, J.; Labeyrie, L.; Jouzel, J.; Bonani, G. Correlations between climate records from North Atlantic sediments and Greenland ice. Nature 1993, 365, 143–147. [Google Scholar] [CrossRef]
  25. Tan, M.; Hou, J.; Cheng, H. Methodology of quantitatively reconstructing paleoclimate from annualy laminated stalagmites. Quat. Sci. 2002, 22, 209–219. [Google Scholar]
  26. Prokopenko, A. Paleoclimate Record from Lake Baikal: A Link between Marine and Terrestrial Plio-Pleistocene Stratigraphies. Available online: https://xueshu.baidu.com/usercenter/paper/show?paperid=5087e3250fde80d7ed18cb755afe59c8 (accessed on 12 March 2021).
  27. Mayewski, P.A.; Meeker, L.D.; Whitlow, S.; Twickler, M.S.; Morrison, M.C.; Bloomfield, P.; Bond, G.C.; Alley, R.B.; Gow, A.J.; Grootes, P.M.; et al. Changes in atmospheric circulation and ocean ice cover over the North Atlantic during the last 41,000 years. Science 1994, 263, 1747–1751. [Google Scholar] [CrossRef] [PubMed]
  28. Grimm, E.C.; Jacobson, G.L.; Watts, W.A.; Hansen, B.C.S.; Maasch, K.A. A 50,000-year record of climate oscillations from Florida and its temporal correlation with the Heinrich events. Science 1993, 261, 198–200. [Google Scholar] [CrossRef] [PubMed]
  29. Bond, G.; Heinrich, H.; Broecker, W.; Labeyrie, L.; McManus, J.; Andrews, J.; Huon, S.; Jantschik, R.; Clasen, S.; Simet, C.; et al. Evidence for massive discharges of icebergs into the North Atlantic ocean during the last glacial period. Nature 1992, 360, 245–249. [Google Scholar] [CrossRef]
  30. Li, C.; Wang, J.; Hu, R.; Yin, S.; Bao, Y.; Ayal, D.Y. Relationship between vegetation change and extreme climate indices on the Inner Mongolia Plateau, China, from 1982 to 2013. Ecol. Indic. 2018, 89, 101–109. [Google Scholar] [CrossRef]
  31. Yang, J.; Wu, J.; Li, M.; Wang, B. Extreme Temperature Events and Mortality/Morbidity in China. In Ambient Temperature and Health in China; Lin, H., Ma, W., Liu, Q., Eds.; Springer: Singapore, 2019. [Google Scholar] [CrossRef]
  32. Gong, H.; Wang, Z.; Zhao, C.; Feng, L. A new index for El Niño. Mar. Forecast. 2017, 19–27. [Google Scholar]
  33. Delgado, A.; Romero, I. Environmental conflict analysis using an integrated grey clustering and entropy-weight method: A case study of a mining project in Peru. Environ. Model. Softw. 2016, 77, 108–121. [Google Scholar] [CrossRef]
  34. Qin, D. The Second National Assessment Report on Climate Change; The Science Publishing Company: Beijing, China, 2011. [Google Scholar]
  35. Knight, P.J.; Kennedy, J.J.; Folland, C.; Harris, G.; Jones, G.S.; Palmer, M.; Parker, D.; Scaife, A.; Stott, P. Do Global Temperature Trends Over the Last Decade Falsify Climate. Bull. Am. Meteorol. Soc. 2009, 3, 22–23. [Google Scholar]
  36. Liu, B.; Zhou, T. Atmospheric footprint of the recent warming slowdown. Sci. Rep. 2017, 7, 40947. [Google Scholar] [CrossRef] [Green Version]
  37. Kerr, R.A. What happened to global warming? Scientists say just wait a bit. Science 2009, 326, 28–29. [Google Scholar] [CrossRef] [Green Version]
  38. Stocker, T.F.; Qin, D.; Plattner, G.K.; Tignor, M.M.B.; Allen, S.K.; Boschung, J.; Nauels, A.; Xia, Y.; Bex, V.; Midgley, P.M. Climate Change 2013 the Physical Science Basis: Working Group I Contribution to the Fifth Assessment Report of the Intergovernmental Panel on Climate Change; Cambridge University Press: Cambridge, UK, 2013; Volume 9781107057, ISBN 9781107415324. [Google Scholar] [CrossRef]
  39. McGregor, G.R.; Ferro, C.A.T.; Stephenson, D.B. Projected changes in extreme weather and climate events in Europe. Extrem. Weather Events Public Heal. Responses 2005, 13–23. [Google Scholar] [CrossRef]
  40. Ferro, C.A.T.; Hannachi, A.; Stephenson, D.B. Simple nonparametric techniques for exploring changing probability distributions of weather. J. Clim. 2005, 18, 4344–4354. [Google Scholar] [CrossRef] [Green Version]
  41. Li, L.; Li, C.Y.; Song, J. Arctic Oscillation anomaly in winter 2009/2010 and its impacts on weather and climate. Sci. China Earth Sci. 2012, 55, 567–579. [Google Scholar] [CrossRef]
  42. Renom, M.; Rusticucci, M.; Barreiro, M. Multidecadal changes in the relationship between extreme temperature events in Uruguay and the general atmospheric circulation. Clim. Dyn. 2011, 37, 2471–2480. [Google Scholar] [CrossRef] [Green Version]
Figure 1. Map of Chinese provincial-level administration regionalization.
Atmosphere 13 00019 g001
Figure 2. Distribution of weather stations over China.
Atmosphere 13 00019 g002
Figure 3. Technical process.
Atmosphere 13 00019 g003
Figure 4. Temporal variation of TXx and TNn in China from 1966 to 2015. (a) TXx. (b) TNn.
Atmosphere 13 00019 g004
Figure 5. Spatial distribution of changes in TXx and TNn, 1966–2015. (a) TXx. (b) TNn.
Atmosphere 13 00019 g005
Figure 6. Temporal changes in CTXx and CTNn in China, 1966–2015. (a) CTXx. (b) CTNn.
Atmosphere 13 00019 g006
Figure 7. Spatial distribution of CTXx and CTNn changes from 1966 to 2015. (a) CTXx. (b) CTNn.
Atmosphere 13 00019 g007
Figure 8. Temporal variation of annual average temperature, TXx and TNn dispersion for China from 1966 to 2015.
Atmosphere 13 00019 g008
Figure 9. Temporal changes in H values of TXx and TNn in China, 1966–2015. (a) TXx. (b) TNn.
Atmosphere 13 00019 g009
Figure 10. Spatial distribution of H values for TXx and TNn, 1966–2015. (a) TXx. (b) TNn.
Atmosphere 13 00019 g010
Figure 11. Temporal variation of H values for CTXx and CTNn in China, 1966–2015. (a) CTXx. (b) CTNn.
Atmosphere 13 00019 g011
Figure 12. Spatial distribution of H values for CTXx and CTNn from 1966 to 2015. (a) CTXx. (b) CTNn.
Atmosphere 13 00019 g012
Figure 13. Temporal changes in H(TXx) and TXx departures in China, 1966 to 2015.
Atmosphere 13 00019 g013
Figure 14. Theoretical changes in the distribution of climate variable values.
Atmosphere 13 00019 g014
Figure 15. Temporal variation of H(TXx) and El Niño T value in China, 1966–2015.
Atmosphere 13 00019 g015
Figure 16. Processes affecting TXx instability.
Atmosphere 13 00019 g016
Table 1. Extreme temperature indices selected and defined.
EncodingNameDefinitionUnit
1TNnAnnual minimum of daily minimum temperature°C
2TXxAnnual maximum of daily maximum temperature°C
3CTNnTNn interannual date of occurrenceDay (d)
4CTXxTXx interannual date of occurrenceDay (d)
Table 2. Correlation matrix of annual average temperature and H values (extreme climate instability index).
H(TXx)H(TNn)H(CTXx)H(CTNn)
average temperature0.34 *0.35 *−0.020.04
TXx0.64 **0.07−0.020.22
TNn0.250.270.220.04
* Correlation is significant at the 0.05 level. ** Correlation is significant at 0.01 the level.
Table 3. Correlation matrix of Atmospheric Circulation Index and H values.
NAOPNAAOPDOEl Niño T
H(TXx)−0.070.030.11−0.120.39 *
H(CTXx)0.060.090.000.32 *0.1
H(TNn)0.20 *0.040.10.190.33
H(CTNn)−0.130.03−0.13−0.12−0.00
* Correlation is significant at 0.05 level.
Publisher’s Note: MDPI stays neutral with regard to jurisdictional claims in published maps and institutional affiliations.

