Article

A Contrast of Recent Changing Tendencies in Genesis Productivity of Tropical Cloud Clusters over the Western North Pacific in May and October

1
Laboratory for Coastal Ocean Variation and Disaster Prediction, College of Ocean and Meteorology, Guangdong Ocean University, Zhanjiang 524088, China
2
Key Laboratory of Climate, Resources and Environment in Continental Shelf Sea and Deep Sea of Department of Education of Guangdong Province, Guangdong Ocean University, Zhanjiang 524088, China
*
Author to whom correspondence should be addressed.
Atmosphere 2021, 12(9), 1177; https://doi.org/10.3390/atmos12091177
Submission received: 3 August 2021 / Revised: 9 September 2021 / Accepted: 9 September 2021 / Published: 13 September 2021

Abstract

:
Tropical cloud clusters (TCCs) are embryos of tropical cyclones (TCs) and may have the potential to develop into TCs. The genesis productivity (GP) of TCCs is used to quantify the proportion of TCCs that can evolve into TCs. Recent studies have revealed a decrease in GP of western North Pacific (WNP) TCCs during the extended boreal summer (July–October) since 1998. Here, we show that the changing tendencies in GP of WNP TCCs have obvious seasonality. Although most months could see recent decreases in GP of WNP TCCs, with October experiencing the strongest decreasing trend, May is the only month with a significant recent increasing trend. The opposite changing tendencies in May and October could be attributed to different changes in low-level atmospheric circulation anomalies triggered by different sea surface temperature (SST) configurations across the tropical oceans. In May, stronger SST warming in the tropical western Pacific could prompt increased anomalous westerlies associated with anomalous cyclonic circulation, accompanied by the weakening of the WNP subtropical high and the strengthening of the WNP monsoon. Such changes in background atmospheric circulations could favor the enhancement of atmospheric eddy kinetic energy and barotropic energy conversions, resulting in a recent intensified GP of WNP TCCs in May. In October, stronger SST warming in the tropical Atlantic and Indian Oceans contributed to anomalous easterlies over the tropical WNP associated with anomalous anticyclonic circulation, giving rise to the suppressed atmospheric eddy kinetic energy and recent weakened GP of WNP TCCs. These results highlight the seasonality in recent changing tendencies in the GP of WNP TCCs and associated large-scale atmospheric-oceanic conditions.

1. Introduction

Tropical cloud clusters (TCCs), which are defined as synoptic-scale areas of deep convection and associated cirrus outflow [1,2,3], are considered to be embryos for tropical cyclones (TCs) and may have the potential to develop into TCs. TCCs are formed over the tropical ocean with a diameter of 250–2500 km, lasting at least 6–24 h [1]. TCCs are important components of the tropical system and play an important role in the energy balance of the tropics. TCCs could transport significant amounts of energy from the ocean and lower troposphere to the upper troposphere by releasing large amounts of latent heat in the upper troposphere, thus being able to generate thermal and dynamic changes locally and regionally [2,3].
About 1600 TCCs per year are observed globally, among which only about 6.4% evolve into TCs under favorable environmental conditions for TC genesis [3]. It is of great scientificity and practicality to study TCCs and TCs, considering that developed TCCs and TCs could impose great impacts on society. If the background environmental fields are favorable, a TCC in a favorable background environment may be able to develop into a TC. However, if the background environmental fields are not favorable, a TCC may not be able to develop into a TC. The proportion of TCCs that can evolve into TCs could be quantified by using the genesis productivity (GP) (the ratio of TC numbers to TCC numbers) [3,4]. It is of great significance to reveal the difference between developing and non-developing TCCs for understanding the formation mechanism of TCs and the tropical cyclogenesis prediction [5,6,7,8,9,10].
Compared with the climatology of TCs, the climatology of TCCs and GP has received relatively less attention due to the lack of long-term observational data for TCCs. The global TCC dataset, with a 28-year period (1982–2009), provides an opportunity to study the climatology of TCCs [3,4,11], which are historically not well studied. Hennon et al. [3] first noticed that the annual mean GP of TCCs over the western North Pacific (WNP) dropped sharply since the late 1990s. Zhao et al. [4] further investigated the large-scale atmospheric-oceanic conditions to cause the recent decrease in GP of WNP TCCs during the extended boreal summer (July–October), coinciding with the late 1990s climate shift.
The changing tendency of the WNP TC genesis number in May is in sharp contrast to the situation in other months (e.g., the peak or late TC seasons) [12,13]. The overall WNP TC genesis frequency has been decreased greatly for annual TC counts or TC activity during the peak season after the late 1990s [14]. On the contrary, increased WNP TC genesis frequency could be observed in May after the late 1990s [12,13]. Other studies [15,16,17,18,19,20] also support that the interdecadal variations and recent changes in WNP TC activity are obviously seasonally dependent, suggesting possible different influential processes responsible for TC activity changes in different seasons.
The recent changes in GP of WNP TCCs in May have not been examined in detail, and no detailed investigation on the seasonality of changing tendencies in GP of WNP TCCs has been carried out in the previous studies. In this study, we will focus on the possible seasonality of recent changing tendencies in the GP of WNP TCCs. In particular, a comparison is made between May and October in terms of recent changing tendencies in the GP of WNP TCCs.
This paper is organized as follows. The data and methods used in this study are introduced in Section 2. Recent changing tendencies in GP of TCCs over the WNP are compared between May and October in Section 3, which also illustrates possible reasons for the observed opposite changing tendencies in GP of WNP TCCs in May and October. Conclusions and discussions are presented in Section 4.

2. Data and Methods

This study utilizes the 28-year (1982–2009) global TCC dataset [2,3], which was the same dataset used to examine recent changing tendencies in the GP of WNP TCCs during the extended boreal summer (July–October) in Zhao et al. [4]. TCCs were objectively identified by gridded satellite infrared (IR) data based on the characteristics of atmospheric convection, including size, shape, and persistence [2,3]. The expansive cirrus shield associated with TCCs has very cold cloud tops, which enables a TCC to be identified by the threshold of cloud-top brightness temperature, based on satellite observations. Further details on the global TCC tracking algorithm can be found in Hennon et al. [2,3]. The global TCC data set contains information regarding a TCC’s size, location, convective intensity, cloud top height, and development status. The TC data are from the International Best Tracks Archive for Climate Stewardship (IBTrACS) version v03r10 [21].
The sea surface temperature (SST) configurations across the tropical oceans are from the monthly extended reconstructed SST (ERSST) version 3b [22]. The atmospheric winds and geopotential heights are from the National Centers for Environmental Prediction (NCEP)–National Center for Atmospheric Research (NCAR) reanalysis [23].
Following Hennon et al. [3], the GP of TCCs was calculated as the ratio of TC numbers to TCC numbers to quantify the percentage of TCCs that evolve into TCs.
Following Wang et al. [24], the WNP subtropical high-intensity index is defined as the standardized 850-hPa geopotential height anomaly averaged over (15–25° N, 115–150° E). According to Liu and Chan [14], the WNP subtropical high area index is defined as the standardized anomalous number of grid points enclosed by the 5880-gpm line at 500 hPa within the region (0–40° N, 100–180° E). Following Wang and Fan [25], the WNP summer monsoon index is defined as the difference in 850-hPa zonal wind anomalies between (5–15° N, 100–130° E) and (20–30° N, 110–140° E). The Pacific Decadal Oscillation (PDO) index is derived as the leading principal component of North Pacific monthly SST variability poleward of 20° N [26,27], which is provided by the University of Washington’s Joint Institute for the Study of the Atmosphere and Ocean.
The low-level atmospheric barotropic energy conversion (BEC) is the important source of energy for the TCC development and TC genesis [28,29,30,31]. The BEC could provide energy for the embedded synoptic-scale disturbances from the mean kinetic energy of the background mean flow, supporting these growing disturbances and eddies to contribute to the TCC development and TC formation. Therefore, a larger positive BEC may lead to a higher GP of TCCs. The eddy kinetic energy (EKE), which is used to characterize the features of synoptic-scale disturbances, is calculated from perturbation winds:
EKE = 1 2 ( u 2 ¯ + v 2 ¯ ) ,
Following Zhan et al. [30], the BEC term (KmKe) can be expressed as:
KmKe = u 2 ¯ x u ¯ v 2 ¯ y v ¯ u v ¯ y u ¯ u v ¯ x v ¯ ,
where u and v are the zonal and meridional winds, with the overbar denoting a time average and the prime denoting a perturbation obtained by the 2–8-day bandpass-filtering. The four terms on the right-hand side of Equation (2) are terms due to the convergences of zonal wind (Ux)/meridional wind (Vy) and the shears of zonal wind (Uy)/meridional wind (Vx). The positive KmKe term indicates that the disturbances and eddies could obtain energy from the mean winds.
The significance of the linear trend for the GP of TCCs was determined by the Mann–Kendall test [32]. The student’s t-test was applied to test the statistical significance of the differences between two periods before and after the late 1990s.

3. Results

3.1. Opposite Changing Tendency for GP of WNP TCCs in May and October

Geographic distributions of TCC and TC formation locations in May and October over the WNP are shown in Figure 1. The mean TCC formation location was 10.4° N, 139.6° E in May and 9.7° N, 141.9° E in October. The mean TC genesis location was 11.2° N, 130.2° E in May and 13.4° N, 139.8° E in October, indicating that the mean TC genesis location in May is more southwest than that in October.
The annual mean (January–December) GP of WNP TCCs had a prominent downward trend (Figure 2), consistent with the results in Zhao et al. [4]. According to Figure 2, the changing trend in GP of the WNP TCCs exhibited obvious seasonality. Although most months could see recent decreases in GP of TCCs, May was the only month with a significant increase (Figure 2), with an increasing trend of 2.4% per decade (Figure 3a). October was the month with the largest decrease in GP of TCCs (Figure 2), with a downward trend of −7.5% per decade (Figure 3b).
The downward changing tendency in GP of WNP TCCs during the extended boreal summer was considered to be directly related to the late 1990s climate shift [4]. Many other studies also support the interdecadal variability around the late 1990s for WNP TC activities [12,13,14,33,34,35,36]. The regime shift detection analysis indicated that the point of regime shift occurred around 1998 for both the WNP GP time series in May and October. Therefore, the late 1990s climate shift could possibly contribute to the observed recent changing tendencies in GP of WNP TCCs in May and October. Similar to Zhao et al. [4], the WNP GP in May and October were further examined and compared in two sub-periods: P1 (1982–1997, before 1998) and P2 (1998–2009, since 1998), in order to reveal the possible influences of the late 1990s climate shift.
In May, a significant increasing trend was observed for the TC number, but the trend of the TCC number was not significant (Figure 3a). The increasing trend of the GP in May was mainly contributed to by the increasing trend of the TC number rather than the trend of the TCC number. In May, the mean GP, calculated by averaging the GP value of each year during the corresponding period, was 4.58% during P1 and boosted to be 7.60% during P2 (Figure 3a). For the mean TC number in May, it was 1.13 during P1 and increased to be 1.92 during P2. For the mean TCC number in May, it was 22.19 during P1 and 23.50 during P2. The differences in TCC numbers in May between P1 and P2 were not significant. Thus, the recent increase of GP in May was mainly due to the enhanced TC counts, with no significant changes in TCC numbers.
In October, a significant decreasing trend for the TC number, while an increasing trend for the TCC number could be observed (Figure 3b), both of which could contribute to the decreasing trend of the GP at the same time. In October, the mean GP, calculated by averaging the GP value of each year during the corresponding period, was 26.43% during P1 and dropped to be 11.21% during P2 (Figure 3b). TC (TCC) counts were observed to be decreased (increased) in October during P2, the conditions of which are different from those in May. For the mean TC number in October, it was 5.32 during P1 and decreased to be 3.25 during P2. For the mean TCC number in October, it was 21.56 during P1 and increased to be 31.17 during P2. The suppressed TC and enhanced TCC numbers may jointly lead to a significant recent decrease in the GP in October.

3.2. Possible Reasons for the Opposite Changing Tendency in May and October

Why are opposite changing tendencies in the GP of WNP TCCs observed in May and October? Different changes in the low-level atmospheric circulations and EKE, which are possibly triggered by different SST configurations across the tropical oceans, may explain these differently changing tendencies in the GP of WNP TCCs between May and October.

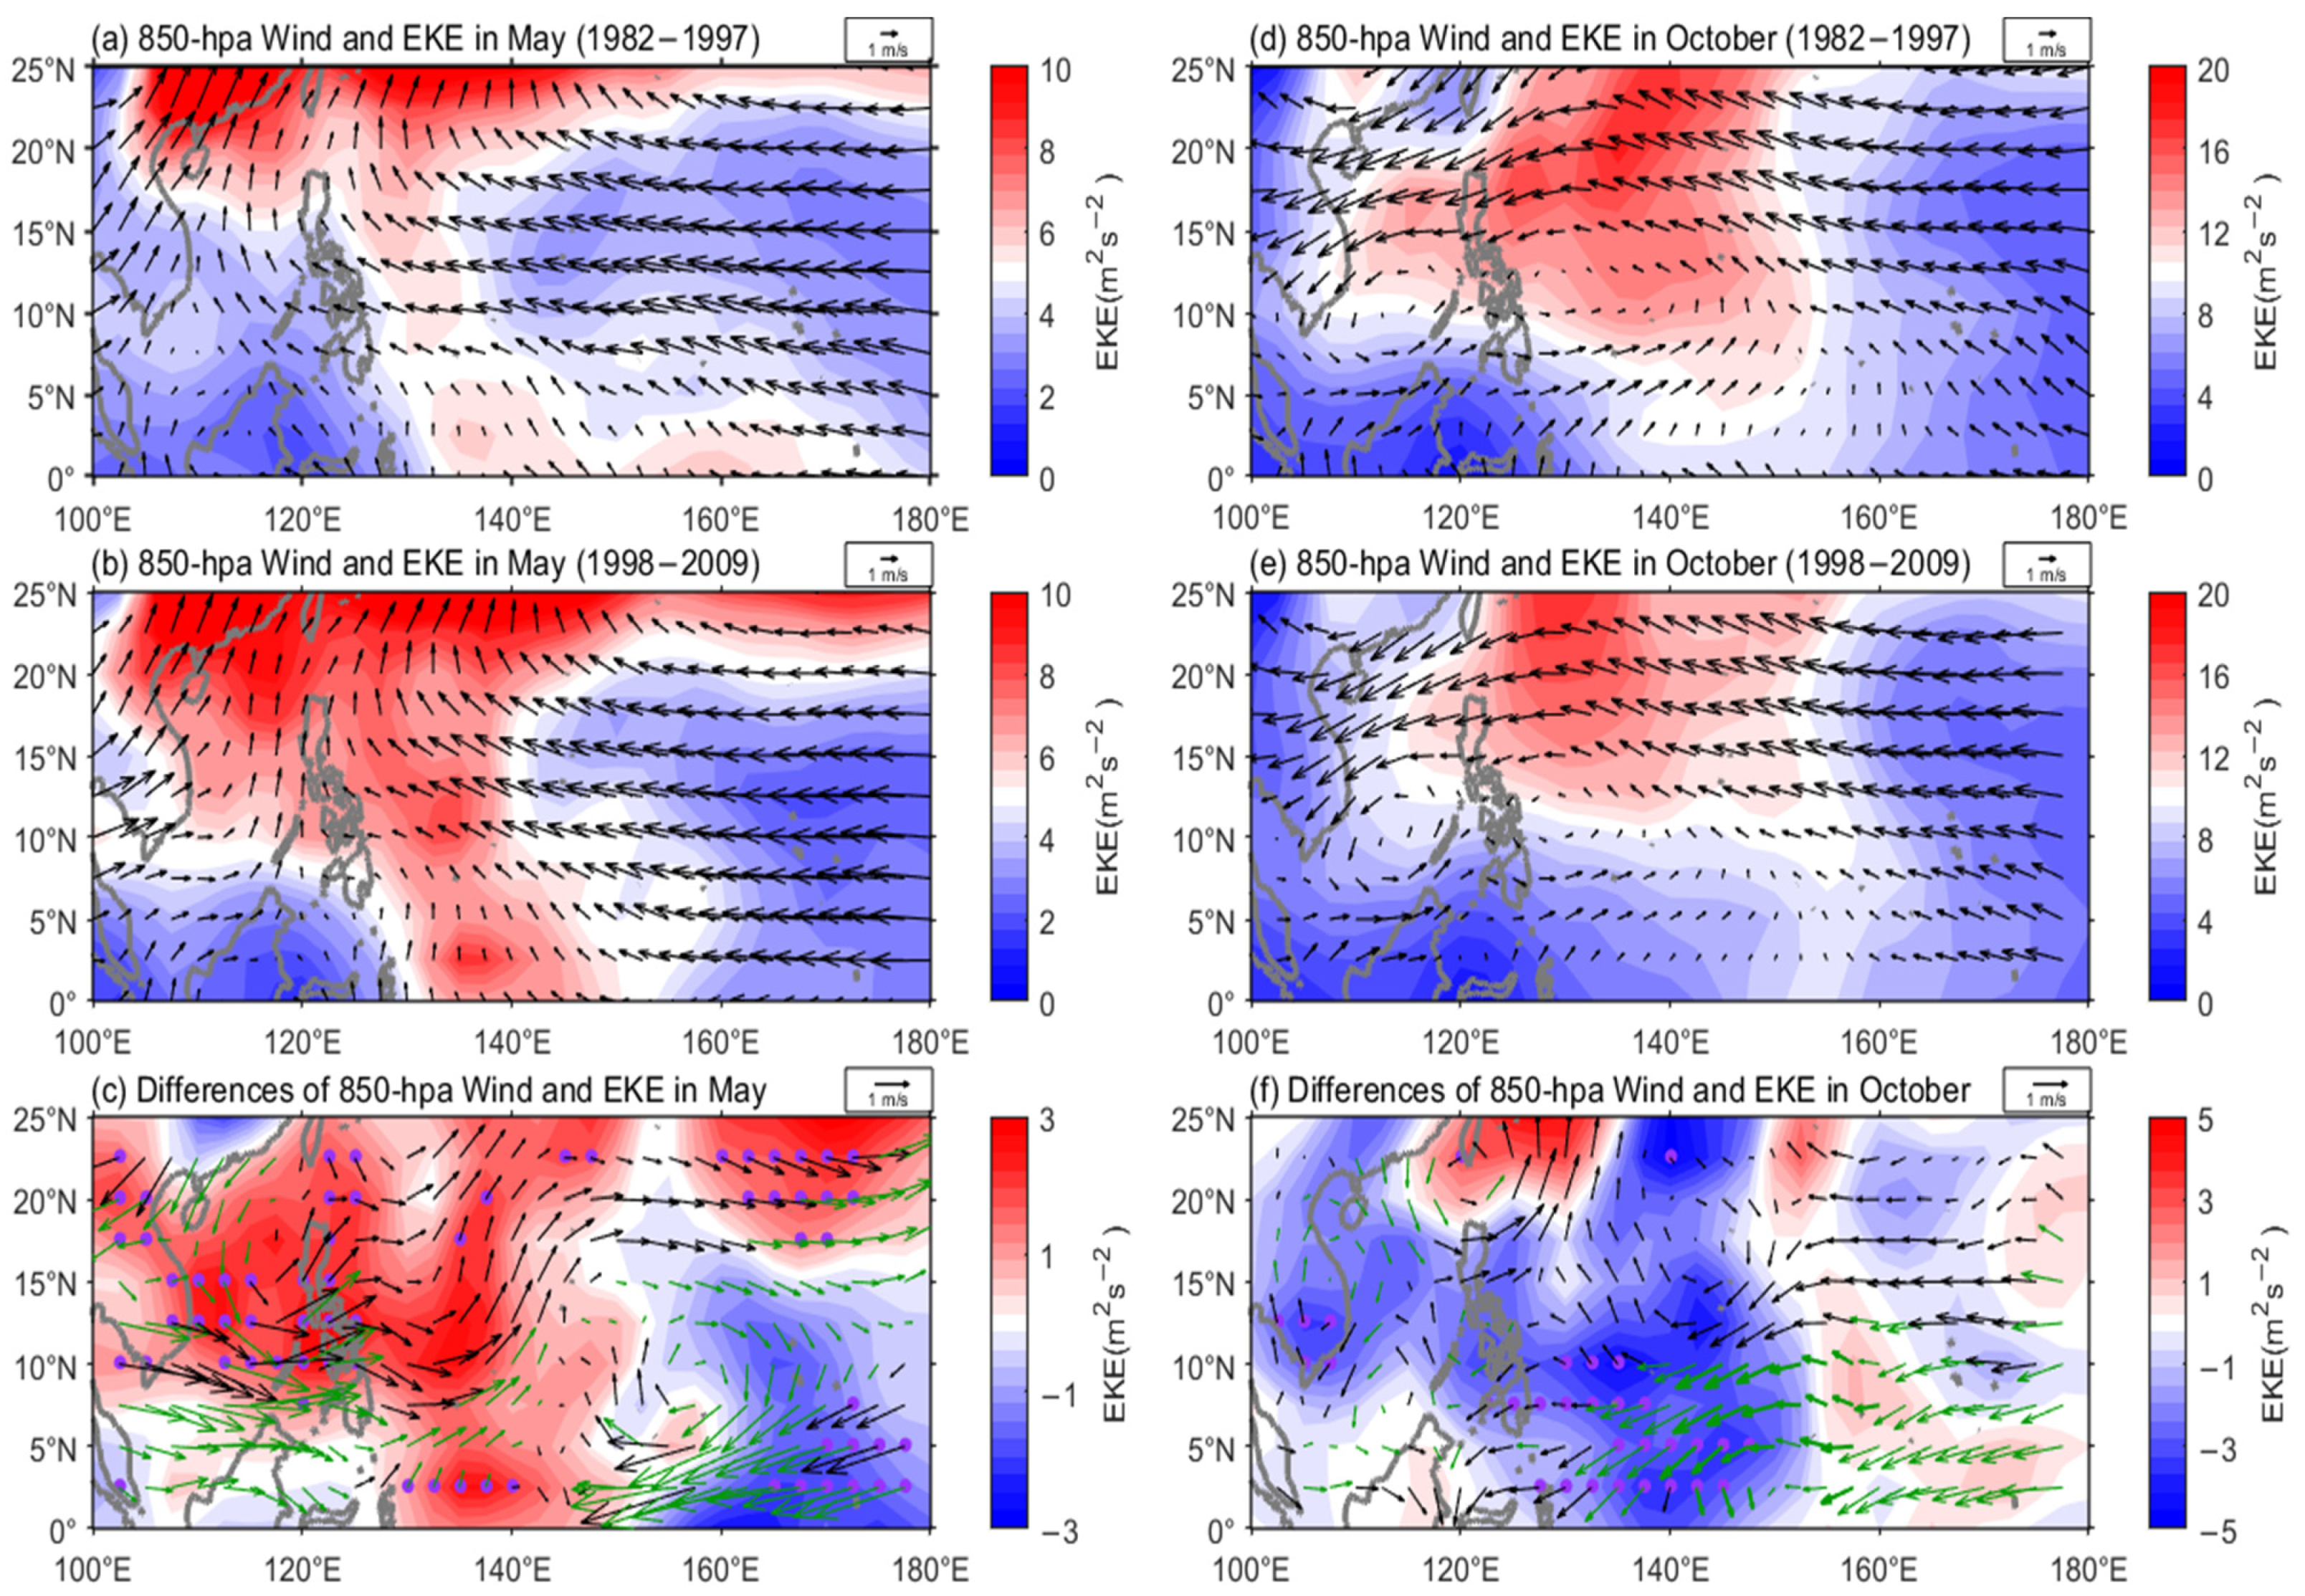
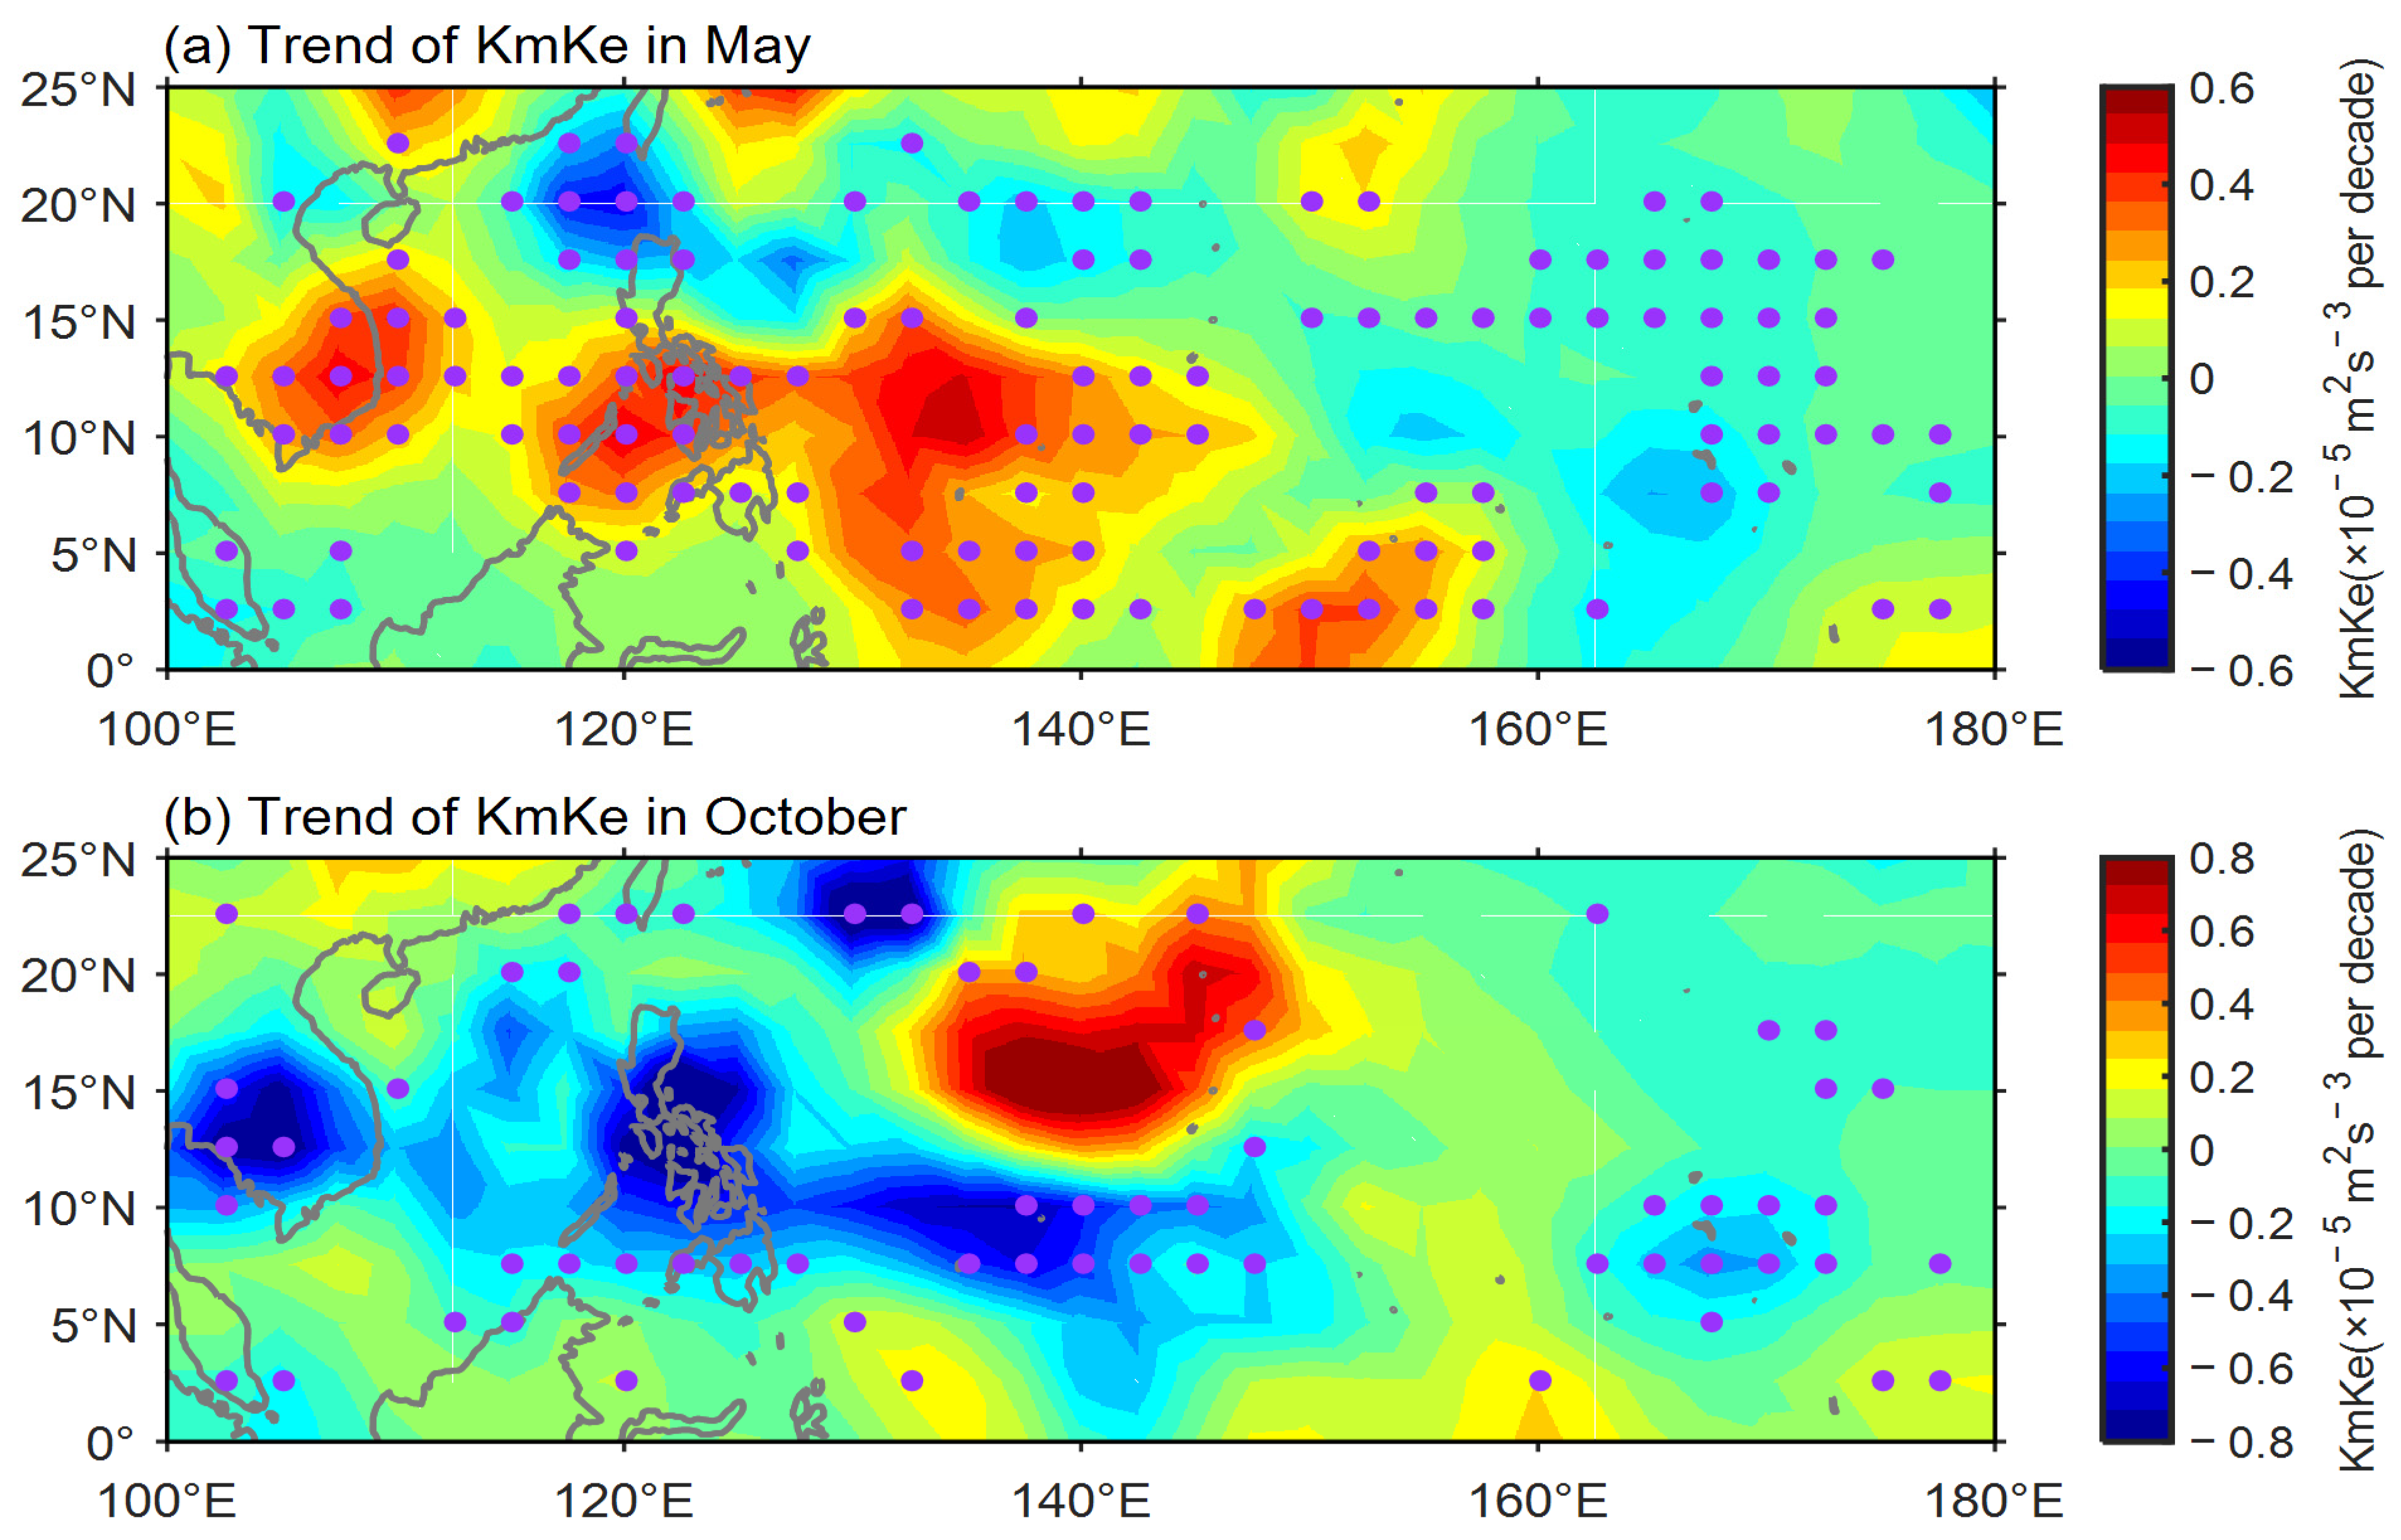
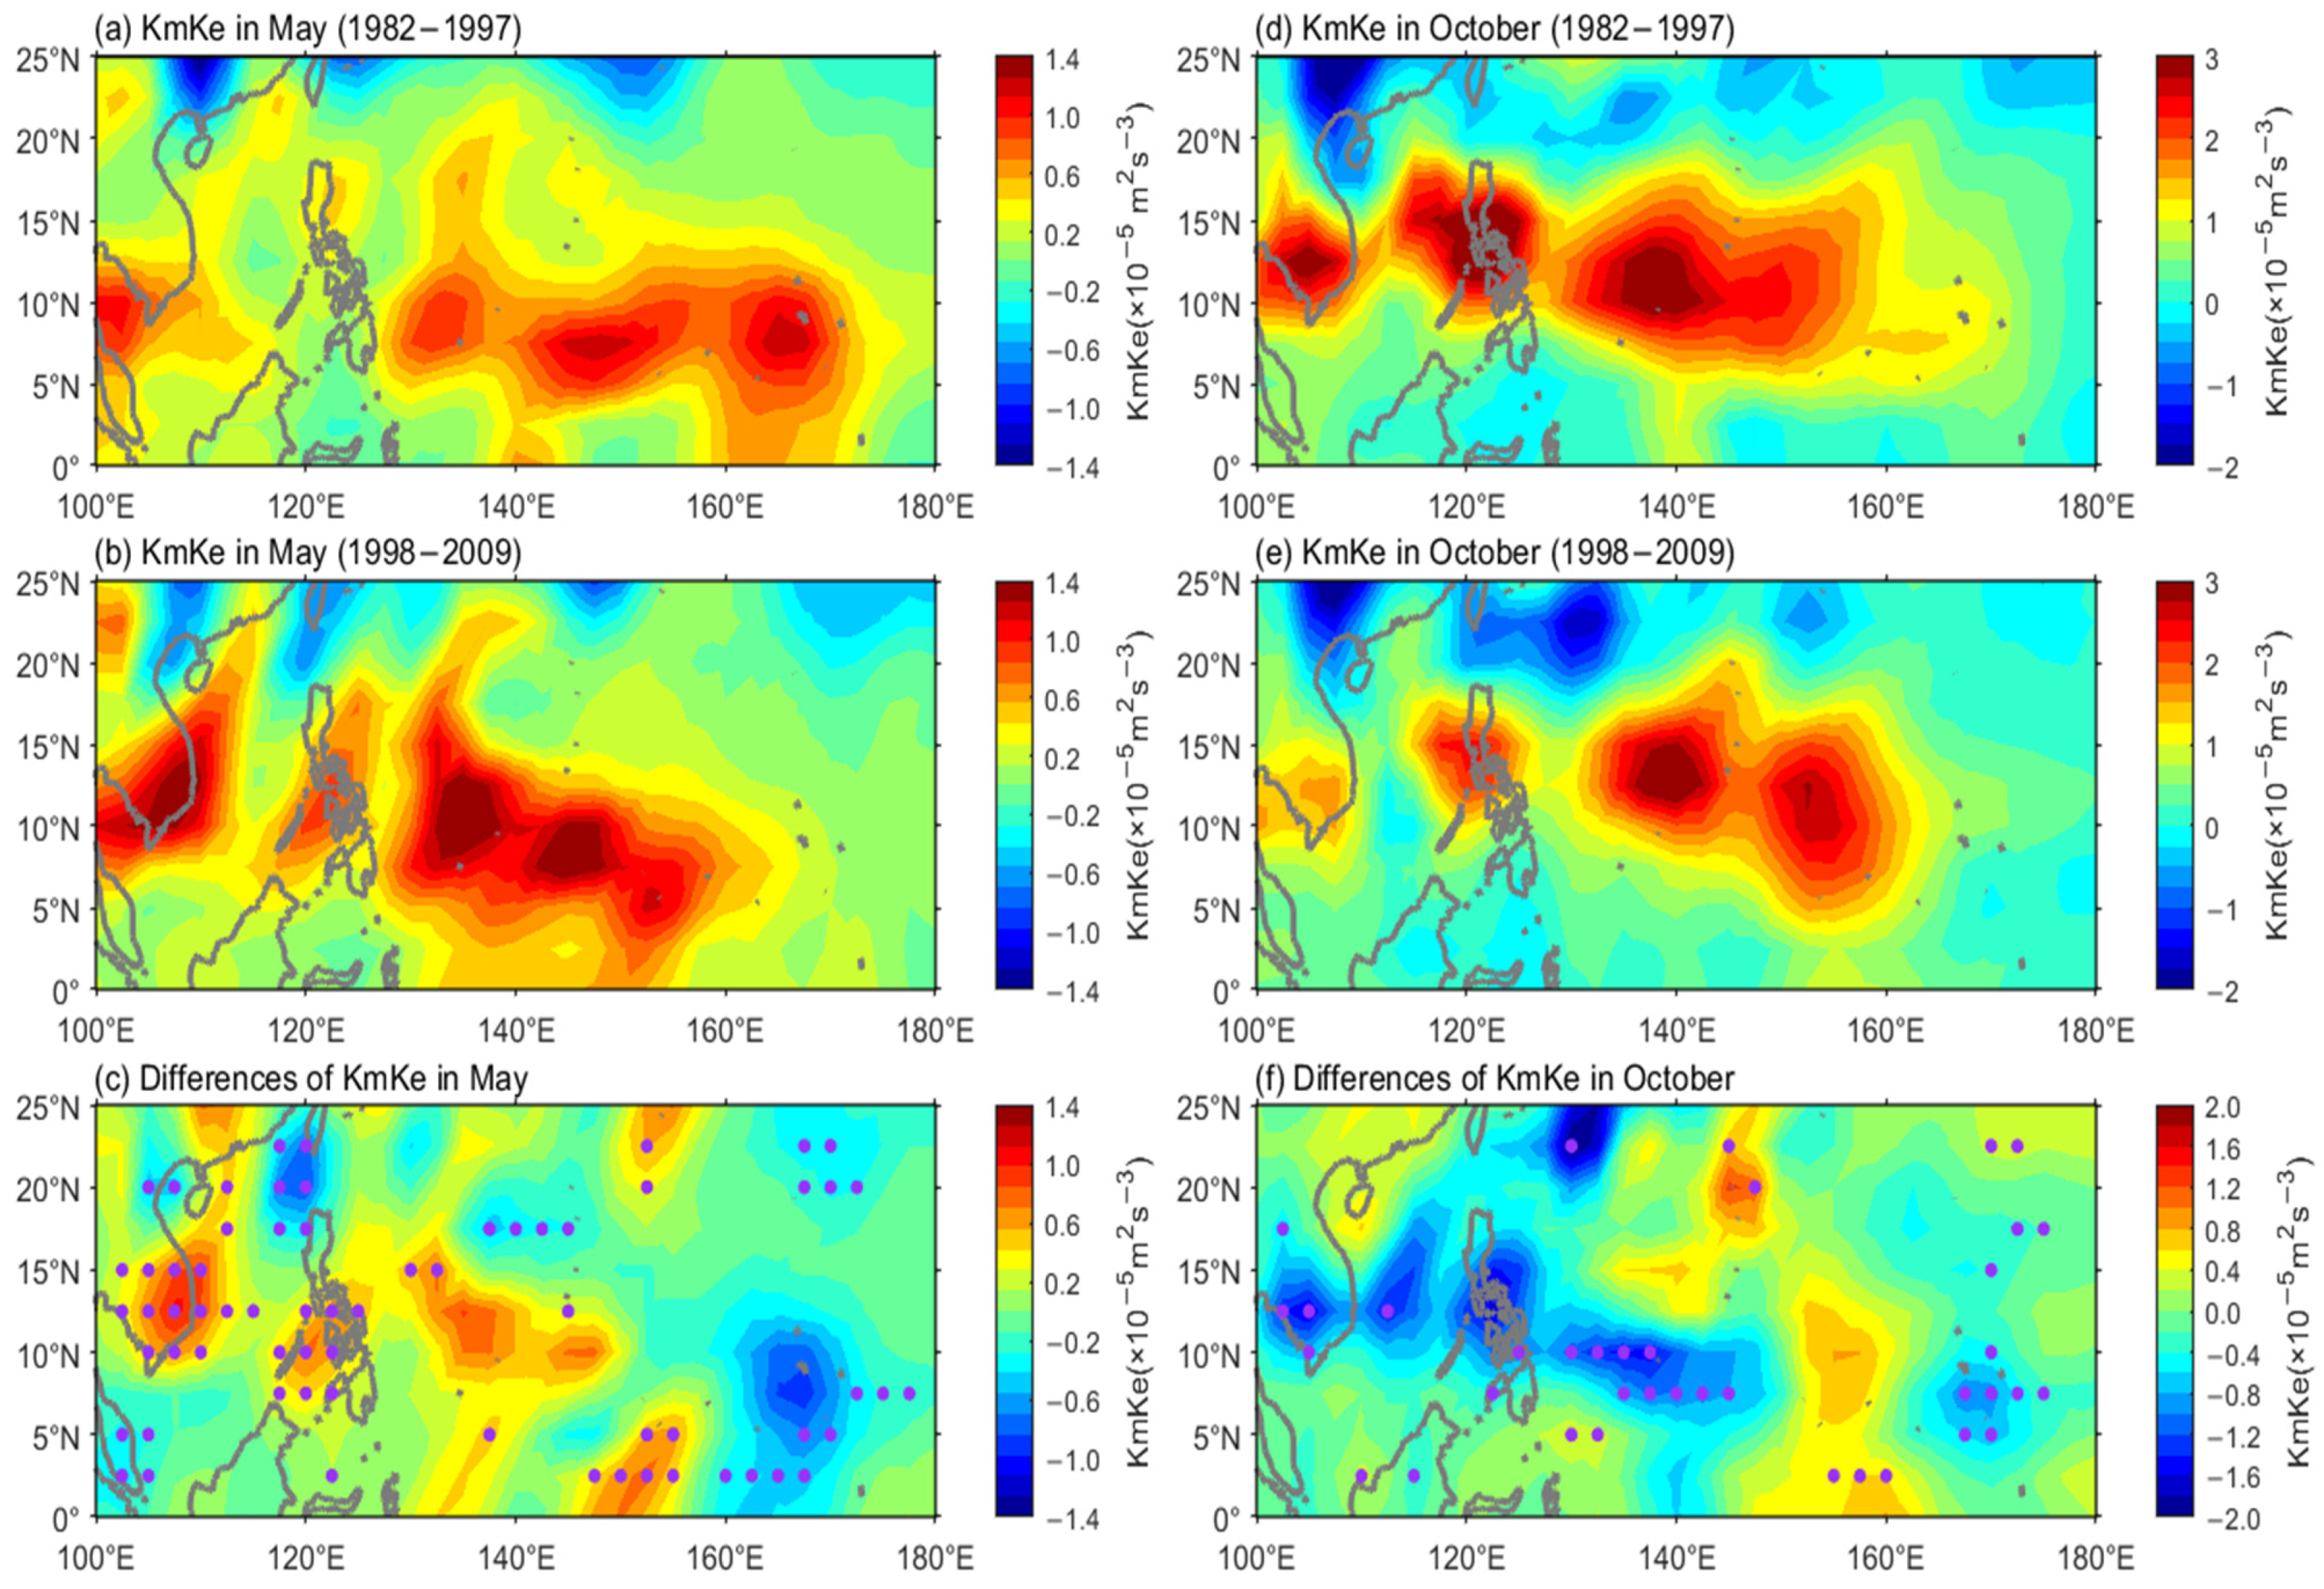
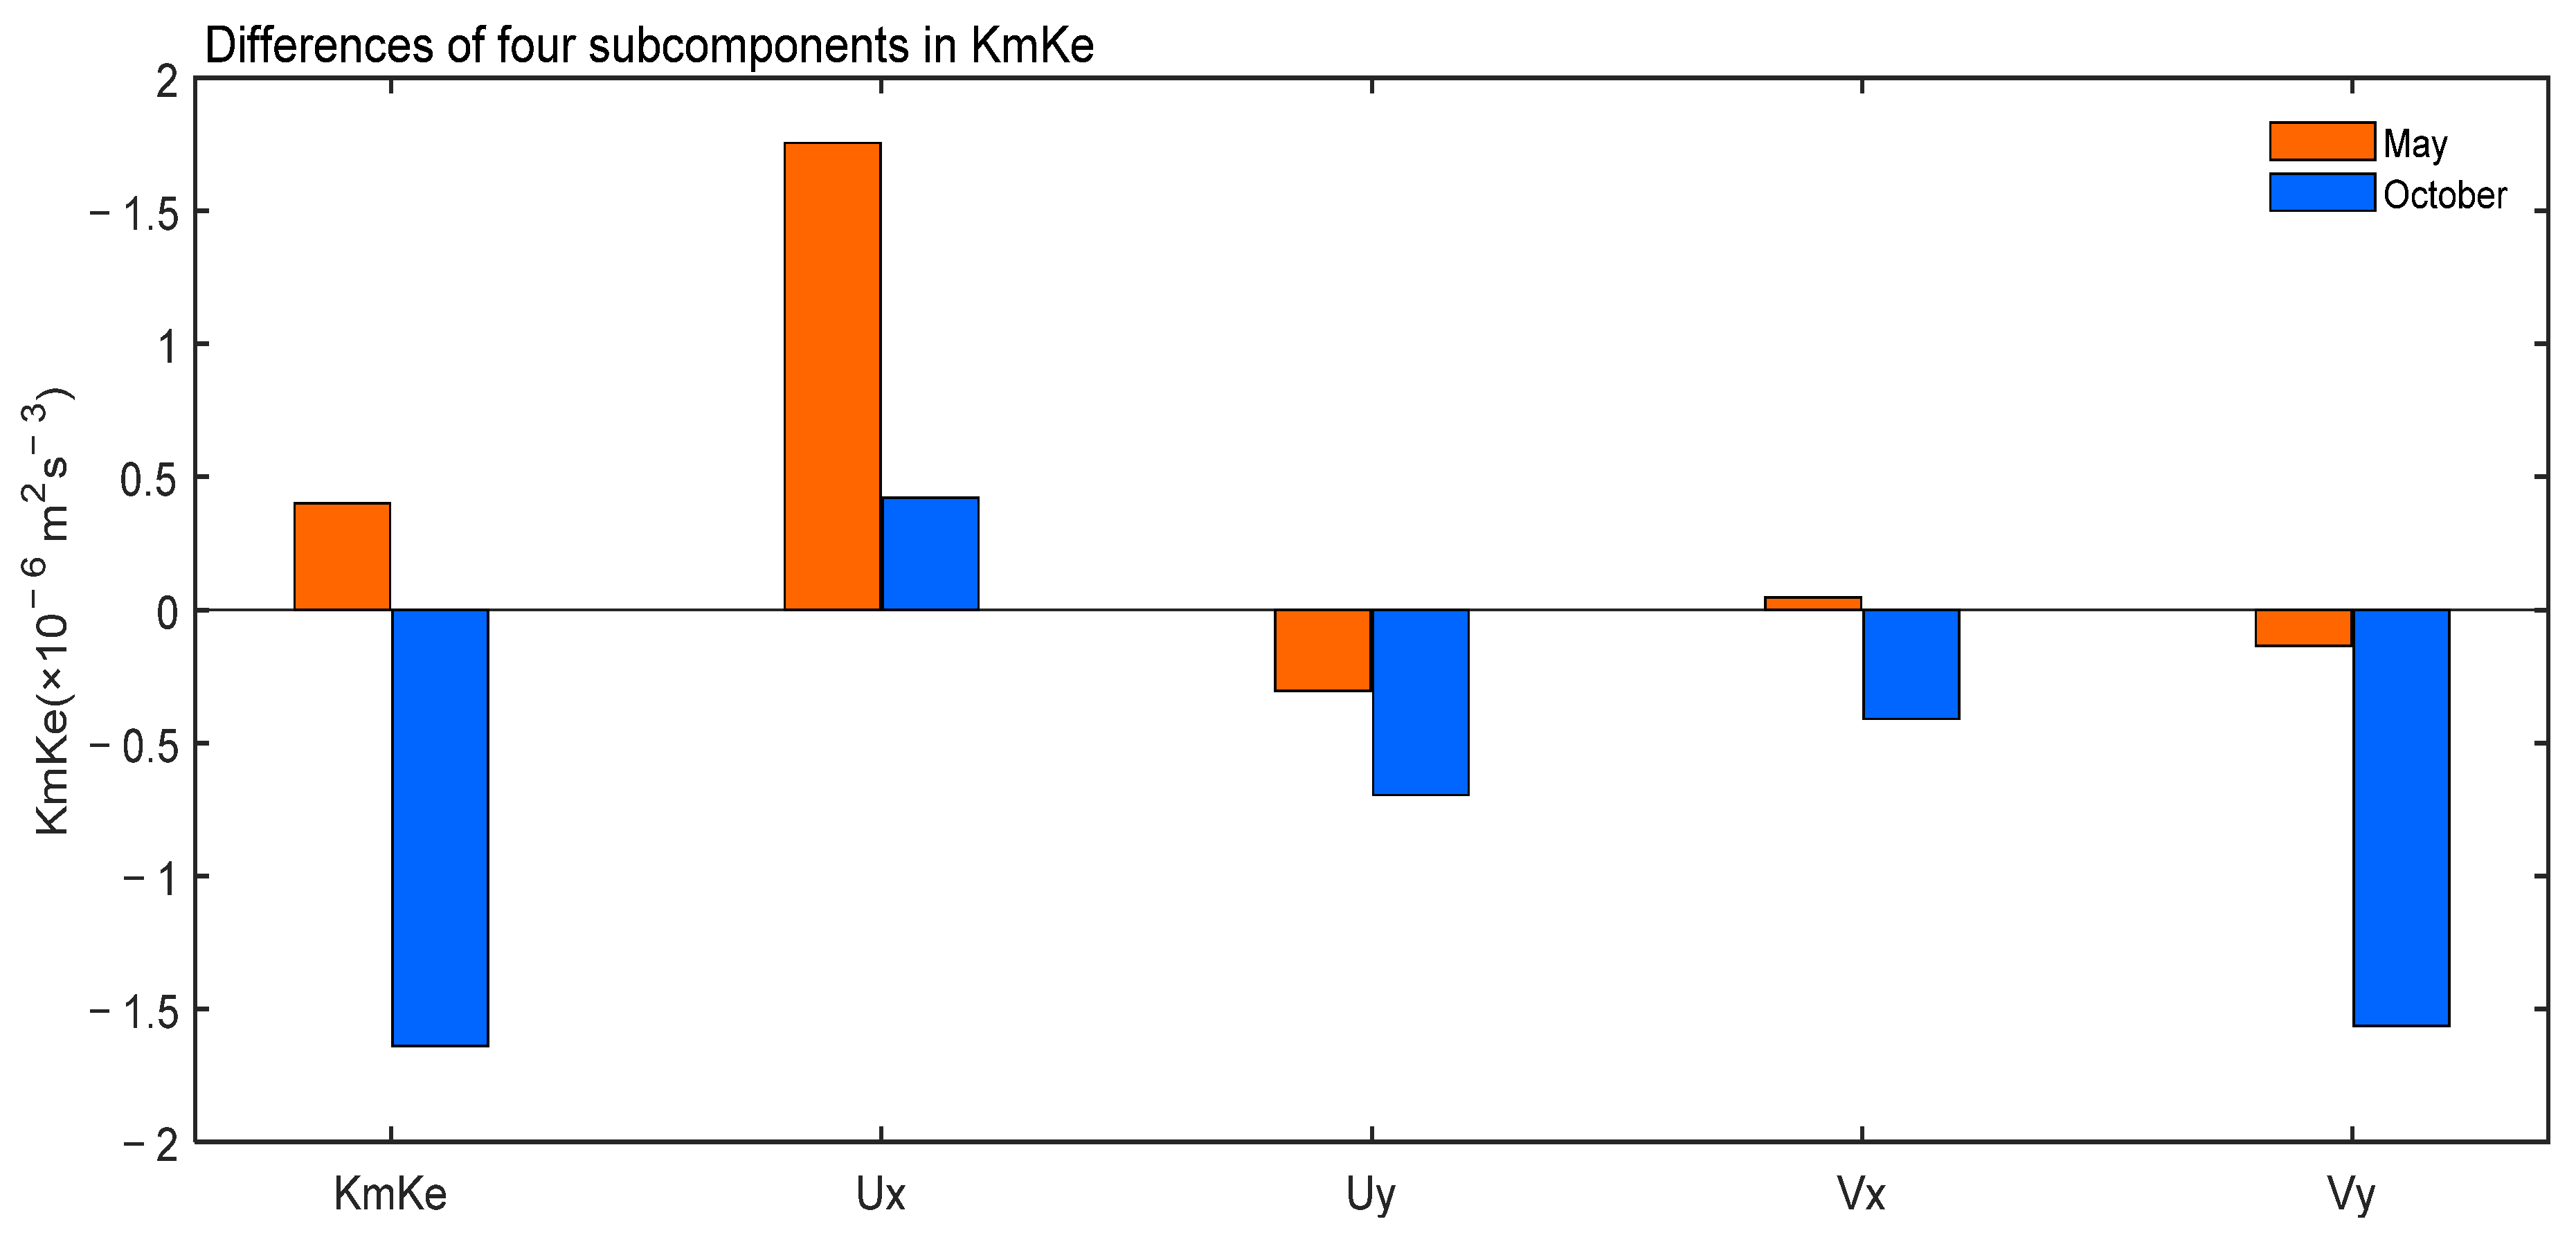
3.2.1. Changing Tendencies in Low-Level Atmospheric Circulations, EKE, and BEC

Figure 4 shows the spatial distribution of linear trends of EKE (shading) and 850-hPa winds (vectors) in May and October. Significant increasing (decreasing) trends could be observed in the atmospheric EKE at 850 hPa west of 150° E in May (October), indicating the strengthening (weakening) of atmospheric synoptic-scale disturbances. These observed increasing (decreasing) changing tendencies in EKE could explain the increasing (decreasing) changing tendencies in the GP of WNP TCCs in May (October).
The differences in low-level atmospheric circulation and EKE between P1 and P2 were further compared in May and October (Figure 5) in order to highlight the differences before and after the late 1990s.
In May, obvious westerly wind anomalies in the lower atmosphere could be observed over the tropical WNP to the west of 140° E during P2 (Figure 5c). Westerly winds could be observed over the South China Sea in the mean wind fields during P2 (Figure 5b). However, the South China Sea was mainly controlled by easterly winds during P1 (Figure 5a). Thus, obvious westerly wind anomalies could be obtained over the South China Sea region by calculating the difference of mean winds between P2 and P1 (Figure 5c). For the WNP region between 120° E and 140° E, westerly wind anomalies could also be observed in the difference of winds between two periods (Figure 5c), which were mainly due to the weakening of the mean easterly winds during P2 (Figure 5b) compared with those during P1 (Figure 5a). These westerly wind anomalies were accompanied by atmospheric cyclonic circulation anomalies west of 150° E. These observed westerly anomalies and atmospheric cyclonic circulation anomalies could provide conditions conducive to TC formation by enhancing the low-level atmospheric relative vorticity. The enhanced TC genesis activity in May during P2 also mainly occurred west of 150° E (Figure 1b). At the same time, we noticed that the atmospheric EKE at 850 hPa also significantly increased west of 150° E during P2 (Figure 5c), indicating more active atmospheric synoptic-scale disturbances which could facilitate the TC formation and induce a larger proportion of TCCs to evolve into TCs in May (Figure 3a).
In October, different characteristics were observed in the changes of low-level atmospheric circulations and EKE (Figure 5). Easterly wind anomalies dominated over the WNP to the east of 120° E during P2 (Figure 5f). These easterly wind anomalies were accompanied by atmospheric anticyclonic circulation anomalies and weakened low-level atmospheric relative vorticities, which are unfavorable for TC genesis. At the same time, the WNP showed large negative EKE anomalies (Figure 5f), indicating less active atmospheric synoptic-scale disturbances, which were consistent with observed suppressed TC genesis and weakened GP of WNP TCCs in October during P2 (Figure 3b).
The spatial distribution of linear trends of BEC terms in May and October is shown in Figure 6. Significant increasing (decreasing) trends could be observed in the BEC term at 850 hPa west of 150° E in May (October), which are similar to the distribution characteristics of the trends of EKE (Figure 4). These results indicate that the changing trend of BEC may contribute to the changing trend of EKE to a great extent.
Differences in the BEC term were further compared between P2 and P1 in May and October (Figure 7). The spatial distribution patterns of the differences in the BEC term are very similar to those of the differences in the EKE, indicating that the changes in the EKE in the lower troposphere may be mainly induced by the BEC. Stronger (weaker) BEC term anomalies in May (October) could contribute to higher (lower) EKE in the lower troposphere over the WNP during P2, indicating more (less) energy for the embedded synoptic-scale disturbances from the mean kinetic energy of the background mean flow.
The relative contributions from four subcomponents in the BEC term (as defined in Equation (2)) were further compared (Figure 8). In May, the Ux term associated with zonal-wind convergence showed the largest positive value, indicating the largest contribution of this term to the enhanced BEC during P2. In October, the Vy term associated with the meridional-wind convergence showed the strongest negative value, indicating the largest contribution of this term to the suppressed BEC during P2. These results show that there are some differences in the BEC subcomponent that makes the greatest contribution to the BEC changes between May and October.

3.2.2. Changing Tendencies in WNP Subtropical High and Monsoon

The WNP subtropical high and WNP summer monsoon could have profound effects on WNP TC activities [24,37,38,39,40,41]. The observed changes of low-level atmospheric circulations (Figure 4 and Figure 5) may be closely related to the changes of WNP subtropical highs and monsoons. In the following, we will examine changing tendencies in the WNP subtropical high and monsoon indices in May and October (Figure 9).
In May, the WNP subtropical high-intensity index decreased from an average of 0.175 during P1 to an average of −0.209 during P2 (Figure 9a), indicating the weakening of the intensity of the WNP subtropical high during P2. Meanwhile, the WNP monsoon index showed a significant increasing trend (Figure 9c). The value of the WNP monsoon index increased from an average of −0.978 during P1 to an average of 1.304 during P2 (Figure 9c), indicating the strengthening of the WNP monsoon in May during P2. There were no significant differences in the WNP subtropical high area index between P1 and P2 (Figure 9b). The weakened WNP subtropical high and strengthened WNP monsoon are consistent with observed enhanced westerly wind anomalies and atmospheric cyclonic circulation anomalies in the lower atmosphere over the WNP (Figure 5c).
In October, no significant differences were observed between the two periods for the mean value of the WNP subtropical high-intensity index (Figure 9d) and WNP monsoon index (Figure 9f). However, the WNP subtropical high area index boosted from an average of 0.029 during P1 to an average of 0.645 during P2, with a significant increasing trend (Figure 9e). The enlarged WNP subtropical high could support the enhanced easterly wind anomalies and atmospheric anticyclonic circulation anomalies over the WNP, as shown in Figure 5f.

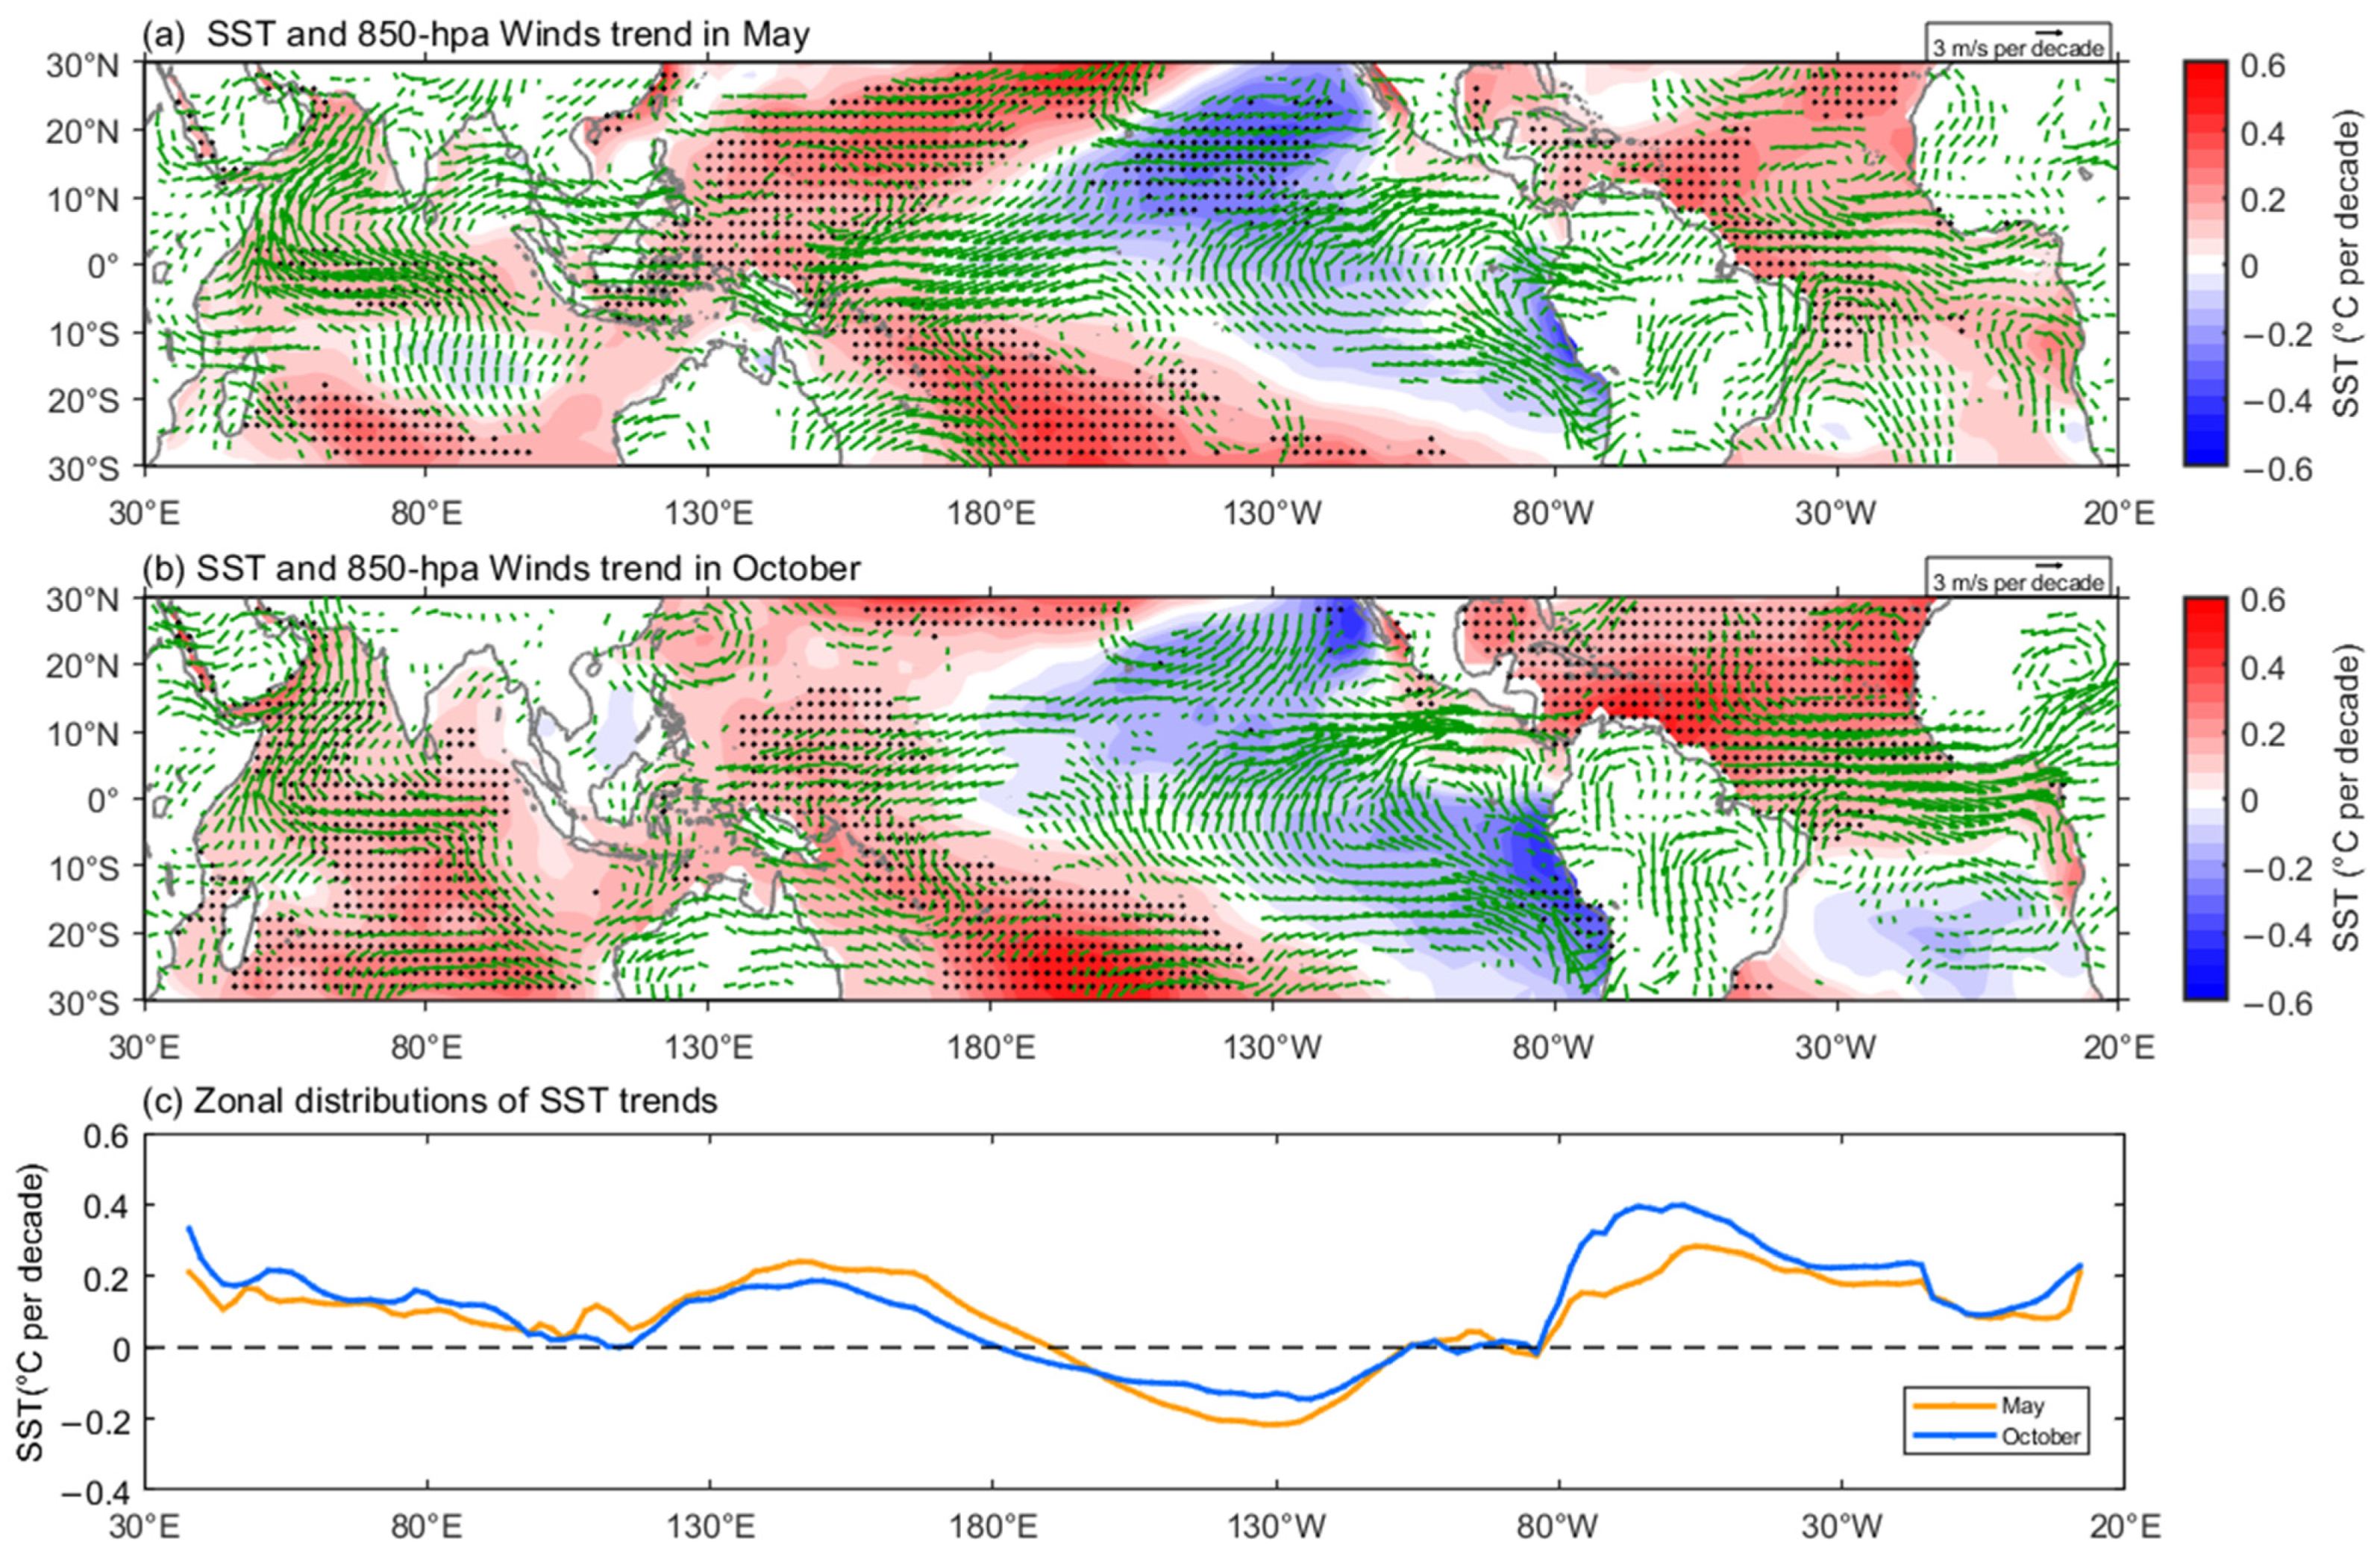
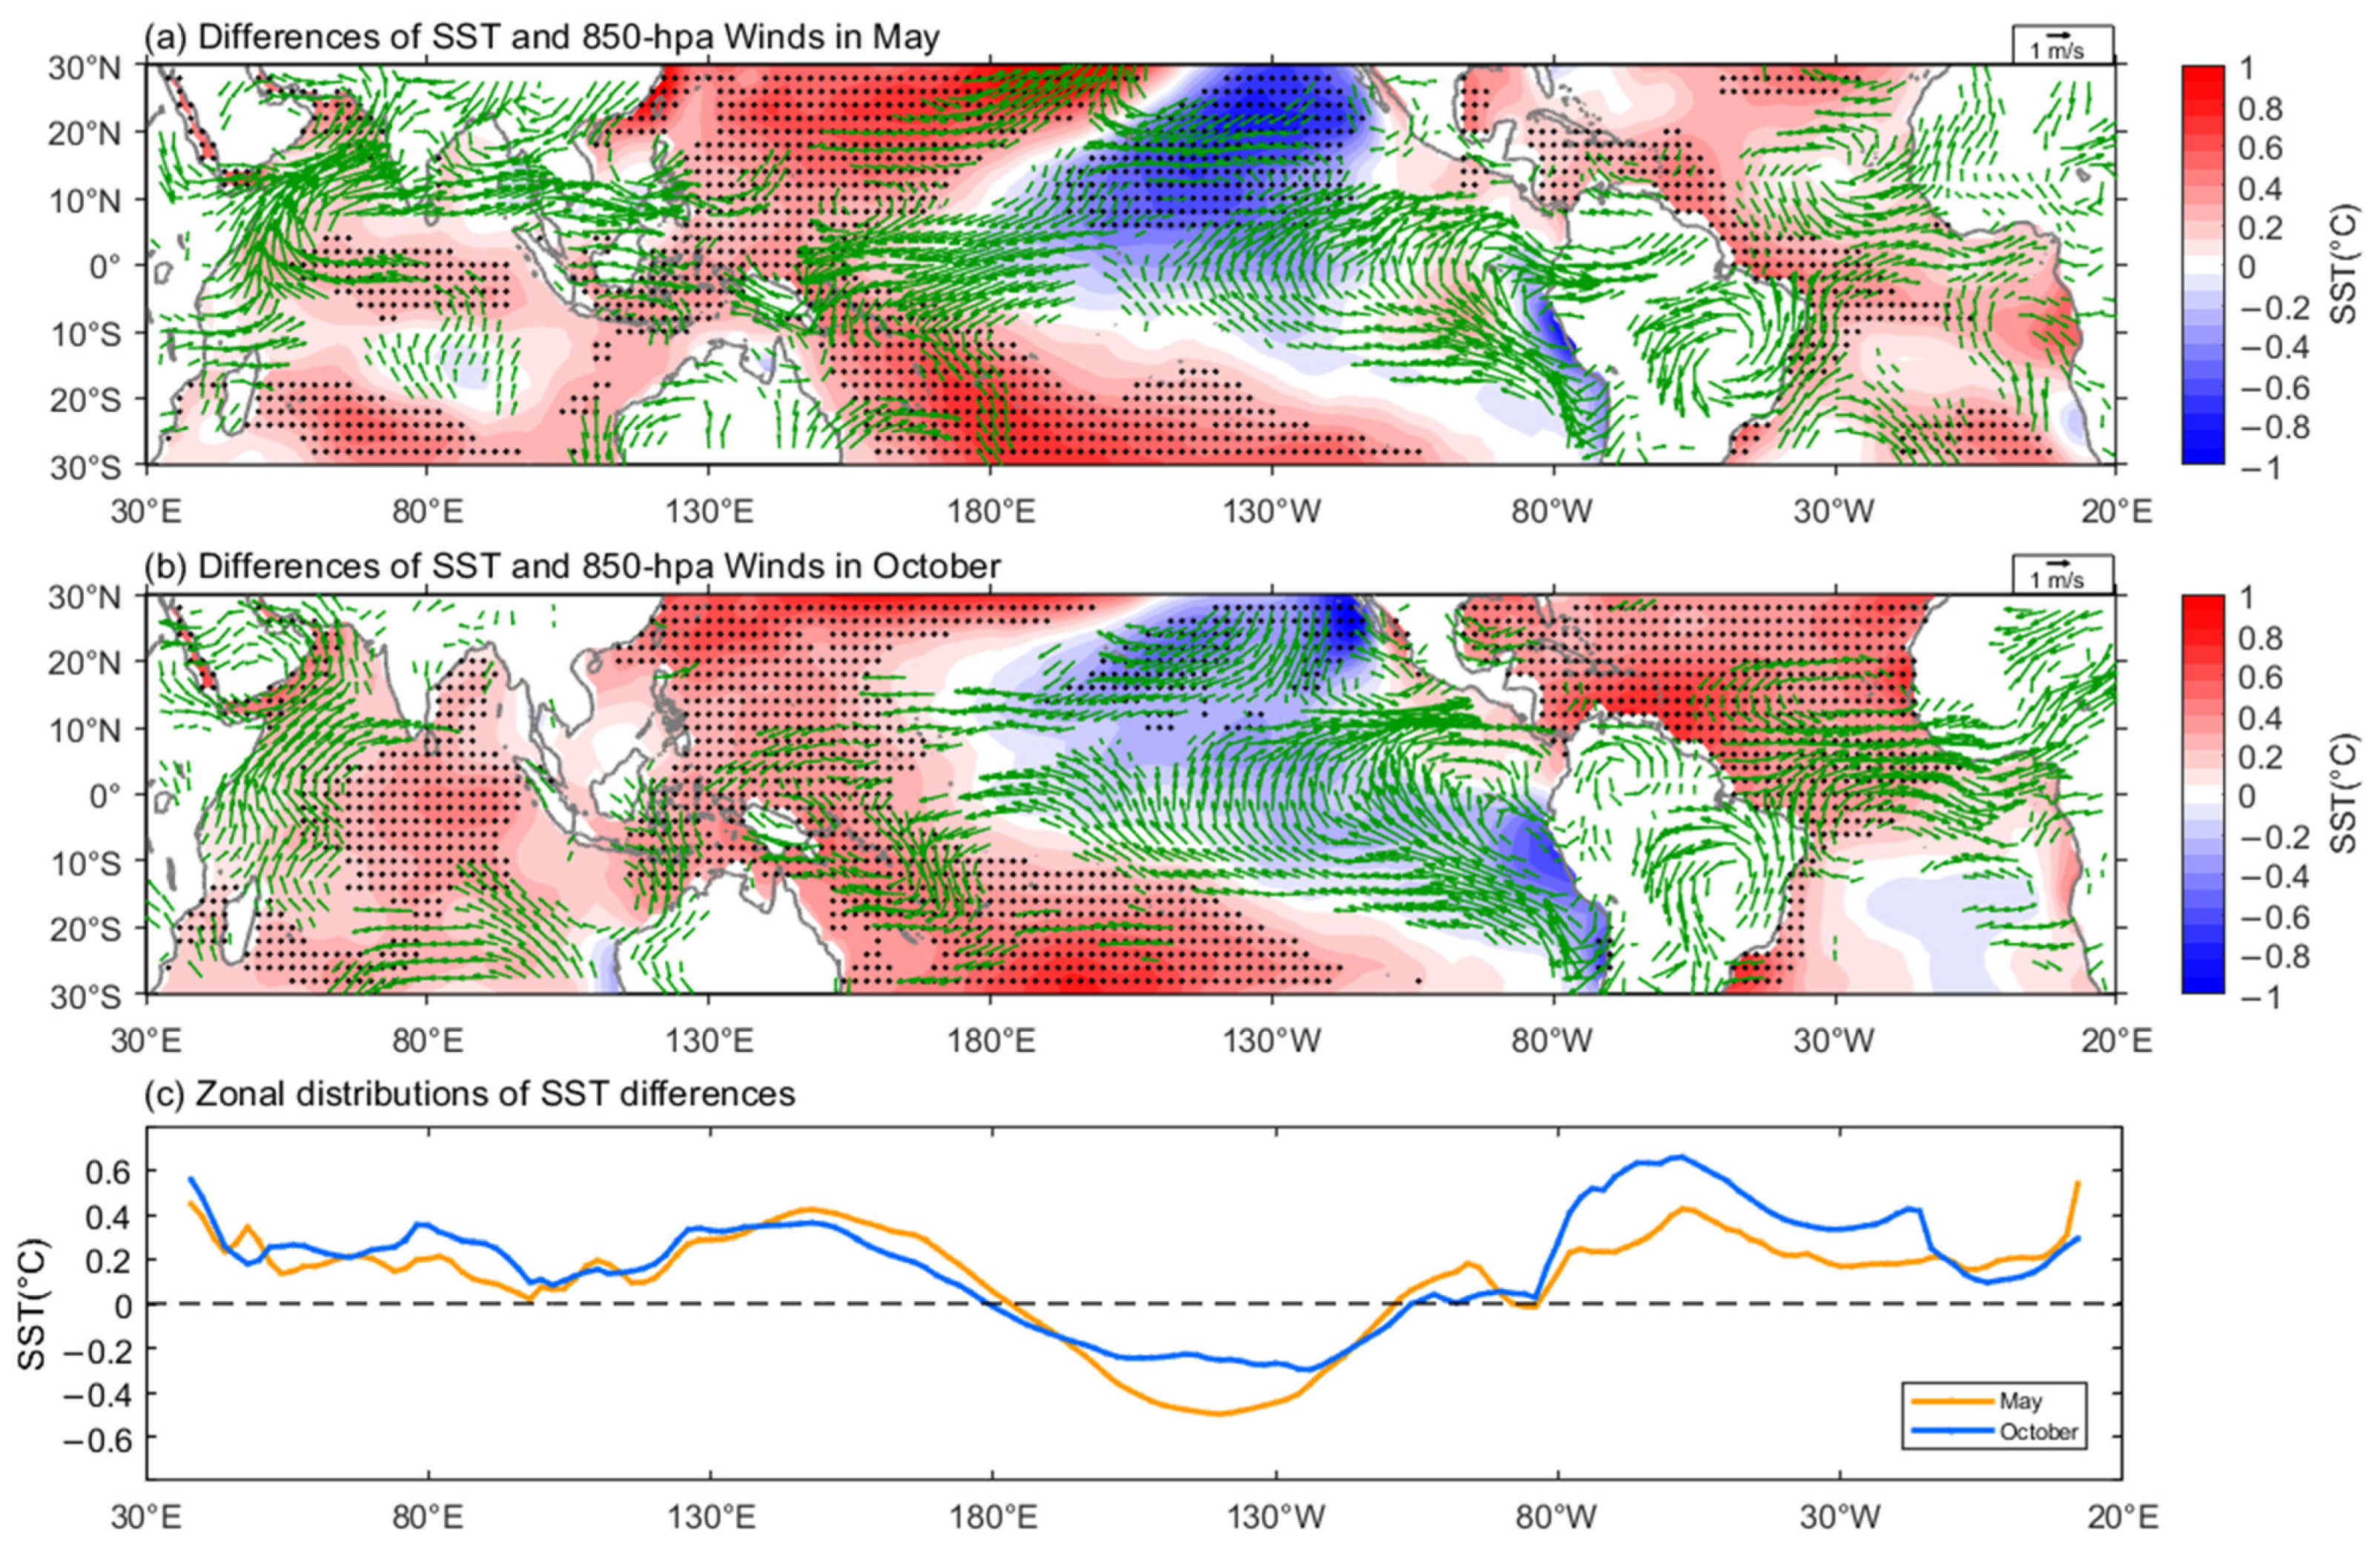
3.2.3. Changing Tendencies in SST Configurations across the Tropical Oceans

The different changes in SST (Figure 10 and Figure 11) may be of vital importance to trigger the different low-level atmospheric circulation anomalies between May and October.
Figure 10 presents comparisons for spatial distributions of SST trends in tropical ocean regions between May and October. Overall, there was a trend of SST cooling in the tropical eastern Pacific, while there was a trend of SST warming in the tropical western Pacific, tropical Atlantic, and Indian Oceans both in May and October. However, when we quantitatively compare the intensity of SST changing trends, we found differences in the specific magnitude of SST changing trends in different tropical ocean basins between May and October (Figure 10c). In May, the tropical western Pacific showed a stronger trend of SST warming. In contrast, the tropical Atlantic and Indian oceans showed a stronger trend of SST warming in October (Figure 10c).
Differences of SST between P2 and P1 in May and October are shown in Figure 11, which are very similar to the spatial distribution of SST trends as shown in Figure 10. Although the differences of SST between P2 and P1 are very similar in qualitative spatial distribution for May (Figure 11a) and October (Figure 11b), there are obvious differences in quantitative values in different tropical ocean regions (Figure 11c). The “mega-La Nina” like pattern [42] could be observed both in May (Figure 11a) and October (Figure 11b), with triangular SST cooling (K-shape SST warming) in the tropical central-eastern (western) Pacific. SST warming also occurred in the tropical Atlantic and Indian Oceans both in May (Figure 11a) and October (Figure 11b), giving rise to a pan-tropical dipole-like SST pattern (with SST increases in the tropical Atlantic and Indo-western Pacific, but SST decreases in the eastern Pacific) as described in Li et al. [43]. However, when we compared the specific values of SST changes in different tropical areas, we found obvious differences in quantitative SST changes in different tropical ocean regions between May and October (Figure 11c).
In May, there was a stronger SST rising in the tropical western Pacific (between 140° E and 180° E) and a larger SST dropping in the tropical eastern Pacific (between 160° W and 120° W) (Figure 11c). The stronger SST rising in the tropical western Pacific could support westerly wind anomalies in the lower atmosphere west of 150° E through a Gill-type response [44] (Figure 11a). At the same time, the stronger SST cooling in the tropical eastern Pacific could induce stronger easterly wind anomalies in the lower atmosphere between 150° E and 180° E (Figure 11a). Therefore, large values of the Ux term associated with zonal-wind convergence could exist during P2 in May (Figure 8), resulting in enhanced BEC (Figure 7c) and higher EKE (Figure 5c).
In October, stronger SST rising could be observed in the tropical Atlantic Ocean (between 60° W and 10° W) and tropical Indian Ocean (between 50° E and 100° E) (Figure 11c). Different from May, the tropical WNP was mainly controlled by easterly wind anomalies in October (Figure 11b). The westerly wind anomalies west of 150° E, which were observed in May (Figure 11a), had weakened significantly by October (Figure 11b). Stronger SST rising in both tropical Indian and Atlantic Oceans may contribute to the stronger easterly wind anomalies in the tropical WNP in October. The tropical Indian Ocean SST warming may induce easterly wind anomalies over the tropical WNP through the atmospheric Kelvin wave responses [45]. At the same time, the tropical Atlantic Ocean SST warming may generate easterly wind anomalies over the tropical WNP through the atmospheric zonal vertical circulation anomalies across ocean basins [46] or via atmospheric Kelvin waves [43]. As a result, the enhanced low-level atmospheric easterly wind anomalies over the tropical WNP in October may lead to suppressed BEC (Figure 7f) and lower EKE (Figure 5f), giving rise to a lower proportion of TCCs to evolve into TCs.
The differences of influencing processes in May and October may be mainly due to the different mean background winds, thus triggering different air-sea feedback processes and inter-basin interactions. May is the month of summer monsoon onset, while October is the month of summer monsoon withdrawal and the transition to winter monsoon. A positive air-sea feedback process may be involved in the concurrent stronger SST warming in the tropical western Pacific (Figure 11c) and weakening of the WNP subtropical high (Figure 9a) in May. As suggested in Wang et al. [24], the atmosphere-ocean thermodynamic feedback between the WNP subtropical high and underlying Indo-Pacific SST anomalies could play a role. On the one hand, the warm WNP SST anomalies could stimulate the ascent atmospheric Rossby wave, which could promote the abnormal weakening of the WNP subtropical high. On the other hand, the wind changes caused by the weakened WNP subtropical high anomalies may also reinforce the WNP SST warming anomalies by reducing the total wind speed and sea surface evaporation. On the contrary, the wind changes caused by the weakened WNP subtropical high anomalies could induce SST cooling anomalies in the tropical Indian Ocean by enhancing the total wind speed and sea surface evaporation. This may provide an explanation for why the SST warming in the tropical western Pacific was higher than that in the tropical Indian Ocean in May (Figure 11c). Through the possible positive feedback processes, including the interaction between the WNP subtropical high and underlying SST anomalies, the stronger warming of the tropical west Pacific SST and the weakening of the WNP subtropical high could be observed at the same time.

3.2.4. Possible Influences of the PDO

Zhao et al. [4] suggested that the observed downward changing tendency in GP of WNP TCCs during the extended boreal summer was considered to be directly related to the late 1990s climate shift. Zhao et al. [47] supported that natural decadal variability has a much greater impact on the long-term variability of WNP TC track density than anthropogenic global warming. In this study, the observed changing tendency in GP of WNP TCCs may also possibly be contributed to by the late 1990s climate shift. In the next section, we will examine the results by removing the influence of natural interdecadal variability like PDO.
The impact of PDO on the GP changing tendency was excluded by removing the linear regressions with respect to the PDO index. The results showed that the increasing (decreasing) trend in GP of WNP TCCs could still exist after removing the PDO influences, but the intensity of the trends was obviously weakened. In May, the increasing trend in GP of WNP TCCs decreased from 2.42% per decade (for original GP time series) to 1.92% per decade (for GP time series after removing the PDO influences). The increasing trend in GP of WNP TCCs in May after removing the PDO influences was significant at the 95% confidence level. In October, the decreasing trend in GP of WNP TCCs was weakened from −7.47% per decade (for original GP time series) to −3.88% per decade (for GP time series after removing the PDO influences). The decreasing trend in GP of WNP TCCs in October, after removing the PDO influences, was significant at the 90% confidence level but not significant at the 95% confidence level. These results confirmed that the late 1990s climate shift associated with PDO could have contributed to the observed changing tendencies in GP of WNP TCCs both in May and October. A less pronounced trend in October, after removing the PDO influences, was observed, suggesting that the PDO influence on the changing tendency of GP in October may be stronger than that in May.

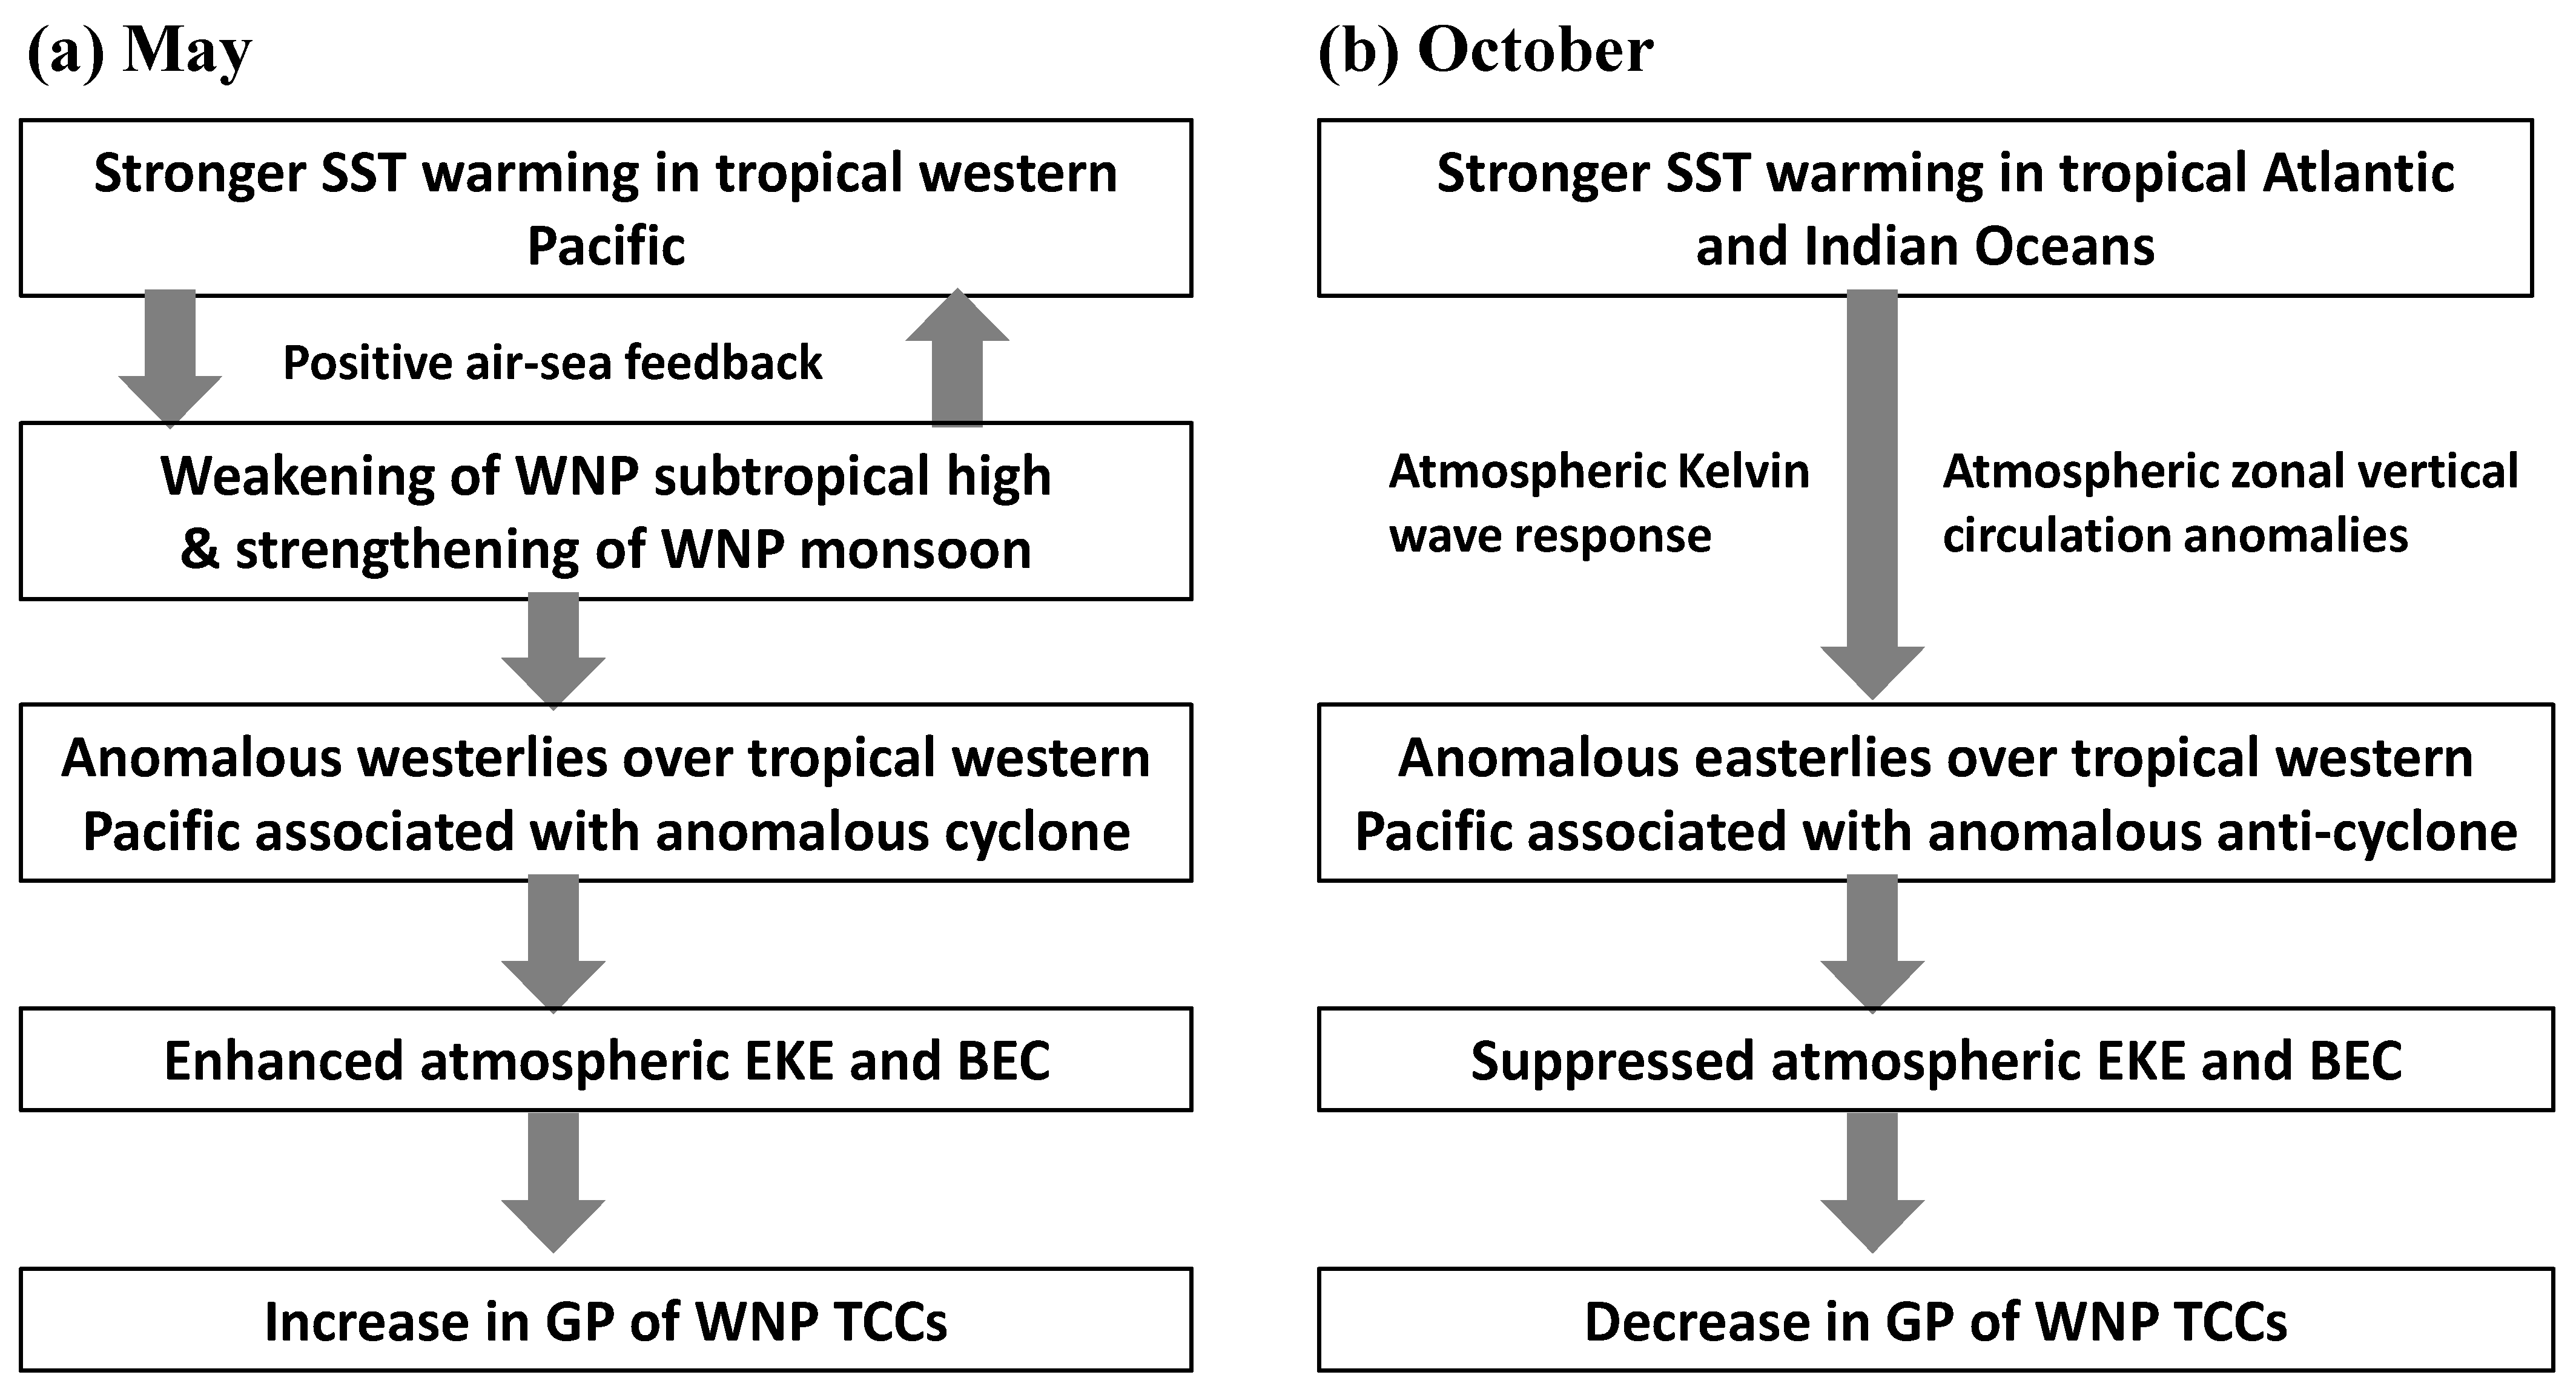
4. Conclusions and Discussion

The recent changing tendencies in the GP of WNP TCCs in May and October were compared in this study. The results reveal the opposite changing tendencies in the GP of WNP TCCs in May and October, providing new insights into the climatology of WNP TCCs. The results in this study highlight the seasonality in recent changing tendencies in the GP of WNP TCCs and associated large-scale atmospheric-oceanic conditions.
Although most months showed recent decreases in the GP of WNP TCCs, May is the only month with a significant recent increase. October is the month with the largest decrease in the GP of WNP TCCs. The opposite-changing tendencies in May and October were contributed to by different changes in low-level atmospheric circulation anomalies triggered by different SST configurations across the tropical oceans.
In May, stronger SST warming in the tropical western Pacific prompted increased anomalous westerlies associated with an anomalous cyclone, accompanied by the weakening of the WNP subtropical high and strengthening of the WNP monsoon (Figure 12a). Positive air-sea feedback processes, including the interaction between the WNP subtropical high and underlying SST anomalies, may be involved in the concurrent stronger SST warming in the tropical western Pacific and weakening of the WNP subtropical high in May. Such changes in background atmospheric circulations could favor the enhancement of atmospheric EKE and BEC, resulting in the recent intensified GP of WNP TCCs in May.
In October, stronger SST warming in the tropical Atlantic and Indian Oceans contributed to anomalous easterlies over the tropical WNP associated with an anomalous anti-cyclone, giving rise to the suppressed atmospheric EKE and recent weakened GP of WNP TCCs (Figure 12b). It is through atmospheric Kelvin waves or atmospheric zonal vertical circulation anomalies across ocean basins that warm tropical Atlantic and Indian SST anomalies trigger anomalous easterlies over the tropical WNP.
Recent studies have also noticed the combined impacts of SST anomalies in different tropical ocean regions on the WNP TC activities [48,49,50,51,52]. Our results reveal that there may be differences in tropical ocean regions where SST anomalies play a more important role between May and October, with more possible influences from stronger SST rising in the tropical western Pacific (tropical Atlantic and Indian Oceans) in May (October). The mechanism for the seasonality of recent SST changes in different tropical oceans and the relationship between SST anomalies across the three tropical oceans (including tropical Pacific, Indian, and Atlantic Oceans) need further research in the future.
The inter-basin interactions among three tropical oceans (Pacific, Indian, and Atlantic Oceans) is a hot topic in the field of climate research [53,54], which may be a golden key to understanding recent climate variability. Inter-basin interactions among the three tropical oceans may involve many complex air-sea processes [45,55,56], which are not fully understood at present. The results in this study suggest possible seasonality in the inter-basin interactions among three tropical oceans, which are worthy of further study.
Because the time range of the available global TCC dataset is relatively short, further confirmation on the results reported here is needed by using more TCC observations and numerical experiments in subsequent research. Considering that the time distribution of four seasons in a year may be changed greatly under global warming [57], possible changes in the seasonality of TCCs and TCs in the future global warming scenario are also worthy of further study. The relative contributions to the observed GP changing tendencies by the global warming (due to the increased emissions of greenhouse gases) and the natural decadal variability need to be further untangled by longer observational data and numerical modeling experiments.

Author Contributions

Conceptualization, X.P. and L.W.; methodology, X.P., M.W. and Q.G.; software, X.P., M.W. and Q.G.; formal analysis, X.P. and L.W.; data curation, X.P.; writing—original draft preparation, X.P. and L.W.; writing—review and editing, L.W.; visualization, X.P., M.W. and Q.G.; supervision, L.W.; funding acquisition, L.W. All authors have read and agreed to the published version of the manuscript.

Funding

This work was supported by the National Natural Science Foundation of China [grant number 41776031], the National Key Research and Development Program of China [grant number 2018YFC1506903], the team project funding of scientific research innovation for universities in Guangdong province [grant number 2019KCXTF021], the program for scientific research start-up funds of Guangdong Ocean University [grant number R17051] and the Guangdong Natural Science Foundation [grant number 2015A030313796].

Institutional Review Board Statement

Not applicable.

Informed Consent Statement

Not applicable.

Data Availability Statement

The global TCC data were provided by http://www.atms.unca.edu/chennon/data/tcc/netcdf/ (accessed on 2 October 2019). The IBTrACS TC data were acquired from https://www.ncdc.noaa.gov/ibtracs/index.php?name=ibtracs-data (accessed on 15 December 2019). The ERSST data were provided by https://www.esrl.noaa.gov/psd/data/gridded/data.noaa.ersst.v3.html (accessed on 6 May 2021). The NCEP/NCAR re-analysis data were downloaded from https://psl.noaa.gov/data/gridded/data.ncep.reanalysis.html (accessed on 6 May 2021). The PDO index data were provided by http://research.jisao.washington.edu/pdo/PDO.latest (accessed on 26 August 2021).

Acknowledgments

The authors would like to thank the editor and anonymous reviewers for their helpful comments and suggestions.

Conflicts of Interest

The authors declare no conflict of interest.

References

  1. Maddox, R.A. Satellite Depiction of the life cycle of a mesoscale convective complex. Mon. Weather. Rev. 1981, 109, 1583–1586. [Google Scholar] [CrossRef] [Green Version]
  2. Hennon, C.C.; Helms, C.; Knapp, K.R.; Bowen, A.R. An objective algorithm for detecting and tracking tropical cloud clusters: Implications for tropical cyclogenesis prediction. J. Atmos. Ocean. Technol. 2011, 28, 1007–1018. [Google Scholar] [CrossRef]
  3. Hennon, C.C.; Papin, P.P.; Zarzar, C.; Michael, J.R.; Caudill, J.A.; Douglas, C.R.; Groetsema, W.C.; Lacy, J.H.; Maye, Z.D.; Reid, J.L.; et al. Tropical cloud cluster climatology, variability, and genesis productivity. J. Clim. 2013, 26, 3046–3066. [Google Scholar] [CrossRef] [Green Version]
  4. Zhao, H.; Chen, S.; Raga, G.B.; Klotzbach, P.J.; Wu, L. Recent decrease in genesis productivity of tropical cloud clusters over the Western North Pacific. Clim. Dyn. 2018, 52, 5819–5831. [Google Scholar] [CrossRef]
  5. Mcbride, J.L.; Zehr, R. Observational analysis of tropical cyclone formation. Part II: Comparison of non-developing versus developing systems. J. Atmos. Sci. 1981, 38, 1132–1151. [Google Scholar] [CrossRef] [Green Version]
  6. Gray, W.M. The formation of tropical cyclones. Theor. Appl. Clim. 1998, 67, 37–69. [Google Scholar] [CrossRef]
  7. Wang, L.; Lau, K.-H.; Zhang, Q.-H.; Fung, C.-H. Observation of non-developing and developing tropical disturbances over the South China Sea using SSM/I satellite. Geophys. Res. Lett. 2008, 35, 10. [Google Scholar] [CrossRef]
  8. Fu, B.; Peng, M.S.; Li, T.; Stevens, D.E. Developing versus nondeveloping disturbances for tropical cyclone formation. Part II: Western North Pacific. Mon. Weather Rev. 2012, 140, 1067–1080. [Google Scholar] [CrossRef] [Green Version]
  9. Kerns, B.W.; Chen, S.S. Cloud clusters and tropical cyclogenesis: Developing and nondeveloping systems and their large-scale environment. Mon. Weather Rev. 2013, 141, 192–210. [Google Scholar] [CrossRef] [Green Version]
  10. Teng, H.-F.; Lee, C.-S.; Hsu, H.-H.; Done, J.M.; Holland, G.J. Tropical cloud cluster environments and their importance for tropical cyclone formation. J. Clim. 2019, 32, 4069–4088. [Google Scholar] [CrossRef]
  11. Teng, H.-F.; Lee, C.-S.; Hsu, H.-H. Influence of ENSO on formation of tropical cloud clusters and their development into tropical cyclones in the western North Pacific. Geophys. Res. Lett. 2014, 41, 9120–9126. [Google Scholar] [CrossRef]
  12. Xu, S.; Wang, B. Enhanced western North Pacific tropical cyclone activity in may in recent years. Clim. Dyn. 2013, 42, 2555–2563. [Google Scholar] [CrossRef] [Green Version]
  13. Huangfu, J.; Huang, R.; Chen, W. Interdecadal increase of tropical cyclone genesis frequency over the western north Pacific in may. Int. J. Clim. 2016, 37, 1127–1130. [Google Scholar] [CrossRef]
  14. Liu, K.S.; Chan, J.C.L. Inactive period of western north pacific tropical cyclone activity in 1998–2011. J. Clim. 2013, 26, 2614–2630. [Google Scholar] [CrossRef]
  15. Tu, J.-Y.; Chou, C.; Huang, P.; Huang, R. An abrupt increase of intense typhoons over the western North Pacific in early summer. Environ. Res. Lett. 2011, 6, 034013. [Google Scholar] [CrossRef]
  16. Hsu, P.-C.; Chu, P.-S.; Murakami, H.; Zhao, X. An abrupt decrease in the late-season typhoon activity over the Western North Pacific. J. Clim. 2014, 27, 4296–4312. [Google Scholar] [CrossRef]
  17. Choi, Y.; Ha, K.; Jin, F. Seasonality and el niño diversity in the relationship between ENSO and Western North Pacific tropical cyclone activity. J. Clim. 2019, 32, 8021–8045. [Google Scholar] [CrossRef]
  18. Fan, T.; Xu, S.; Huang, F.; Zhao, J. The phase differences of the interdecadal variabilities of tropical cyclone activity in the peak and late seasons over the western North Pacific. Theor. Appl. Clim. 2018, 136, 77–83. [Google Scholar] [CrossRef]
  19. Basconcillo, J.; Moon, I.-J. Recent increase in the occurrences of Christmas typhoons in the Western North Pacific. Sci. Rep. 2021, 11, 7416. [Google Scholar] [CrossRef]
  20. Wu, Z.; Hu, C.; Wang, J.; Chen, W.; Lian, T.; Yang, S.; Chen, D. Distinct interdecadal change contrasts between summer and autumn in latitude-longitude covariability of Northwest Pacific typhoon genesis locations. Geophys. Res. Lett. 2021, 48, e2021GL093494. [Google Scholar] [CrossRef]
  21. Knapp, K.R.; Kruk, M.C.; Levinson, D.H.; Diamond, H.J.; Neumann, C.J. The international best track archive for climate stewardship (IBTrACS) unifying tropical cyclone data. Bull. Am. Meteorol. Soc. 2010, 91, 363–376. [Google Scholar] [CrossRef]
  22. Smith, T.M.; Reynolds, R.; Peterson, T.; Lawrimore, J. Improvements to NOAA’s historical merged land–ocean surface temperature analysis (1880–2006). J. Clim. 2008, 21, 2283–2296. [Google Scholar] [CrossRef]
  23. Kalnay, E.; Kanamitsu, M.; Kistler, R.; Collins, W.; Deaven, D.; Gandin, L.; Iredell, M.; Saha, S.; White, G.; Woollen, J.; et al. The NCEP/NCAR 40-year reanalysis project. Bull. Am. Meteorol. Soc. 1996, 77, 437–472. [Google Scholar] [CrossRef] [Green Version]
  24. Wang, B.; Xiang, B.; Lee, J.-Y. Subtropical high predictability establishes a promising way for monsoon and tropical storm predictions. Proc. Natl. Acad. Sci. USA 2013, 110, 2718–2722. [Google Scholar] [CrossRef] [PubMed] [Green Version]
  25. Wang, B.; Fan, Z. Choice of South Asian summer monsoon indices. Bull. Am. Meteorol. Soc. 1999, 80, 629–638. [Google Scholar] [CrossRef] [Green Version]
  26. Mantua, N.J.; Hare, S.R.; Zhang, Y.; Wallace, J.M.; Francis, R.C. A Pacific interdecadal climate oscillation with impacts on salmon production. Bull. Am. Meteorol. Soc. 1997, 78, 1069–1079. [Google Scholar] [CrossRef]
  27. Zhang, Y.; Wallace, J.M.; Battisti, D.S. ENSO-like Interdecadal Variability: 1900–1993. J. Climate. 1997, 10, 1004–1020. [Google Scholar] [CrossRef]
  28. Maloney, E.D.; Hartmann, D.L. The madden–julian oscillation, barotropic dynamics, and North Pacific tropical cyclone formation. Part I: Observations. J. Atmos. Sci. 2001, 58, 2545–2558. [Google Scholar] [CrossRef] [Green Version]
  29. Hsu, P.-C.; Li, T. Interactions between boreal summer intraseasonal oscillations and synoptic-scale disturbances over the Western North Pacific. Part II: Apparent heat and moisture sources and eddy momentum transport. J. Clim. 2011, 24, 942–961. [Google Scholar] [CrossRef]
  30. Zhan, R.; Wang, Y.; Lei, X. Contributions of ENSO and East Indian Ocean SSTA to the interannual variability of Northwest Pacific tropical cyclone frequency. J. Clim. 2011, 24, 509–521. [Google Scholar] [CrossRef]
  31. Wu, L.; Wen, Z.; Huang, R.; Wu, R. Possible linkage between the monsoon trough variability and the tropical cyclone activity over the Western North Pacific. Mon. Weather. Rev. 2012, 140, 140–150. [Google Scholar] [CrossRef]
  32. Kendall, M.G. Rank Correlation Methods; Charles Griffin: London, UK, 1975; pp. 1–202. [Google Scholar]
  33. He, H.; Yang, J.; Gong, D.; Mao, R.; Wang, Y.; Gao, M. Decadal changes in tropical cyclone activity over the western North Pacific in the late 1990s. Clim. Dyn. 2015, 45, 3317–3329. [Google Scholar] [CrossRef]
  34. Huangfu, J.; Huang, R.; Chen, W.; Feng, T.; Wu, L. Interdecadal variation of tropical cyclone genesis and its relationship to the monsoon trough over the western North Pacific. Int. J. Clim. 2016, 37, 3587–3596. [Google Scholar] [CrossRef]
  35. Zhao, J.; Zhan, R.; Wang, Y.; Xu, H. Contribution of the interdecadal Pacific oscillation to the recent abrupt decrease in tropical cyclone genesis frequency over the Western North Pacific since 1998. J. Clim. 2018, 31, 8211–8224. [Google Scholar] [CrossRef]
  36. Kim, H.-K.; Seo, K.-H.; Yeh, S.-W.; Kang, N.-Y.; Moon, B.-K. Asymmetric impact of Central Pacific ENSO on the reduction of tropical cyclone genesis frequency over the western North Pacific since the late 1990s. Clim. Dyn. 2020, 54, 661–673. [Google Scholar] [CrossRef]
  37. Li, H.; Xu, F.; Sun, J.; Lin, Y.; Wright, J.S. Subtropical high affects interdecadal variability of tropical cyclone genesis in the South China Sea. J. Geophys. Res. Atmos. 2019, 124, 6379–6392. [Google Scholar] [CrossRef]
  38. Wu, Q.; Wang, X.; Tao, L. Interannual and interdecadal impact of Western North Pacific subtropical high on tropical cyclone activity. Clim. Dyn. 2020, 54, 2237–2248. [Google Scholar] [CrossRef] [Green Version]
  39. Choi, J.W.; Kim, B.J.; Zhang, R.; Park, K.J.; Kim, J.Y.; Cha, Y.; Nam, J.C. Possible relation of the western North Pacific monsoon to the tropical cyclone activity over western North Pacific. Int. J. Climatol. 2016, 36, 3334–3345. [Google Scholar] [CrossRef] [Green Version]
  40. Zhao, H.; Chen, S.; Klotzbach, P.J. Recent strengthening of the relationship between the Western North Pacific monsoon and Western North Pacific tropical cyclone activity during the boreal summer. J. Clim. 2019, 32, 8283–8299. [Google Scholar] [CrossRef]
  41. Basconcillo, J.; Cha, E.-J.; Moon, I.-J. Characterizing the highest tropical cyclone frequency in the Western North Pacific since 1984. Sci. Rep. 2021, 11, 14350. [Google Scholar] [CrossRef]
  42. Wang, B.; Liu, J.; Kim, H.-J.; Webster, P.J.; Yim, S.-Y.; Xiang, B. Northern hemisphere summer monsoon intensified by mega-El Nino/southern oscillation and Atlantic multidecadal oscillation. Proc. Natl. Acad. Sci. USA 2013, 110, 5347–5352. [Google Scholar] [CrossRef] [PubMed] [Green Version]
  43. Li, X.; Xie, S.-P.; Gille, S.; Yoo, C. Atlantic-induced pan-tropical climate change over the past three decades. Nat. Clim. Chang. 2016, 6, 275–279. [Google Scholar] [CrossRef]
  44. Gill, A.E. Some simple solutions for heat-induced tropical circulation. Meteorol. Atmos. Phys. 1980, 106, 447–462. [Google Scholar] [CrossRef]
  45. Xie, S.-P.; Hu, K.; Hafner, J.; Tokinaga, H.; Du, Y.; Huang, G.; Sampe, T. Indian Ocean capacitor effect on Indo-Western Pacific climate during the summer following El Niño. J. Clim. 2009, 22, 730–747. [Google Scholar] [CrossRef]
  46. Hong, C.-C.; Chang, T.-C.; Hsu, H.-H. Enhanced relationship between the tropical Atlantic SST and the summertime western North Pacific subtropical high after the early 1980s. J. Geophys. Res. Atmos. 2014, 119, 3715–3722. [Google Scholar] [CrossRef]
  47. Zhao, J.; Zhan, R.; Wang, Y.; Xie, S.-P.; Wu, Q. Untangling impacts of global warming and interdecadal Pacific oscillation on long-term variability of North Pacific tropical cyclone track density. Sci. Adv. 2020, 6, eaba6813. [Google Scholar] [CrossRef]
  48. Yu, J.; Chen, C.; Li, T.; Zhao, X.; Xue, H.; Sun, Q. Contribution of major SSTA modes to the climate variability of tropical cyclone genesis frequency over the western North Pacific. Q. J. R. Meteorol. Soc. 2016, 142, 1171–1181. [Google Scholar] [CrossRef]
  49. Cao, X.; Wu, R.; Xiao, X. A new perspective of intensified impact of El Niño-Southern Oscillation modoki on tropical cyclogenesis over the western North Pacific around 1990s. Int. J. Clim. 2018, 38, 4262–4275. [Google Scholar] [CrossRef]
  50. Wang, C.; Wang, B. Tropical cyclone predictability shaped by western Pacific subtropical high: Integration of trans-basin sea surface temperature effects. Clim. Dyn. 2019, 53, 2697–2714. [Google Scholar] [CrossRef]
  51. Wu, M.; Wang, L.; Chen, B. Recent weakening in interannual variability of mean tropical cyclogenesis latitude over the Western North Pacific during boreal summer. J. Meteorol. Res. 2020, 34, 1183–1198. [Google Scholar] [CrossRef]
  52. Wang, C.; Wu, K.; Wu, L.; Zhao, H.; Cao, J. What caused the unprecedented absence of Western North Pacific Tropical cyclones in july 2020? Geophys. Res. Lett. 2021, 48, e2020GL092282. [Google Scholar] [CrossRef]
  53. Cai, W.; Wu, L.; Lengaigne, M.; Li, T.; McGregor, S.; Kug, J.-S.; Yu, J.-Y.; Stuecker, M.F.; Santoso, A.; Li, X.; et al. Pantropical climate interactions. Science 2019, 363, eaav4236. [Google Scholar] [CrossRef] [PubMed] [Green Version]
  54. Wang, C. Three-ocean interactions and climate variability: A review and perspective. Clim. Dyn. 2019, 53, 5119–5136. [Google Scholar] [CrossRef] [Green Version]
  55. Xie, S.-P.; Kosaka, Y.; Du, Y.; Hu, K.; Chowdary, J.S.; Huang, G. Indo-western Pacific Ocean capacitor and coherent climate anomalies in post-ENSO summer: A review. Adv. Atmos. Sci. 2016, 33, 411–432. [Google Scholar] [CrossRef] [Green Version]
  56. Wang, L.; Yu, J.-Y.; Paek, H. Enhanced biennial variability in the Pacific due to Atlantic capacitor effect. Nat. Commun. 2017, 8, 14887. [Google Scholar] [CrossRef] [PubMed]
  57. Wang, J.; Guan, Y.; Wu, L.; Guan, X.; Cai, W.; Huang, J.; Dong, W.; Zhang, B. Changing lengths of the four seasons by global warming. Geophys. Res. Lett. 2021, 48, e2020GL091753. [Google Scholar] [CrossRef]
Figure 1. Geographic distributions of (a) TCC formation locations in May, (b) TC genesis locations in May, (c) TCC formation locations in October, and (d) TC genesis locations in October over the WNP during 1982–2009. A blue (red) asterisk represents a TCC (TC).
Atmosphere 12 01177 g001
Figure 2. The seasonality of the linear trend in GP of WNP TCCs during 1982–2009. The red (blue) bar indicates that the increasing (decreasing) trend exceeds the 95% confidence level. The white bar indicates that the trend is not significant at the 95% confidence level.
Atmosphere 12 01177 g002
Figure 3. (a) Time series of the WNP TCC numbers (grey bars), TC numbers (white bars; multiplied by 5), and GP (black solid line) in May. The solid lines are for the linear trends in GP (red), TC number (yellow), and TCC number (blue) during 1982–2009. The black dotted line is for the mean GP during P1 (1982–1997) and P2 (1998–2009). (b) As in (a) but for October. TC*5 represents the TC number multiplied by 5 for the convenience of display in this figure.
Atmosphere 12 01177 g003
Figure 4. Spatial distribution of linear trends of EKE (shading) and 850-hPa winds (vectors) in (a) May and (b) October. Signals above the 90% confidence level are highlighted by purple dots (for EKE) and green vectors (for winds).
Atmosphere 12 01177 g004
Figure 5. Comparisons of 850-hPa winds (vectors) and eddy kinetic energy (EKE) (shading) between two sub-periods in May (ac) and October (df). Mean 850-hPa winds (vectors) and EKE (shading) in May during (a) P1 (1982–1997) and (b) P2 (1998–2009). (c) Differences of 850-hPa winds (vectors) and EKE (shading) between P2 and P1 in May. As in (ac), but for October (df). Signals above the 90% confidence level are highlighted by green vectors (for winds) and purple dots (for EKE).
Atmosphere 12 01177 g005
Figure 6. Spatial distribution of linear trends of BEC term (KmKe) (shading) in (a) May and (b) October. Signals above the 90% confidence level are highlighted by purple dots.
Atmosphere 12 01177 g006
Figure 7. Comparisons of BEC term (KmKe) (shading) between two sub-periods in May (ac) and October (df). Mean Kmke (shading) in May during (a) P1 (1982–1997) and (b) P2(1998–2009). (c) Differences of Kmke (shading) between P2 and P1 in May. As in (ac), but for October (df). Signals above the 90% confidence level are highlighted by purple dots.
Atmosphere 12 01177 g007
Figure 8. Differences of four regional mean subcomponents in the Kmke between P2 and P1 in May (red) and October (blue). The regional mean values were averaged over (5–20° N, 100–160° E).
Atmosphere 12 01177 g008
Figure 9. Time-series of WNP subtropical high-intensity index in (a) May and (d) October. WNP subtropical high area index in (b) May and (e) October, and WNP monsoon index in (c) May and (f) October. The yellow solid lines are the linear trends. The blue (red) dotted line is for the mean value during P1 and P2.
Atmosphere 12 01177 g009
Figure 10. Comparisons for spatial distributions of SST trends in tropical ocean regions between May and October. Linear trends of SST (color) and 850-hPa winds (vectors) in (a) May and (b) October. (c) The zonal distributions of SST trends averaged between 5° S and 20° N for May (yellow) and October (blue). Signals above the 90% confidence level are highlighted by black dots (for SST) and green vectors (for winds).
Atmosphere 12 01177 g010
Figure 11. Comparisons for differences of SST in tropical ocean regions in May and October between two sub-periods. Differences of SST (color) and 850-hPa winds (vectors) between P2 and P1 in (a) May and (b) October. (c) The zonal distributions of SST differences between P2 and P1 averaged between 5° S and 20° N for May (yellow) and October (blue). Signals above the 90% confidence level are highlighted by black dots (for SST) and green vectors (for winds).
Atmosphere 12 01177 g011
Figure 12. Schematic diagram showing the process for recent opposite changing tendencies in GP of WNP TCCs in (a) May and (b) October.
Atmosphere 12 01177 g012
Publisher’s Note: MDPI stays neutral with regard to jurisdictional claims in published maps and institutional affiliations.

