1. Introduction
Poor air quality can affect our health because fine particles are carried deep into the lungs during the breathing process. Certain pollutants contribute to acid rain by affecting soils and vegetation [
1,
2]. Many studies show that air pollutants, in particular particulate matter (PM), contribute to the occurrence or exacerbation of symptoms of many diseases, including upper respiratory tract disease, asthma, chronic obstructive pulmonary disease (COPD), pneumonia, and cardiovascular disease. Fine particles with a particle size of fewer than 10 microns (PM
10 for short) and less than 2.5 microns (PM
2.5 for short) have become two representative pollutants that have a particularly adverse effect on human health [
3,
4]. PM
10 and PM
2.5 have a significant effect on light scattering and absorption, resulting in reduced visibility in the atmosphere. PM and its toxic components can easily enter the human body through the respiratory tract, settle in the alveoli and enter the bloodstream, which is very harmful to human health [
5,
6,
7,
8]. The effect of PM pollution on the severity of allergy symptoms and general well-being was also observed. Chronically-ill people are advised to avoid prolonged exposure to contaminated air. Particularly PM
2.5 and PM
1 fractions penetrate deep into the lungs and even into the circulatory system, spreading pollutants throughout the body. Research also shows the possibility of disease transmission by large dust particles in the air. The presence of viruses, including coronaviruses, has been observed on the fine particles and the possibility of infection in this way is not ruled out [
9,
10,
11,
12,
13,
14,
15].
Identification of PM
10 and PM
2.5 sources is the basis and a prerequisite for controlling their pollution [
16,
17,
18,
19]. It is a long-term activity requiring a comprehensive application of multidisciplinary and models [
20]. The main sources of PMs are industrial boilers and furnaces, industrial processes, coal-fired power plants, vehicle emissions, low emission, agricultural sources and natural sources. PM is the fifth global cause of mortality and the main air pollutant in this regard [
21].
Another typical air pollutant is NO
2. The formation of atmospheric NO
2 is mainly related to the partial combustion of fossil fuels, car exhaust fumes, biomass combustion, soil emissions, and natural lightning discharges [
22]. It plays a key role in the formation of tropospheric ozone through a complex set of reactions with oxygen and free radicals formed from volatile organic compounds (VOCs) in the presence of sunlight [
23]. It is also a source of fine particle pollutants as well as acid rain and summer smog [
24,
25,
26]. Tropospheric NO
2 has detrimental effects on human health, plant growth, and climate change. Several epidemiological studies have shown a strong association between long-term NO
2 exposure and decline in respiratory function [
27,
28,
29].
As of December 2019, in Wuhan, China, doctors began detecting many cases of new viral pneumonia [
30]. On 30 January 2020, the World Health Organization announced that the new coronavirus epidemic poses a public health threat, and the disease itself has been dubbed corona virus disease 2019 (COVID-19 for short) [
31]. To stop the pandemic, unprecedented restrictions were introduced, resulting in a slowdown in the economy, which in turn eliminated or reduced some sources of pollution, including vehicle traffic, construction sites, and coal-fired factories [
32,
33,
34]. However, this did not stop the pandemic, which spread throughout the world over the next few months, affecting most of the world’s population.
The change by people of their daily behavior and patterns to contain or avoid the virus has not only affected the economy but has also extended to other aspects such as the environment [
35,
36,
37]. During the lockdowns, there was less traffic on the communication routes. Traffic in major cities was lower as many people were forced to stay at home and work remotely. Public transport was cut and economic activity also decreased. The COVID-19 pandemic, causing changes in people’s behavior and the way global economies function, was, therefore, a good opportunity to study the impact of changing the intensity of particular activities on the change in the concentrations of individual types of pollutants. Together with, for example, data on road traffic intensity, it has become the subject of many scientific works as well as economic analyzes. Observation of major air pollutants in cities during the lockdown due to COVID-19 may provide some guidance for regional environmental management.
Key industries around the world operated at significantly lower-than-normal levels during the quarantine, resulting in carbon emissions being at least 25% lower [
38]. For example, shutting down factories and restricting traffic in China’s Hubei province to prevent the outbreak of the coronavirus reduced air pollution. As a result, the number of days on which the sky was free from pollution increased by 21.5% in February 2020 compared to the same month of the previous year [
39]. Satellite images showed a significant drop in the concentration of nitric oxide in most European countries and America, as the cloud of toxic pollutants hovering over industrial sites disappeared [
40].
The EEA data [
41] also shows how the concentration of nitrogen dioxide (NO
2) decreased in many European cities. For example, in Milan, the average NO
2 concentrations for four weeks in February/March 2020 were at least 24% lower than during the four weeks earlier of the same year. In Bergamo, the average concentration in the week of 16–22 March was 47% lower than in the same week in 2019. In Rome, the average NO
2 concentrations from the last four weeks at the turn of February and March 2020 were 26–35% lower than in the same weeks in 2019. Similar trends were observed in other European cities where lockdown was introduced in the week of 16–22 March 2020. In Barcelona, the average NO
2 concentration fell by 40% week to week. Compared to the same week in 2019, the reduction was 55%. In Madrid, the average NO
2 concentration dropped 56% week to week. Compared to the same week in 2019, the reduction was 41%. In Lisbon, the average NO
2 concentration fell by 40% week by week. Compared to the same week in 2019, the reduction was 51%.
This study aimed to investigate the average PM10, PM2,5, and NO2 concentrations during the COVID-19 lockdown in Poland and to compare them to the period preceding the introduction of these restrictions and to the same period a year earlier in selected locations in Poland. The aim was also to investigate the impact of changes in road traffic intensity on the volume of pollutants in the air and an attempt to identify the impact of other sources of pollution on air quality typical for Poland, as well as low emission. The analysis was divided into typical air pollutants in Poland: PM10, PM2,5, and NO2, into two monitoring station types: traffic/background and into three types of weekdays: working days, Saturdays, and Sundays, which results from differences in the activities of the inhabitants in Poland.
2. Materials and Methods
The subject of the research was the 5 largest Polish cities, which include Warsaw, Kraków, Łódź, Wrocław, and Poznań, and one of the voivodships—Małopolska (excluding Kraków), and changes in non-urban areas were also examined.
Warsaw is the capital of Poland and the Masovian Voivodeship, the largest city in the country, located in its central part, in Masovia, on the Vistula River. The population is 1.8 million. Warsaw is an important scientific, cultural, political, and economic center. Łódź is a city located in Central Poland with a population of approximately 0.67 million. It’s an academic, cultural, and industrial center. Until recently, it was also the center of the textile and film industry. Wrocław is a city in Southwest Poland with a population of approximately 0.65 million. In the ranking published by the Globalization and World Cities Research Network, Wrocław was classified in the IX category (Gamma) of cities of global importance [
42]. Wrocław was classified in the top 100 cities of the world in the Mercer ranking “Best Cities to Live” in the years 2015–2019 [
43], as well as in the top 100 most intelligent cities in the world (smart city) in the IESE Cities in Motion Index report in 2019 [
44]. Poznań is a city in Western Poland, with a population of approximately 0.53 million. Poznań often ranks among the leading cities with a very high quality of education and a very high standard of living. Poznań has also repeatedly won the “Superbrands” award for the city’s brand of very high quality [
45]. The city is a center of industry, commerce, logistics, and tourism. Kraków is a city located in Southern Poland on the Vistula River, the second-largest city in the country in terms of population and area, with a population of approximately 0.78 million. The city serves as an administrative, cultural, educational, scientific, economic, service, and tourist center.
In Poland, Kraków is quite an interesting large city, because, from 1 September 2019, an anti-smog resolution has been in force there, which provides for a complete ban on smoking with coal, wood, and other solid fuels in boilers, stoves, and fireplaces in the area of Kraków. It is allowed to use only high-methane or nitrogen-rich natural gas (including liquefied natural gas), propane-butane, agricultural biogas or other flammable gas, and light fuel oil. The ban applies not only to coal stoves and fireplaces but also to fireplaces and heavy stationary grills. The resolution banning the use of solid fuels for heating in Kraków was adopted by the assembly of the Małopolska Voivodeship in January 2016.
The Małopolska Voivodeship (Małopolska for short)—is one of the 16 voivodships of Poland. The voivodship covers an area of 15,182 km2 and is one of the smaller in Poland (twelfth place in the country). The voivodeship has approximately 3.4 million inhabitants, ranking fourth in Poland. The population density is the second-highest in the country after the Silesian province.
In the case of the analyzed 5 largest Polish cities and Małopolska, the source of data was the official Polish State Environmental Monitoring (SEM). SEM performs tasks that are determined by the requirements of parliament and the European Council as well as the standards contained in Polish legal acts relating to air quality, primarily in the Act of 27 April 2001—Polish Environmental Protection Law. As part of the SEM, activities in the field of air quality control include, among others on continuous assessment of the state of its pollution, as well as control of compliance with the standards of permissible concentrations of pollutants. The main goal of the SEM is to support environmental protection activities. This goal is achieved by informing the administration bodies and the society about the quality of individual elements of the environment and the changes taking place. SEM is responsible for collecting, processing, and disseminating environmental data. To collect data, the SEM uses mainly stationary measuring stations that use reference methods or comply with the reference methods. The locations of the SEM measuring stations have been established in places that allow data to be obtained from various types of area (background/traffic).
A summary of the number of measuring stations measuring specific pollutants in particular locations, the data from which were used in the following analysis, is presented in
Table 1. One-hour average concentrations were taken for analysis from all measuring stations.
The main analyzed period begins in February 2020, when the restrictions related to the COVID-19 epidemic were not yet in force, and ends in April 2020, when restrictions due to the introduction of the first lockdown in Poland were relaxed.
Until 11 March 2020, there were no disruptions related to the pandemic in Poland. Due to the emergence of the first cases of infections, on 11 March, the Polish Prime Minister announced that educational institutions were closed for prophylaxis for two weeks (i.e., 12–25 March in fact, they remained closed until the end of June 2020). On 24 March 2020, it was announced that new security rules would be introduced (on 25 March 2020). Introduced, among others, was a ban on movement, except for:
- -
Performing professional activities or official tasks, or non-agricultural business activity, or conducting the agricultural activity or work on an agricultural farm, and the purchase of related goods and services;
- -
Satisfying the necessary needs related to the current affairs of everyday life;
- -
Performing voluntary and unpaid benefits to counteract the effects of COVID-19;
- -
Performing or participating in the performance of religious worship, including religious activities or rites.
Assemblies of more than 2 people were forbidden, restrictions were introduced regarding movement by public transport and on foot, and participation in religious ceremonies was limited to up to 5 people.
From 1 April, further restrictions were introduced. People under the age of 18 were allowed to stay in public space only with an adult. In addition, parks, boulevards, and beaches were ruthlessly closed and the activities of hairdressing, beauty, and tattoo salons were suspended. In shops and service outlets, the number of customers could not exceed three times the number of the cash register. Each store was required to equip its staff with personal protective equipment. Customers were allowed to stay in stores only in protective gloves.
On 20 April, the first stage of the easing restrictions began. The limits for people in shops were increased, as was the number of people participating in religious worship (1 person per 15 m2). The ban on traveling for “recreational purposes” was lifted, and the restriction of movement in public spaces accompanied by an adult was reduced. A major reduction in restrictions was introduced after 1 May 2020.
Thus, in the further part of the article, three main periods for analysis were adopted:
- -
Pre-lockdown (with full freedom of business activity, stationary education, and the possibility of free movement): from 1 February–11 March 2020;
- -
Lockdown period (with limited economic activity, highly restricted mobility, and fully remote education): 25 March–30 April 2020;
- -
Period a year earlier to the lockdown: 25 March 25–30 April 2019 (to compare pollutions with April 2020).
The main part of the analysis, aimed at determining changes in the concentration values of typical air pollutants, was carried out regarding the pre-lockdown period. The reason for this is the fact that in many Polish cities, intensive activities are taken to reduce the level of pollution—mainly by replacing old furnaces in single-family houses. For example, in Warsaw, several thousand old furnaces are replaced in one year, which significantly reduces the level of PM’s pollution [
46].
The analyzed measuring locations were divided according to the nature of the measuring station into traffic and background stations (
Table 1). The purpose of this type of division was to examine changes in the daily variability of the pollutants concentrations and to observe changes in the volume of pollutants in the air caused by changes in road traffic (in the case of traffic stations) and changes in emissions caused by households (in the case of background stations).
The second introduced division was that the analysis was carried out for different types of days of the week. Working days were adopted as the first category. The activity of residents is often associated with travel to the workplace, delivering children to school, business trips, or dealing with various types of errands. In most places, two traffic peaks can be distinguished: morning (usually between 6 and 9 a.m.) and afternoon (usually between 3 and 6 p.m.). Saturdays were the second analyzed category of days. On this day, most people do not work, and schools are closed, while shops and shopping malls are open (as on working days). It is on Saturdays that they are most busy, especially in larger towns. Saturday evening is often also a time of social meetings as well as visits to entertainment venues. On the other hand, the last category—Sundays and public holidays—includes days on which the activity related to mobility is usually the lowest, schools are closed, and most shops and shopping malls are closed.
For each of these day categories and each type of measuring station, the pollutant concentrations were aggregated for each hour of the day and the averages values were determined, presented in figures and tables, and analyzed. According to the methodology of conducting measurements by the SEM, the data from 11 a.m. for example includes measurements taken between 10 and 11 a.m. Therefore, in the figures and tables below, for pre-pandemic concentrations, data from 11 for Saturdays contain the average of 1-h averages for 11 a.m. on 1, 8, 15, 22, and 29 February, and 7 March. The averages for the remaining hours were determined similarly.
Table 2 provides a summary of the analyzed data categories.
The analysis of data on concentrations of pollutants cannot be complete without information on the atmospheric conditions, in particular the air temperature, in the analyzed periods and the analyzed locations. These data are presented in
Table 3.
3. Results
Data on the concentration values of pollutants at individual types of stations, in individual locations, and divided into individual types of days of the week are presented in
Table 4,
Table 5,
Table 6,
Table 7 and
Table 8. These data, divided into particular hours of the day, are illustrated in
Figure 1,
Figure 2,
Figure 3,
Figure 4,
Figure 5 and
Figure 6.
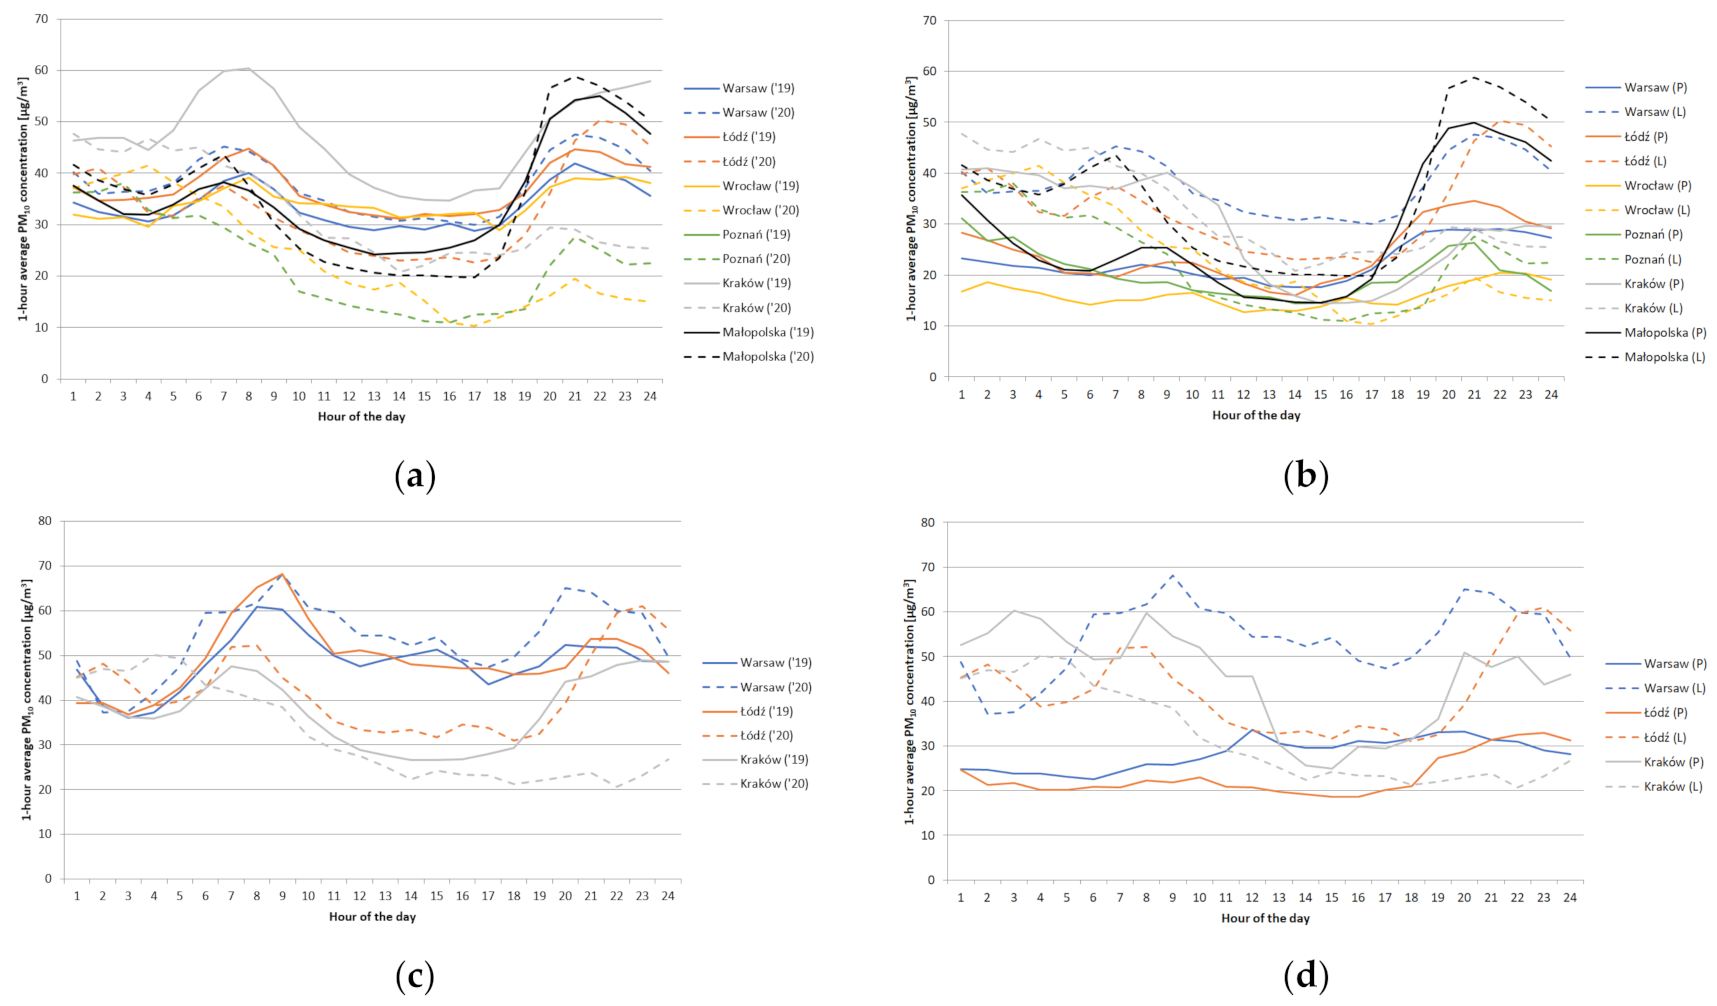
3.1. Working Days
The daily variation of PM
10 and NO
2 concentrations for working days in April 2019, April 2020, in the lockdown, and pre-lockdown period is presented in
Figure 1 and
Figure 2.
On working days, in all locations and most hours of the day, PM10 concentration during the lockdown was greater than in the pre-lockdown period even though the air temperature in April 2020 was higher than in February 2020. The highest percentage increase was observed both in the case of background stations (over 60% on average during the day) and traffic stations (over 90%) in Warsaw. In the case of background stations in Warsaw and Wrocław, an increase was observed for all hours. It is interesting that at the background stations in Łódź, Poznań, Kraków, and the Małopolska voivodship between 5 and 7 p.m. there was a decrease in pollution compared to the pre-lockdown period.
Comparing April 2020 with April 2019, the differences are not so great, and the prevailing trend of changes is also different. The increase in PM10 concentrations can be observed only in Warsaw—the most by approximately 11% at the traffic station. In the remaining locations and all types of stations, there was a slight reduction in PM10 concentrations. The reduction was fairly even, and amounted to approximately 15% on average. On the scale of all analyzed locations, the reduction of PM10 emissions during the lockdown period was 8%.
Taking into account individual hours and the lockdown, the largest percentage increase in pollution to the pre-lockdown period took place in Warsaw at the traffic station between 5 and 11 a.m.—by more than 100%, with a maximum increase at 9 a.m. of more than 160%. On the other hand, the largest decrease in PM10 pollution to the period before the lockdown took place at the traffic station in Kraków and amounted to over 30% between 6 and 7 p.m.
Comparing the year-on-year data, it can be seen that PM10 concentration during the lockdown at the background stations was especially lower in the afternoon rush hour. At the station in Wrocław, this reduction was even 70%. It was similar in Poznań as well. In turn, the increase in PM10 concentrations in April 2020 compared to April 2019 occurred in most locations in the late evening, night, and early morning hours. Perhaps the reason for this was the fact that April 2020, compared to this month a year before, was cooler by over 1 °C. This thesis may be supported by the fact that such a tendency was not observed at traffic stations. Apart from Warsaw, the reduction of PM10 concentrations during the lockdown period at traffic stations was especially visible between the morning and afternoon traffic peak.
In the case of PM2.5, in most locations, during the lockdown there was a slight increase in the concentration in relation to the pre-lockdown period and a slight decrease in relation to April 2019 (in all locations). In the case of Warsaw and Łódź, however, the increase in relation to the pre-lockdown period was not as significant as the increase in PM10 concentrations. Quite a significant increase in pollution (the largest among all locations) in relation to the pre-lockdown period took place at the traffic station in Wrocław. Unfortunately, the concentration of PM10 is not tested there.
In the case of NO2, the changes before the lockdown compared to the period during the lockdown look much different. In all the presented locations, during the lockdown the concentrations between the morning and evening hours were much lower than in the pre-lockdown period. The same trend occurs if we compare April 2020 to April 2019. The greatest change was observed at the measuring stations in Małopolska. Here, at certain hours, the NO2 pollution decreased by more than 60%. The smallest change in the afternoon hours was observed in the case of the traffic station in Łódź. The daily minima of NO2 concentrations at the background stations during the lockdown was recorded in the afternoon hours. In the pre-lockdown period, minimal NO2 concentrations occurred in the morning. On the other hand, in the early morning and early evening hours, NO2 concentrations during the lockdown were higher than in the pre-lockdown period. This was the case at background stations in the analyzed cities and traffic stations in Łódź and Wrocław.
Comparing NO2 concentrations year-to-year, in the case of traffic stations, the only period during the lockdown, when they were higher, were the night hours and those just before the morning traffic peak. In the case of background stations, the trend of changes (i.e., reduction in April 2020) was more uniform throughout the day. The only exceptions were 6–7 a.m. and 9 p.m. in Warsaw and Kraków, where during the lockdown there was a significant increase in NO2 concentrations—in Kraków at 9 p.m. they were higher by as much as 67%.
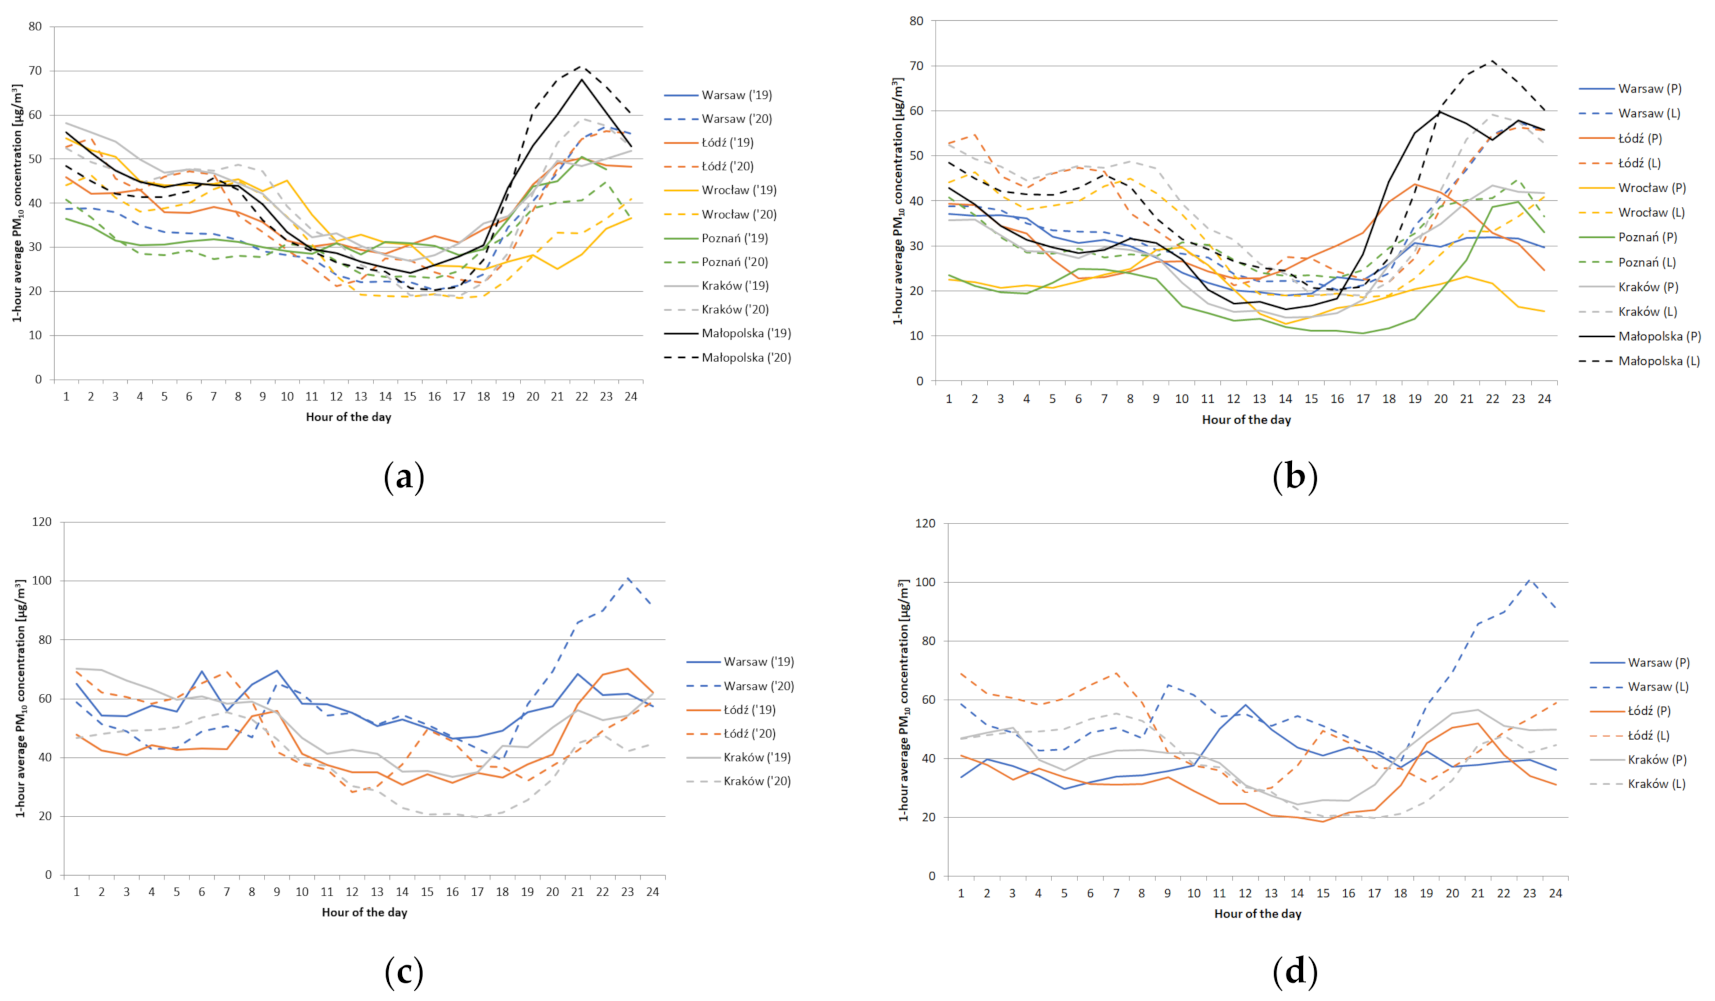
3.2. Saturdays
The daily variation of PM
10 and NO
2 concentrations for Saturdays in April 2019, April 2020, in the lockdown, and pre-lockdown period is presented in
Figure 3 and
Figure 4.
In the case of Saturdays and PM10, changes during the lockdown compared to the period before the pandemic in some locations were more varied. This is especially visible in the case of Warsaw. On working days, there was an increase in all types of measuring stations, while on Saturdays this increase (even by 100%) took place from 6 p.m. Until then, the concentration levels before and during the lockdown were very similar (although the total increase in concentrations at the traffic station was 48%, and at the background station—19%). In the case of Łódź, Saturdays were characterized by the fact that the increase took place in the hours before dawn, as well as late in the evening. A slight reduction in the concentration of pollution to the corresponding hours before the lockdown took place at approximately 6–7 p.m. In the case of other locations, the trend of changes on Saturdays broadly followed the trend of changes during the working days. Traditionally, the highest concentrations occurred in the evening and night hours.
Comparing April year-to-year, the changes are insignificant. In total, there was a decrease in PM10 concentrations in April 2020 by approximately 5%; however, in most large cities (Warsaw, Łódź) it can be noticed that the concentration decreased at traffic stations, and a slight increase at background stations. A distinguishing location is Krakow, especially the traffic station, where the reduction was 25%. Undoubtedly, this could have been influenced by the anti-smog resolution. Comparing the hourly data, we can see a regularity, as in the case of working days—in relation to April 2019, in April 2020, higher PM10 concentrations were observed during the night hours, and lower between the morning and evening hours. In the case of traffic stations, a significant increase in PM10 concentrations was observed in the evening hours at the station in Warsaw.
In case of PM2.5, the differences during the lockdown and before are very small. Both the diurnal variability and the relative level of concentrations were very similar in most locations. As in the case of working days—the greatest increase was recorded at the traffic station in Wrocław. If the lockdown period is compared to April 2019, it can be seen that in all locations there has been a reduction in PM2.5 concentrations. The average decrease, taking into account all the locations, was over 20%.
In the case of NO2 and Saturdays, the changes between the period before and during the lockdown that took place for working days are quite similar in the cases of Poznań, Kraków, and Małopolska. Especially in Małopolska, the lockdown period was the time when NO2 concentrations were lower in almost all hours than in the pre-lockdown period. As a result, the total reduction in NO2 pollution was over 30%. A similar pattern occurred at the traffic station in Kraków (except that the total reduction was over 30%) and at the background stations (with slight increases in the evening and morning hours and with a total reduction in the concentration level of over 25%).
A decidedly different characteristic of changes was observed in the case of Warsaw. At background stations, as in most other locations, there was a slight decrease in the hours between the morning and the evening, and a significant increase in the evening and night hours (by over 150% approximately 10–11 p.m.). At the traffic station, a significant reduction in NO2 concentrations took place from midnight until 6 p.m. During this period, the decrease in the level of pollutants was 50%. After 6 p.m. the trend reversed and by midnight there was a more than 50% increase in NO2 concentrations compared to the pre-lockdown period.
Quite similar trends can be observed if we compare April 2020 to April 2019. The greatest decrease in NO2 concentrations was observed at traffic stations. This was the case in Warsaw, Wrocław, and Kraków. A very large decrease also took place in the entire Małopolska—by over 40% in total. In turn, the increase in NO2 concentrations during the lockdown period took place at background stations in Warsaw and Łódź.
Analyzing the individual hours of April 2020 in relation to the hours of April 2019, in the case of traffic stations, it can be seen that the concentration decreased significantly between the morning and evening hours. In many cases, it was over 50%. The highest concentration values were usually measured around 8 p.m. Where, during the lockdown there was an increase in NO2 concentrations, it appeared especially in the morning hours (5–7 a.m. in the case of Łódź and Wrocław). At background stations, the trend of changes was also quite similar. Night, morning, and evening hours’ mean higher NO2 concentrations in April 2020 were compared to this month a year earlier (even by almost 100%, as in the case of Warsaw around 10 p.m.) and lower in the middle of the day—between 10 and 6 p.m. in many locations the average NO2 concentration was approximately 5–7 µg/m3 and was even nearly 90% lower than a year earlier (for example: in Kraków, between 5 and 6 p.m.).
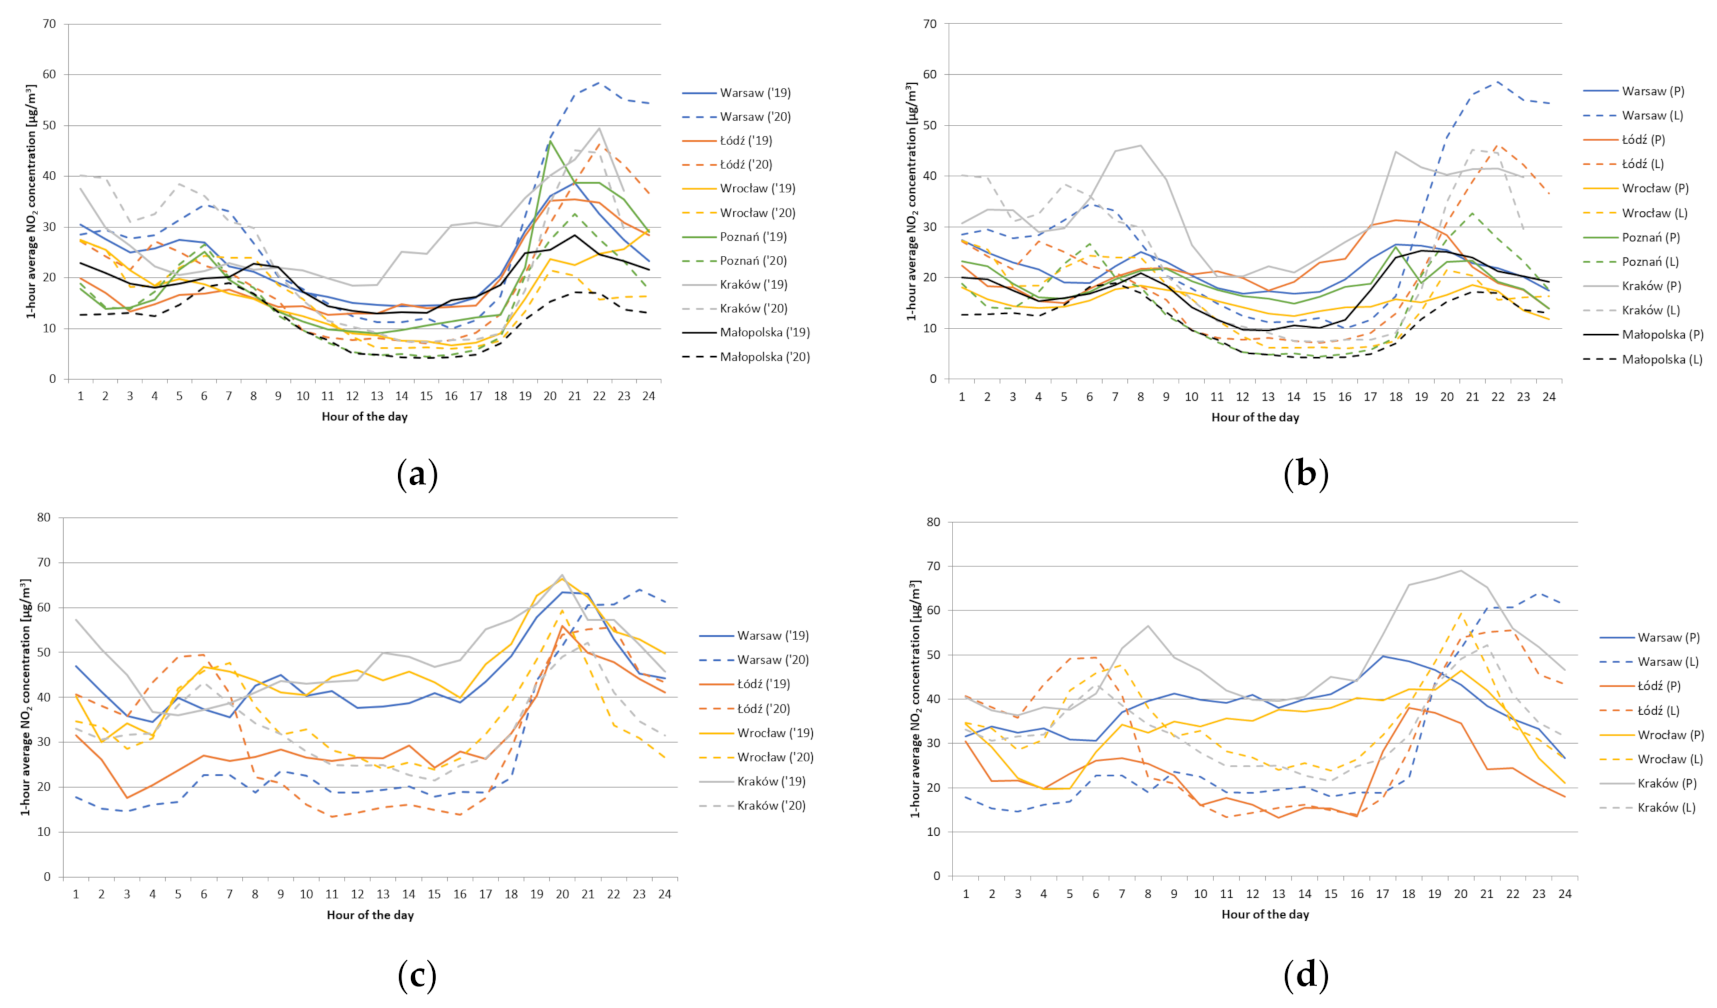
3.3. Sundays
The daily variation of PM
10 and NO
2 concentrations for Sundays in April 2019, April 2020, in the lockdown, and pre-lockdown period is presented in
Figure 5 and
Figure 6.
In the case of large cities (excluding Kraków), regardless of the type of station, a significant increase in the PM10 concentration can be observed in the first half of the day comparing the lockdown period with the pre-lockdown period. In some cases, such as at traffic and background stations in Łódź, PM10 concentrations during the lockdown in these hours increased by over 200%. The second half of the day, at both types of stations and in all major Polish cities (except Kraków), is comparable, and at some hours there was a slightly lower level of PM10 concentrations compared to the pre-lockdown period. Of the four largest cities, the largest differences were observed in Łódź and the smallest in Poznań.
Completely different nature of changes in PM10 concentrations took place in the case of Kraków and the Małopolska voivodship. At the traffic station in Kraków, during the lockdown on Sundays, lower PM10 concentrations were recorded practically for all hours compared to the pre-lockdown period. On the other hand, at the background stations in this city, the concentration levels were very similar—at some hours they were slightly higher, at others slightly lower. A similar tendency was also observed at the remaining background stations in Małopolska.
Comparing the PM10 concentrations from April 2020 to April 2019, the scale of changes is the smallest. In total, there was a decrease in PM10 concentrations on Sundays, while it was mainly caused by background stations in Wrocław and Poznań. In many other locations (background stations), there was a slight increase in PM10 concentrations. By analyzing the changes in individual hours, it can be observed that the increase in emissions during the lockdown took place from night hours almost until noon (the highest ratio in Warsaw—even by 100%). In the afternoon and evening hours, PM10 concentrations during April 2020 were usually lower than the year before. The most similar concentration courses took place in the case of Małopolska.
In the case of PM2.5 pollution, in most locations (apart from the traffic station in Kraków), it increased, especially in the morning hours. For example, at background stations in Warsaw, from between 8 a.m. and 12 a.m. the increase was over 100%. At the same time, in the afternoon and evening hours at most stations during the lockdown, the level of pollution decreased compared to the pre-lockdown period. Similar conclusions can be stated if we compare April 2020 with April 2019. The overall change was small—the decreases in concentration values prevailed, the largest of which took place at traffic stations in Warsaw and Wrocław. In contrast, the highest increase in PM2.5 concentration was measured at the traffic station in Łódź.
On the other hand, in the case of NO2, in most locations, significant drops in concentrations were observed during the lockdown compared to the pre-lockdown period and to April 2019. The only exceptions were stations in Łódź (when compared to the pre-lockdown period) and background stations in Warsaw, where an increase in concentrations was recorded. It is worth noting that the drops in NO2 concentrations on Sundays during the lockdown were the largest among all the drops in pollution concentrations (both in the case of a comparison to the pre-lockdown period as well as to April 2019). The record-holder was Kraków, where at the traffic station the NO2 concentration was reduced by more than a half, and at the background stations—by almost a half, when compared to the pre-lockdown period. Comparing April 2020 to April 2019, the greatest reduction in NO2 concentration took place in Wrocław.
When analyzing individual hours, usually the biggest reduction took place in the afternoon. This was the case even in Warsaw and Łódź, where, although in total there was an increase in NO2 concentration, it was mainly caused by an increase in concentrations at night and in the morning. In the case of Kraków and Małopolska, the reduction of NO2 concentrations occurred at all hours of the day (both in the case of comparing the lockdown period with the pre-lockdown, as well as April 2020 and April 2019).
4. Discussion
When we compared April 2019 with the same month of the previous year, despite comparable average temperatures (usually slightly over 1 °C lower in April 2020), changes in the trend of changes in the concentrations of the analyzed pollutants would not be so obvious. However, it is worth paying attention to traffic stations in Krakow, in which anti-smog resolution was introduced on 1 September 2019. Before the introduction of the anti-smog resolution, for several years there had been funding, e.g., through the city, the process of replacing old coal furnaces for residents. Undoubtedly, therefore, the significant reduction in the concentration of almost all pollutants (the greatest of which in the case of NO2), which took place on all days of the week, was influenced by the elimination of the most harmful sources of low emissions. In the case of other locations, despite the ongoing replacement of old coal furnaces, an increase in PM10 concentration was visible. Warsaw is a good example here. In addition, in this city, at the background stations, especially at the weekend, there was a significant increase in NO2 concentration. Apart from the capital and the background stations in Małopolska (including Kraków), it was precisely in the case of NO2 that the concentrations of this pollutant decreased the most compared to a month earlier. Taking into account the individual hours of the day, it can be seen that in many cases, higher concentrations in April 2020 prevailed during the night hours. It could have been caused by lower temperatures than the year before. On the other hand, during the day (between the morning and evening rush hours), in most locations and in most day types, the concentrations of both PM10 and NO2 were lower than the year before. The exception here is Małopolska, where on Sundays, during all hours of the day, PM10 concentration in April 2020 was higher than the year before.
Comparing the pre-lockdown to the lockdown period, it can be noticed that the trend of changes in PM
10 concentration in most cases was completely different than in the case of NO
2 or PM
2.5. PM
10 concentration has increased in most locations and during most types of weekdays, although, as shown in
Table 3, the temperatures in April were a few degrees higher than in February the same year. In this regard, a particularly high increase (both percentage and absolute values) at both types of stations and on all types of weekdays took place in Warsaw. During the pandemic, for most days, the daily average at the traffic station exceeded 50 µg/m
3, and at background stations, it was approximately 33 µg/m
3. The smallest percentage increase (in terms of all days of the week and types of stations) took place in Małopolska (including Kraków). On the other hand, in terms of absolute values, the lowest values before and during the lockdown were observed at background stations in Wrocław and Poznań.
Interestingly, during both the pre- and the lockdown periods, the highest average values of PM10 concentrations in almost all locations and types of stations were observed on Saturdays. In some locations, working days were in second place, and in some locations—Sundays. On the other hand, in terms of the scale of the increase in PM10 pollution, the greatest differences were observed on working days—by over 50% on average. The percentage increase on Saturdays and Sundays was very similar and amounted to approximately 30%.
In the case of NO2 concentration on all types of days of the week, during the lockdown, there was a decrease in pollutants. The highest was on Sundays, even though before the start of the pandemic, the value of NO2 concentration on this type of day of the week was the lowest. A fairly comparable reduction in the level of pollution took place on Saturdays and working days.
The trend of changes was not the same everywhere, however. A significant increase in NO2 concentration (similar to PM10) was observed in the traffic station in Łódź. In this city, NO2 concentrations during the lockdown at background stations were quite similar to the period before the pandemic. It can be concluded that in the context of this locality, the lockdown period in most cases caused an increase in PM10 and NO2 concentrations. It was the only place among the analyzed towns where such a change took place.
In the case of Warsaw, there was a decrease in NO2 concentration at the traffic station, while a significant increase in the concentration of this type of pollutant took place at background stations (even by 60% on Sundays). In most of the other locations, NO2 concentration decreased. The most favorable changes took place at the traffic station in Kraków. Only on working days was there a slight increase in PM10 concentration. On other types of days of the week and in the case of NO2 during the lockdown period, the pollutant concentration was lower than before. A balanced decrease in NO2 pollution took place in Małopolska—on all types of lockdown weekdays, they decreased by about 1/3.
The above data on the most important air pollutants in Poland would indicate a decrease in road traffic (decrease in NO2 concentration in most locations, especially at traffic stations; both comparing April 2020 to April 2019 and the lockdown period to pre-lockdown period) and in some places a possible increase of emissions from other sources. Taking into account the reduction of economic activity during the lockdown (e.g., slowing down or stopping the work of factories and industrial plants), it means that the source of the increase in PMs concentration were home furnaces (an increase in PM10 concentration in most locations compared to the pre-lockdown period despite higher temperature in April 2020 compared to February 2020).
To confirm this, the available analyses of changes in road traffic were analyzed. For this purpose, it was not possible to use the official measurements from the General Traffic Measurement (GPR) conducted by Polish General Directorate for National Roads and Motorways, because such a report will be published at the earliest in the fourth quarter of 2021. Therefore, the analysis used data and reports made available, inter alia, by popular providers of navigation applications for mobile phones (including TomTom, Yanosik).
TomTom has published the Traffic Index [
47]—a report showing the traffic situation in 2020, in 416 cities from 57 countries. Although there were no major changes in the ranking of the most congested Polish cities, in all twelve Polish cities included in the report, congestion levels decreased during the pandemic (by an average of 5%), and during rush hours by an average of as much as 15%. Globally, the level of clogging has decreased by almost 19%. The largest annual decrease in congestion on Polish roads was recorded in Poznań (by 13%), Warsaw (by 9%), and Kraków (by 9%). Despite this, Łódź, Kraków and Wrocław were still the first three of the most congested cities with up to 800,000 residents in Europe.
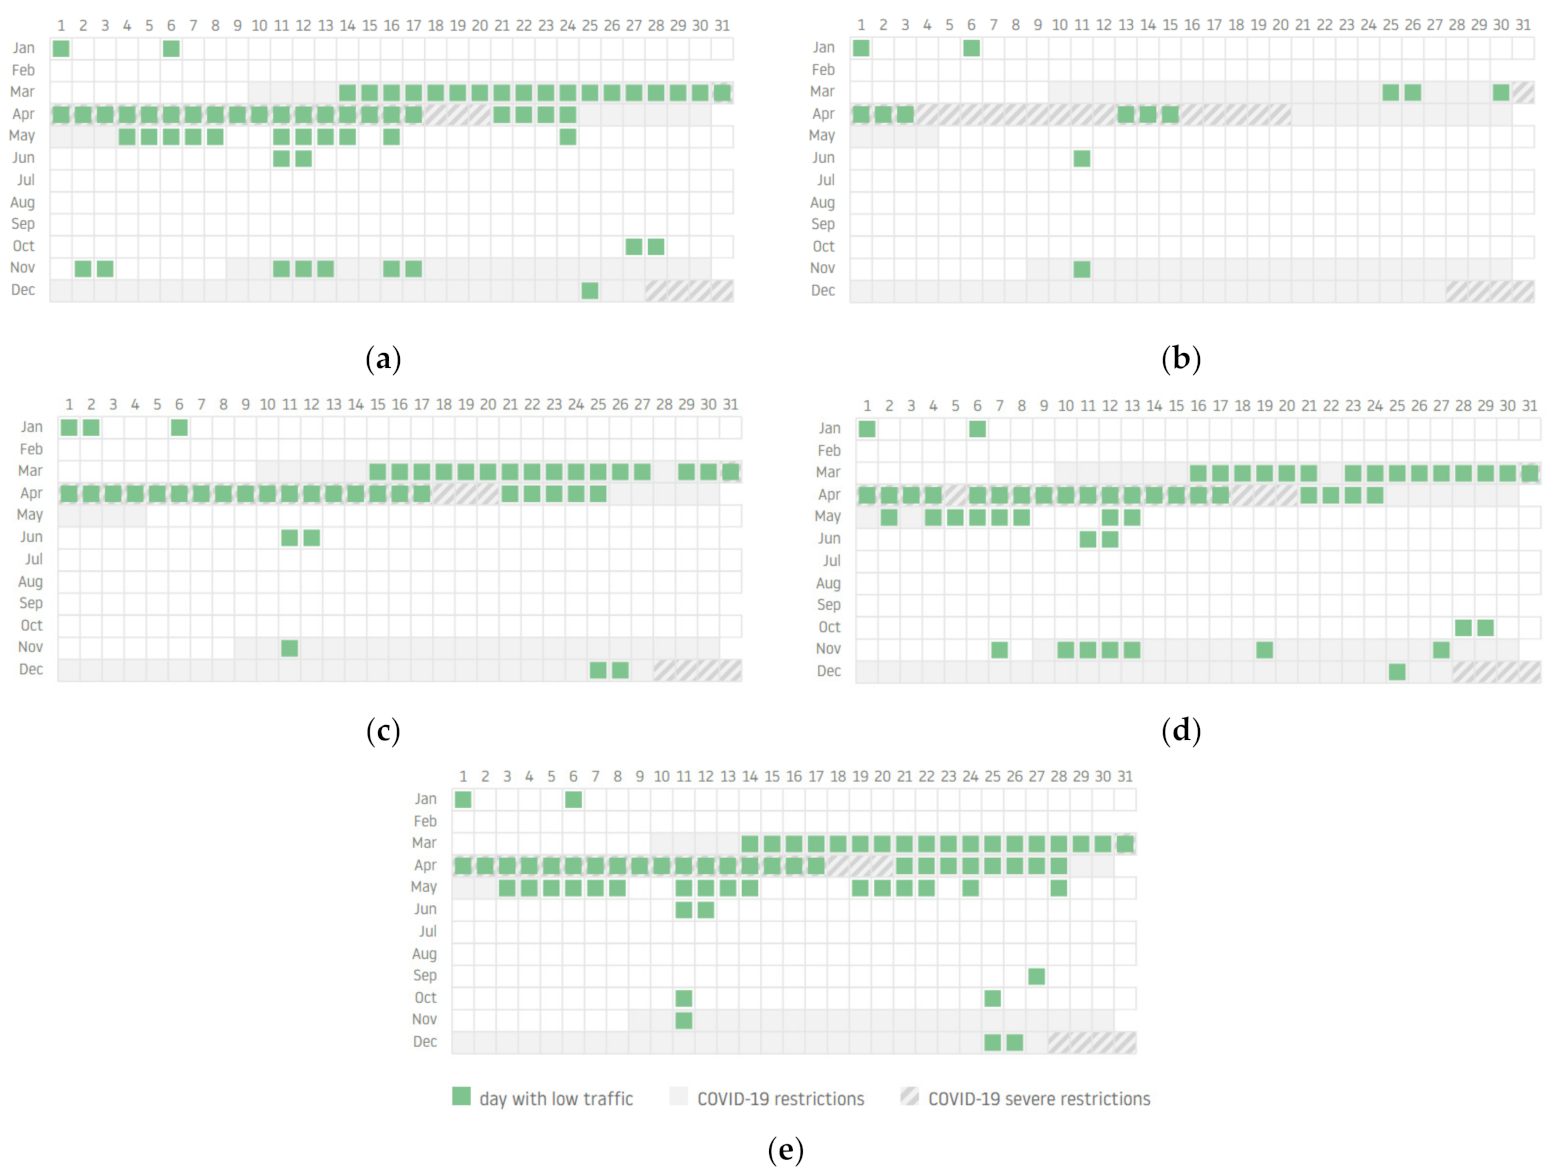
Analyzing the data from the above-mentioned report, it can be seen that most days with low traffic intensity (including all working days) took place during the analyzed lockdown (
Figure 7).
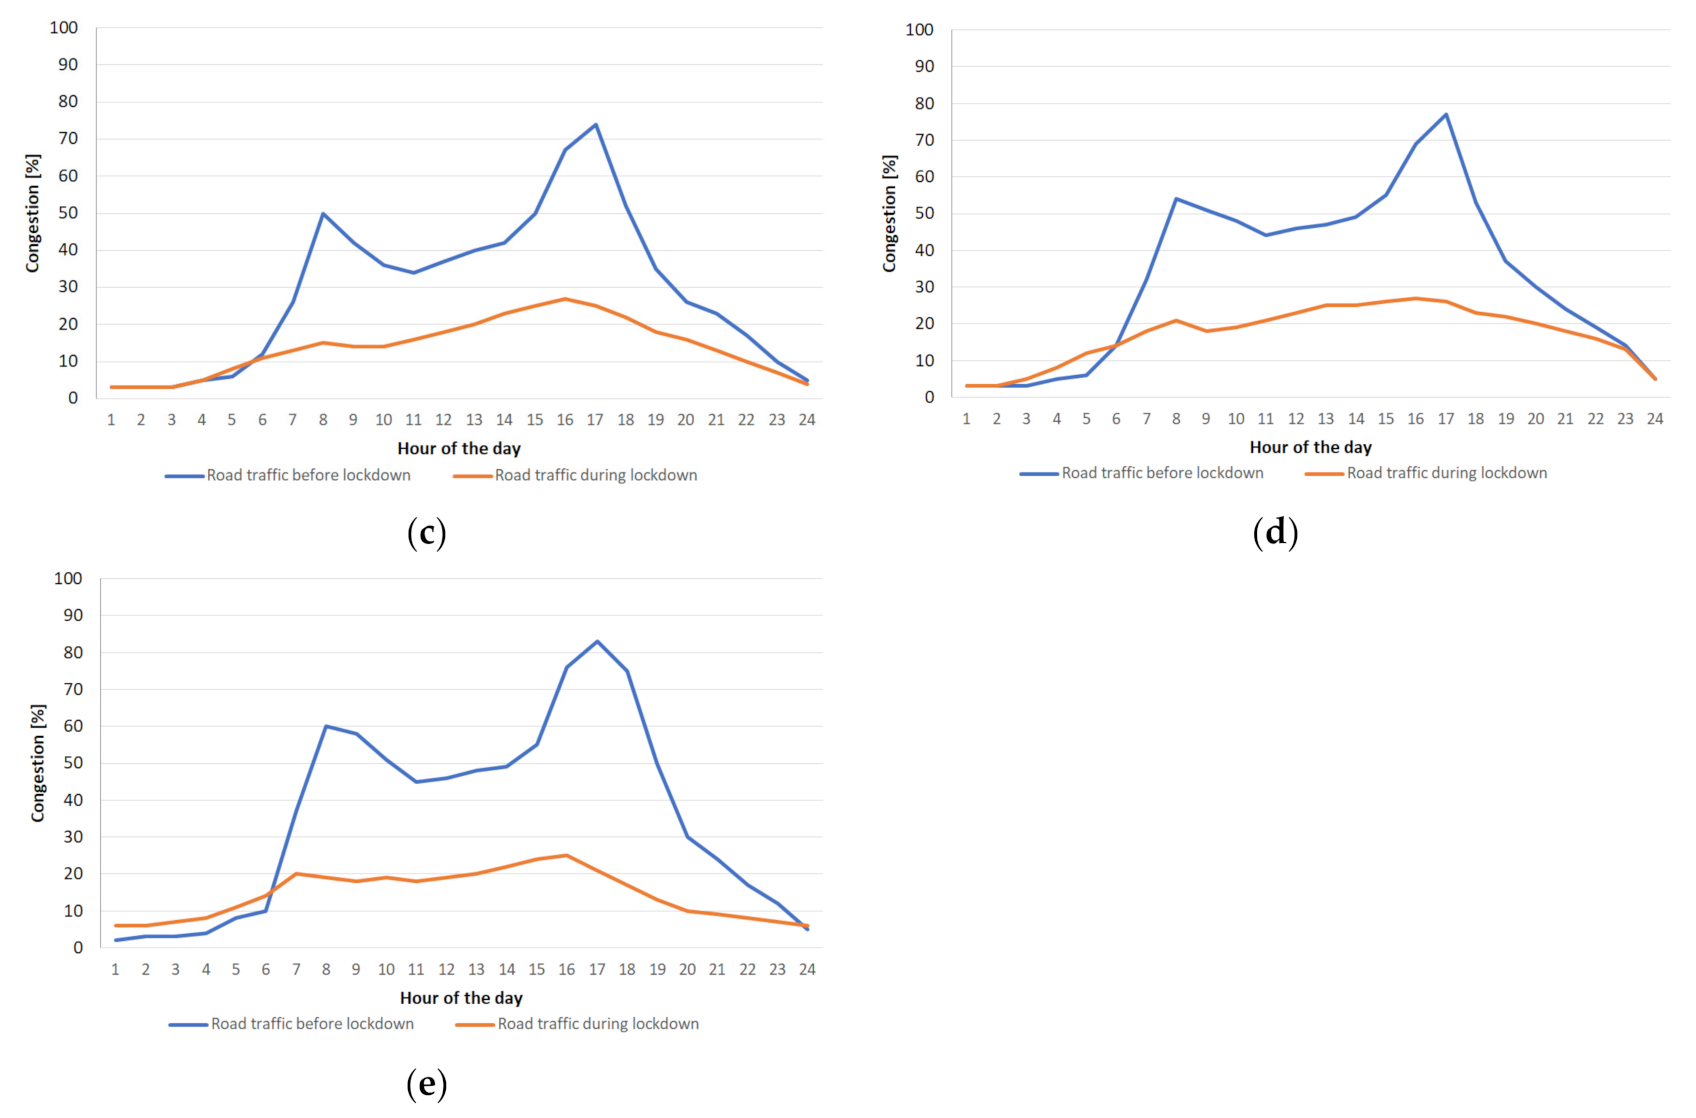
A significant reduction in traffic volume during the month with a lockdown can also be seen in the graph showing the traffic volume in April 2020 in the largest Polish cities compared to April a year earlier (
Figure 8).
Figure 8 shows that the degree of traffic reduction was not identical between cities. A relatively smaller reduction occurred, inter alia, in case of Łódź and Wrocław. Another indicator related to the uneven decline in road traffic in the largest cities is the number of low-traffic days—
Table 9. It can be seen that the city where traffic decreased most often was Kraków, and the city where traffic decreased least often was Łódź.
A significant decrease in road traffic during the pandemic was also indicated by the mobile marketing agency Spicy Mobile and the operator of the application for drivers—Yanosik [
48]. According to this research, the results from the six largest cities in Poland are unambiguous—car traffic decreased. This is evidenced by the increase in average speed, which can be explained by smaller traffic jams. The drivers going through the streets of Warsaw could feel the most change in road traffic. In the capital city, the average speed during the lockdown increased by 28% from 40 to 51 km/h. For the analysis, the average speed on the day the epidemic was announced in Poland, i.e., on March 20, was compared with last year’s result for the same period. Drivers in Poznań also experienced a significant change in traffic. In the capital of Wielkopolska, the average speed on the road increased by as much as 25% from 40 to 50 km/h. Even during the lockdown, car traffic did not decrease significantly in Łódź—the average speed in this city increased by only 7% to 46 km/h.
The road traffic structure was also handled by engineers from the Transport Engineering Department of the Road and Greenery Authority in Gdynia [
49]. Their analysis included, inter alia, a period of several weeks of quarantine, during which educational institutions, shopping malls, and service points were closed, and there were restrictions on the use of public transport. For their study, they used data from the TRISTAR system, under which they continuously measure traffic using vehicle presence detectors at intersections with traffic lights.
The comparative analyses performed in 12 critical points of the road system concerned 5 weeks of COVID-19 restrictions in Poland (March–April 2020), which were compared to the average values from the three weeks before the restrictions were introduced. In all the analyzed sections, against the typical values, the traffic decreased on weekdays by: from 28% to 37% in the first week of the restrictions, from 35% to 39% in the second week, from 35% to 39% in the third week, from 30% to 35% in week four, 33% to 39% in week five. On Saturdays and Sundays, road traffic decreased compared to typical values: 54% on the first weekend, 61% on the second weekend, 57% on the third weekend, 69% on the fourth weekend, and 69% on the fifth weekend.
As emphasized by the authors of the report, the declines in traffic volume concerned mainly passenger cars. Traffic measurements show that trucks continued to regularly use the main access roads, e.g., to the port of Gdynia. Other interesting conclusions were as follows:
- -
There were still clear rush hours for commuting. Percentage, the smallest declines occurred during the peaks—from 10% in the morning to 30% in the afternoon;
- -
Shorter peaks were observed, a clear decrease in traffic in the following hours after the busiest hours (7–8 a.m. and 3–4 p.m.) than in the period before the restrictions were in force;
- -
Between 8 p.m. and 12 p.m. the percentage of traffic decreased the most during the day (over 50% decrease in the value of traffic intensity). Nevertheless, during the night hours (8:00 p.m.–6:00 a.m.), the traffic decreased slightly (changes in the order of several dozen vehicles per hour in a given direction);
- -
On the fourth weekend, due to Easter, the traffic volume was significantly lower compared to the previous weekends. The greatest drops in intensity were recorded between 12 a.m. and 7 p.m. A particularly large drop in traffic compared to the previous weeks took place on Sunday;
- -
The percentage decrease in traffic on weekends between 8 a.m. and 11 p.m. was approximately constant—approximately 55% this before the lockdown. In the hours between 11 p.m. and 5 a.m., it was bigger (up to 80% before the lockdown), and in the hours between 5 and 8 a.m., it was smaller (except for the holiday weekend, it did not exceed 40%).
By combining data on measurements of air pollution concentrations with data on reducing road traffic, confirmation could be found regarding the impact of less road traffic on the reduction of pollution typically originating from transport. The NO
2 concentration can be taken as the main indicator for this. A particularly large difference can be seen in the case of Małopolska (including Kraków). The situation is different in the case of PM concentration. The difference between the trends of PM
10 and PM
2.5 may be due to the different sources of the two particles and their different aerodynamics. PM
2.5 comes mainly from the combustion of fossil fuels such as car exhaust fumes, coal combustion, etc. PM
10, in turn, can come from industrial chimneys, dust from construction sites, and fine particles resulting from the interaction of sulfur oxides and nitrogen oxides in the air [
34]. In Poland, the most important source of PMs (in particular PM
10) is low emission.
The data indicate that the lockdown period caused, in many of the analyzed locations in Poland, a very large increase in the level of pollution from sources other than transport—in Polish conditions, mainly from low emissions. In the case of some stations in Warsaw and Łódź, the data shows an almost 100% increase (e.g., PM10, compared to the pre-lockdown period). It should also be borne in mind here that these total increases were reduced by reducing emissions from smaller road traffic. It can be assumed that if the level of road traffic remained unchanged, the increase in PM10 and (to a lesser extent) PM2.5 concentrations would be even higher.
The second factor proving that the lockdown in Poland caused a significant increase in air pollution, especially PM
10 in the biggest cities is the fact that in April all locations had higher air temperatures than in February. Analyzing the data in
Table 7,
Table 8 and
Table 9, it can be stated that the average temperature increased by approximately 5 °C. It can be assumed that if the meteorological conditions in April were the same as in February and taking into account the fact that the main source of emissions in Polish cities is fuel combustion processes (used, for example, to heat houses), then the increase in PM
10 emission would be even higher.
In the case of NO
2, the trend of changes in most locations in Poland is consistent, for example, with the changes indicated in the EEA report [
41] mentioned in the introduction, changes in Brazil indicated in [
50], or in China [
51]. The infamous exceptions in Poland (where an increase in NO
2 concentrations was observed) were Warsaw and Łódź. For other pollutants, the lockdown period caused an increase in pollutant concentrations, which was the opposite trend than in many other places around the world. For example, in [
52] it was indicated that in the City of Buenos Aires the decrease in PM
10 and NO
2 concentration was about 30% each, in [
53] it was reported that PM
2.5 concentration in Athens decreased by almost 20%, according to [
54] in A Coruña and Vigo the concentrations decreased from 25% to 49% for PM
10 and from 10% to 38% for PM
2.5, and in North Italy comparing the periods February–May 2020 to February–May 2019 the reduction in case of NO
2 was over 30% [
55].


