
Mitigation of Odor and Gaseous Emissions from Swine Barn with UV-A and UV-C Photocatalysis
by
 , , , and
Myeongseong Lee
1 ,
,
Jacek A. Koziel
1,* ,
,
Wyatt Murphy
1,
William S. Jenks
2,
Baitong Chen
1,
Peiyang Li
1 and
Chumki Banik
1 1
Department of Agricultural and Biosystems Engineering, Iowa State University, Ames, IA 50011, USA
2
Department of Chemistry, Iowa State University, Ames, IA 50011, USA
*
Author to whom correspondence should be addressed.
Atmosphere 2021, 12(5), 585; https://doi.org/10.3390/atmos12050585
Submission received: 24 March 2021
/
Revised: 28 April 2021
/
Accepted: 28 April 2021
/
Published: 1 May 2021
(This article belongs to the Collection Livestock Odor Issues and Air Quality)
Abstract
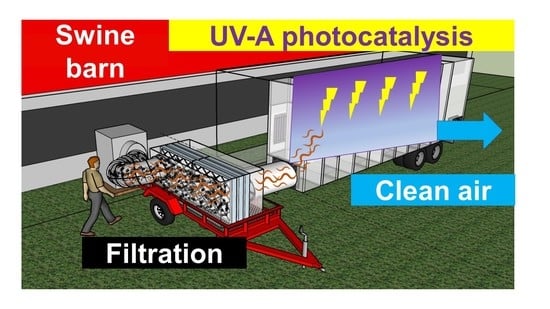
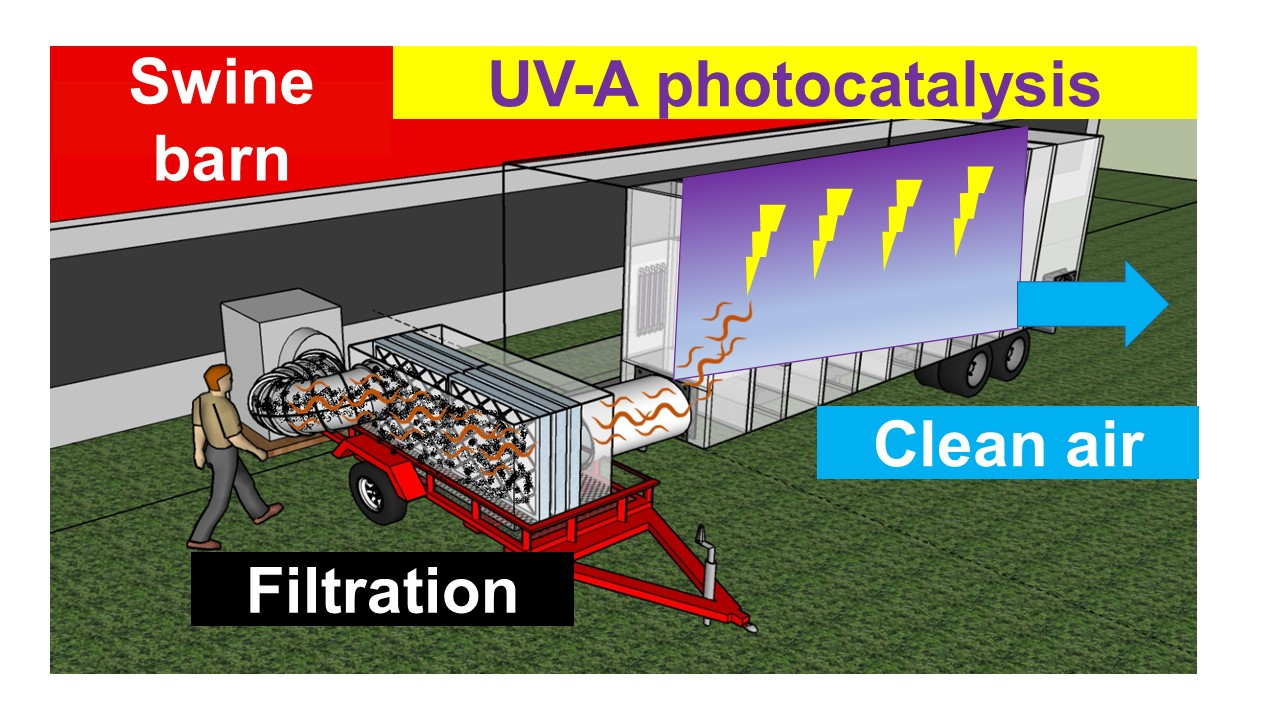
:UV-A (ca. 365 nm wavelength, a.k.a. ‘black light’) photocatalysis has been investigated to comprehensively mitigate odor and selected air pollutants in the livestock environment. This study was conducted to confirm the performance of UV-A photocatalysis on the swine farm. The objectives of this research were to (1) scale-up of the UV-A photocatalysis treatment, (2) evaluate the mitigation of odorous gases from swine slurry pit, (3) test different UV sources, (4) evaluate the effect of particulate matter (PM) and (5) conduct preliminary economic analyses. We tested UV-A photocatalysis at a mobile laboratory-scale capable of treating ~0.2–0.8 m3·s−1 of barn exhaust air. The targeted gaseous emissions of barn exhaust air were significantly mitigated (p < 0.05) up to 40% reduction of measured odor; 63%, 44%, 32%, 40%, 66% and 49% reduction of dimethyl disulfide, isobutyric acid, butanoic acid, p-cresol, indole and skatole, respectively; 40% reduction of H2S; 100% reduction of O3; and 13% reduction of N2O. The PM mitigation effect was not significant. Formaldehyde levels did not change, and a 21% generation of CO2 was observed. The percent reduction of targeted gases decreased as the airborne PM increased. Simultaneous chemical and sensory analysis confirmed that UV-A treatment changed the overall nuisance odor character of swine barn emissions into weaker manure odor with ‘toothpaste and ‘mint’ notes. The smell of benzoic acid generated in UV-A treatment was likely one of the compounds responsible for the less-offensive overall odor character of the UV-treated emissions. Results are needed to inform the design of a farm-scale trial, where the interior barn walls can be treated with the photocatalyst.
1. Introduction
Ultraviolet (UV) light ranges between 200 to 400 nm in the electromagnetic spectrum adjacent to the purple band, invisible to the human eye. The UV range is conventionally separated into wavelength ranges, labeled A, B and C, corresponding to progressively shorter wavelengths. UV-A (~315–400 nm) is considered the least toxic and is used in consumer product applications such as commercial indoor tanning. UV-B (280–315 nm) mainly affects the redness and burning of the skin layer. UV-C (200–280 nm) is considered the most effective to inactivate microorganisms. In practical applications, UV-C is typically associated with ‘germicidal’ 254 nm irradiation, though formally, it stretches to the shortest wavelengths in the range.
UV treatment can be considered for both ‘end-of-pipe’ (treating a point-source exhaust air from mechanically-ventilated barns) and source-based (e.g., improving the indoor air quality inside the barn) applications. UV treatment can be classified as either direct photolysis (i.e., mitigation primarily via direct absorption UV light by the ambient gases) or photocatalysis (i.e., mainly via surface reactivity based on catalyst activation by the UV light). With its relatively long wavelength, fewer pollutants directly absorb UV-A and thus it is generally less effective than using the same wavelengths with a photocatalyst designed to operate by UV-A absorption [1,2]. Photocatalysis is commonly facilitated on surfaces coated with nanosized titanium dioxide (TiO2), which is considered reasonably durable and cost-efficient [3,4,5].
Selected publications report developing and testing UV treatment of selected odorous gases on a lab-scale for both UV-A [1,6,7,8,9,10,11] and UV-C [12,13,14]. In the lab-scale experiments, the percent reduction varied depending on the coating’s thickness, the coating material, temperature, relative humidity, dust accumulation and the UV wavelength. Statistically significant mitigation of NH3, H2S, N2O, O3 and VOCs was shown [1,6,7,8,9,10,11,12,13,14]. Pilot-scale studies with UV-A photocatalysis showed effective mitigation of measured odor (~63%), p-cresol (~49%), skatole (~49%), indole (~66%), H2S (~40%), butan-1-ol (~41%), O3 (~100%), N2O (~14%) and NH3 (~11%) in the swine and poultry barn [2,15,16,17,18,19].
Only two studies (published in 2008 and 2012) have been conducted at a farm-scale [20,21] for evaluating the mitigation of NH3, CH4, CO2 and PM concentrations inside swine nurseries by utilizing UV-A. While these pioneering tests conducted in Italy showed auspicious results, it is still necessary to test whether UV-A photocatalysis is effective for other swine housing types and management systems farm conditions. We have been scaling up the UV-A technology to farm-scale trials to provide the necessary data on the performance (e.g., the percent reduction) and treatment economics.
Lee et al., (2021) designed, built and tested a UV mobile laboratory for treating up to 1.25 m3∙s−1 of air with UV-A and TiO2 photocatalyst [18]. Then, we tested UV-A photocatalysis to mitigate fast-moving gases emitted from swine manure using the mobile laboratory [19]. Significant percent reduction for measured odor (~63%), p-cresol (~41%), indole (~20%), butyric acid (~48%), propionic acid (~51%), butan-1-ol (~41%), N2O (~14%) and NH3 (~11%) were reported.
Thus, the next logical step was to test the UV mobile lab at a farm-scale. We used TiO2-based UV photocatalysis by connecting the mobile lab to one of the continuous fans that remove gaseous emissions from stored manure pit under slatted-floor swine barn. We aimed to evaluate the on-farm-scale efficacy of UV photocatalysis performance in mitigating odorous gaseous emissions using swine barn exhaust air. The effects of several variables were tested: (a) UV dose, (b) different wavelengths (UV-A and UV-C), (c) effect of suspended PM and (d) preliminary economic analyses.
The results are needed to notify the design of farm trials and applications, where the interior barn walls are sprayed with the photocatalyst, and the foul indoor air will be passively treated as it moves through the barn.
2. Materials and Methods
2.1. Experimental Mobile Laboratory Setup
The mobile laboratory [18] designed for evaluating the performance of UV photocatalysis was used in this study. The mobile laboratory consisted of a series of 12 flow-through chambers (7.2 × 0.9 × 2.4 m), and each chamber (0.5 × 0.9 × 2.4 m) was divided by vertical baffles to maximize the UV dose. Each chamber was equipped with 11 wall panels coated with TiO2 (nanostructured TiO2 anatase at 10 μg∙cm−2 from PureTi, Cincinnati, OH, USA) on all sides. Here, 2 fans (I-Fan Type 40, Fancom, Panningen, The Netherlands) were installed to control the treated airflow through the mobile laboratory. The airflow was measured with the anemometer fan (ATM, Fancom, Panningen, The Netherlands), and the internal airflow was controlled in real-time using the fan monitoring system (Lumina 20/21, Fancom, Panningen, The Netherlands), the 2 fans and the anemometer fan.
The mobile laboratory and filtration unit were installed at a swine farm (Figure 1). The rationale for using the filtration ahead of UV treatment was to separate UV and filtration effects on the mitigation of odorous gases. While farm-scale UV treatment is relatively novel, mechanical filtration is also rarely researched. It is essential to note that the PM is a carrier of sorbed odorous compounds [22] and pathogens. The filtration kept the UV chambers clean for the initial phases of this research. However, the filtration was later removed to test the effectiveness of UV treatment with a realistic PM load in the treated air (see Results).
The mobile laboratory was connected to the airflow from the pit fan to a T-shape connector (Figure 1) capable of discharging the excess air. A flexible duct was used to channel the treated air into the filtration unit and the mobile lab. The minimum treated airflow was 0.28 m3·s−1 (facilitating 52 s UV treatment time from inlet to outlet in the mobile laboratory). The maximum treated airflow was 0.78 m3·s−1 (enabling 19 s UV treatment time from inlet to outlet in the mobile laboratory).
The UV-A (light-emitting diode; LED) lamps installed inside the mobile lab were the same as the previous pilot-scale experiment [18]. Additional 110 lamps were installed in chambers #2 and #3, and a total of 50 lamps were installed in the remaining ten chambers (#1 and #4–#12). The treatment was controlling the UV dose (a product of treatment time and UV irradiance). The effect of UV wavelengths was investigated by installing different UV wavelength lamps in chamber #2 only and using that chamber for side-by-side comparisons, similarly to the process described in the previous pilot study [19]. Figures S2–S7 (Supplementary Material) illustrate the details of the UV mobile lab.
2.2. Swine Farm
Testing was conducted at the Iowa State University AG450 Farm (Ames, IA, USA) from May to early July 2020. The swine farm was a finishing operation facility with about ~350 pigs. Pigs started at ~18–23 kg (40–50 lbs) a few weeks before the study initiation and followed the finishing diet. Animal stocking density was 0.56–0.62 m2 head−1. The farm used a manure pit ventilation system in which fans’ flowrate was not controlled. The manure pit of the experimental farm was divided into four independent headspaces. The approx. manure depth in the pit was 2.4 m (8 ft). While the animals were present inside the barn, the study did not use animals, nor were they exposed to UV light.
2.3. UV Sources
The mitigation of targeted gases was investigated using 4 different light sources (UV-A: 367 nm and UV-C: 254 nm, 222 nm or 185 + 254 nm, Supplementary Materials Figure S5). Here, 2 low-pressure mercury sources (American Ultraviolet Co, Lebanon, IN, USA) were used, both of which emit strongly at 254 nm, but 1 additionally contains a small 185 nm component because the bulb is made from special materials that allow transmission of that line. The emission spectrum of low-pressure Hg lamps is well known, and these sources both also contained small emissions at 365 nm and other wavelengths common to all of these bulbs. Nonetheless, we refer to these as 254 nm or (185 + 254) nm light sources. An excimer source (Ushio America Inc., Cypress, CA, USA) emitting at 222 nm was the third source. The fourth source was an LED with emission centered at 367 nm lamps (T8 LED, Eildon Technology, Shenzhen, China), near the 365 nm range that Hg lamps commonly were used for, but without disadvantages of Hg-based lamps.
The UV-A LED (367 nm) consumed 16 W per lamp. Here, 2 UV-C (254 nm and 185 + 254 nm) bulbs were mounted in 1 15A UV fixture (American Ultraviolet Co, Lebanon, IN, USA). The power consumption of 1 15A UV fixture was 30 W. The UV-C excimer (222 nm) lamp was a single-bulb system with a customized power supply and its nominal power consumption of 300 W.
2.4. Measurement of Odor
Gas samples were collected from the inlet and outlet sampling ports (Figure 1) inside the UV mobile lab into 10 L Tedlar bags using a Vac-U-Chamber and sampling pump (both from SKC Inc., Eighty-Four, PA, USA). Tedlar bags were pre-cleaned by flushing with clean air three times before use. Odor samples were analyzed using a dynamic triangular forced-choice olfactometry (St. Croix Sensory Inc., Stillwater, MN, USA) following the ASTM E679-19 [23]. Four trained panelists at two repetitions each were used to analyze each sample, presented from low to increasingly lower dilutions to the point of consistent odor detection. All the samples were analyzed within 6 h of sample collection.
2.5. Measurement of Odorous VOCs
The VOC samples were collected in 1 L gas sampling glass bulbs from gas sampling ports (Figure 1). An internal standard (hexane) was used to minimize variability in sampling and sample preparation. All the samples were analyzed with a GC-MS within 12 h of sample collection. A 2 cm DVB/Carboxen/PDMS solid-phase microextraction (SPME) fiber (Supelco, Bellefonte, PA, USA) was used to extract VOCs from the glass bulbs for 50 min, then the SPME fiber loaded with VOCs inserted in the GC injector set at 260 °C. The analysis was completed using a custom multidimensional gas chromatography (GC, Microanalytics, Round Rock, TX, USA) built on Agilent 6890N (G1530N) (Agilent Technologies, Santa Clara, CA, USA), mass spectrometer (MS, same manufacturer), olfactometer (mdGC-MS-O). The GC oven temperature was programmed at the initial 40 °C for 3 min, followed by ramping up to 240 °C at 7 °C·min−1, maintained for 8.43 min. The quadrupole MS used 70 eV ionization energy and the 34–350 m·z−1 scan range.
For evaluating the performance of UV photocatalysis on targeted VOCs, treated gas samples were analyzed in the selected ion mode (SIM mode) because of its higher sensitivity and lower detection limit, compared to the total ion chromatogram (TIC) mode. Pure standards of all 15 VOCs were analyzed and calibrated [24] to verify the VOCs’ retention time. The VOC concentrations were not quantified. A surrogate metric of VOC abundance (measured with peak area counts, PACs) was used to assess UV treatment performance by comparing the VOC abundance in the treatment and control.
2.6. Simultaneous Chemical and Sensory Analysis of Aromas and Odors in UV-Treated Gas
UV treatment changed the characteristic smell of barnyard air into a less offensive overall odor. Chemical analysis by GC-MS was used to evaluate the gas compounds and linking them to the aroma generated or mitigated after the UV photocatalysis. The sample collection and analysis were similar to that described in the previous paragraph. The trained panelist’s nose evaluated separated compounds eluting from the sniff port to record and build the aromagram [22]. The chemical analysis data were analyzed using Chemstation ver. D.02.00.275 (Agilent Technologies, Santa Clara, CA, USA). The aroma characterization was done using AromaTrax ver. 10.1 (Microanalytics, Round Rock, TX, USA). The mdGC-MS-O system was used in full heartcut mode with a total run time of 40 min for TIC and SIM. The olfactometry part of the instrument was used during this analysis. Aromagrams for odor intensities were generated using AromaTrax software, recorded, and generated by the 3 panelists. The odor intensity reported was on a scale of 0%–100%, where 0% was the minimum, and 100% was the maximum. Odor characters recorded/reported by the panelist were verified with published odors descriptors [22,25].
2.7. Measurement of Ozone Concentrations
An O3 detector was connected to the monitoring system (Series 500 monitor, Aeroqual, New Zealand) and installed at the gas sampling ports when in use. The detector was factory-calibrated to the 0–50 ppb detection range (Gas Sensing, IA, USA) and certified before use.
2.8. Measurement of Greenhouse Gas (GHG) Concentrations
Methane (CH4), carbon dioxide (CO2) and nitrous oxide (N2O) were measured as those are often mitigated or generated by UV treatment. GHGs samples were collected using syringes and 5.9 mL Exetainer vials (Labco Limited, High Wycombe, UK) and were analyzed for concentrations on a GC equipped with FID and ECD detectors (SRI Instruments, Torrance, CA, USA). Samples were analyzed on the day of collection. Standard calibrations were constructed daily using 10.3 ppm and 20.5 ppm CH4, 1005 ppm and 4010 ppm CO2, and 0.101 ppm and 1.01 ppm N2O. 99.999% He was used for calibrating the 0 ppm baseline (Air Liquide America, Plumsteadville, PA, USA).
2.9. Measurement of Ammonia and Hydrogen Sulfide Concentrations
NH3 and H2S concentrations were measured with a real-time analyzer (OMS-300, Smart Control & Sensing, Daejeon, Korea) calibrated with high precision standard gases (5-point dilution, R2 = 0.99). The analyzer was equipped with NH3/CR-200 and H2S/C-50 electrochemical gas sensors (Membrapor, Wallisellen, Switzerland), NH3/CR-200 (0 to 100 ppm) and H2S/C-50 (0 to 50 ppm), respectively. OMS-300 collects the sample (2 L·min−1) required for an electrochemical sensor via an internal pump, then shows the voltage output from the sensor via a Raspberry Pi (Raspberry Pi Foundation, Caldecote, UK).
2.10. Measurement of Formaldehyde Concentration
Formaldehyde (a carcinogenic air pollutant) is of concern in the context of photochemical reactions, and thus, was incorporated into the list of targeted gases. A gas sampling pump kit (model GV-100S, Gastec Corp., Tokyo, Japan) was used for formaldehyde gas detection. The concentration of formaldehyde was measured by a detector tube (Ivyland, PA, USA) within the 20–400 ppb range, Figure S8.
2.11. Measurement of Particulate Matter Concentration
PM’s concentration was measured using TSI Dusttrak (Monitor 8533, Shoreview, MN, USA). The PM concentration was measured simultaneously while the targeted gas was being measured. At 5 s intervals, airborne PM concentration was recorded by size (PM 1, PM 2.5, ‘respirable’ size = PM 4–PM 10, PM 10 and total PM).
2.12. Evaluation of Treatment Effectiveness and Data Analysis
The mitigation effect was evaluated by the overall mean percent reduction for each targeted gas was estimated using [18,19]:
where: CCon and CTreat are the mean measured concentrations in control and treated air, respectively. For odor and odorous VOCs, odor units (OUE∙m−3) and MS detector responses (peak area counts, PAC) were used.
%R = (Ccon − CTreat)/Ccon × 100
Emissions were calculated as a product of measured gas concentrations and the total airflow rate through the UV mobile lab, adjusted for standard conditions and dry air using collected environmental data. The overall mean emission of each measured gas was estimated as [18,19]:
where: C = the mean measured target gas concentration in control and treated air (mL·m−3, OUE·m−3). V = the treated airflow rate (m3·min−1). MW = the molecular weight of the targeted gas (g·mol−1). T = the temperature in control and treated air in Kelvin. The 2.24 × 10⁴ is an ideal gas conversion factor (R = 0.082057 L∙atm/mol∙K) for L to dm3 at 273.15 K and 1 atm [18].
Emission (g·min−1) = C × V × (273.15 K × MW)/[T × (2.24 ×·104)]
The electric energy consumption during UV treatment was estimated using the measured power consumption by lamps [18,19]:
where: EEC = electric energy consumption (kWh). P = measured electric power consumption for the UV lamps turned ‘on’ during treatment (W). ts = treatment time for air irradiated with the UV lamps that were turned ‘on’ inside the mobile lab (s).
EEC = P × ts/(3600 × 1000)
The mass of mitigated gas pollutant (M) with UV during given treatment time (ts) was estimated by comparing gas emission rate (E) in treatment and control [18,19]:
where: M = mass of mitigated gas pollutant (g). Econ = emission rate at the ‘control’ sampling location. Etreat = emission rate at the ‘treatment’ sampling location.
M = (Econ − Etreat) × ts/60
The electric energy of UV treatment (EE, kWh·g−1) was estimated as using electric energy consumption (EEC) needed to mitigate a gas pollutant mass (M) [18,19]:
EE = EEC/M
Finally, the estimated cost of electric energy (Cost) needed for UV treatment was estimated using the mean cost of rural energy in Iowa (0.13 USD·kWh−1) [18,19]:
where: Cost = estimated cost of electric energy needed for UV treatment to mitigate a unit mass of pollutants in the air (USD·g−1).
Cost = EE × 0.13 USD/kWh
UV dose was estimated using measured light intensity (I) at a specific UV wavelength (mW·cm−2) and treatment time (ts, s). Since the photocatalysis reaction was assumed to be the primary mechanism for the target gas mitigation, the light intensity irradiated on the TiO2 surface was used. For lamps emitting light at multiple UV wavelengths, the UV dose was calculated using the light intensity of the primary wavelength suggested by the lamp manufacturer [18,19];
where: UV Dose = energy of the UV light on the surface of photocatalyst (mJ·cm−2).
UV dose = I × ts
2.13. Statistical Analysis
All measurements are replicated with at least three samples. The control (untreated exhausted gases) and the treatment (UV treated gases) were measured and analyzed at the same time for each condition on the same day. The R studio (version 3.6.2; Boston, MA, USA) was used to analyze the mitigation of the targeted standard gases. The UV dose and treatment time parameters between control concentration and treatment concentration (or PACs for VOCs) were analyzed using one-way ANOVA. The statistical difference was confirmed by obtaining the p-value through the Tukey test. A significant difference was defined for a p-value < 0.05.
3. Results
3.1. Mitigation of Odor and Targeted Gases as a Function of UV-A Dose
The following sections report on the mitigating effect of the controlled UV dose. The dose was controlled by adjusting the light intensity (I) and treatment time (ts) (Equation (7)). I was 0.04 mW·cm−2 when 50 lamps were turned ‘on and, at times, boosted to 0.14 to 0.41 mW·cm−2 by turning on the additional 110 lamps. The ts was controlled using three airflows (0.28, 0.50 and 0.78 m3·s−1). Two values of ”Light intensity” and “Treatment time” in Table 1, Table 2, Table 3, Table 4 and Table 5 represent both “measured value in chambers 1–12 except for chamber 2–3” and “measured value in chamber 2–3 which have additional lamps”. One “UV dose” which the treatment received is the sum of two light intensities and treatment times.
3.1.1. Measured Odor
UV-A photocatalysis significantly mitigated odor emissions from swine barn. UV dose ≥ 4.0 mJ·cm−2 showed a statistically significant percent reduction of odor (Table 1). There was no significant improvement between 4.0 ~ 5.3 mJ·cm−2 doses, suggesting that a low dose is economical. The likely reason for the lack of apparent improvement for the higher dose is the odor measurement method itself (by dilution only), which accounts for the odor ‘concentration’ without considering VOCs’ actual photochemistry and changes to the odor offensiveness. UV is also known to generate VOCs that might be impactful odorants, and therefore, the overall odor concentration is not solely sufficient to evaluate the mitigation effect. Evaluation of targeted odorants and linking them to specific aromas is shown in the subsequent sections.
3.1.2. Volatile Organic Compounds
UV-A photocatalysis showed a significant odorous VOCs mitigation (Table 2). UV dose ≥ 4.0 mJ·cm−2 partially removed four to six targeted VOCs. The highest dose (5.3 mJ∙cm−2) resulted in a statistically significant percent reduction of dimethyl disulfide (62%), isobutyric acid (44%), butanoic acid (32%), p-cresol (40%), indole (66%) and skatole (49%).
The mitigation of odorous VOCs was consistent with the results presented for odor (Table 1). A statistically significant odor reduction was found for higher UV doses in which several targeted VOCs were reduced, e.g., the phenolic compounds.
It is important to highlight the generation of some targeted compounds for all UV doses. Generated compounds (several in the VFAs group, DMDS and phenol) are odorants that are considered slightly less impactful than p-cresol, skatole and indole [19]. Thus, it is feasible to hypothesize that the generated compounds offset the overall odor’s mitigation (Table 1).
3.1.3. Greenhouse Gases
The percent reduction of N2O was statistically significant for UV-A dose ≥ 2.9 mJ∙cm−2 (Table 3). There was no significant increase to the percent reduction between 4.0 and 5.3 mJ∙cm−2 dose. Remarkably, UV-A mitigates this potent GHG at the farm-scale up to 13%. The results are consistent with the earlier work at the lab- and pilot-scales at swine and poultry barns [1,2,16,19].
3.1.4. Hydrogen Sulfide and Ammonia
Interestingly, H2S showed a significant percent reduction (up to 26%) at the highest UV-A dose. No mitigation effect for NH3 was observed (Table S2). The results for NH3 are consistent with earlier work at the lab- and pilot-scales [1,2,16,19], where there was a slight (≤10%) percent reduction. On the other hand, no mitigation effect for H2S was observed in earlier work. Thus, the mitigation at the farm-scale is remarkable and deserves further investigation. The average concentration of H2S in the emitted (control) was 1.2 ppm, and NH3 was 22 ppm.
3.1.5. Formaldehyde
Formaldehyde was not detected in both the control and treatment sample groups (Figure S1). Therefore, formaldehyde was not produced above the detectable 20 ppb as a by-product of the UV-A photocatalyst’s reaction. These findings should be further investigated with a more sensitive detection method as formaldehyde is classified as a carcinogenic air pollutant.
3.1.6. Particulate Matter
The PM percent reduction ranged from 9% to 55% for all tracked particulate size ranges, except for PM-1; however, the mitigation effect was not significant (Table 6). The measurements showed variation in PM concentration in the swine barn exhaust, which likely affected the lack of statistical significance. The significant reduction of PM with UV-A photocatalysis was demonstrated in the pioneering study by Costa et al. (2012) [21] and deserves to be investigated further, especially in the context of airborne pathogens.
3.1.7. Ozone
The concentration of O3 was measured while measuring other targeted gases. Ozone was undetectable in both control and treatment samples. Therefore, O3 reduction could not be investigated, but neither was it generated. In our earlier research on the lab- and pilot-scales, we reported up to complete (100%) mitigation of O3 that was naturally in the unirradiated samples [1,2,11].
3.2. Mitigation of Odor and Targeted Gases as a Function of UV Wavelength
The results comparing UV-A (367 nm) and UV-C (185 + 254, 222, and 254 nm) photocatalysis treatment are summarized below. Testing conditions were different than those in Section 3.1, especially because of the difference in UV wavelength and treatment time used. It needs to be noted that comparison is limited by relatively short treatment time. Only one chamber (#2) was used due to the limited number of available UV-C lamps that are more costly than UV-A [19].
3.2.1. Greenhouse Gases
Significant mitigation was measured for N2O, only with (185 + 254) nm lamps (Table 7); other wavelength lamps did show similar percent reduction, but it was not statistically significant due to the greater variability. There was no statistically significant mitigation of CH4 concentrations (Table S3). CO2 concentrations increased for all UV wavelengths tested (Table S4) but not with statistical significance.
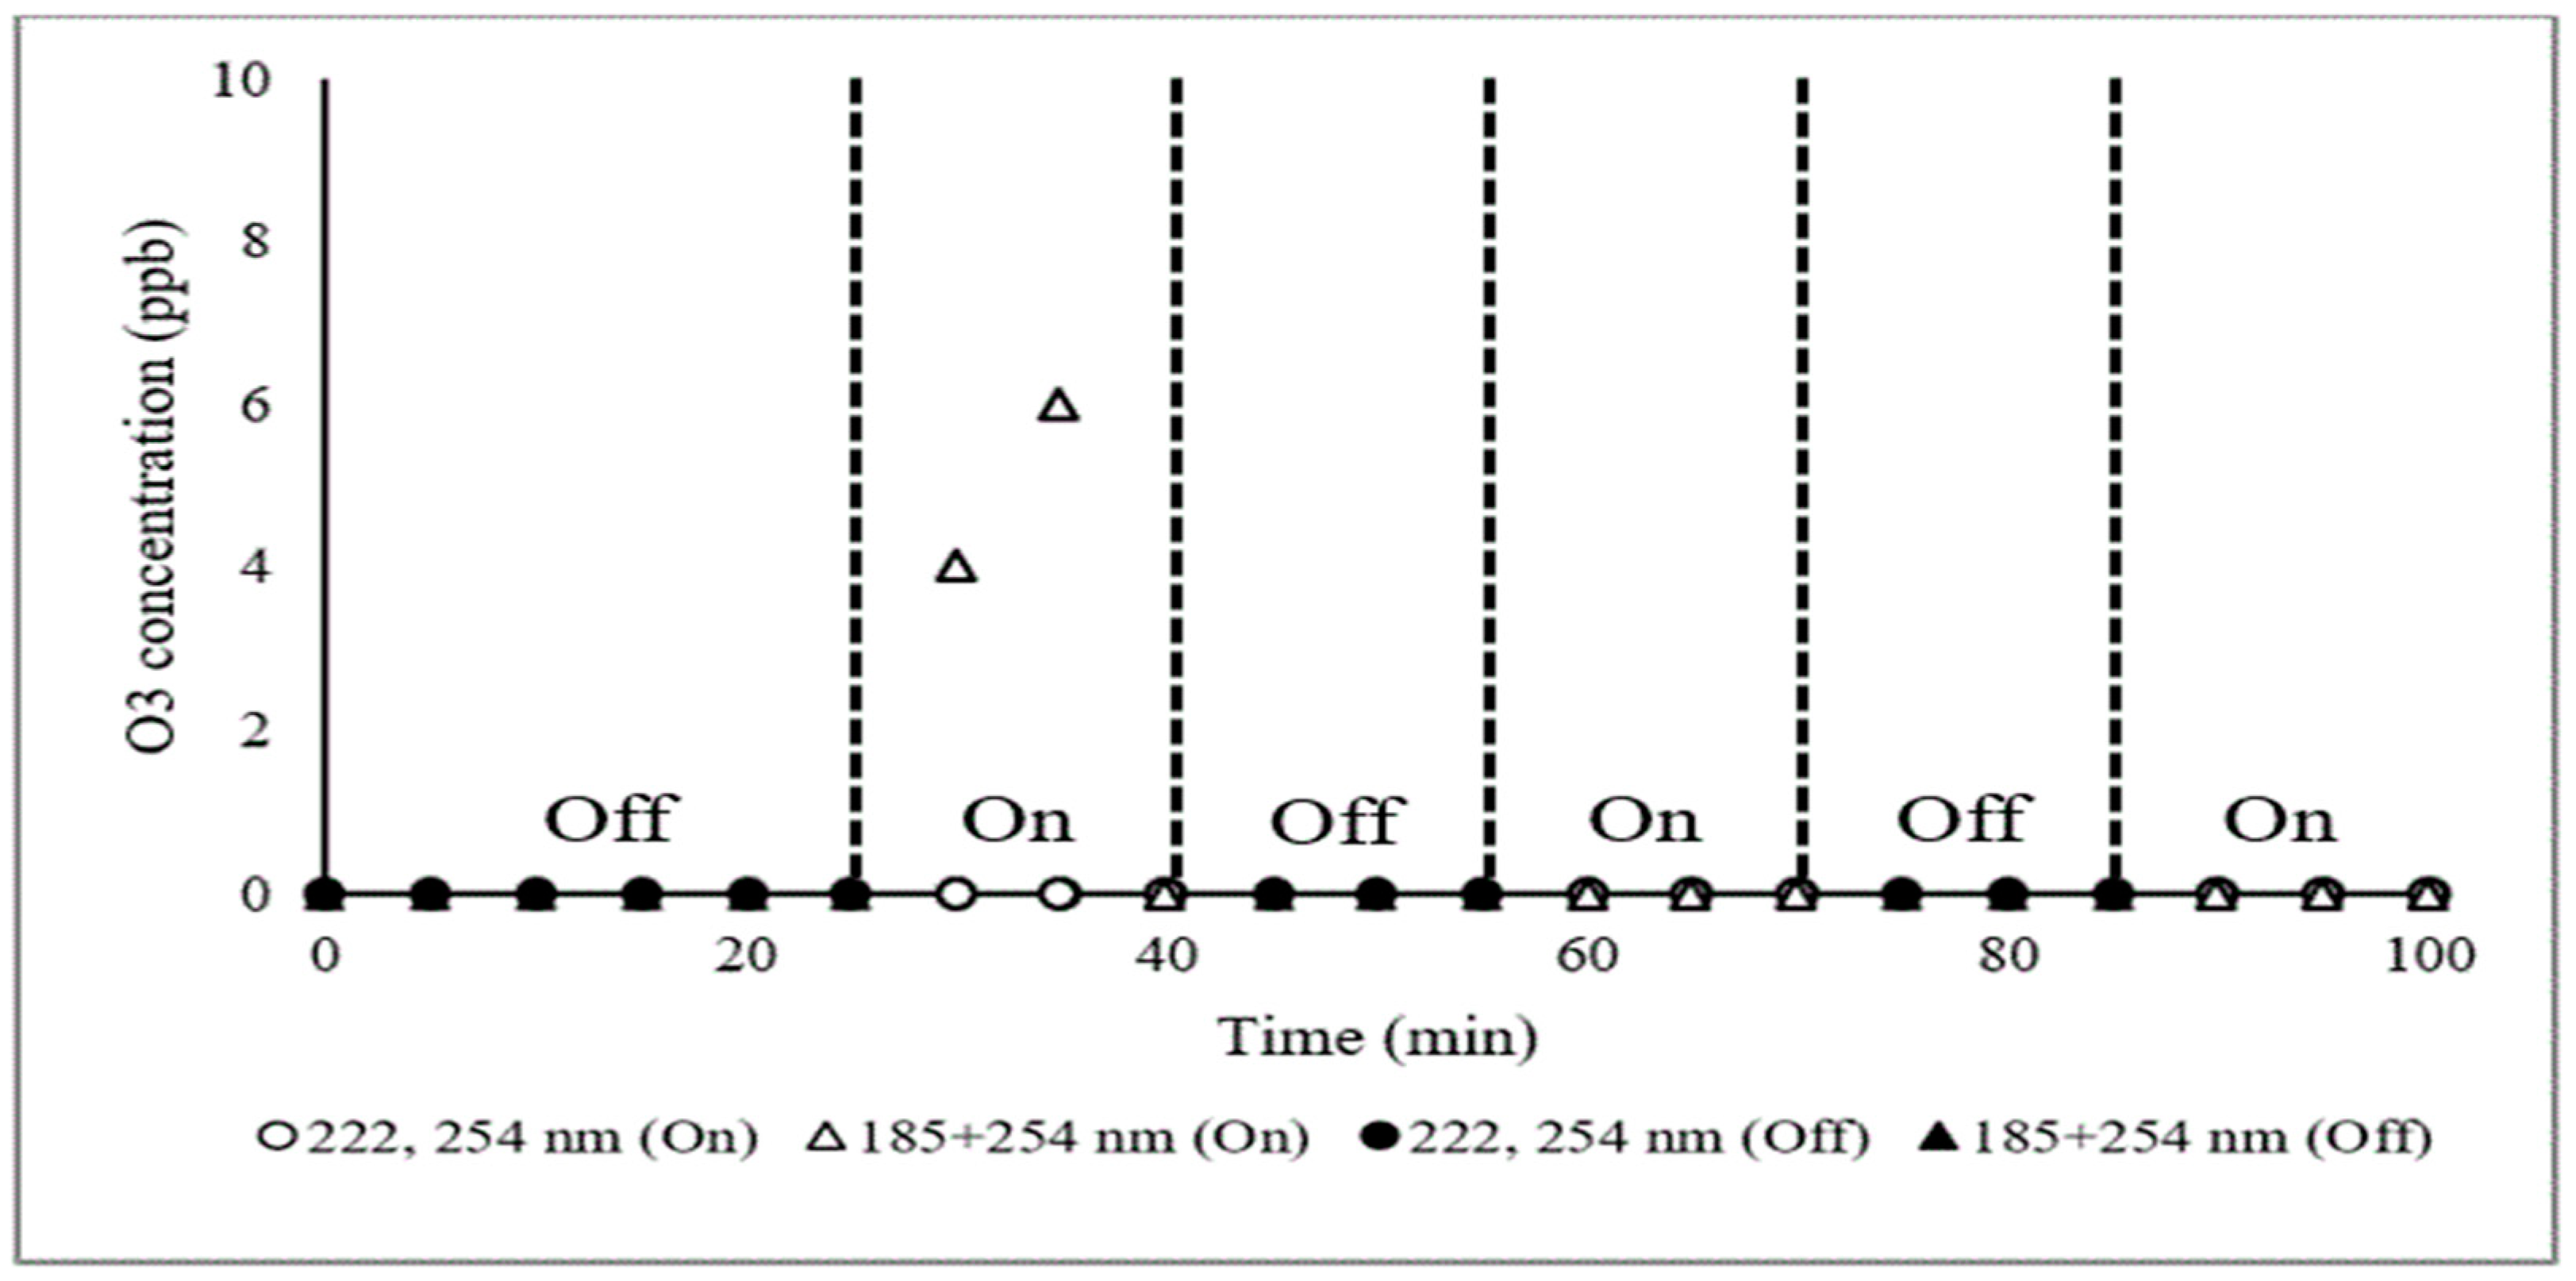
3.2.2. Ozone
No ozone was detected in any sample (detection limit approximately 1 ppb), except for when (185 + 254 nm) irradiation was used (Figure 2). This is certainly due to direct absorption of the shortest wavelength by ambient O2, resulting in homolysis and subsequent ozone formation [26]. Without ambient O3 in the samples, the question of mitigation is moot.
3.2.3. Measured Odor, VOCs, NH3 and H2S
There was no statistically significant odor mitigation, VOCs, NH3 and H2S for all UV wavelengths tested at relatively low doses used for direct comparisons (Tables S5–S8). This result is due to insufficient UV dose in one chamber used for side-by-side comparisons and this study’s limitation. This limitation could be addressed by refurbishing the entire UV mobile laboratory with one type of lamp, effectively allowing a more extensive range of doses to be tested (e.g., lower variability reported for UV treatment using an entire mobile lab with 12 chambers facilitating treatment). Therefore, further research is needed for the accurate evaluation of UV-C photocatalysis at a farm-scale.
3.3. Mitigation of Odor and Targeted Gases with UV-A Photocatalysis as a Function of PM Size and Concentration
This experiment allowed the examination of the effect of PM on UV-A photocatalysis. The UV-A was selected because the entire mobile lab uses UV-A photocatalysis. Thus, three different airborne PM conditions were achieved via air filtration before the UV treatment (Table 8). Section 3.1 and Section 3.2 report on results using the ’best-case‘ scenario where the MERV 8 and 15 filters removed 98% of incoming PM (to the Total PM = 0.004 mg∙m−3). Then the MERV 15 was removed and the MERV 8 filtered out 77% of incoming PM (to the total PM = 0.06 mg∙m−3). Lastly, MERV 8 was removed, and unfiltered swine barn exhaust discharged from the manure pit fan were subjected to the UV treatment (total PM = 0.22 mg∙m−3). This last experiment represents the ‘worst-case’ scenario, where there is no PM filtration to swine barn emissions. The subsections below report the UV effects on air with three different PM conditions (considered ‘control’ for UV treatment) (Table 8).
3.3.1. Greenhouse Gases—Effect of PM Size and Concentration
In the case of N2O mitigation, impressively, there was a statistically significant reduction, regardless of the different concentrations of suspended PM (Table 9). Additionally, the N2O percent reduction did not decrease even for the unfiltered worst-case scenario. CO2 was still generated under all PM conditions (Table S10), similar to the results reported in Table 4. CH4 did not significantly increase or decrease under the different airborne PM concentrations (Table S9).
3.3.2. Measured Odor—Effect of PM Size and Concentration
Significant (p < 0.05) odor mitigation was observed only under the lowest PM concentration (0.004 mg∙m−3; with MERV 8 and 15 filtration). The odor percent reduction decreased as the suspended PM concentration increased (Table 10). These results underscore the importance of PM as a carrier of sorbed odorous gases [22]. Mitigation of PM can result in an overall reduction of odor as an ancillary effect.
3.3.3. Volatile Organic Compounds—Effect of PM Size and Concentration
As the suspended PM concentration increased, the mitigation of VOCs decreased (Table 11). The three VOCs showed a statistically significant reduction under the lowest suspended PM concentration (0.004 mg∙m−3; with MERV 8 and 15 filtration). However, no statistically significant mitigation was observed under the worst-case scenario (no filtration, total PM concentration: 0.22 mg∙m−3). The odorous VOC mitigation was very similar to the result of the reduction of odor, i.e., underscoring PM’s importance as a carrier of sorbed odorous VOCs [22].
3.3.4. Hydrogen Sulfide and Ammonia—Effect of PM Size and Concentration
3.3.5. Ozone—Effect of PM Size and Concentration
The ‘control’ O3 concentration (5 ppb) was only detected with MERV 8 and 15 and resulted in 100% mitigation (Table 13). The detection of O3 in control was rare in this case (e.g., Section 3.1.7 and Section 3.2.2), and the concentration was relatively low. However, no ‘control’ O3 was detected at higher PM conditions (with MERV 8 and without filtration). Therefore, the mitigation of O3 as a function of suspended PM could not be estimated. One possible explanation for the lack of detectable O3 in control is that it could readily react with excess VOCs sorbed to PM.
3.4. Evaluation of the Leading Cause of Odor Offensiveness Reduction with UV-A Photocatalysis
We observed a significant change in the perceived overall odor ‘character’ (i.e., ‘what it smells like’) for UV-A-treated swine barn emissions. The research team working at the swine farm test site described the smell of UV-A treated air as a mix of a less-offensive ‘disinfectant’ or ‘swimming pool’ scents with a weaker smell of swine manure in the background. Therefore, we investigated which compounds (generated by UV-A treatment) were responsible for adding the less-offensive scents. It should be mentioned that neither the odor measurement (by dilution olfactometry, Section 2.4) or the mitigation of targeted VOCs (Section 2.5) could answer the key question of why the smell is subjectively less offensive. In general, the ‘disinfectant’ smell similar to ‘swimming pool’ would likely be preferred compared to raw swine manure, even if the odor concentration is the same.
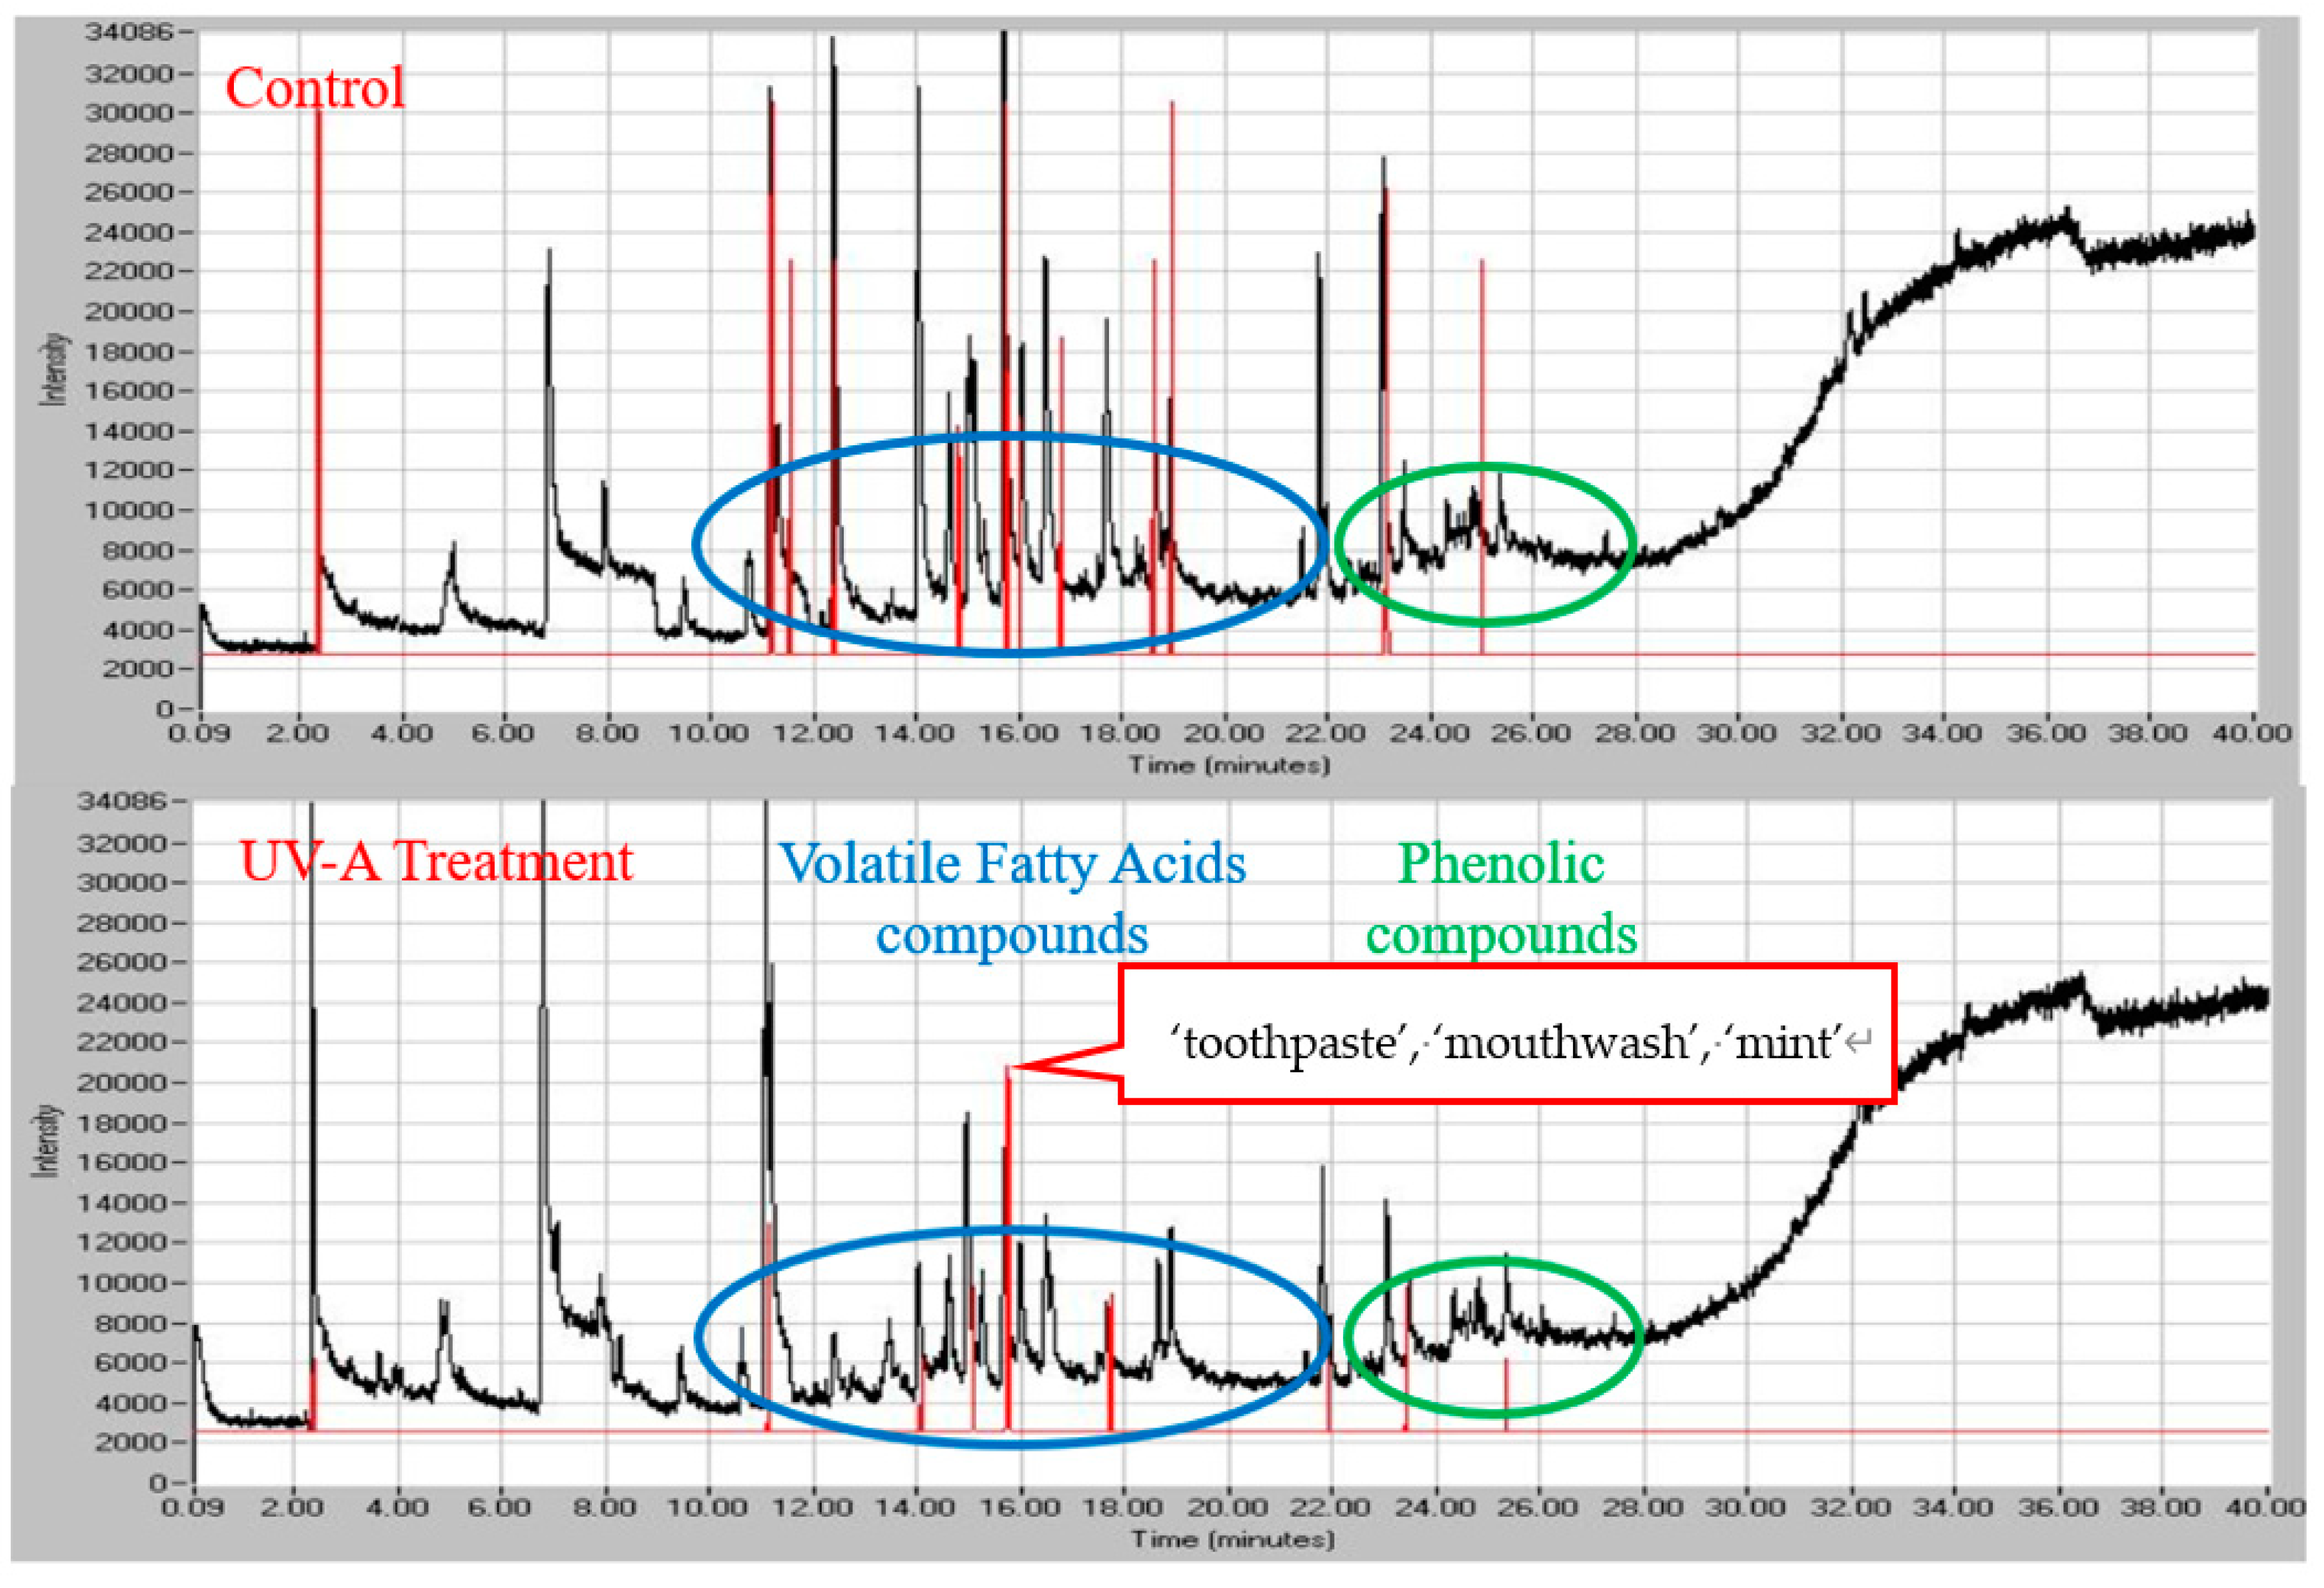
The initial assessment of the simultaneous chemical and sensory analyses (Figure 3) was consistent with the overall percent reduction of odor and odorous VOCs (Table 1, Table 2 and Table 11). The overlaid chromatograms (black lines) and aromagrams (red lines) illustrate the difference in the GC-separated peak number, height and areas between the control and UV-treated air for panelist 1 (results for panelist 2 and 3 are presented in Figures S1 and S2. The lower number of aromagram peaks and smaller peak heights are consistent with the weaker (less intense) smell of manure in the UV-A treated air.
The one compound (benzoic acid) generated in the UV-A photocatalysis is known to have the characteristic smell of ‘faint, pleasant odor’, which appears to be consistent with the panelist’s perception. Two panelists indicated that benzoic acid (eluting from GC column at ~15.6 min had a ‘toothpaste, mouthwash and pleasant’ smell and ‘mint, neutral’ smell, respectively (Table 14).
Benzoic acid is the oxidation product of common compounds with the C6H5–C in the structure, such as a toluene or other (mono) alkylbenzenes. Previous studies report on toluene present in the headspace of slurry pit manure [27,28]. The generation of VOCs with the UV treatment and the apparent reduction of the odor offensives associated with treated air deserves a follow-on experiment to make a comprehensive evaluation focused on the photochemical reactions, generation of other odorants, and the effect on odor.
4. Discussion
4.1. Summary of the UV-A Photocatalysis under the Livestock Environment
Table 15 summarizes previous research on the mitigation of selected gases via photocatalysis with UV-A in livestock-relevant context and conditions. The summary shows that UV-A photocatalysis yields significant reductions of targeted gases, but the magnitude varies for specific compounds.
The UV-A photocatalysis mitigates odor, VOCs, NH3, H2S, N2O and O3. Targeted gases were significantly reduced depending on the UV dose (the light intensity and the treatment time) and the catalyst coating thickness.
The mitigation of NH3 ranged from 6%–35% (UV-A dose: 5.8–970 mJ·cm−2). While the results were statistically significant, the mitigation effect was relatively low. The range of UV dose required to reduce NH3 varied, likely due to the different approaches used to estimate the UV light intensity (I) in each study. To be specific, the light intensity (I) in the previous papers was either (1) measured on the surface irradiated directly by the UV lamp (one-dimension aspect) or (2) averaged over all three-dimensions by the UV lamp. The 2nd approach was used to measure the light intensity in this study (as described in greater detail in [18]), but if the UV dose was calculated using the 1st method, it would increase to ~0.12 J·cm−2. Therefore, it is difficult to compare the UV doses measured in previous studies directly, but it is considered that a minimum of 5.8 mJ·cm−2 is required to reduce NH3. Furthermore, higher UV-A doses will likely be necessary to mitigate NH3 on the farm-scale (inside the barn).
The mitigation of H2S ranged from 4%–40% (UV-A dose: 0.6–5.3 mJ·cm−2). It is challenging to make an accurate comparison within previous research due to the differences in the TiO2 coating thicknesses and I (averaging over one vs. three dimensions). Several papers proved the mechanism of H2S oxidation with UV-A photocatalysis based on TiO2 coating [9,10,11]. However, it is not easy to propose an accurate UV dose to mitigate H2S based on the currently collected data. This is because the H2S concentration did not show significant mitigation with a higher UV dose on the lab-scale and a lower UV dose on the farm-scale, respectively. Mitigating H2S on the farm-scale could be confounded by interactions with other compounds or factors and should be investigated further.
N2O was consistently mitigated by 9%–14% under UV-A photocatalysis with 1.9 mJ·cm−2 or higher doses. There was no statistically significant change in CH4. A few papers reported significant decreases and increases in CH4 concentration, but most report random generation and mitigation regardless of the UV-A dose. Mitigation of CO2 was reported in fewer papers, while most report CO2 generation. In general, CO2 is the oxidative endpoint for photocatalytic decomposition of virtually all C-containing compounds under conditions like those used here, and thus UV-A is not expected to mitigate it.
The O3 showed more reduction at the farm and pilot scale (100%) than at the laboratory scale (48%). It is hypothesized that the O3 (if present) would be rapidly utilized by reactions with odorous VOCs present in actual farm conditions.
The mitigation of odor ranged from 32%–63% (UV-A dose: 2.5–5.8 mJ·cm−2). No statistically significant results were reported for conditions below 2.5 mJ·cm−2. While odor mitigation is significant, the results of standard odor measurements can be affected by sample losses. One concern is the use of Tedlar bags. The odor and specific odorous VOC losses in the Tedlar bag itself is documented [29,30,31]. The odor assessment community is generally aware of this challenge and follows the best practices to adhere to the standard method recommendations (e.g., minimizing the sample storage time between sample collection to sample analysis by a trained odor panel). While additional research on the accuracy of odor measurement is needed, the mitigation of odor by UV-A photocatalysis is significant.
Lastly, UV-A photocatalysis mitigated PM (9% to 55% for all tracked particulate size ranges, except for PM-1; however, the mitigation effect was not significant (Table 6). UV photocatalysis should be investigated further, especially in the context of synergistic effects for odor, gases and airborne pathogens. Li et al., (2021) [32] showed that UV-C (254 nm and 222 nm) is very effective in mitigating the transmission of airborne porcine reproductive and respiratory syndrome virus (PRRSV). In this research, UV-A was sensitive to airborne PM concentration. It is recommended that proper PM management should be considered simultaneously with UV-A photocatalysis in the swine farm. PM mitigation is expected to result in an ancillary percent reduction of odor and odorous VOCs that are likely sorbed and carried downwind.
4.2. Economic Analysis of the UV-A Photocatalysis
This research provided economic analysis data that can be considered for early assessment and extrapolating the UV-A photocatalysis in the livestock environment (Table 16). The estimated costs of electric energy needed to power the UV-A light and mitigate a unit of emissions varied considerably depending on the targeted gas treatment. Since odorous VOCs’ concentration in this study could not be investigated, economic analysis was not possible in that case. Considering the odor mitigation results, which are highly related to targeted VOC reduction, it is believed that odor and VOCs can be treated economically. This is an important finding as to the portfolio of mitigation technologies for the odor mitigation that is ready to be farm-tested is relatively small [33], and the economic analyses are relative and simplified [34].
The cost of mitigating NH3 and H2S (as stand-alone targeted air pollutants) appears to be prohibitive at this time. NH3 and H2S are emitted in tens of grams to kilograms quantity from the swine farms each day [35]. Thus, the estimated cost for complete mitigation is 50–1300 USD per day. The cost of N2O (emitted in mg–g per day) and O3 mitigation are relatively low at <10 USD per day. Continued research on N2O mitigation is warranted since mitigation of GHGs important in the context of climate change. While the N2O is mitigated, CH4 is not affected, and the CO2 is generated with UV-A. Thus, opportunities exist to evaluate the mitigation of total GHGs emissions in net carbon equivalents and how the UV-A technology could influence livestock agriculture’s climate policies.
5. Conclusions
We investigated UV-A photocatalysis treatment to mitigate gaseous emissions at the farm-scale. Specifically, we tested the UV-treatment at a mobile laboratory-scale capable of treating ~0.2–0.8 m3·s−1 of barn exhaust air. The targeted gaseous emissions were significantly (p < 0.05) mitigated up to:
- 40% reduction of odor
- 32%~66% reduction of key compounds responsible for downwind odor, i.e., dimethyl disulfide, isobutyric acid, butanoic acid, p-cresol, indole and skatole
- 40% reduction of hydrogen sulfide (H2S)
- 100% reduction of ozone (O3)
- 13% reduction of nitrous oxide (N2O)
- The PM mitigation effect was not significant.
No formation of formaldehyde was detected in these experiments. However, as expected under oxidizing conditions, additional CO2 was observed (up to 21%, p < 0.05).
The percent reduction of odorous targeted gases depended on the UV dose, UV wavelength and PM concentration in the air. Especially, the percent reduction of targeted gases decreased as the airborne particulate matter increased. The simultaneous chemical and sensory analysis confirmed that UV-A treatment changed the overall nuisance odor character of swine barn emissions into ‘toothpaste’ and ‘mint’. The smell of benzoic acid generated in UV-A treatment was likely one of the compounds responsible for the less-offensive overall odor character of the UV-treated emissions. Results are needed to inform the design of future real farm work, where the interior barn walls will be covered with the photocatalyst, and foul air will be passively treated as it moves through the barn.
Supplementary Materials
The following are available online at https://www.mdpi.com/article/10.3390/atmos12050585/s1, Detailed information about the percent reduction of targeted gases and experimental setup illustrated with Figures S1–S10 and Tables S1–S11. Figures S2–S8 are pictures of the UV mobile lab detailing its parts and experiments at a swine farm.
Author Contributions
Conceptualization, J.A.K. and W.S.J.; methodology, J.A.K.; validation, M.L., B.C. and J.A.K.; formal analysis, M.L., W.M. and B.C.; investigation, M.L. and W.M., B.C., P.L. and C.B.; resources, M.L., W.M., BC, P.L., C.B. and J.A.K.; data curation, M.L. and J.A.K.; writing—original draft preparation, M.L.; writing—review and editing, M.L., C.B., J.A.K. and W.S.J.; visualization, M.L.; supervision, J.A.K.; project administration, J.A.K. and W.S.J.; funding acquisition, J.A.K. and W.S.J. All authors have read and agreed to the published version of the manuscript.
Funding
This research was supported by Iowa Pork Producers Association Project #18-089 “Employing environmental mitigation technology and/or practices: Treating swine odor and improving air quality with black light.” In addition, this research was partially supported by the Iowa Agriculture and Home Economics Experiment Station, Ames, Iowa. Project no. IOW05556 (Future Challenges in Animal Production Systems: Seeking Solutions through Focused Facilitation) sponsored by Hatch Act and State of Iowa funds.
Institutional Review Board Statement
Not applicable.
Informed Consent Statement
Not applicable.
Data Availability Statement
The original contributions presented in the study are included in the article/Supplementary Materials; further inquiries can be directed to the corresponding author.
Acknowledgments
The authors gratefully acknowledge Skyler P. Rinker and Jacob Parr (Iowa State University) for help with farm testing at AG450, Woosang Lee (Smart Control & Sensing Inc.) for his help with the NH3 and H2S monitoring system.
Conflicts of Interest
The authors do not declare a conflict of interest. The funders did not play any role in the study design, data collection, analysis, interpretation and decision to write a manuscript or present results.
References
- Lee, M.; Wi, J.; Koziel, J.A.; Ahn, H.; Li, P.; Chen, B.; Meiirkhanuly, Z.; Banik, C.; Jenks, W. Effects of UV-A light treatment on ammonia, hydrogen sulfide, greenhouse gases, and ozone in simulated poultry barn conditions. Atmosphere 2020, 11, 283. [Google Scholar] [CrossRef] [Green Version]
- Lee, M.; Li, P.; Koziel, J.A.; Ahn, H.; Wi, J.; Chen, B.; Meiirkhanuly, Z.; Banik, C.; Jenks, W.S. Pilot-scale testing of UV-A light treatment for mitigation of NH3, H2S, GHGs, VOCs, odor, and O3 inside the poultry barn. Front. Chem. 2020, 8, 613. [Google Scholar] [CrossRef] [PubMed]
- Hashimoto, K.; Irie, H.; Fujishima, A. TiO2 photocatalysis: A historical overview and future prospects. Jpn. J. Appl. Phys. 2005, 44, 8269. [Google Scholar] [CrossRef]
- Schneider, J.; Matsuoka, M.; Takeuchi, M.; Zhang, J.; Horiuchi, Y.; Anpo, M.; Bahnemann, D.W. Understanding TiO2 photocatalysis: Mechanisms and materials. Chem. Rev. 2014, 114, 9919–9986. [Google Scholar] [CrossRef] [PubMed]
- Zaleska, A. Doped-TiO2: A review. Recent Pat. Eng. 2008, 2, 157–164. [Google Scholar] [CrossRef]
- Zhu, W.; Koziel, J.A.; Maurer, D.L. Mitigation of livestock odors using black light and a new titanium dioxide-based catalyst: Proof-of-concept. Atmosphere 2017, 8, 103. [Google Scholar] [CrossRef] [Green Version]
- Wu, H.; Ma, J.; Li, Y.; Zhang, C.; He, H. Photocatalytic oxidation of gaseous ammonia over fluorinated TiO2 with exposed (0 0 1) facets. Appl. Catal. B Environ. 2014, 152, 82–87. [Google Scholar] [CrossRef]
- Yao, H.; Feilberg, A. Characterisation of photocatalytic degradation of odorous compounds associated with livestock facilities by means of PTR-MS. Chem. Eng. J. 2015, 277, 341–351. [Google Scholar] [CrossRef]
- Portela, R.; Canela, M.C.; Sánchez, B.; Marques, F.C.; Stumbo, A.M.; Tessinari, R.F.; Coronado, J.M.; Suárez, S. H2S photodegradation by TiO2/M-MCM-41 (M = Cr or Ce): Deactivation and by-product generation under UV-A and visible light. Appl. Catal. B Environ. 2008, 84, 643–650. [Google Scholar] [CrossRef] [Green Version]
- Alonso-Tellez, A.; Robert, D.; Keller, N.; Keller, V. A parametric study of the UV-A photocatalytic oxidation of H2S over TiO2. Appl. Catal. B Environ. 2012, 115, 209–218. [Google Scholar] [CrossRef]
- Brancher, M.; Franco, D.; de Melo Lisboa, H. Photocatalytic oxidation of H2S in the gas phase over TiO2-coated glass fiber filter. Environ. Technol. 2016, 37, 2852–2864. [Google Scholar] [CrossRef]
- Rockafellow, E.M.; Koziel, J.A.; Jenks, W.S. Laboratory-Scale Investigation of UV treatment of ammonia for livestock and poultry barn exhaust applications. J. Environ. Qual. 2012, 41, 281–288. [Google Scholar] [CrossRef] [PubMed] [Green Version]
- Koziel, J.A.; Yang, X.; van Leeuwen, J.; Jenks, W.S.; Laor, Y. Treatment of odorous VOCs with ultraviolet light. Chem. Eng. Trans. 2010, 23, 363. [Google Scholar] [CrossRef]
- Nguo, M.F. Treatment of Odorous Volatile Organic Compounds Using UV/H2O2; Digit. KTH Vetenskap Och Konst: Stockholm, Sweden, 2011. [Google Scholar]
- Koziel, J.A.; Yang, X.; Cutler, T.; Zhang, S.; Zimmerman, J.J.; Hoff, S.J.; Jenks, W.S.; Laor, Y.; Ravid, U.; Armon, R. Mitigation of odor and pathogens from CAFOs with UV/TiO2: Exploring the cost effectiveness. In Proceedings of the Mitigating Air Emissions from Animal Feeding Operations, Des Moines, IA, USA, 19–21 May 2008; pp. 169–173. [Google Scholar]
- Maurer, D.L.; Koziel, J.A. On-farm pilot-scale testing of black ultraviolet light and photocatalytic coating for mitigation of odor, odorous VOCs, and greenhouse gases. Chemosphere 2019, 221, 778–784. [Google Scholar] [CrossRef] [PubMed]
- Yang, X.; Koziel, J.A.; Laor, Y.; Zhu, W.; van Leeuwen, J.H.; Jenks, W.S.; Hoff, S.J.; Zimmerman, J.; Zhang, S.; Ravid, U. VOC removal from manure gaseous emissions with UV photolysis and UV-TiO2 photocatalysis. Catalysts 2020, 10, 607. [Google Scholar] [CrossRef]
- Lee, M.; Koziel, J.A.; Murphy, W.; Jenks, W.S.; Fonken, B.; Storjohann, R.; Chen, B.; Li, P.; Banik, C.; Wahe, L. Design and testing of mobile laboratory for mitigation of gaseous emissions from livestock agriculture with photocatalysis. Int. J. Environ. Res. Public Health 2021, 18, 1523. [Google Scholar] [CrossRef] [PubMed]
- Lee, M.; Koziel, J.A.; Murphy, W.; Jenks, W.S.; Chen, B.; Li, P.; Banik, C. Evaluation of TiO2 based photocatalytic treatment of odor and gaseous emissions from swine manure with UV-A and UV-C. Preprints 2021. [Google Scholar] [CrossRef]
- Guarino, M.; Costa, A.; Porro, M. Photocatalytic TiO2 coating—to reduce ammonia and greenhouse gases concentration and emission from animal husbandries. Bioresour. Technol. 2008, 99, 2650–2658. [Google Scholar] [CrossRef]
- Costa, A.; Chiarello, G.L.; Selli, E.; Guarino, M. Effects of TiO2 based photocatalytic paint on concentrations and emissions of pollutants and on animal performance in a swine weaning unit. J. Environ. Manag. 2012, 96, 86–90. [Google Scholar] [CrossRef]
- Cai, L.; Koziel, J.A.; Lo, Y.C.; Hoff, S.J. Characterization of VOCs and odorants associated with swine barn particulate matter using SPME and gas chromatography-mass spectrometry- olfactometry. J. Chromatogr. A 2006, 1102, 60–72. [Google Scholar] [CrossRef] [Green Version]
- ASTM E679-19, Standard Practice for Determination of Odor and Taste Thresholds by a Forced-Choice Ascending Concentration Series Method of Limits; ASTM International: West Conshohocken, PA, USA, 2019.
- Chen, B.; Koziel, J.A.; Banik, C.; Ma, H.; Lee, M.; Wi, J.; Meiirkhanuly, Z.; Andersen, D.S.; Białowiec, A.; Parker, D.B. Emissions from swine manure treated with current products for mitigation of odors and reduction of NH3, H2S, VOC, and GHG emissions. Data 2020, 5, 54. [Google Scholar] [CrossRef]
- Banik, C.; Koziel, J.A.; Flickinger, E. Volatile compounds emitted from the cat urine contaminated carpet before and after treatment with marketed cleaning products: A simultaneous chemical and sensory analysis. Data 2020, 5, 88. [Google Scholar] [CrossRef]
- Thiemens, M.H.; Jackson, T. Production of isotopically heavy ozone by ultraviolet light photolysis of O2. Geophys. Res. Lett. 1987, 14, 624–627. [Google Scholar] [CrossRef]
- Lo, Y.-C.M.; Koziel, J.A.; Cai, L.; Hoff, S.J.; Xin, H. Simultaneous chemical and sensory characterization of volatile organic compounds and semi-volatile organic compounds emitted from swine manure using solid phase microextraction and multidimensional gas chromatography–mass spectrometry–olfactometry. J. Environ. Qual. 2008, 37, 521–534. [Google Scholar] [CrossRef]
- Zhang, Y.; Zhu, Z.; Zheng, Y.; Chen, Y.; Yin, F.; Zhang, W.; Dong, H.; Xin, H. Characterization of volatile organic compound (VOC) emissions from swine manure biogas digestate storage. Atmosphere 2019, 10, 411. [Google Scholar] [CrossRef] [Green Version]
- Kasper, P.L.; Oxbøl, A.; Hansen, M.J.; Feilberg, A. Mechanisms of loss of agricultural odorous compounds in sample bags of Nalophan, Tedlar, and PTFE. J. Environ. Qual. 2018, 47, 246–253. [Google Scholar] [CrossRef] [PubMed] [Green Version]
- Koziel, J.A.; Spinhirne, J.P.; Lloyd, J.; Parker, D.; Wright, D.; Kuhrt, F. Evaluation of sample recoveries of malodorous gases for odor bags, SPME, air sampling canisters, and sorbent tubes. J. Air Waste Manag. Assoc. 2005, 55, 1147–1157. [Google Scholar] [CrossRef] [Green Version]
- Zhu, W.; Koziel, J.A.; Cai, L.; Wright, D.; Kuhrt, F. Testing odorants recovery from a novel metallized fluorinated ethylene propylene gas sampling bag. J. Air Waste Manag. Assoc. 2015, 65, 1434–1445. [Google Scholar] [CrossRef] [Green Version]
- Li, P.; Koziel, J.A.; Zimmerman, J.J.; Zhang, J.; Cheng, T.; Yim-Im, W.; Jenks, W.S.; Lee, M.; Chen, B.; Hoff, S.J. Mitigation of Airborne PRRSV Transmission with UV Light Treatment: Proof-of-concept. Agriculture 2021, 11, 259. [Google Scholar] [CrossRef]
- Maurer, D.L.; Koziel, J.A.; Harmon, J.D.; Hoff, S.J.; Rieck-Hinz, A.M.; Andersen, D.S. Summary of performance data for technologies to control gaseous, odor, and particulate emissions from livestock operations: Air management practices assessment tool (AMPAT). Data Br. 2016, 7, 1413–1429. [Google Scholar] [CrossRef] [Green Version]
- Iowa State University Extension and Outreach. Air Management Practices Assessment Tool Website. 2016. Available online: https://www.extension.iastate.edu/ampat/ (accessed on 22 April 2021).
- Ni, J.Q.; Heber, A.J.; Lim, T.T. Ammonia and hydrogen sulfide in swine production. In Air Quality and Livestock Farming; Banhazi, T., Aland, A., Hartung, J., Eds.; CRC Press/Balkema: Leiden, The Netherlands, 2018. [Google Scholar]
Figure 1.
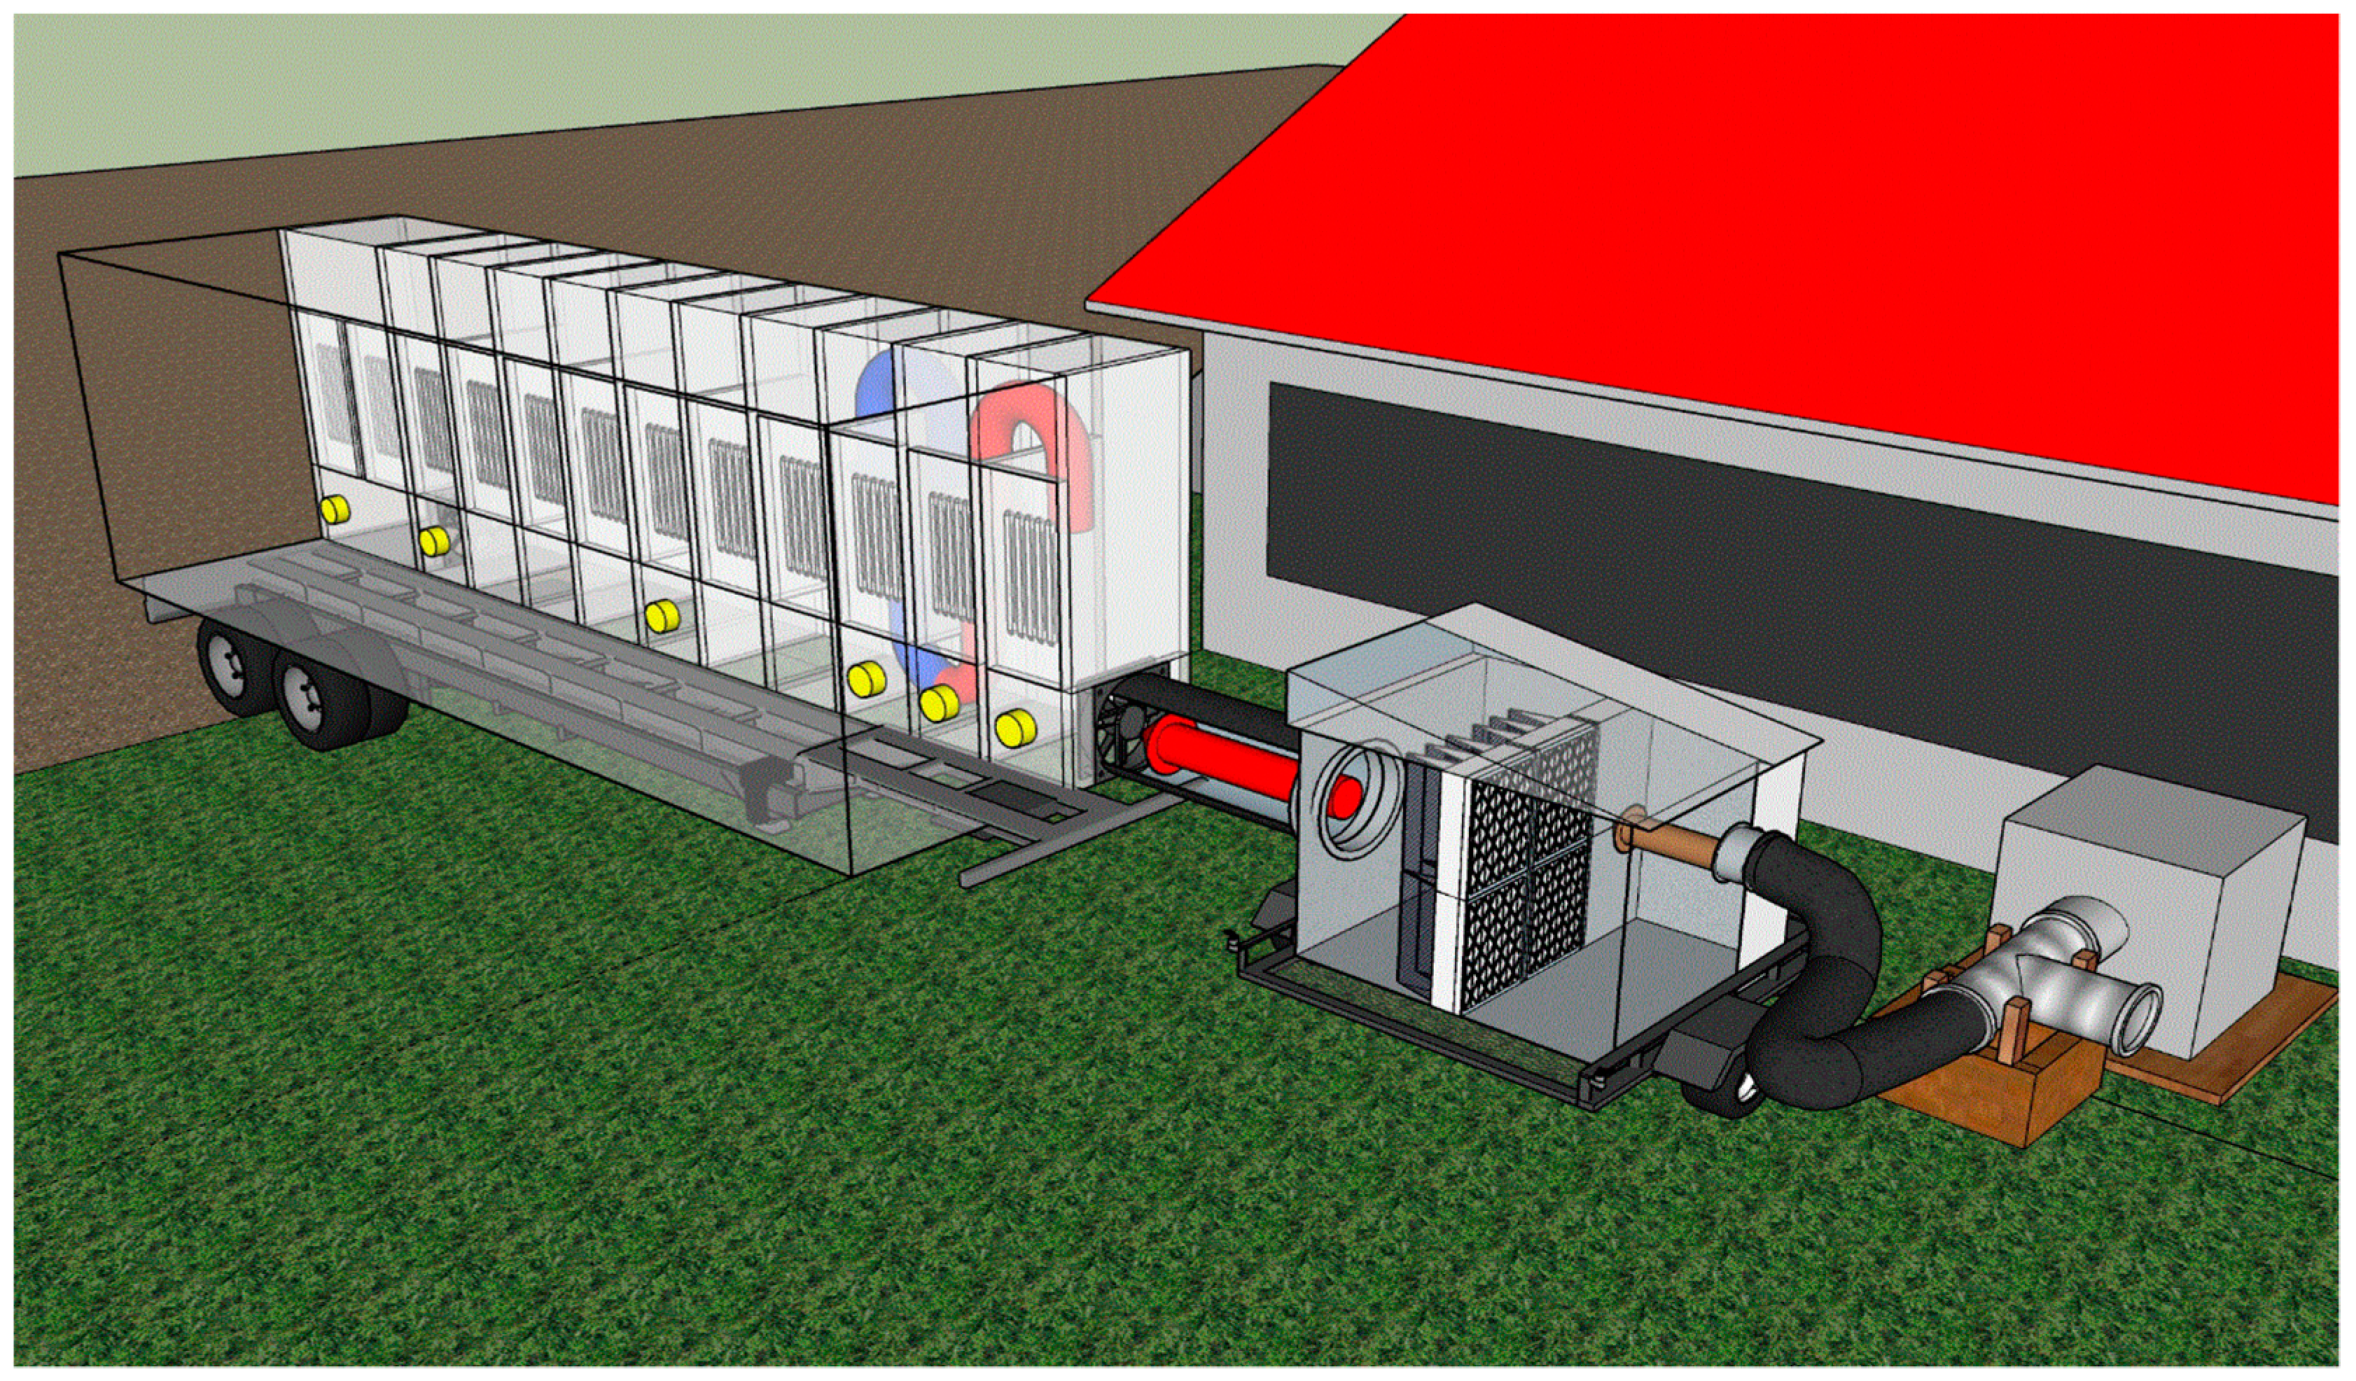
Schematic of a flow-through UV mobile laboratory with filtration unit connected to the continuous fan exhausting gas from stored manure headspace in the pit under barn’s slatted floor. The UV mobile lab consists of a series of connected chambers, each equipped with UV lamps (shown as panels of 5 in each chamber) and sprayed-on photocatalyst on surfaces (coated on all sides of the chamber except for the side installed UV). The lab treated up to 0.78 m3·s−1 of air. Excess airflow from the fan is discharged to the atmosphere. Cone-tipped ‘pipes’ signify free airflow inflow and outflow. Brown: exhaust air from swine barn; red: inlet air with reduced particle matter load; blue: UV-treated air. Yellow: gas sampling ports.
Figure 1.
Schematic of a flow-through UV mobile laboratory with filtration unit connected to the continuous fan exhausting gas from stored manure headspace in the pit under barn’s slatted floor. The UV mobile lab consists of a series of connected chambers, each equipped with UV lamps (shown as panels of 5 in each chamber) and sprayed-on photocatalyst on surfaces (coated on all sides of the chamber except for the side installed UV). The lab treated up to 0.78 m3·s−1 of air. Excess airflow from the fan is discharged to the atmosphere. Cone-tipped ‘pipes’ signify free airflow inflow and outflow. Brown: exhaust air from swine barn; red: inlet air with reduced particle matter load; blue: UV-treated air. Yellow: gas sampling ports.

Figure 2.
Mitigation of O3 concentration with different UV wavelengths irradiating gaseous emissions inside #2 chamber. Air flow = 0.28 m3·s−1, inlet air temperature (influent of chamber #2) = 28 °C, inlet air RH = 67%, outlet air temp. (inffluent of chamber #3) = 31 °C, outlet air RH = 61%.
Figure 2.
Mitigation of O3 concentration with different UV wavelengths irradiating gaseous emissions inside #2 chamber. Air flow = 0.28 m3·s−1, inlet air temperature (influent of chamber #2) = 28 °C, inlet air RH = 67%, outlet air temp. (inffluent of chamber #3) = 31 °C, outlet air RH = 61%.

Figure 3.
An overlay of the chromatogram (black line) and aromagram (red line). The height of aromagram peaks represents measured odor intensity (percent relative scale). The TIC signal is collected simultaneously, enables linking odors to specific chemicals in the mixture. Several unpleasant (out of 31 total) odors with medium-to-strong intensity were recorded during analysis with GC-MS-O. The ‘toothpaste’, ‘mouthwash’, ‘mint’ scents are emerging in UV-A treated air.


Table 1.
Mitigation of odor with UV-A photocatalysis treatment. Control temperature = 28.5 ± 2.3 °C, control RH = 69.8 ± 9.5%, treatment temperature: 31.5 ± 1.2 °C, treatment RH = 66.0 ± 4.3%, values in the table are mean ± S.D. Bold signifies statistical significance.
Table 1.
Mitigation of odor with UV-A photocatalysis treatment. Control temperature = 28.5 ± 2.3 °C, control RH = 69.8 ± 9.5%, treatment temperature: 31.5 ± 1.2 °C, treatment RH = 66.0 ± 4.3%, values in the table are mean ± S.D. Bold signifies statistical significance.
| UV Dose (mJ·cm−2) | Light Intensity (mW·cm−2) | Treatment Time (s) | Control (OUE∙m−3) | Treatment (OUE∙m−3) | % Reduction (p-Value) |
|---|---|---|---|---|---|
| UV Dose Control with Light Intensity and Treatment Time | |||||
| 1.9 | 0.04 and 0.41 | 15.8 and 3.2 | 448 ± 75 | 457 ± 54 | −2.0 (0.91) |
| 2.9 | 0.04 and 0.41 | 23.8 and 4.8 | 424 ± 41 | 379 ± 25 | 10.5 (0.32) |
| 2.9 | 0.04 and 0.14 | 43.3 and 8.7 | 377 ± 13 | 401 ± 76 | −6.2 (0.93) |
| 4.0 | 0.04 and 0.26 | 43.3 and 8.7 | 359 ± 60 | 218 ± 28 | 39.3 (0.03) |
| 5.3 | 0.04 and 0.41 | 43.3 and 8.7 | 412 ± 47 | 251 ± 4.6 | 39.6 (0.04) |
Table 2.
Mitigation of odorous VOCs with UV-A photocatalysis treatment. Control temperature = 28.5 ± 2.3 °C, control RH = 69.8 ± 9.5%, treatment temperature: 31.5 ± 1.2 °C, treatment RH = 66.0 ± 4.3%. Bold signifies statistical significance.
Table 2.
Mitigation of odorous VOCs with UV-A photocatalysis treatment. Control temperature = 28.5 ± 2.3 °C, control RH = 69.8 ± 9.5%, treatment temperature: 31.5 ± 1.2 °C, treatment RH = 66.0 ± 4.3%. Bold signifies statistical significance.
| Type of VOCs | Percent Reduction (p-Value) | ||||
|---|---|---|---|---|---|
| UV-A Dose, mJ·cm−2 (Light Intensity, mW·cm−2) | |||||
| 1.9 (0.04 & 0.41) | 2.9 (0.04 & 0.41) | 2.9 (0.04 & 0.14) | 4.0 (0.04 & 0.26) | 5.3 (0.04 & 0.41) | |
| DMDS | −6.5 (0.74) | 16.9 (0.03) | 22.2 (0.02) | 37.0 (0.14) | 62.0 (0.02) |
| DEDS | 2.1 (0.79) | 22.7 (0.19) | Not detected | Not detected | 26.0 (0.38) |
| Acetic acid | −23.7 (0.21) | −2.1 (0.87) | −77.9 (0.11) | −65.1 (0.08) | −29.0 (0.28) |
| Propanoic acid | 18.5 (0.53) | 1.7 (0.91) | −43.3 (0.75) | 8.6 (0.92) | −33.3 (0.59) |
| Isobutyric acid | 30.3 (0.23) | 48.9 (0.07) | 45.2 (0.08) | 53.9 (0.01) | 44.2 (0.02) |
| Butanoic acid | 12.6 (0.71) | 48.2 (0.02) | 40.2 (0.07) | 39.8 (0.08) | 32.1 (0.01) |
| Isovaleric acid | 20.1 (0.43) | 23.0 (0.51) | 42.9 (0.05) | 35.4 (0.10) | −10.0 (0.71) |
| Valeric acid | 1.6 (0.97) | 42.8 (0.13) | −27.7 (0.81) | 12.7 (0.85) | 22.1 (0.63) |
| Hexanoic acid | −20.5 (0.50) | −11.8 (0.05) | Not detected | Not detected | −28.3 (0.37) |
| Phenol | −13.3 (0.67) | 0.5 (0.98) | −93.5 (0.15) | −85.6 (0.19) | −17.5 (0.10) |
| p-Cresol | 44.0 (0.12) | 32.4 (0.02) | 34.6 (0.11) | 53.4 (0.04) | 39.9 (0.04) |
| Indole | 29.4 (0.19) | 9.4 (0.37) | 25.4 (0.47) | 37.9 (0.03) | 66.0 (0.02) |
| Skatole | 40.3 (0.15) | 13.2 (0.69) | 37.9 (0.03) | 22.4 (0.01) | 49.0 (0.04) |
Note: Dimethyl disulfide (DMDS), diethyl disulfide (DEDS).
Table 3.
Mitigation of N2O with UV-A photocatalysis treatment. Control temperature = 28.5 ± 2.3 °C, control RH = 69.8 ± 9.5%, treatment temperature: 31.5 ± 1.2 °C, treatment RH = 66.0 ± 4.3%, Values in the table are mean ± S.D. Bold signifies statistical significance.
Table 3.
Mitigation of N2O with UV-A photocatalysis treatment. Control temperature = 28.5 ± 2.3 °C, control RH = 69.8 ± 9.5%, treatment temperature: 31.5 ± 1.2 °C, treatment RH = 66.0 ± 4.3%, Values in the table are mean ± S.D. Bold signifies statistical significance.
| UV Dose (mJ·cm−2) | Light Intensity (mW·cm−2) | Treatment Time (s) | Control (ppm) | Treatment (ppm) | % Reduction (p-Value) |
|---|---|---|---|---|---|
| UV Dose Control with Light Intensity and Treatment Time | |||||
| 1.9 | 0.04 and 0.41 | 15.8 and 3.2 | 0.30 ± 0.00 | 0.28 ± 0.01 | 4.4 (0.05) |
| 2.9 | 0.04 and 0.41 | 23.8 and 4.8 | 0.31 ± 0.01 | 0.28 ± 0.01 | 9.4 (0.01) |
| 2.9 | 0.04 and 0.14 | 43.3 and 8.7 | 0.32 ± 0.01 | 0.30 ± 0.00 | 9.1 (0.02) |
| 4.0 | 0.04 and 0.26 | 43.3 and 8.7 | 0.32 ± 0.01 | 0.28 ± 0.00 | 13.3 (<0.01) |
| 5.3 | 0.04 and 0.41 | 43.3 and 8.7 | 0.31 ± 0.00 | 0.27 ± 0.00 | 11.8 (0.01) |
Table 4.
Mitigation of CO2 with UV-A photocatalysis treatment. Control temperature = 28.5 ± 2.3 °C, control RH = 69.8 ± 9.5%, treatment temperature: 31.5 ± 1.2 °C, treatment RH = 66.0 ± 4.3%, Values in the table are mean ± S.D. Bold signifies statistical significance.
Table 4.
Mitigation of CO2 with UV-A photocatalysis treatment. Control temperature = 28.5 ± 2.3 °C, control RH = 69.8 ± 9.5%, treatment temperature: 31.5 ± 1.2 °C, treatment RH = 66.0 ± 4.3%, Values in the table are mean ± S.D. Bold signifies statistical significance.
| UV Dose (mJ·cm−2) | Light Intensity (mW·cm−2) | Treatment Time (s) | Control (ppm) | Treatment (ppm) | % Reduction (p-Value) |
|---|---|---|---|---|---|
| UV Dose Control with UV Light Intensity and Treatment Time | |||||
| 1.9 | 0.04 and 0.41 | 15.8 and 3.2 | 896 ± 81 | 1016 ± 108 | −13.5 (0.33) |
| 2.9 | 0.04 and 0.41 | 23.8 and 4.8 | 737 ± 12 | 892 ± 18 | −21.2 (0.01) |
| 2.9 | 0.04 and 0.14 | 43.3 and 8.7 | 1032 ± 21 | 1380 ± 104 | −33.7 (0.03) |
| 4.0 | 0.04 and 0.26 | 43.3 and 8.7 | 1032 ± 21 | 1251 ± 40 | −21.2 (0.02) |
| 5.3 | 0.04 and 0.41 | 43.3 and 8.7 | 1201 ± 296 | 1534 ± 105 | −27.8 (0.16) |
Table 5.
Mitigation of H2S with UV-A photocatalysis treatment. Control temperature = 28.5 ± 2.3 °C, control RH = 69.8 ± 9.5%, treatment temperature: 31.5 ± 1.2 °C, treatment RH = 66.0 ± 4.3%, Values in the table are mean ± S.D. Bold signifies statistical significance.
Table 5.
Mitigation of H2S with UV-A photocatalysis treatment. Control temperature = 28.5 ± 2.3 °C, control RH = 69.8 ± 9.5%, treatment temperature: 31.5 ± 1.2 °C, treatment RH = 66.0 ± 4.3%, Values in the table are mean ± S.D. Bold signifies statistical significance.
| UV Dose (mJ·cm−2) | Light Intensity (mW·cm−2) | Treatment Time (s) | Control (ppm) | Treatment (ppm) | % Reduction (p-Value) |
|---|---|---|---|---|---|
| UV Dose Control with UV Light Intensity and Treatment Time | |||||
| 1.9 | 0.04 and 0.41 | 15.8 and 3.2 | 0.8 ± 0.0 | 0.9 ± 0.0 | −4.0 (0.07) |
| 2.9 | 0.04 and 0.41 | 23.8 and 4.8 | 0.8 ± 0.0 | 0.8 ± 0.1 | 4.1 (0.13) |
| 2.9 | 0.04 and 0.14 | 43.3 and 8.7 | 2.0 ± 0.4 | 1.9 ± 0.2 | 4.9 (0.35) |
| 4.0 | 0.04 and 0.26 | 43.3 and 8.7 | 1.8 ± 0.6 | 1.7 ± 0.5 | 9.0 (0.05) |
| 5.3 | 0.04 and 0.41 | 43.3 and 8.7 | 0.6 ± 0.1 | 0.4 ± 0.0 | 26.2 (0.01) |
Table 6.
Mitigation of PM with UV-A photocatalysis treatment. Control temperature = 28.5 ± 2.3 °C, control RH = 69.8 ± 9.5%, treatment temperature: 31.5 ± 1.2 °C, treatment RH = 66.0 ± 4.3%. Values in the table are mean ± S.D.
Table 6.
Mitigation of PM with UV-A photocatalysis treatment. Control temperature = 28.5 ± 2.3 °C, control RH = 69.8 ± 9.5%, treatment temperature: 31.5 ± 1.2 °C, treatment RH = 66.0 ± 4.3%. Values in the table are mean ± S.D.
| Size of PM | Control (mg∙m−3) | Treatment (mg∙m−3) | % Reduction (p-Value) |
|---|---|---|---|
| Total PM | 0.22 ± 0.16 | 0.20 ± 0.09 | 9.1 (0.89) |
| PM 1 | 0.10 ± 0.13 | 0.12 ± 0.06 | −20.0 (0.68) |
| PM 2.5 | 0.09 ± 0.11 | 0.06 ± 0.04 | 33.3 (0.48) |
| PM 4–PM 10 | 0.08 ± 0.08 | 0.06 ± 0.04 | 25.0 (0.81) |
| PM 10 | 0.11 ± 0.07 | 0.05 ± 0.04 | 54.5 (0.39) |
Table 7.
Mitigation of N2O with different UV wavelengths irradiating gaseous emissions inside #2 chamber. Airflow = 0.28 m3·s−1, inlet air temperature (influent of chamber #2) = 28 °C, inlet air RH = 67%, outlet air temperature (influent of chamber #3) = 31 °C, outlet air RH = 61%. Values in the table are mean ± S.D. Bold signifies statistical significance.
| UV Wavelengths (nm) | UV Dose (µJ·cm−2) | Light Intensity (µW·cm−2) | Control (ppm) | Treatment (ppm) | % Reduction (p-Value) |
|---|---|---|---|---|---|
| 185 + 254 | 0.03 | 0.01 | 0.232 ± 0.004 | 0.221 ± 0.002 | 5.1 (0.02) |
| 222 | 2.55 | 0.59 | 0.221 ± 0.006 | 0.209 ± 0.005 | 5.4 (0.20) |
| 254 | 1.60 | 0.37 | 0.205 ± 0.005 | 0.201 ± 0.002 | 1.7 (0.26) |
| 367 | 1775 | 410 | 0.200 ± 0.009 | 0.188 ± 0.007 | 5.8 (0.20) |
Table 8.
Performance of the MERV8 and MERV15 filtration. Values in the table are mean ± S.D. Bold signifies statistical significance. The effluent was used for UV treatment in experiments described in Section 3.1 and Section 3.2.
Table 8.
Performance of the MERV8 and MERV15 filtration. Values in the table are mean ± S.D. Bold signifies statistical significance. The effluent was used for UV treatment in experiments described in Section 3.1 and Section 3.2.
| Filtration | PM 1 | PM 2.5 | PM 4–10 | PM 10 | Total PM | |
|---|---|---|---|---|---|---|
| Concentration (mg∙m−3) | % Reduction (p-Value) | |||||
| Unfiltered swine barn exhaust | 0.10 ± 0.13 | 0.09 ± 0.11 | 0.08 ± 0.08 | 0.11 ± 0.07 | 0.22 ± 0.16 | - |
| MERV 8 | 0.05 ± 0.02 | 0.03 ± 0.01 | 0.02 ± 0.01 | 0.02 ± 0.01 | 0.06 ± 0.03 | 77.1 (0.05) |
| MERV 8 and 15 | 0.003 ± 0.001 | 0.003 ± 0.000 | 0.003 ± 0.000 | 0.003 ± 0.000 | 0.004 ± 0.001 | 98.3 (0.01) |
Table 9.
Performance of UV-A photocatalysis in mitigating N2O concentrations under different PM conditions. UV-A dose: 5.3 mJ∙cm−2, airflow = 0.28 m3·s−1. Values in the table are mean ± S.D. Bold signifies statistical significance.
Table 9.
Performance of UV-A photocatalysis in mitigating N2O concentrations under different PM conditions. UV-A dose: 5.3 mJ∙cm−2, airflow = 0.28 m3·s−1. Values in the table are mean ± S.D. Bold signifies statistical significance.
| Total PM (mg∙m−3) | PM Filtration Status | UV Dose (mJ·cm−2) | Control (ppb) | UV Treatment (ppb) | % Reduction (p-Value) |
|---|---|---|---|---|---|
| 0.22 | Unfiltered swine barn exhaust | 5.3 | 0.273 ± 0.008 | 0.244 ± 0.007 | 10.6 (0.02) |
| 0.06 | MERV 8 | 5.3 | 0.267 ± 0.002 | 0.244 ± 0.002 | 8.5 (0.01) |
| 0.004 | MERV 8 and 15 | 5.3 | 0.311 ± 0.004 | 0.282 ± 0.006 | 9.3 (0.01) |
Table 10.
Performance of UV-A photocatalysis in mitigating odor under different PM conditions. UV-A dose: 5.3 mJ∙cm−2, airflow = 0.28 m3·s−1. Values in the table are mean ± S.D. Bold signifies statistical significance.
Table 10.
Performance of UV-A photocatalysis in mitigating odor under different PM conditions. UV-A dose: 5.3 mJ∙cm−2, airflow = 0.28 m3·s−1. Values in the table are mean ± S.D. Bold signifies statistical significance.
| Total PM (mg∙m−3) | PM Filtration Status | UV Dose (mJ·cm−2) | Control (OUE∙m−3) | UV Treatment (OUE∙m−3) | % Reduction (p-Value) |
|---|---|---|---|---|---|
| 0.22 | Unfiltered swine barn exhaust | 5.3 | 685 ± 52 | 623 ± 83 | 8.5 (0.44) |
| 0.06 | MERV 8 | 5.3 | 923 ± 77.1 | 737 ± 73.4 | 20.2 (0.19) |
| 0.004 | MERV 8 and 15 | 5.3 | 412 ± 47 | 251 ± 4.58 | 39.0 (0.04) |
Table 11.
Performance of UV-A photocatalysis in mitigating odorous VOCs under different PM conditions. UV-A dose: 5.3 mJ∙cm−2, airflow = 0.28 m3·s−1. Bold signifies statistical significance.
Table 11.
Performance of UV-A photocatalysis in mitigating odorous VOCs under different PM conditions. UV-A dose: 5.3 mJ∙cm−2, airflow = 0.28 m3·s−1. Bold signifies statistical significance.
| Percent Reduction (p-Value) | |||
|---|---|---|---|
| UV-A Dose (Total PM, mg·m−3) | |||
| 5.3 (0.22) | 5.3 (0.06) | 5.3 (0.004) | |
| PM filtration status | Unfiltered swine barn exhaust | MERV 8 | MERV 8 and 15 |
| DMDS | −17.2 (0.85) | −5.8 (0.73) | 31.6 (0.15) |
| DEDS | Not detected | Not detected | Not detected |
| Acetic acid | −2.7 (0.95) | −37.3 (0.38) | 3.8 (0.96) |
| Propanoic acid | −30.4 (0.73) | −38.0 (0.44) | 16.2 (0.65) |
| Isobutyric acid | 1.0 (0.98) | 26.9 (0.04) | 23.6 (0.04) |
| Butanoic acid | −5.8 (0.62) | 28.1 (0.42) | 17.6 (0.35) |
| Isovaleric acid | −52.1 (0.31) | −10.8 (0.85) | 45.0 (0.33) |
| Valeric acid | 22.0 (0.43) | 7.4 (0.84) | 44.5 (0.44) |
| Hexanoic acid | Not detected | Not detected | Not detected |
| Phenol | 13.6 (0.23) | −63.2 (0.09) | −14.5 (0.41) |
| p-Cresol | −11.2 (0.72) | −6.3 (0.88) | 36.5 (0.04) |
| Indole | −10.3 (0.34) | −20.9 (0.78) | 44.5 (0.04) |
| Skatole | −12.7 (0.21) | 23.8 (0.02) | 12.4 (0.12) |
Note: Dimethyl disulfide (DMDS), dimethyl disulfide (DEDS).
Table 12.
Performance of UV-A photocatalysis in mitigating H2S concentrations under different PM conditions. UV-A dose: 5.3 mJ∙cm−2, airflow = 0.28 m3·s−1. Values in the table are mean ± S.D. Bold signifies statistical significance.
Table 12.
Performance of UV-A photocatalysis in mitigating H2S concentrations under different PM conditions. UV-A dose: 5.3 mJ∙cm−2, airflow = 0.28 m3·s−1. Values in the table are mean ± S.D. Bold signifies statistical significance.
| Total PM (mg∙m−3) | PM Filtration Status | UV Dose (mJ·cm−2) | Control (ppm) | Treatment (ppm) | % Reduction (p-Value) |
|---|---|---|---|---|---|
| 0.22 | Unfiltered swine barn exhaust | 5.3 | 0.64 ± 0.03 | 0.65 ± 0.02 | −0.5 (0.78) |
| 0.06 | MERV 8 | 5.3 | 0.36 ± 0.04 | 0.34 ± 0.02 | 5.21 (0.27) |
| 0.004 | MERV 8 and 15 | 5.3 | 0.52 ± 0.13 | 0.31 ± 0.06 | 40.2 (<0.01) |
Table 13.
Performance of UV-A photocatalysis in mitigating O3 concentrations under different PM conditions. UV-A dose: 5.3 mJ∙cm−2, airflow = 0.28 m3·s−1. Values in the table are mean ± S.D. Bold signifies statistical significance.
Table 13.
Performance of UV-A photocatalysis in mitigating O3 concentrations under different PM conditions. UV-A dose: 5.3 mJ∙cm−2, airflow = 0.28 m3·s−1. Values in the table are mean ± S.D. Bold signifies statistical significance.
| Total PM (mg∙m−3) | PM Filtration Status | UV Dose (mJ·cm−2) | Control (ppb) | Treatment (ppb) | % Reduction (p-Value) |
|---|---|---|---|---|---|
| 0.22 | Unfiltered swine barn exhaust | 5.3 | Not detected | Not detected | - |
| 0.06 | MERV 8 | 5.3 | Not detected | Not detected | - |
| 0.004 | MERV 8 and 15 | 5.3 | 5.3 ± 1.9 | 0.0 ± 0.0 | 100 (<0.01) |
Table 14.
Results of simultaneous chemical and smell sensory characterization of selected VOCs emitted from swine manure and treated with UV-A. Panelist responses are the ‘odor character (i.e., ‘what it smells like’) and the (hedonic tone) (on an ‘unpleasant-neutral-pleasant’ scale).
Table 14.
Results of simultaneous chemical and smell sensory characterization of selected VOCs emitted from swine manure and treated with UV-A. Panelist responses are the ‘odor character (i.e., ‘what it smells like’) and the (hedonic tone) (on an ‘unpleasant-neutral-pleasant’ scale).
| RT | Compound | Control | UV-A Treatment | % R | ||||||
|---|---|---|---|---|---|---|---|---|---|---|
| Abundance | Panelist 1 | Panelist 2 | Panelist 3 | Abundance | Panelist 1 | Panelist 2 | Panelist 3 | |||
| 15.6 | Benzoic acid (1-Octanol) | 1120 × 103 | Alcoholic (Unpleasant) | Acid (Unpleasant) | 1750 × 103 | Toothpaste Mouthwash (Pleasant) | Mint (Neutral) | −55.6 | ||
Note: RT = GC column retention time, min; Abundance = peak area counts; arbitrary units; % R = percent reduction (negative value signifies compound generation by the UV-A treatment).
Table 15.
Summary of the percent reduction of target gases investigated in the previous study with UV-A photocatalysis. Bold signifies statistical significance.
Table 15.
Summary of the percent reduction of target gases investigated in the previous study with UV-A photocatalysis. Bold signifies statistical significance.
| Ref. | Experimental Conditions | Catalyst (Dose) | UV Wavelength | UV Dose (Intensity) | Target Gas (Percent Reduction) |
|---|---|---|---|---|---|
| [20] | Swine farm (farrowing rooms) T: 24 °C (18.9–27.3): RH: 54% | TiO2 (7 mg·cm−2) | 315–400 nm | Not reported | NH3 (30.5) |
| CH4 (10.8) | |||||
| CO2 (15.3) | |||||
| [21] | Swine farm (weaning units) T: 26 °C (24.2–29.9); RH: 56% (52–90%) | TiO2 (7 mg·cm−2) | 315–400 nm | Not reported | CH4 (27.4) |
| PM 10 (17.0) | |||||
| [7] | Lab-scale (simulated livestock farm); T: 24 °C; RH: 50% | TiO2 (0.7 μg·cm−2) | 365 nm | Not reported (0.46 mW·cm−2) | NH3 (35) |
| [8] | Lab-scale (simulated livestock farm), T: 20 ± 1 °C, RH: 50% | TiO2 (1.5 m2·g−1) | 315–400 nm | 0.6–1.3 mJ·cm−2 (2.3–5.3 mW·cm−2) | H2S (4.2–14) |
| MT (80–87) | |||||
| DMS (92–95) | |||||
| DMDS (83–91) | |||||
| Butan-1-ol (93–95) | |||||
| AA (81–89) | |||||
| PA (97–98) | |||||
| BA (98–99) | |||||
| VA (98–99) | |||||
| [6] | Lab-scale (simulated livestock farm); T: 40 ℃; R: 40% | TiO2 (10 μg·cm−2) | 365 nm | 12 mJ·cm−2 (0.06 mW·cm−2) | DMDS (40) |
| DEDS (81) | |||||
| DMTS (76) | |||||
| BA (87) | |||||
| Guaiacol (100) | |||||
| p-Cresol (94) | |||||
| [1] | Lab-scale (simulated poultry farm); T: 25 ± 3 ℃; RH: 12% | TiO2 (10 μg·cm−2) | 365 nm | 0.97 J·cm−2 (4.85 mW·cm−2) | NH3 (19) |
| N2O (10) | |||||
| CO2 (3.8) | |||||
| O3 (48) | |||||
| [16] | Pilot-scale (swine finishing rooms); T: 22–26 ℃; RH: 36–80% | TiO2 (10 μg·cm−2) | 365 nm | < 1.88 mJ·cm−2 (< 0.04 mW·cm−2) | N2O (8.7) |
| CO2 (-3.1) | |||||
| Odor (16) | |||||
| p-Cresol (22) | |||||
| [2] | Pilot-scale (poultry farm); T: 28 ± 3 ℃; RH: 56% | TiO2 (10 μg·cm−2) | 365 nm | 0.82 J·cm−2 (4.85 mW·cm−2) | NH3 (8.7) |
| N2O (13) | |||||
| O3 (100) | |||||
| Odor (18) | |||||
| DEDS (47) | |||||
| BA (62) | |||||
| p-Cresol (49) | |||||
| Skatole (35) | |||||
| [18] | Pilot-scale (simulate swine farm); T: 11 ± 3 ℃; RH: 34 ± 6% | TiO2 (10 μg·cm−2) | 367 nm | 2.5–5.8 mJ·cm−2 (0.41 mW·cm−2) | NH3 (1–11) |
| Butan-1-ol (19–41) | |||||
| [19] | Pilot-scale (simulate swine farm); T.: 19 ± 2 ℃; RH: 45 ± 4% | TiO2 (10 μg·cm−2) | 367 nm | 2.5–5.8 mJ·cm−2 (0.41 mW·cm−2) | NH3 (1.3–6.1) |
| N2O (9.0–14) | |||||
| O3 (100-100) | |||||
| AA (-4.0–51) | |||||
| BA (45–48) | |||||
| PA (51–67) | |||||
| p-Cresol (41–59) | |||||
| Indole (22–20) | |||||
| Odor (32–63) | |||||
| This study | Swine farm (finishing rooms); T: 29 ± 2 ℃; RH: 66 ± 4% | TiO2 (10 μg·cm−2) | 367 nm | 2.9–5.3 mJ·cm−2 (0.41 mW·cm−2) | H2S (4.9–40) |
| N2O (9.4–12) | |||||
| DMDS (22–63) | |||||
| IA (49–44) | |||||
| BA (48–32) | |||||
| p-Cresol (32–40) | |||||
| Indole (25–66) | |||||
| Skatole (38–49) | |||||
| Odor (11–40) | |||||
| O3 (N/A-100) |
Note: methanethiol (MT), dimethyl sulfide (DMS), dimethyl disulfide (DMDS), acetic acid (AA), propionic acid (PA), butyric acid (BA), valeric acid (VA), isobutyric acid (IA), not available (N/A).
Table 16.
Summary of the estimated cost of electric energy needed to mitigate targeted gases with UV-A photocatalysis using the mobile lab.
Table 16.
Summary of the estimated cost of electric energy needed to mitigate targeted gases with UV-A photocatalysis using the mobile lab.
| Ref. | Targeted Gas | UV Dose (mJ∙cm−2) | Targeted Gas Emission (E, mg∙min−1, Odor = OUE∙min−1) | Cost (USD·kg−1 for NH3 and H2S; USD·g−1 for Butan-1-ol, N2O and O3) | |
|---|---|---|---|---|---|
| Control | UV Treatment | ||||
| [18] | NH3 | 3.9 | 746 | 676 | 53.4 |
| NH3 | 5.8 | 763 | 676 | 62.5 | |
| Butan-1-ol | 2.5 | 31.5 | 25.3 | 442 | |
| 3.9 | 30.9 | 20.3 | 352 | ||
| 5.8 | 32.9 | 19.4 | 403 | ||
| [19] | NH3 | 5.8 | 64.2 | 60.2 | 1300 |
| N2O | 3.9 | 8.14 | 7.79 | 10.6 | |
| N2O | 5.8 | 8.06 | 6.92 | 4.72 | |
| O3 | 1.3 | 0.01 | 0.00 | 18.9 | |
| O3 | 5.8 | 0.01 | 0.00 | 60.0 | |
| Odor | 3.9 | 9210 | 3910 | - | |
| 5.8 | 9200 | 3430 | - | ||
| This study | H2S | 5.3 | 8.55 | 3.58 | 1090 |
| N2O | 3.9 | 9.30 | 8.43 | 3.43 | |
| N2O | 5.3 | 9.31 | 8.21 | 4.93 | |
| O3 | 5.3 | 0.16 | 0.00 | 33.7 | |
| Odor | 4.0 | 5480 | 3320 | - | |
| 5.3 | 6290 | 3830 | - | ||
Publisher’s Note: MDPI stays neutral with regard to jurisdictional claims in published maps and institutional affiliations. |
© 2021 by the authors. Licensee MDPI, Basel, Switzerland. This article is an open access article distributed under the terms and conditions of the Creative Commons Attribution (CC BY) license (https://creativecommons.org/licenses/by/4.0/).
Share and Cite
MDPI and ACS Style
Lee, M.; Koziel, J.A.; Murphy, W.; Jenks, W.S.; Chen, B.; Li, P.; Banik, C. Mitigation of Odor and Gaseous Emissions from Swine Barn with UV-A and UV-C Photocatalysis. Atmosphere 2021, 12, 585. https://doi.org/10.3390/atmos12050585
AMA Style
Lee M, Koziel JA, Murphy W, Jenks WS, Chen B, Li P, Banik C. Mitigation of Odor and Gaseous Emissions from Swine Barn with UV-A and UV-C Photocatalysis. Atmosphere. 2021; 12(5):585. https://doi.org/10.3390/atmos12050585
Chicago/Turabian StyleLee, Myeongseong, Jacek A. Koziel, Wyatt Murphy, William S. Jenks, Baitong Chen, Peiyang Li, and Chumki Banik. 2021. "Mitigation of Odor and Gaseous Emissions from Swine Barn with UV-A and UV-C Photocatalysis" Atmosphere 12, no. 5: 585. https://doi.org/10.3390/atmos12050585
Note that from the first issue of 2016, this journal uses article numbers instead of page numbers. See further details here.