An Assessment of ERA5 Reanalysis for Antarctic Near-Surface Air Temperature


Abstract
:1. Introduction
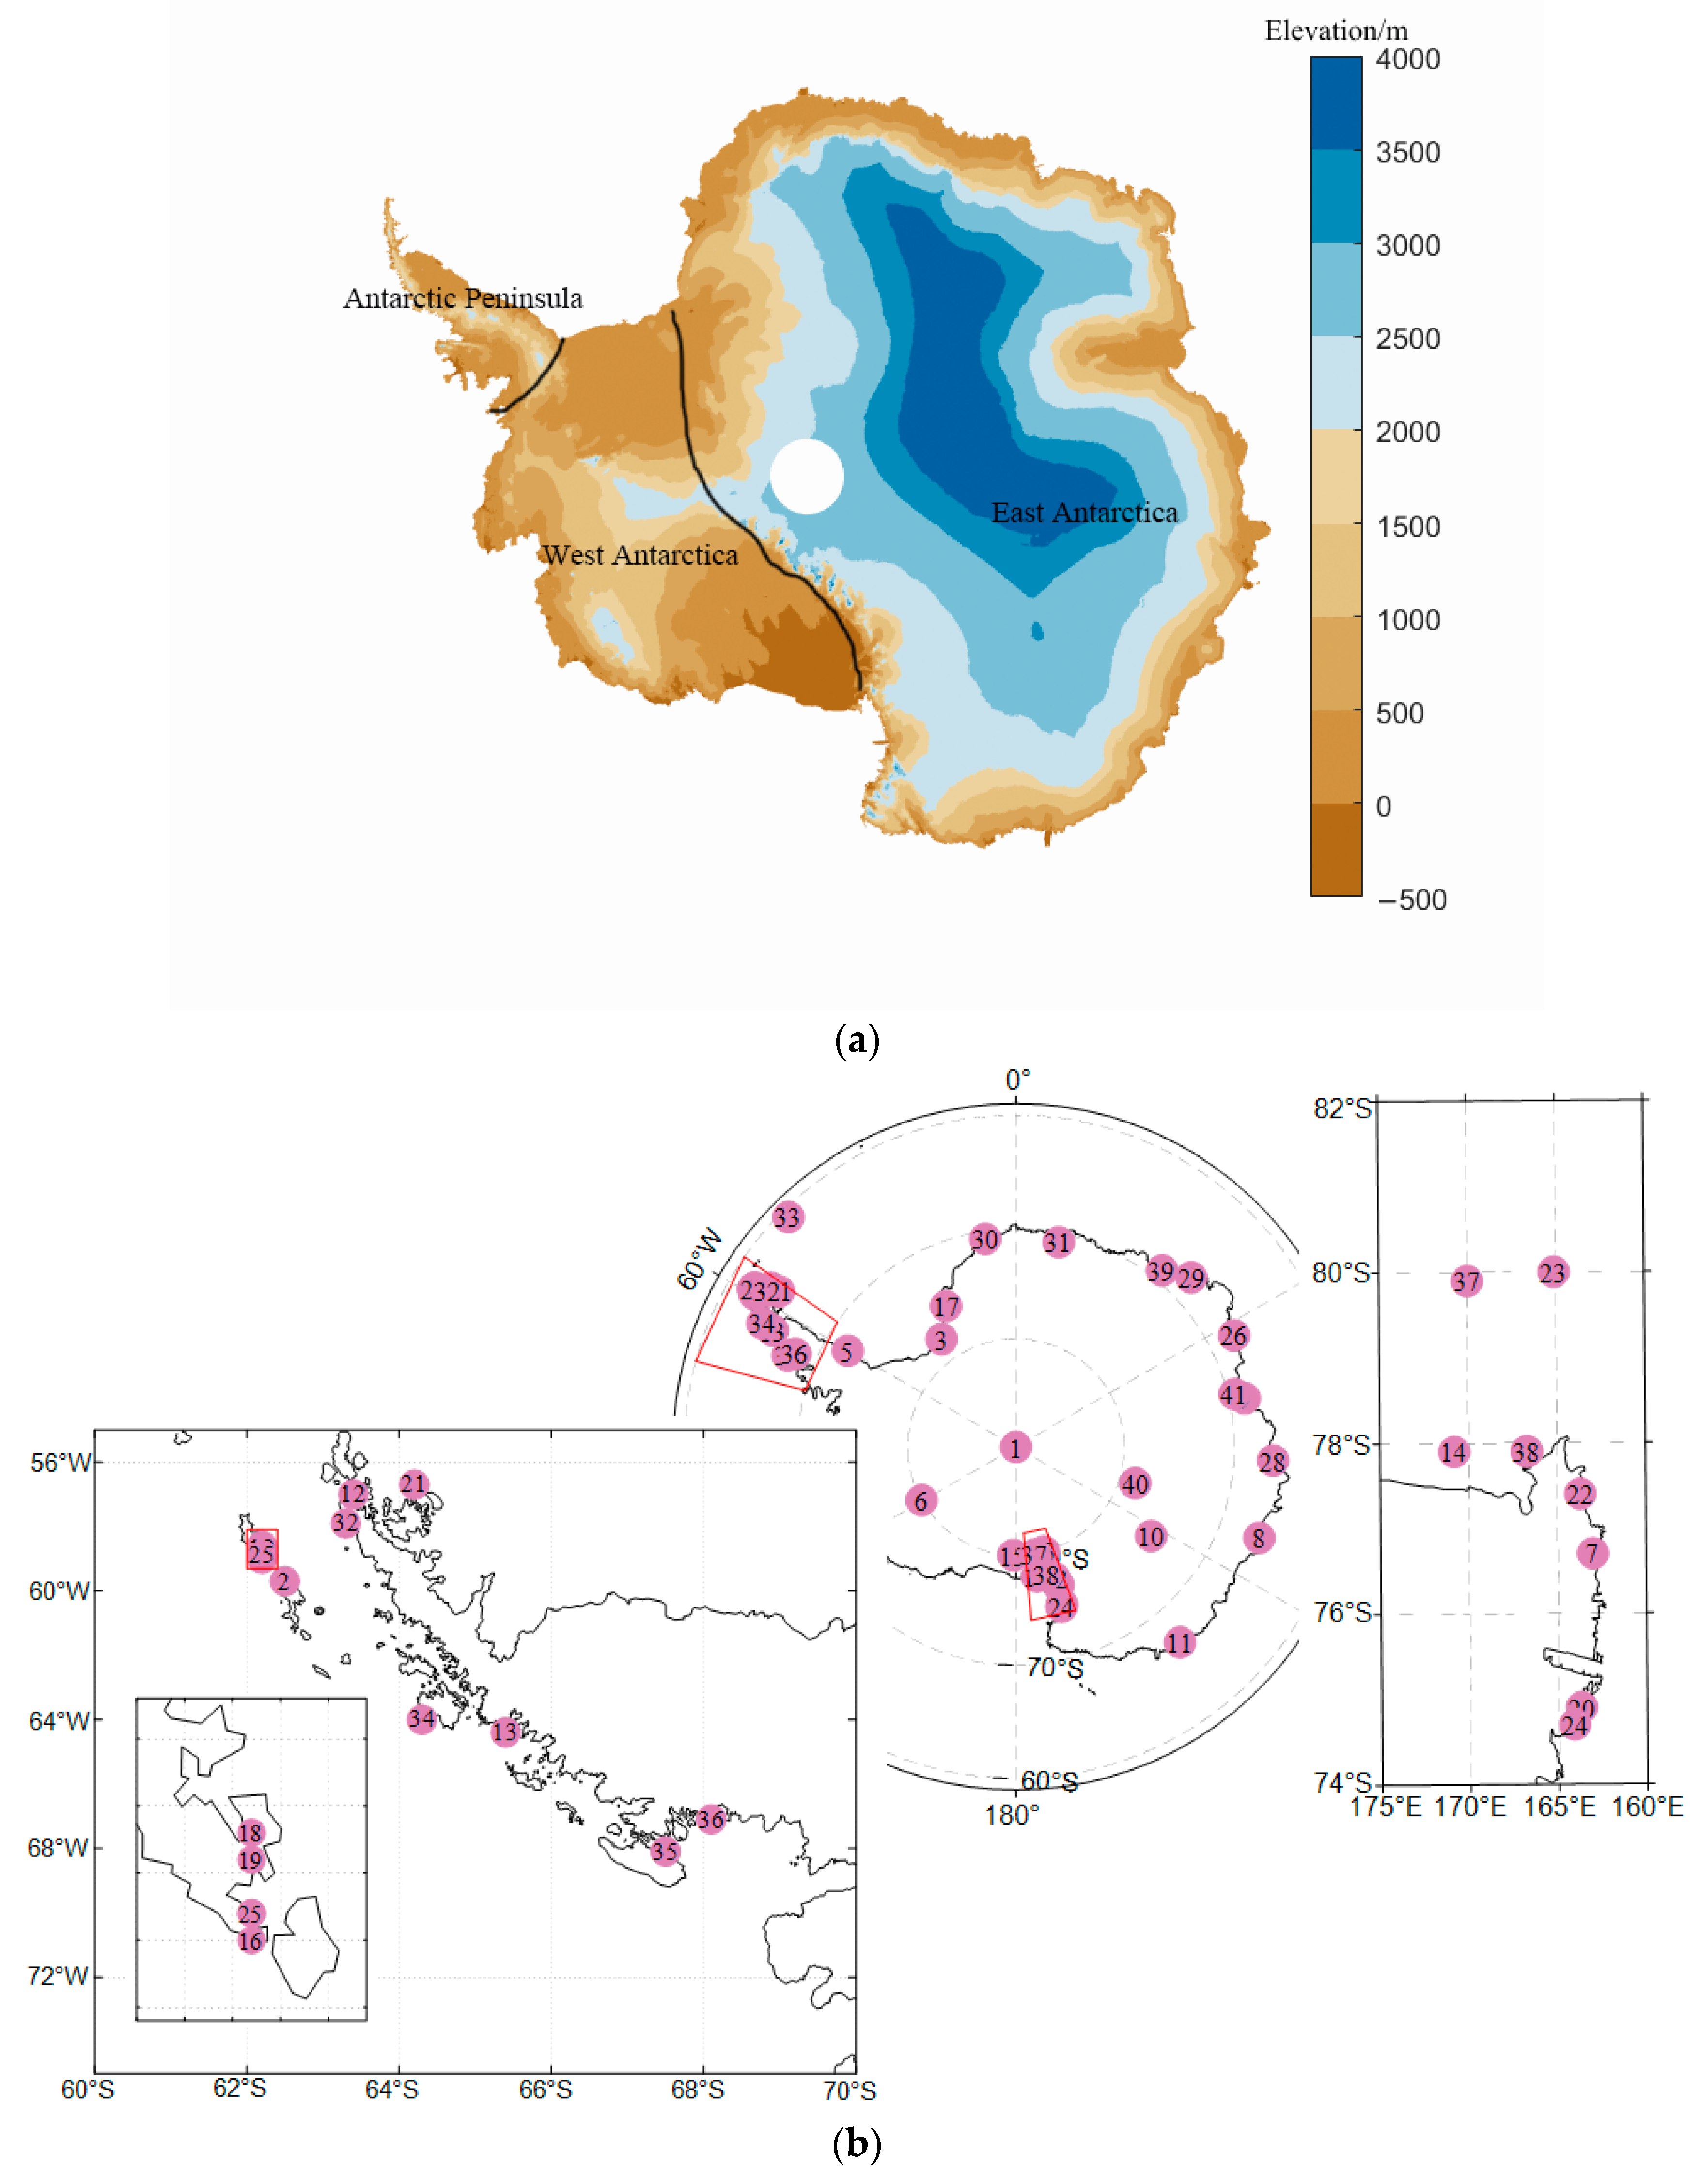
2. Materials and Methods
3. Results
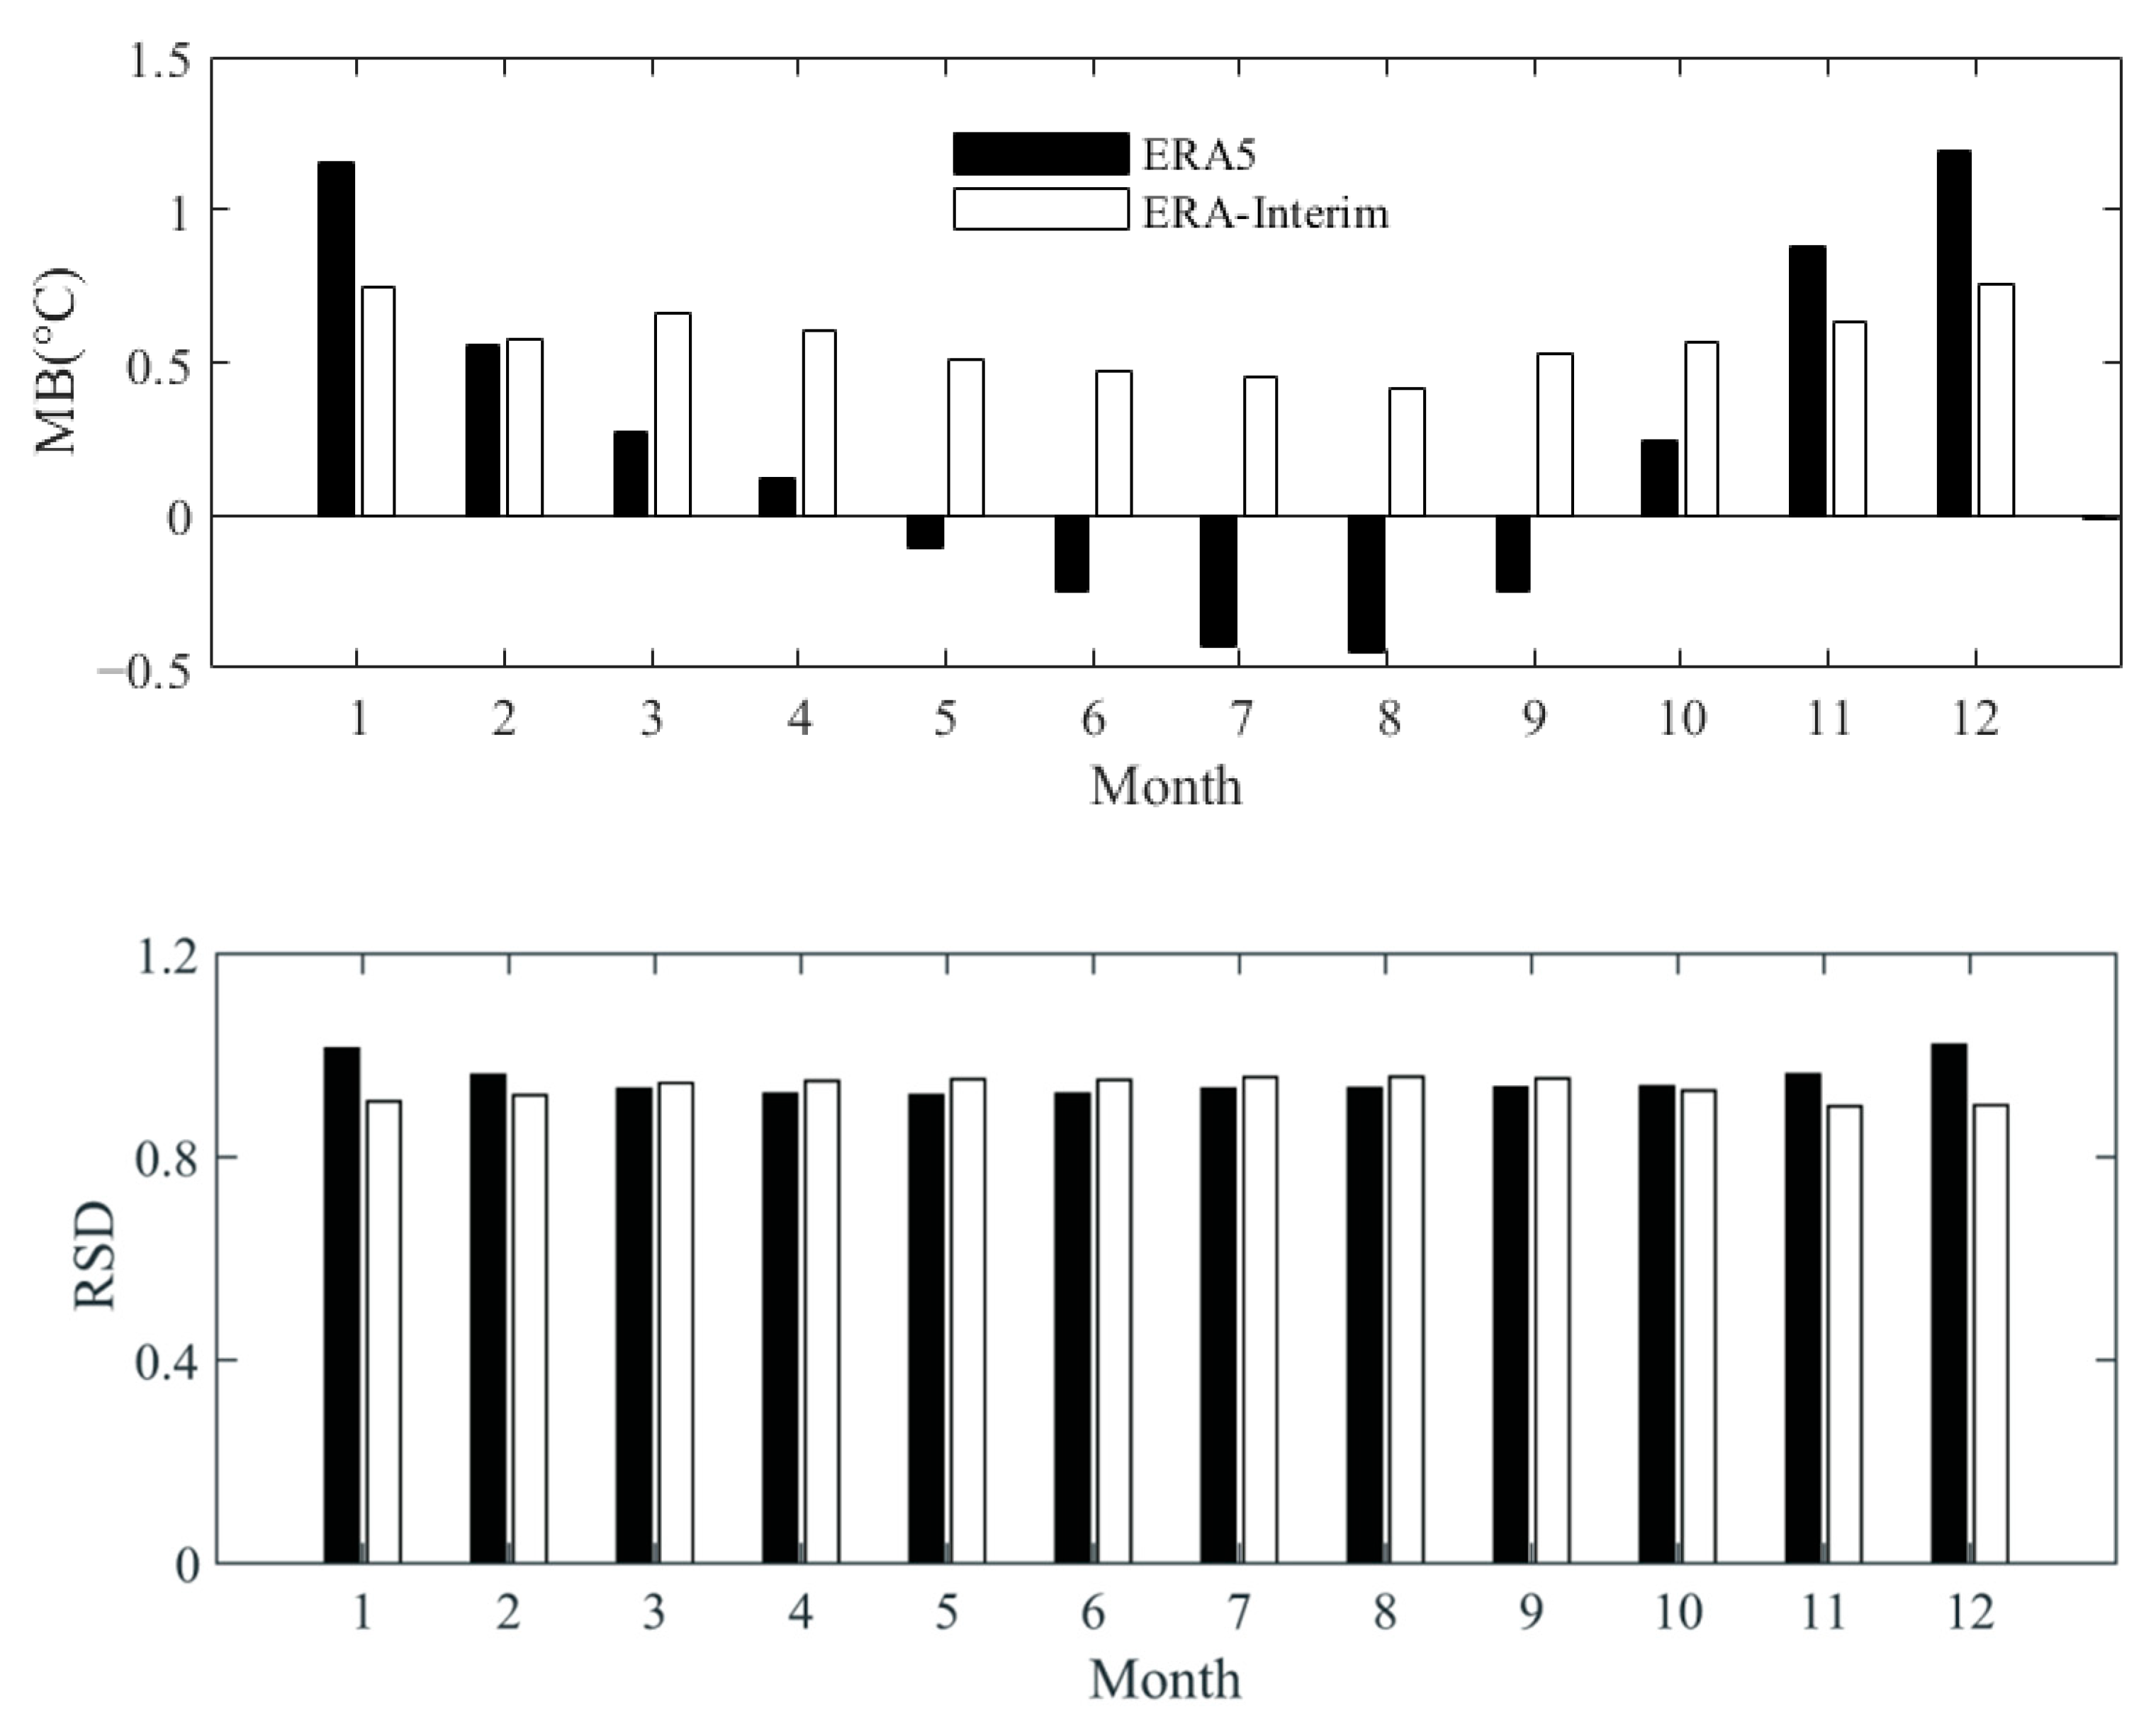
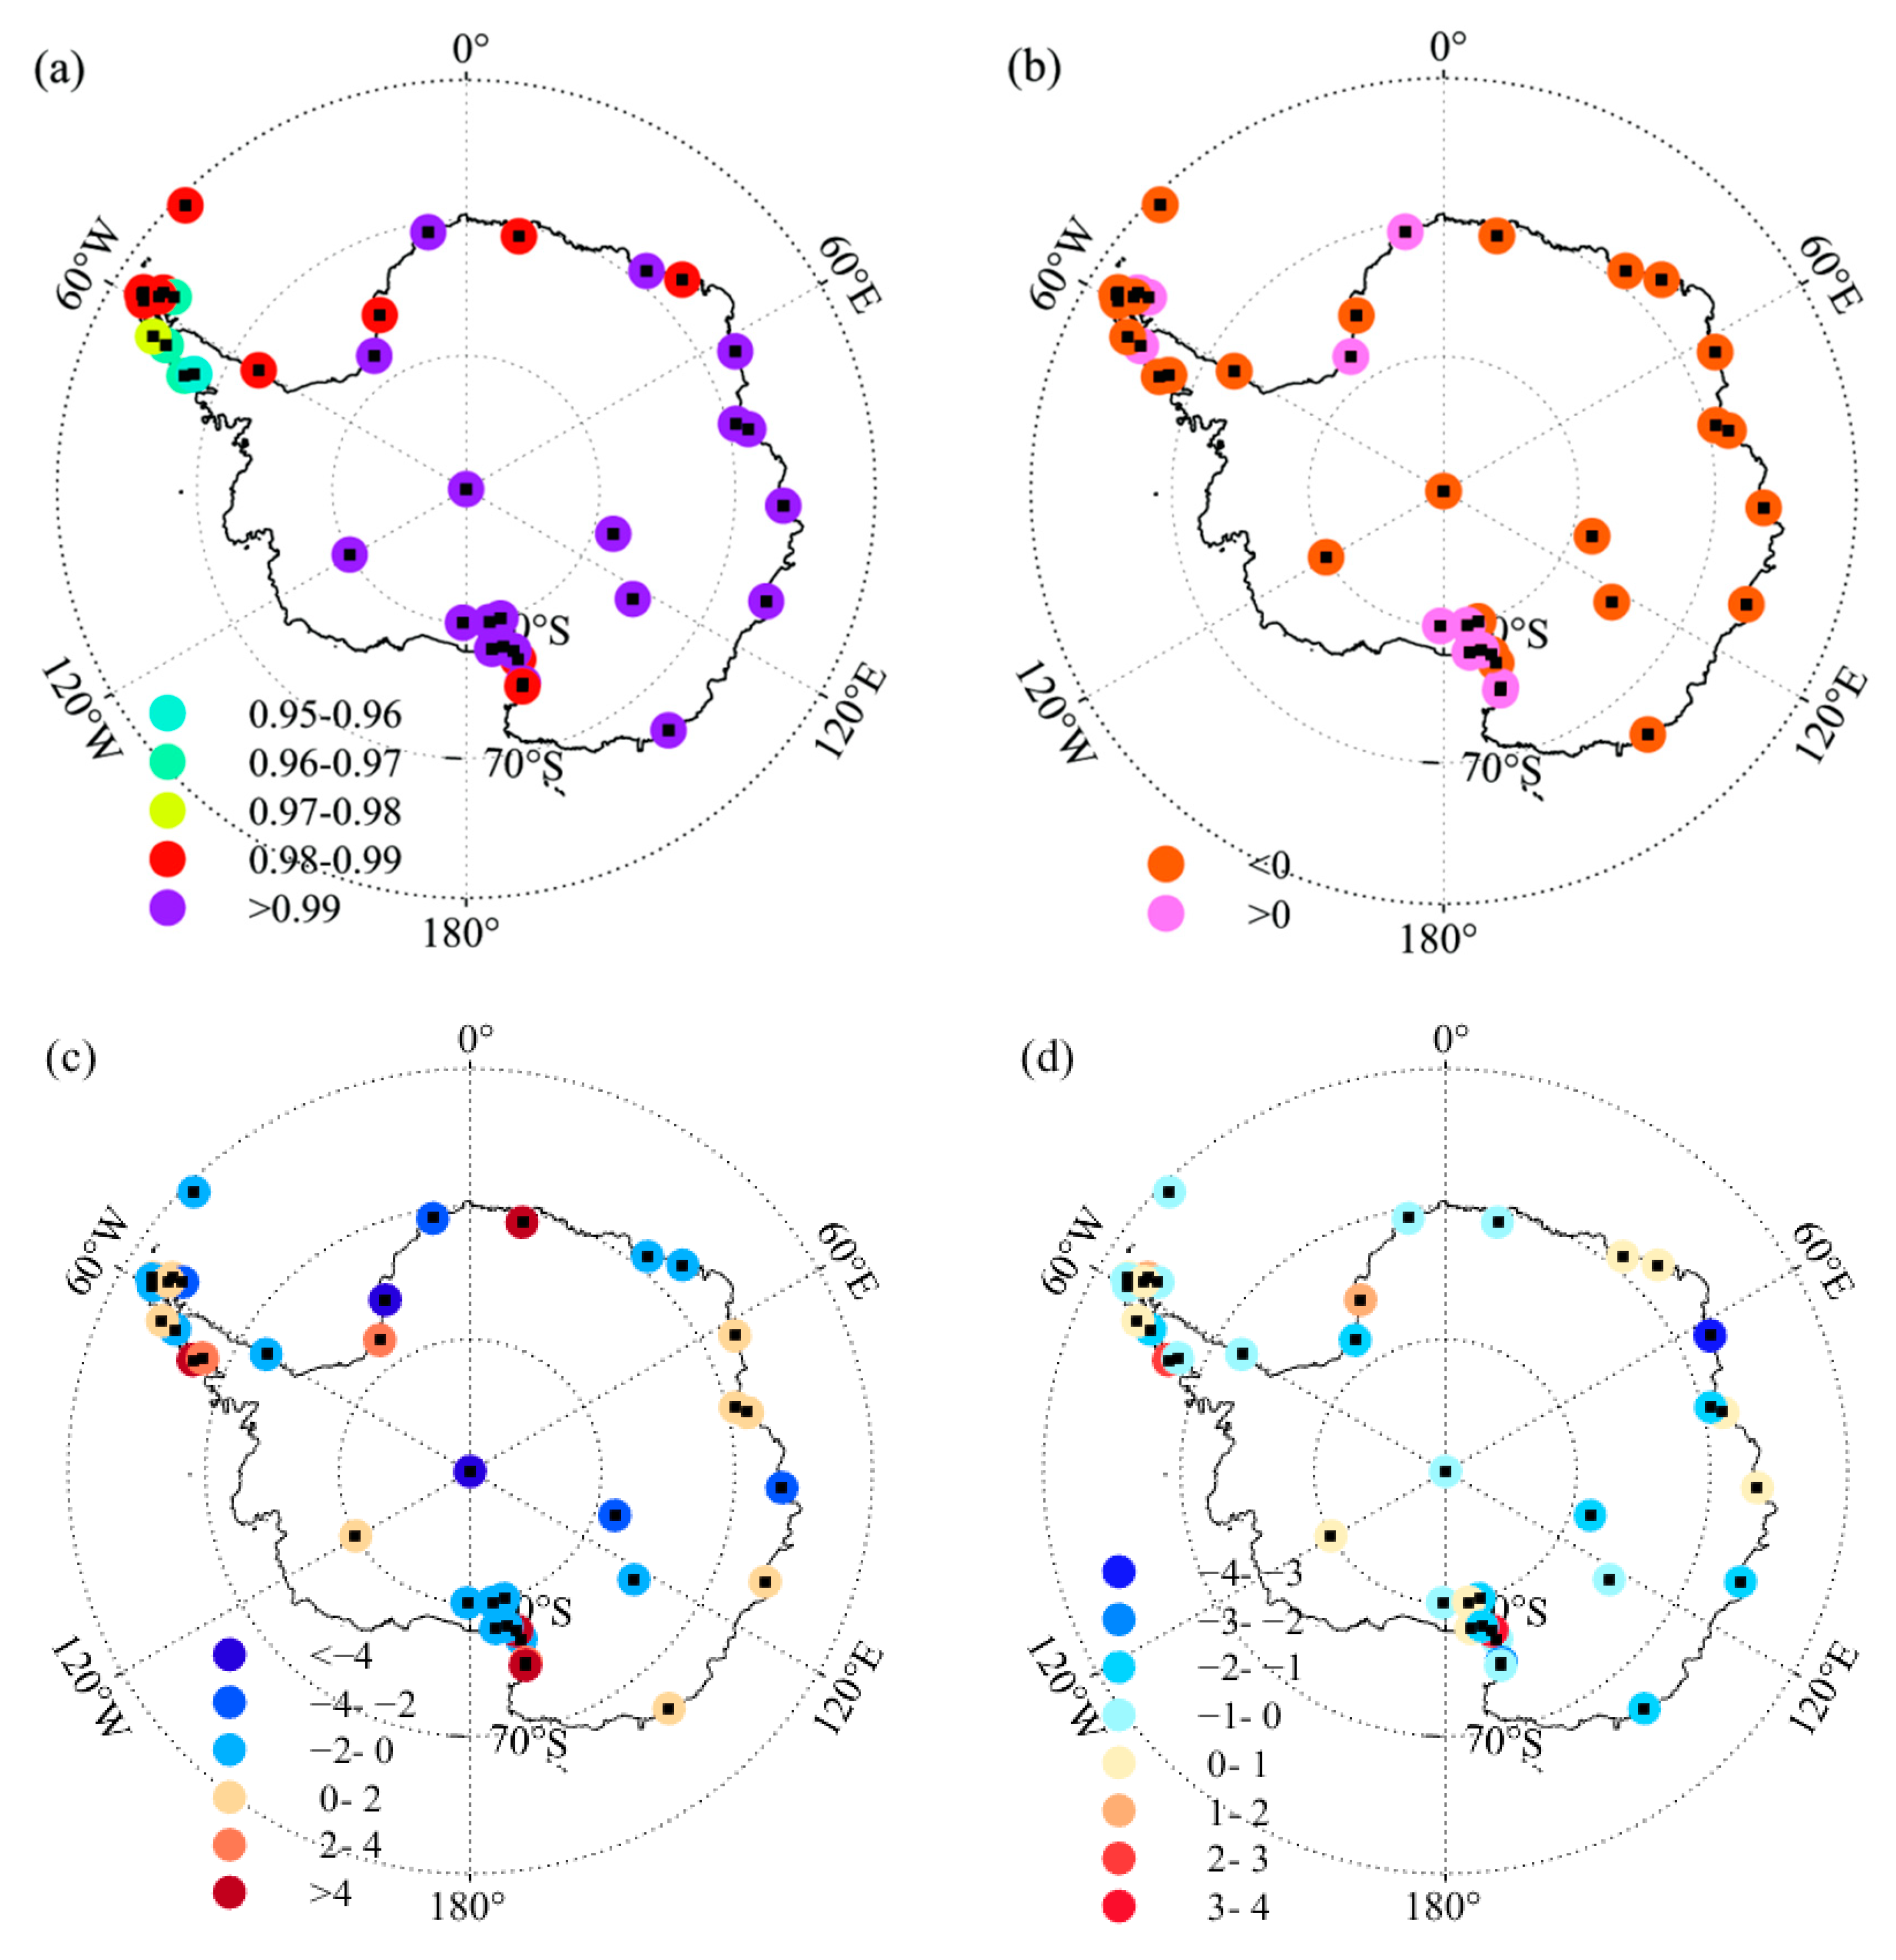
3.1. The Performance of ERA5 over Antarctica
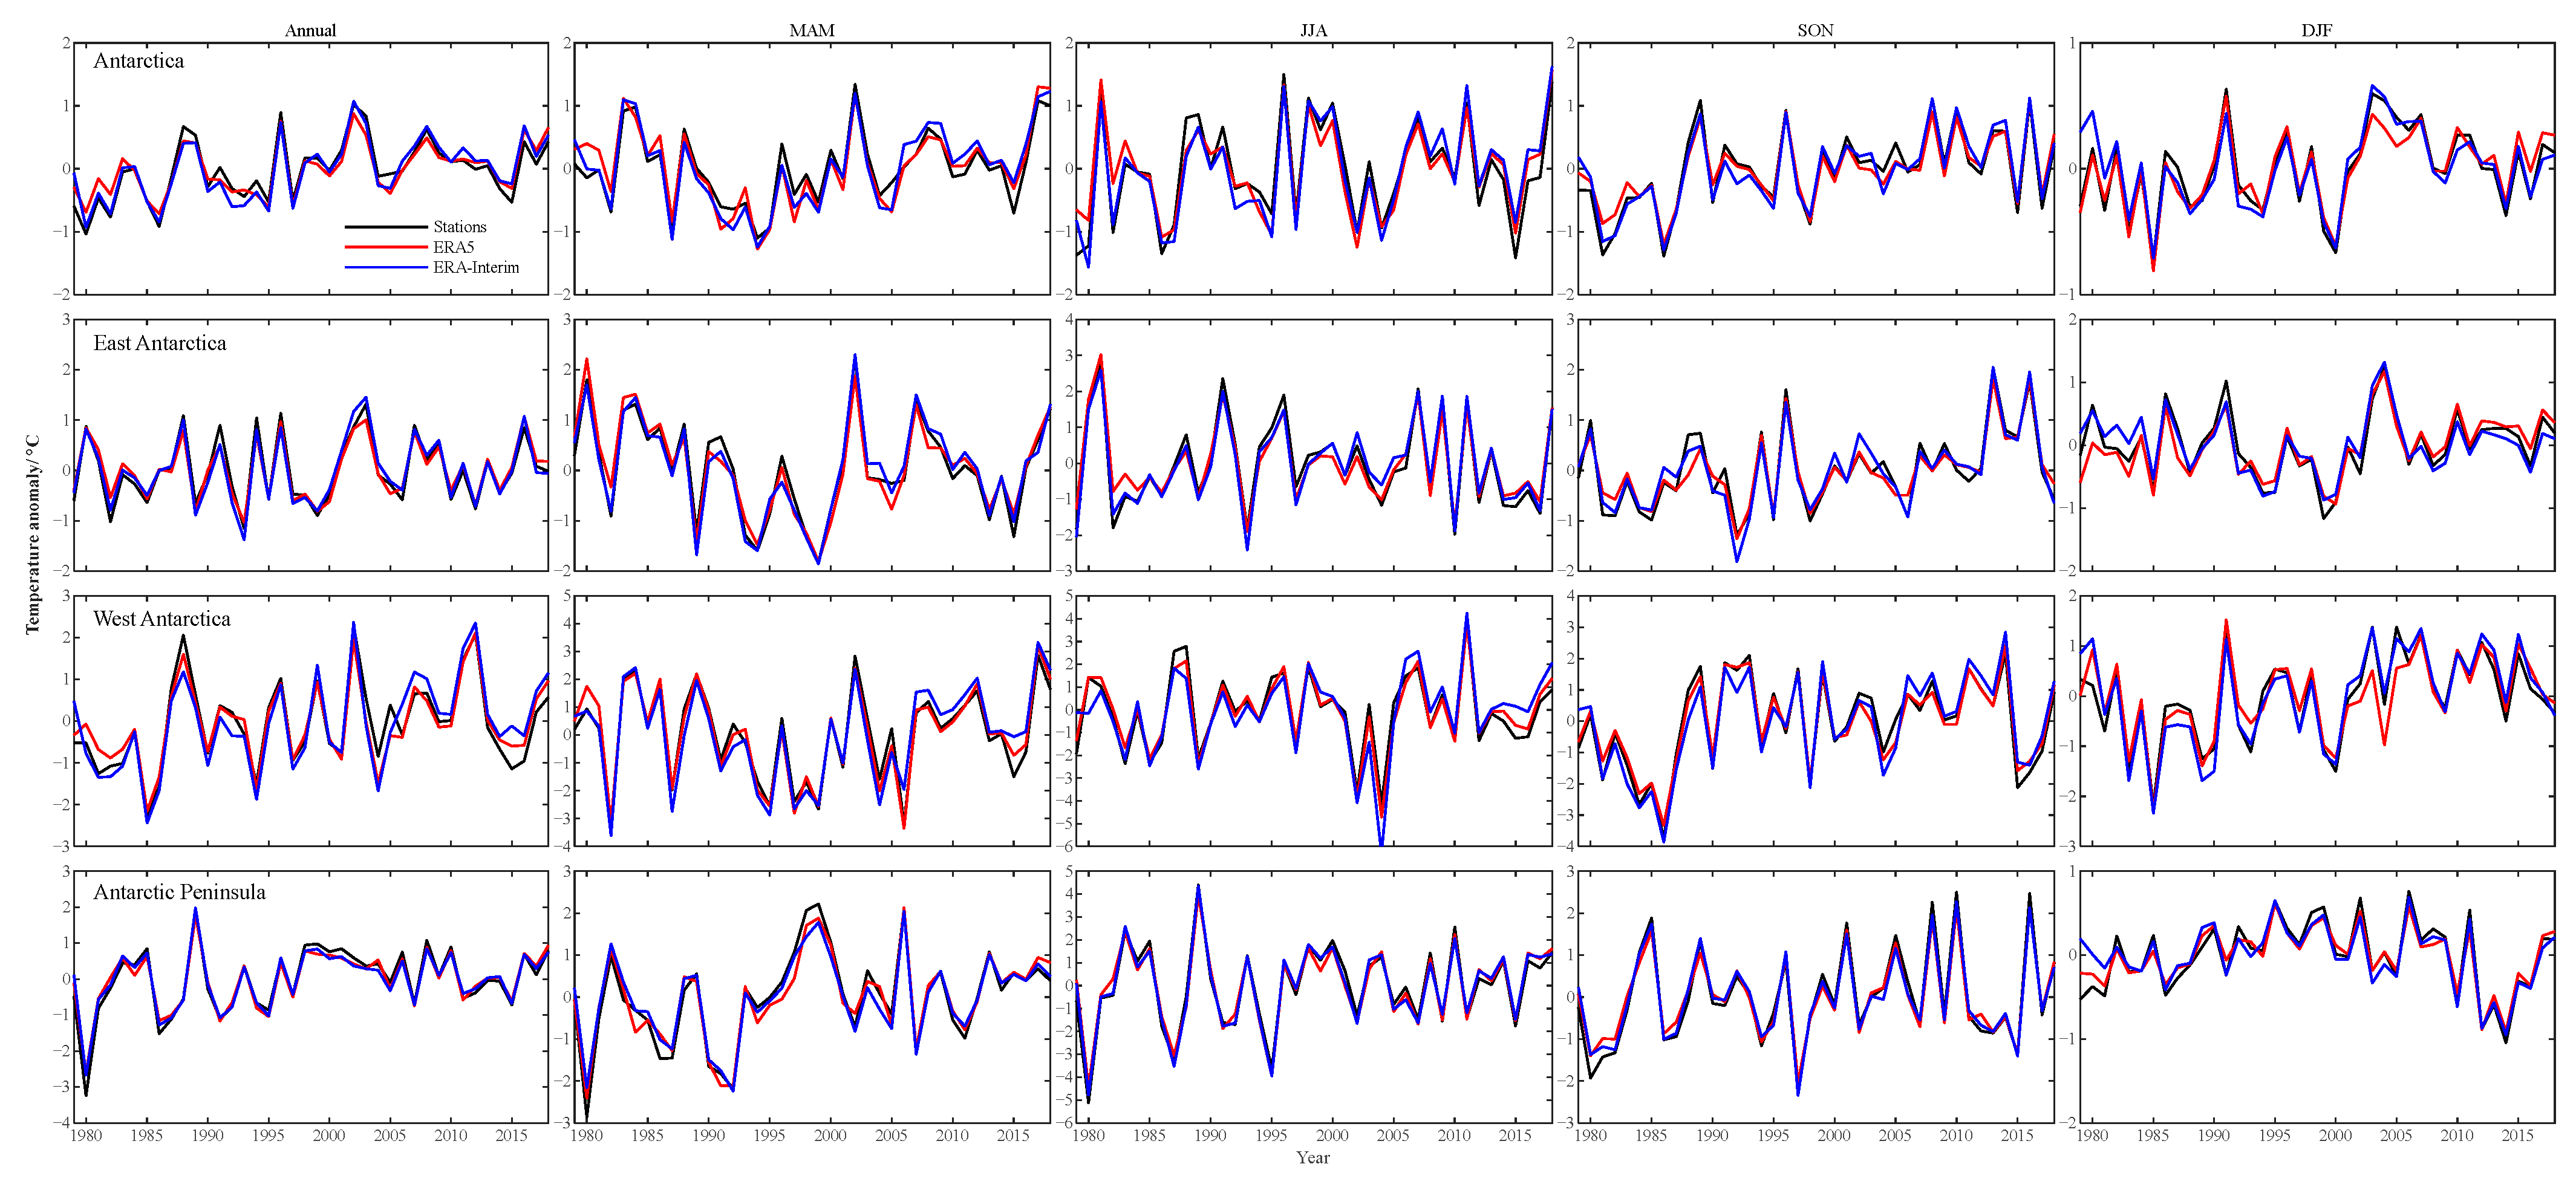
3.2. The Performance of ERA5 over the Three Subregions in Antarctica
4. Discussion
5. Conclusions
Author Contributions
Funding
Institutional Review Board Statement
Informed Consent Statement
Data Availability Statement
Acknowledgments
Conflicts of Interest
References
- Convey, P.; Bindschadler, R.; di Prisco, G.; Fahrbach, E.; Gutt, J.; Hodgson, D.A.; Mayewski, P.A.; Summerhayes, C.P.; Turner, J.; Consortium, A. Antarctic climate change and the environment. Antarct. Sci. 2009, 21, 541–563. [Google Scholar] [CrossRef] [Green Version]
- Rintoul, S.R.; Chown, S.L.; DeConto, R.M.; England, M.H.; Fricker, H.A.; Masson-Delmotte, V.; Naish, T.R.; Siegert, M.J.; Xavier, J.C. Choosing the future of Antarctica. Nature 2018, 558, 233–241. [Google Scholar] [CrossRef] [PubMed]
- Mai, Y.; Sheng, Z.; Shi, H.; Liao, Q.; Zhang, W. Spatiotemporal Distribution of Atmospheric Ducts in Alaska and Its Relationship with the Arctic Vortex. Int. J. Antennas Propag. 2020, 6, 9673289. [Google Scholar] [CrossRef]
- Bronselaer, B.; Winton, M.; Griffies, S.M.; Hurlin, W.J.; Rodgers, K.B.; Sergienko, O.V.; Stouffer, R.J.; Russell, J.L. Change in future climate due to Antarctic meltwater. Nature 2018, 564, 53–58. [Google Scholar] [CrossRef] [PubMed]
- Yuan, N.; Ding, M.; Huang, Y.; Fu, Z.; Xoplaki, E.; Luterbacher, J. On the Long-Term Climate Memory in the Surface Air Temperature Records over Antarctica: A Nonnegligible Factor for Trend Evaluation. J. Clim. 2015, 28, 5922–5934. [Google Scholar] [CrossRef]
- Shepherd, A.; Ivins, E.; Rignot, E.; Smith, B.; van den Broeke, M.; Velicogna, I.; Whitehouse, P.; Briggs, K.; Joughin, I.; Krinner, G.; et al. Mass balance of the Antarctic Ice Sheet from 1992 to 2017. Nature 2018, 558, 219–222. [Google Scholar]
- Rignot, E.; Mouginot, J.; Scheuchl, B.; van den Broeke, M.; van Wessem, M.J.; Morlighem, M. Four decades of Antarctic Ice Sheet 630 mass balance from 1979–2017. Proc. Natl. Acad. Sci. USA 2019, 116, 1095–1103. [Google Scholar] [CrossRef] [Green Version]
- Seroussi, H.; Nowicki, S.; Payne, A.J.; Goelzer, H.; Lipscomb, W.H.; Abe-Ouchi, A.; Agosta, C.; Albrecht, T.; Asay-Davis, X.; Barthel, A.; et al. ISMIP6 Antarctica: A multi-model ensemble of the Antarctic ice sheet evolution over the 21st century. Cryosphere 2020, 14, 3033–3070. [Google Scholar] [CrossRef]
- Bintanja, R.; van Oldenborgh, G.J.; Drijfhout, S.S.; Wouters, B.; Katsman, C.A. Important role for ocean warming and increased ice-shelf melt in Antarctic sea-ice expansion. Nat. Geosci. 2013, 6, 376–379. [Google Scholar] [CrossRef]
- Trusel, L.D.; Frey, K.E.; Das, S.B.; Karnauskas, K.B.; Munneke, P.K.; van Meijgaard, E.; van den Broeke, M.R. Divergent trajectories of Antarctic surface melt under two twenty-first-century climate scenarios. Nat. Geosci. 2015, 8, 927–932. [Google Scholar] [CrossRef]
- Steig, E.J.; Schneider, D.P.; Rutherford, S.D.; Mann, M.E.; Comiso, J.C.; Shindell, D.T. Warming of the Antarctic ice-sheet surface since the 1957 International Geophysical Year. Nature 2009, 457, 459–462. [Google Scholar] [CrossRef]
- Turner, J.; Colwell, S.R.; Marshall, G.J.; Lachlan-Cope, T.A.; Carleton, A.M.; Jones, P.D.; Lagun, V.; Reid, P.A.; Iagovkina, S. Antarctic climate change during the last 50 years. Int. J. Climatol. 2005, 25, 279–294. [Google Scholar] [CrossRef]
- Turner, J.; Lu, H.; White, I.; King, J.C.; Phillips, T.; Hosking, J.S.; Bracegirdle, T.J.; Marshall, G.J.; Mulvaney, R.; Deb, P. Absence of 21st century warming on Antarctic Peninsula consistent with natural variability. Nature 2016, 535, 411–415. [Google Scholar] [CrossRef] [Green Version]
- Monaghan, A.J.; Bromwich, D.H.; Fogt, R.L.; Wang, S.H.; Mayewski, P.A.; Dixon, D.A.; Ekaykin, A.; Frezzotti, M.; Goodwin, I.; Isaksson, E.; et al. Insignificant change in Antarctic snowfall since the International Geophysical Year. Science 2006, 313, 827–831. [Google Scholar] [CrossRef] [PubMed] [Green Version]
- Nicolas, J.P.; Bromwich, D.H. New Reconstruction of Antarctic Near-Surface Temperatures: Multidecadal Trends and Reliability of Global Reanalyses. J. Clim. 2014, 27, 8070–8093. [Google Scholar] [CrossRef]
- Huai, B.; Wang, Y.; Ding, M.; Zhang, J.; Dong, X. An assessment of recent global atmospheric reanalyses for Antarctic near surface air temperature. Atmos. Res. 2019, 226, 181–191. [Google Scholar] [CrossRef]
- Hodges, K.I.; Lee, R.W.; Bengtsson, L. A Comparison of Extratropical Cyclones in Recent Reanalyses ERA-Interim, NASA MERRA, NCEP CFSR, and JRA-25. J. Clim. 2011, 24, 4888–4906. [Google Scholar] [CrossRef]
- Dee, D.P.; Uppala, S.M.; Simmons, A.J.; Berrisford, P.; Poli, P.; Kobayashi, S.; Andrae, U.; Balmaseda, M.A.; Balsamo, G.; Bauer, P.; et al. The ERA-Interim reanalysis: Configuration and performance of the data assimilation system. Q. J. R. Meteorol. Soc. 2011, 137, 553–597. [Google Scholar] [CrossRef]
- Mooney, P.A.; Mulligan, F.J.; Fealy, R. Comparison of ERA-40, ERA-Interim and NCEP/NCAR reanalysis data with observed surface air temperatures over Ireland. Int. J. Climatol. 2011, 31, 545–557. [Google Scholar] [CrossRef] [Green Version]
- Poveda, G.; Waylen, P.R.; Pulwarty, R.S. Annual and inter-annual variability of the present climate in northern South America and southern Mesoamerica. Paleogeogr. Paleoclimatol. Paleoecol. 2006, 234, 3–27. [Google Scholar] [CrossRef]
- Simmons, A.J.; Jones, P.D.; Bechtold, V.D.; Beljaars, A.C.M.; Kallberg, P.W.; Saarinen, S.; Uppala, S.M.; Viterbo, P.; Wedi, N. Comparison of trends and low-frequency variability in CRU, ERA-40, and NCEP/NCAR analyses of surface air temperature. J. Geophys. Res.-Atmos. 2004, 109, D24115. [Google Scholar] [CrossRef]
- Zhu, J.; Xie, A.; Ding, M.; Zhao, C.; Guo, X.; Hu, W.; Xu, B.; Qin, X. Applicability analysis of the air temperature in the CMA Global ReAnalysis product CRA Interim in the section from Zhongshan Station to Dome A, East Antarctica. J. Glaciol. Geocryol. 2020, 42, 1145–1157. [Google Scholar]
- Saha, S.; Moorthi, S.; Pan, H.L.; Wu, X.; Wang, J.; Nadiga, S.; Tripp, P.; Kistler, R.; Woollen, J.; Behringer, D.; et al. The NCEP Climate Forecast System Reanalysis. Bull. Amer. Meteor. Soc. 2010, 91, 1015–1057. [Google Scholar] [CrossRef]
- Kobayashi, S.; Ota, Y.; Harada, Y.; Ebita, A.; Moriya, M.; Onoda, H.; Onogi, K.; Kamahori, H.; Kobayashi, C.; Endo, H.; et al. The JRA-55 Reanalysis: General Specifications and Basic Characteristics. J. Meteorol. Soc. Jpn. 2015, 93, 5–48. [Google Scholar] [CrossRef] [Green Version]
- Xie, A.; Wang, S.; Xiao, C.; Kang, S.; Gong, J.; Ding, M.; Li, C.; Dou, T.; Ren, J.; Qin, D. Can temperature extremes in East Antarctica be replicated from ERA Interim reanalysis? Arct. Antarct. Alp. Res. 2016, 48, 603–621. [Google Scholar] [CrossRef] [Green Version]
- Kim, H.G.; Kim, J.Y.; Kang, Y.H. Comparative Evaluation of the Third-Generation Reanalysis Data for Wind Resource Assessment of the Southwestern Offshore in South Korea. Atmosphere 2018, 9, 73. [Google Scholar]
- Bao, X.; Zhang, F. Evaluation of NCEP-CFSR, NCEP-NCAR, ERA-Interim, and ERA-40 Reanalysis Datasets against Independent Sounding Observations over the Tibetan Plateau. J. Clim. 2013, 26, 206–214. [Google Scholar] [CrossRef] [Green Version]
- Zhang, Y.; Wang, Y.; Huai, B.; Ding, M.; Sun, W. Skill of the two 20th century reanalyses in representing Antarctic near-surface air temperature. Int. J. Climatol. 2018, 38, 4225–4238. [Google Scholar] [CrossRef]
- Jones, P.D.; Lister, D.H.; Osborn, T.J.; Harpham, C.; Salmon, M.; Morice, C.P. Hemispheric and large-scale land-surface air temperature variations: An extensive revision and an update to 2010. J. Geophys. Res.-Atmos. 2012, 117, D05127. [Google Scholar] [CrossRef] [Green Version]
- Jones, P.D.; Harpham, C. Estimation of the absolute surface air temperature of the Earth. J. Geophys. Res.-Atmos. 2013, 118, 3213–3217. [Google Scholar] [CrossRef] [Green Version]
- Jones, P.D.; Lister, D.H. Antarctic near-surface air temperatures compared with ERA-Interim values since 1979. Int. J. Climatol. 2015, 35, 1354–1366. [Google Scholar] [CrossRef]
- Freville, H.; Brun, E.; Picard, G.; Tatarinova, N.; Arnaud, L.; Lanconelli, C.; Reijmer, C.; van den Broeke, M. Using MODIS land surface temperatures and the Crocus snow model to understand the warm bias of ERA-Interim reanalyses at the surface in Antarctica. Cryosphere 2014, 8, 1361–1373. [Google Scholar] [CrossRef] [Green Version]
- Bracegirdle, T.J.; Marshall, G.J. The Reliability of Antarctic Tropospheric Pressure and Temperature in the Latest Global Reanalyses. J. Clim. 2012, 25, 7138–7146. [Google Scholar] [CrossRef] [Green Version]
- Tetzner, D.; Thomas, E.; Allen, C. A Validation of ERA5 Reanalysis Data in the Southern Antarctic Peninsula-Ellsworth Land Region, and Its Implications for Ice Core Studies. Geosciences 2019, 9, 289. [Google Scholar] [CrossRef] [Green Version]
- Lazzara, M.A.; Weidner, G.A.; Keller, L.M.; Thom, J.E.; Cassano, J.J. Antarctic Automatic Weather Station Program 30 Years of Polar Observations. Bull. Amer. Meteorol. Soc. 2012, 93, 1519–1537. [Google Scholar] [CrossRef]
- Turner, J.; Colwell, S.R.; Marshall, G.J.; Lachlan-Cope, T.A.; Carleton, A.M.; Jones, P.D.; Lagun, V.; Reid, P.A.; Iagovkina, S. The SCAR READER project: Toward a high-quality database of mean Antarctic meteorological observations. J. Clim. 2004, 17, 2890–2898. [Google Scholar] [CrossRef] [Green Version]
- Station Surface Data. Available online: https://legacy.bas.ac.uk/met/READER/surface (accessed on 2 February 2021).
- Available online: http://www.add.scar.org/index.jsp (accessed on 2 February 2021).
- Olauson, J. ERA5: The new champion of wind power modelling? Renew. Energy 2018, 126, 322–331. [Google Scholar] [CrossRef] [Green Version]
- Urraca, R.; Huld, T.; Gracia-Amillo, A.; Javier Martinez-de-Pison, F.; Kaspar, F.; Sanz-Garcia, A. Evaluation of global horizontal irradiance estimates from ERA5 and COSMO-REA6 reanalyses using ground and satellite-based data. Sol. Energy 2018, 164, 339–354. [Google Scholar] [CrossRef]
- Available online: https://cds.climate.copernicus.eu/#!/search?text=ERA5&type=dataset (accessed on 2 February 2021).
- Available online: https://apps.ecmwf.int/datasets/data/interim-full-daily/levtype=sfc/ (accessed on 2 February 2021).
- Xie, A.; Allison, I.; Xiao, C.; Wang, S.; Ren, J.; Qin, D. Assessment of air temperatures from different meteorological reanalyses for the East Antarctic region between Zhongshan and Dome A. Sci. China-Earth Sci. 2014, 57, 1538–1550. [Google Scholar] [CrossRef]
- Connolley, W.M. The Antarctic temperature inversion. Int. J. Climatol. 1996, 16, 1333–1342. [Google Scholar] [CrossRef]
- van de Berg, W.J.; van den Broeke, M.R.; van Meijgaard, E. Heat budget of the East Antarctic lower atmosphere derived from a regional atmospheric climate model. J. Geophys. Res.-Atmos. 2007, 112, D23101. [Google Scholar] [CrossRef] [Green Version]
- Genthon, C.; Six, D.; Favier, V.; Lazzara, M.; Keller, L. Atmospheric Temperature Measurement Biases on the Antarctic Plateau. J. Atmos. Ocean. Technol. 2011, 28, 1598–1605. [Google Scholar] [CrossRef]
- Bromwich, D.H.; Nicolas, J.P.; Hines, K.M.; Kay, J.E.; Key, E.L.; Lazzara, M.A.; Lubin, D.; McFarquhar, G.M.; Gorodetskaya, I.V.; Grosvenor, D.P.; et al. Tropospheric clouds in Antarctica. Rev. Geophys. 2012, 50, RG1004. [Google Scholar] [CrossRef] [Green Version]
- Stammerjohn, S.E.; Martinson, D.G.; Smith, R.C.; Yuan, X.; Rind, D. Trends in Antarctic annual sea ice retreat and advance and their relation to El Nino-Southern Oscillation and Southern Annular Mode variability. J. Geophys. Res.-Oceans 2008, 113, C03S90. [Google Scholar] [CrossRef] [Green Version]
- Oliva, M.; Navarro, F.; Hrbacek, F.; Hernandez, A.; Nyvlt, D.; Pereira, P.; Ruiz-Fernandez, J.; Trigo, R. Recent regional climate cooling on the Antarctic Peninsula and associated impacts on the cryosphere. Sci. Total Environ. 2017, 580, 210–223. [Google Scholar] [CrossRef]
- Ding, Q.; Steig, E.J.; Battisti, D.S.; Kuettel, M. Winter warming in West Antarctica caused by central tropical Pacific warming. Nat. Geosci. 2011, 4, 398–403. [Google Scholar] [CrossRef] [Green Version]
- Marshall, G.J.; Orr, A.; Turner, J. A Predominant Reversal in the Relationship between the SAM and East Antarctic Temperatures during the Twenty-First Century. J. Clim. 2013, 26, 5196–5204. [Google Scholar] [CrossRef] [Green Version]
- Turner, J.; Comiso, J.C.; Marshall, G.J.; Lachlan-Cope, T.A.; Bracegirdle, T.; Maksym, T.; Meredith, M.P.; Wang, Z.; Orr, A. Non-annular atmospheric circulation change induced by stratospheric ozone depletion and its role in the recent increase of Antarctic sea ice extent. Geophys. Res. Lett. 2009, 36, L08502. [Google Scholar] [CrossRef] [Green Version]
- Chapman, W.L.; Walsh, J.E. A synthesis of Antarctic temperatures. J. Clim. 2007, 20, 4096–4117. [Google Scholar] [CrossRef]
- Monaghan, A.J.; Bromwich, D.H.; Chapman, W.; Comiso, J.C. Recent variability and trends of Antarctic near-surface temperature. J. Geophys. Res.-Atmos. 2008, 113, D04105. [Google Scholar] [CrossRef]


| Number | Station Names | Latitude | Longitude | Elevation (m) | Record Lengths | Manual or AWS |
|---|---|---|---|---|---|---|
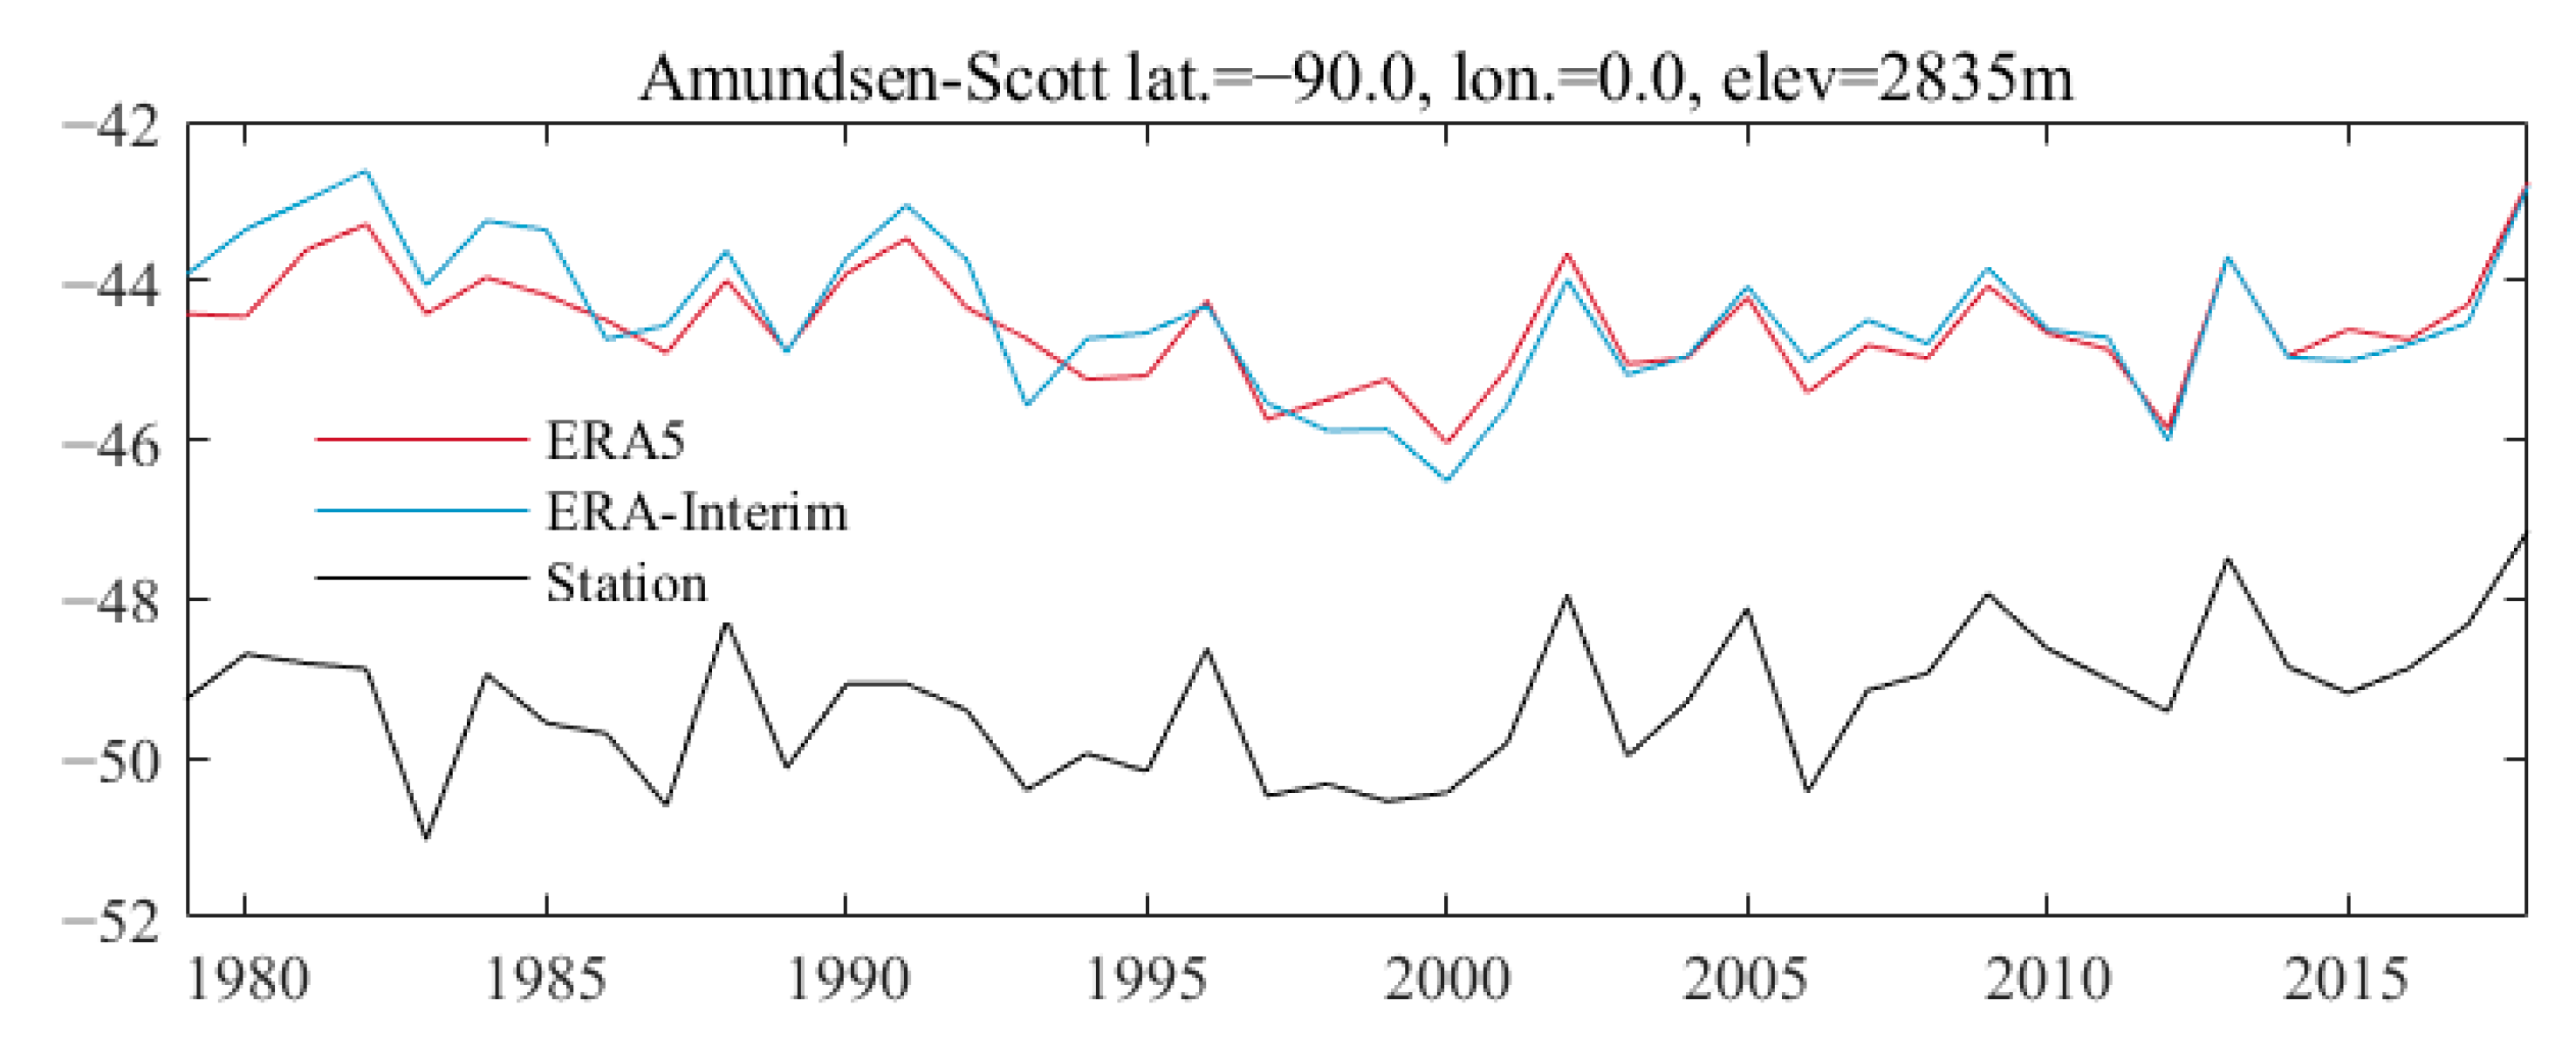
| 1 | Amundsen–Scott | 90S | 0E | 2835 | 1979–2018 | Manual |
| 2 | Arturo Prat | 62.5S | 59.7W | 5 | 1979–2018 | Manual |
| 3 | Belgrano II | 77.9S | 34.6W | 256 | 1980–2018 | Manual |
| 4 | Bellingshausen | 62.2S | 58.9W | 16 | 1979–2018 | Manual |
| 5 | Butler Island | 72.2S | 60.2W | 91 | 1986–2018 | AWS |
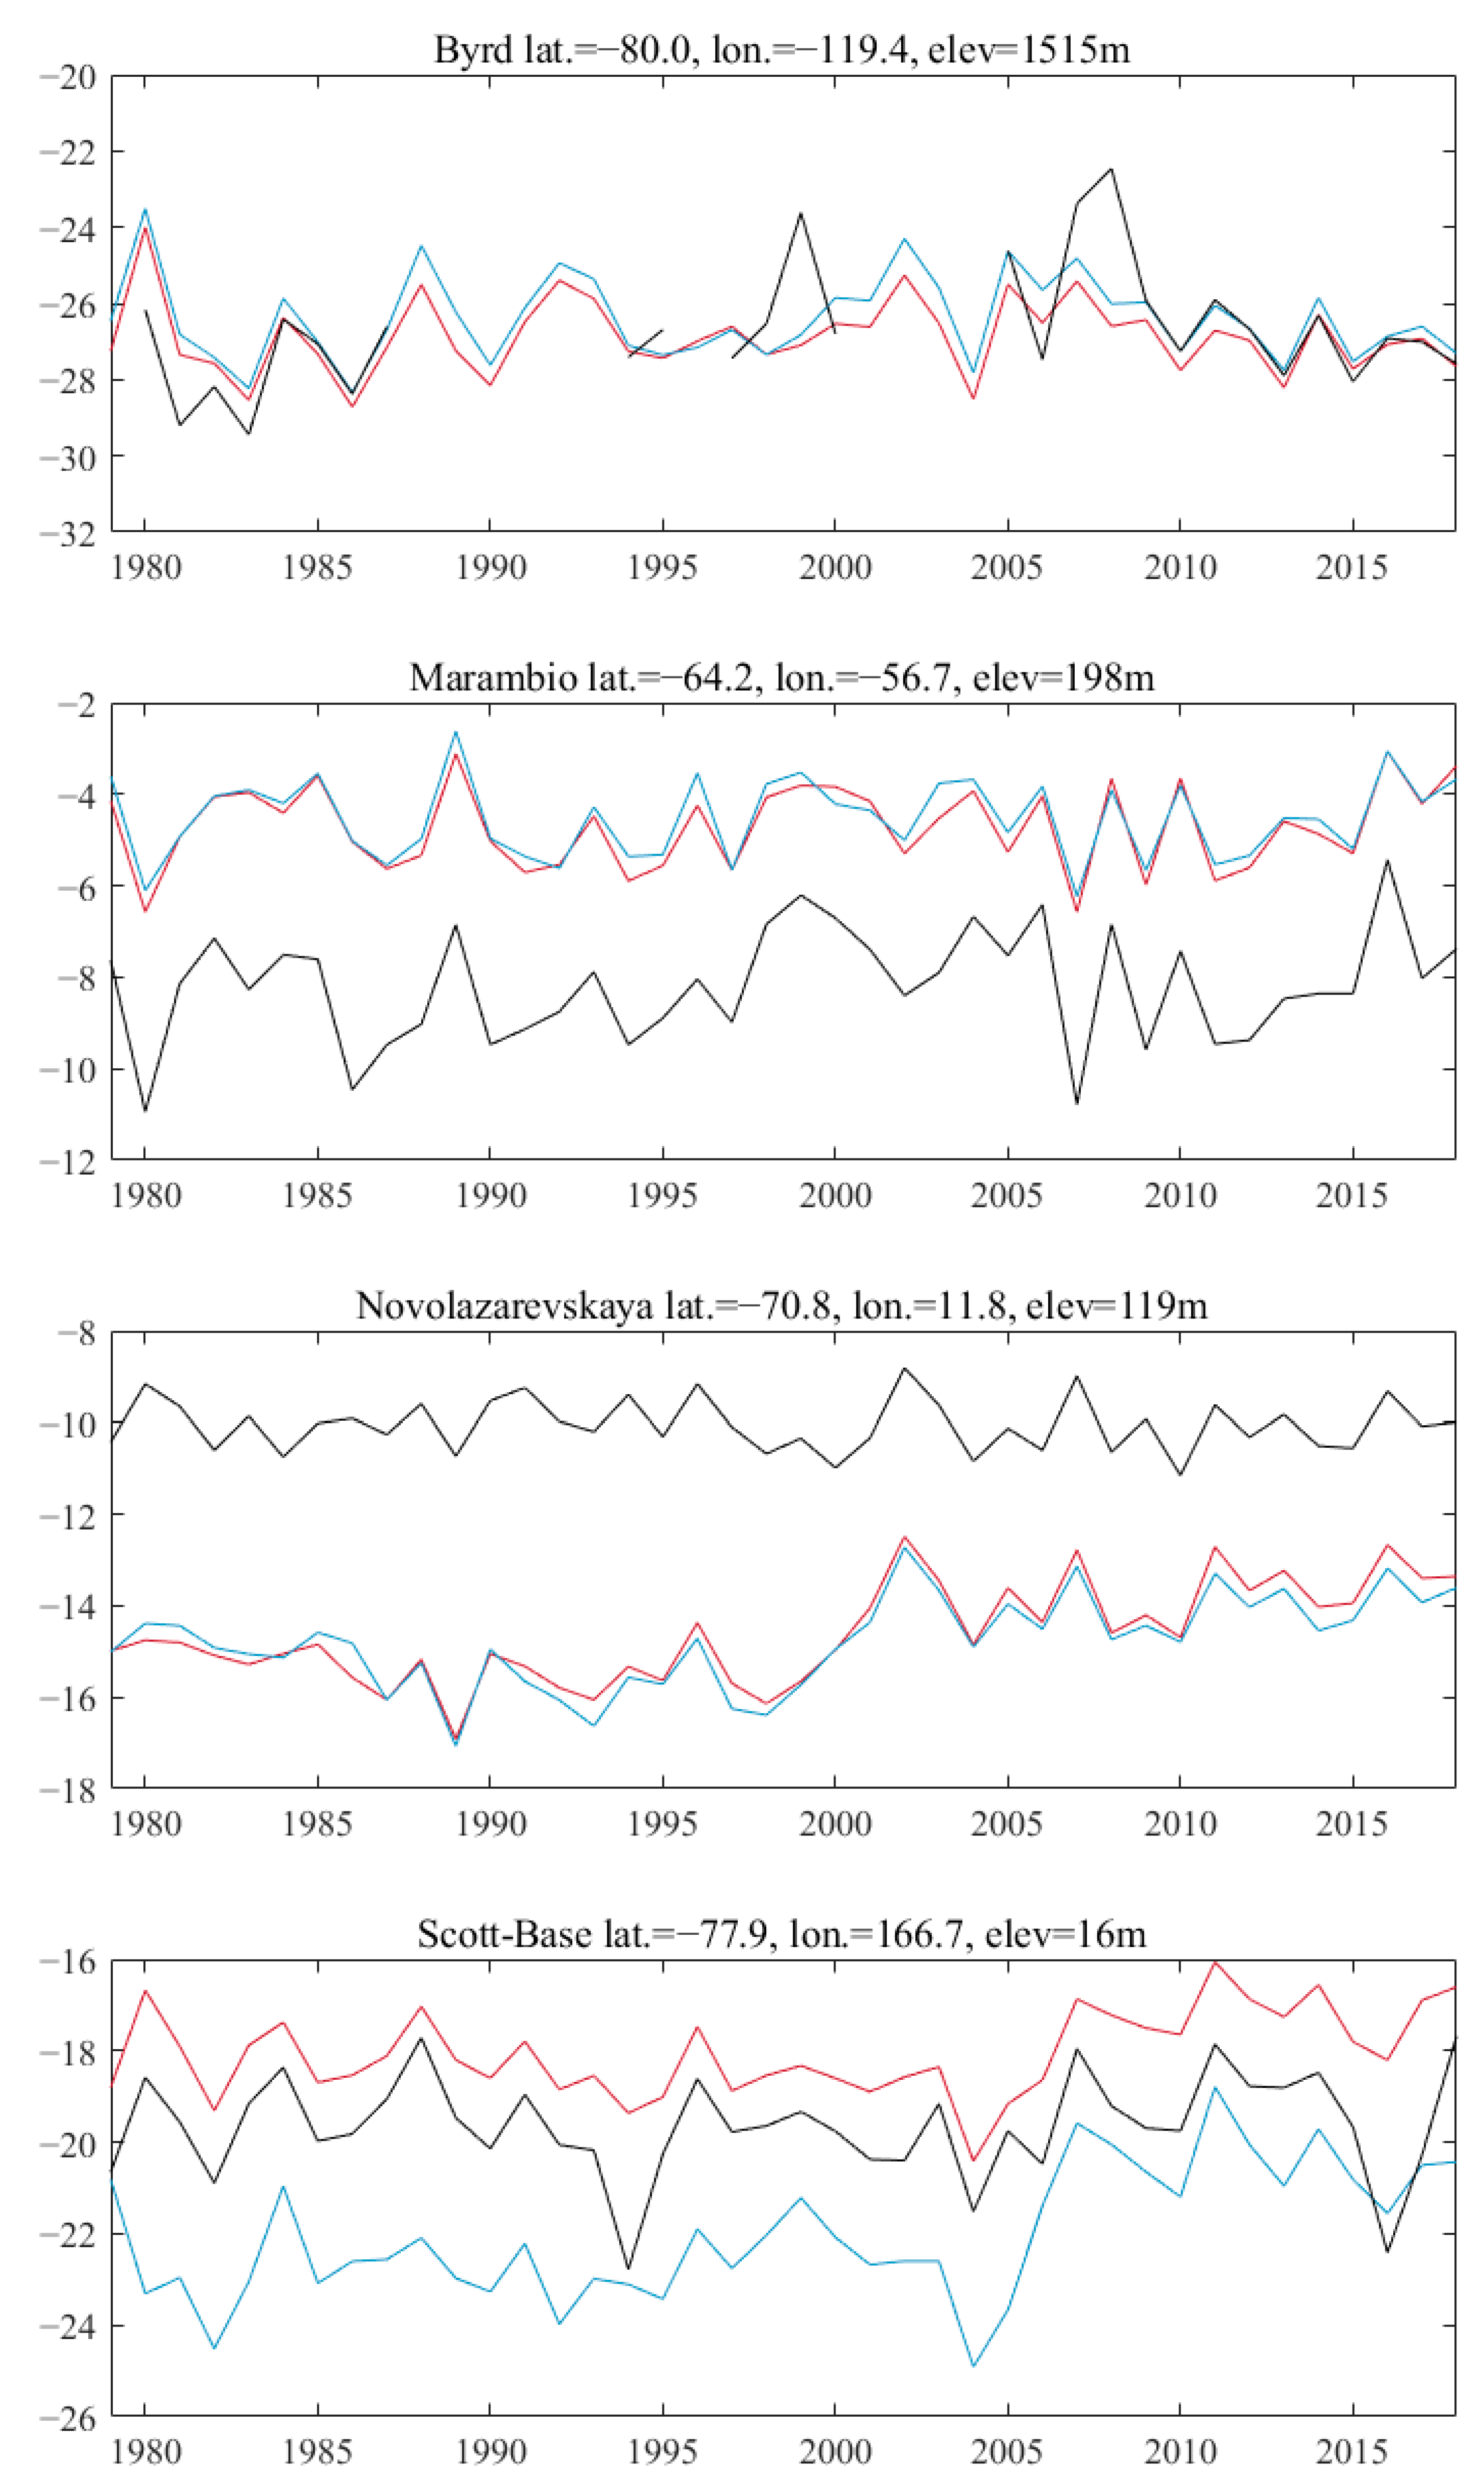
| 6 | Byrd | 80.0S | 119.4W | 1515 | 1980–2018 | Manual |
| 7 | Cape Ross | 76.7S | 163.0E | 201 | 1990–2018 | AWS |
| 8 | Casey | 66.3S | 110.5E | 42 | 1979–2018 | Manual |
| 9 | Davis | 68.6S | 78.0E | 13 | 1979–2018 | Manual |
| 10 | Dome C II | 75.1S | 123.4E | 3280 | 1995–2018 | AWS |
| 11 | Dumont d’Urville | 66.7S | 140.0E | 43 | 1979–2018 | Manual |
| 12 | Esperanza | 63.4S | 57.0W | 13 | 1979–2018 | Manual |
| 13 | Faraday | 65.4S | 64.4W | 11 | 1979–2018 | Manual |
| 14 | Ferrell | 77.9S | 170.8E | 45 | 1980–2018 | AWS |
| 15 | Gill | 80.0S | 178.6W | 30 | 1985–2018 | AWS |
| 16 | Great Wall | 62.2S | 59.0W | 10 | 1985–2018 | Manual |
| 17 | Halley | 75.5S | 26.4W | 30 | 1979–2018 | Manual |
| 18 | Jubany | 62.2S | 58.6W | 4 | 1985–2019 | Manual |
| 19 | King Sejong | 62.2S | 58.7W | 11 | 1988–2018 | Manual |
| 20 | Manuela | 74.9S | 163.7E | 80 | 1984–2018 | AWS |
| 21 | Marambio | 64.2S | 56.7W | 198 | 1979–2018 | Manual |
| 22 | Marble Point | 77.4S | 163.7E | 120 | 1980–2018 | AWS |
| 23 | Marilyn | 80.0S | 165.1E | 75 | 1987–2018 | AWS |
| 24 | Mario Zucchelli | 74.7S | 164.1E | 92 | 1987–2018 | Manual |
| 25 | Marsh | 62.2S | 58.9W | 10 | 1979–2018 | Manual |
| 26 | Mawson | 67.6S | 62.9E | 16 | 1979–2018 | Manual |
| 27 | McMurdo | 77.9S | 166.7E | 24 | 1979–2018 | Manual |
| 28 | Mirny | 66.5S | 93.0E | 30 | 1979–2018 | Manual |
| 29 | Molodeznaja | 67.7S | 45.9E | 40 | 1979–2018 | Manual |
| 30 | Neumayer | 70.7S | 8.4W | 50 | 1981–2018 | Manual |
| 31 | Novolazarevskaya | 70.8S | 11.8E | 119 | 1979–2018 | Manual |
| 32 | O’Higgins | 63.3S | 57.9W | 10 | 1979–2018 | Manual |
| 33 | Orcadas | 60.7S | 44.7W | 6 | 1979–2018 | Manual |
| 34 | Palmer | 64.3S | 64.0W | 8 | 1979–2018 | Manual |
| 35 | Rothera | 67.5S | 68.1W | 32 | 1979–2018 | Manual |
| 36 | San Martin | 68.1S | 67.1W | 4 | 1979–2018 | Manual |
| 37 | Schwerdtfeger | 79.9S | 170.0E | 60 | 1985–2018 | AWS |
| 38 | Scott Base | 77.9S | 166.7E | 16 | 1979–2018 | Manual |
| 39 | Syowa | 69.0S | 39.6E | 21 | 1979–2018 | Manual |
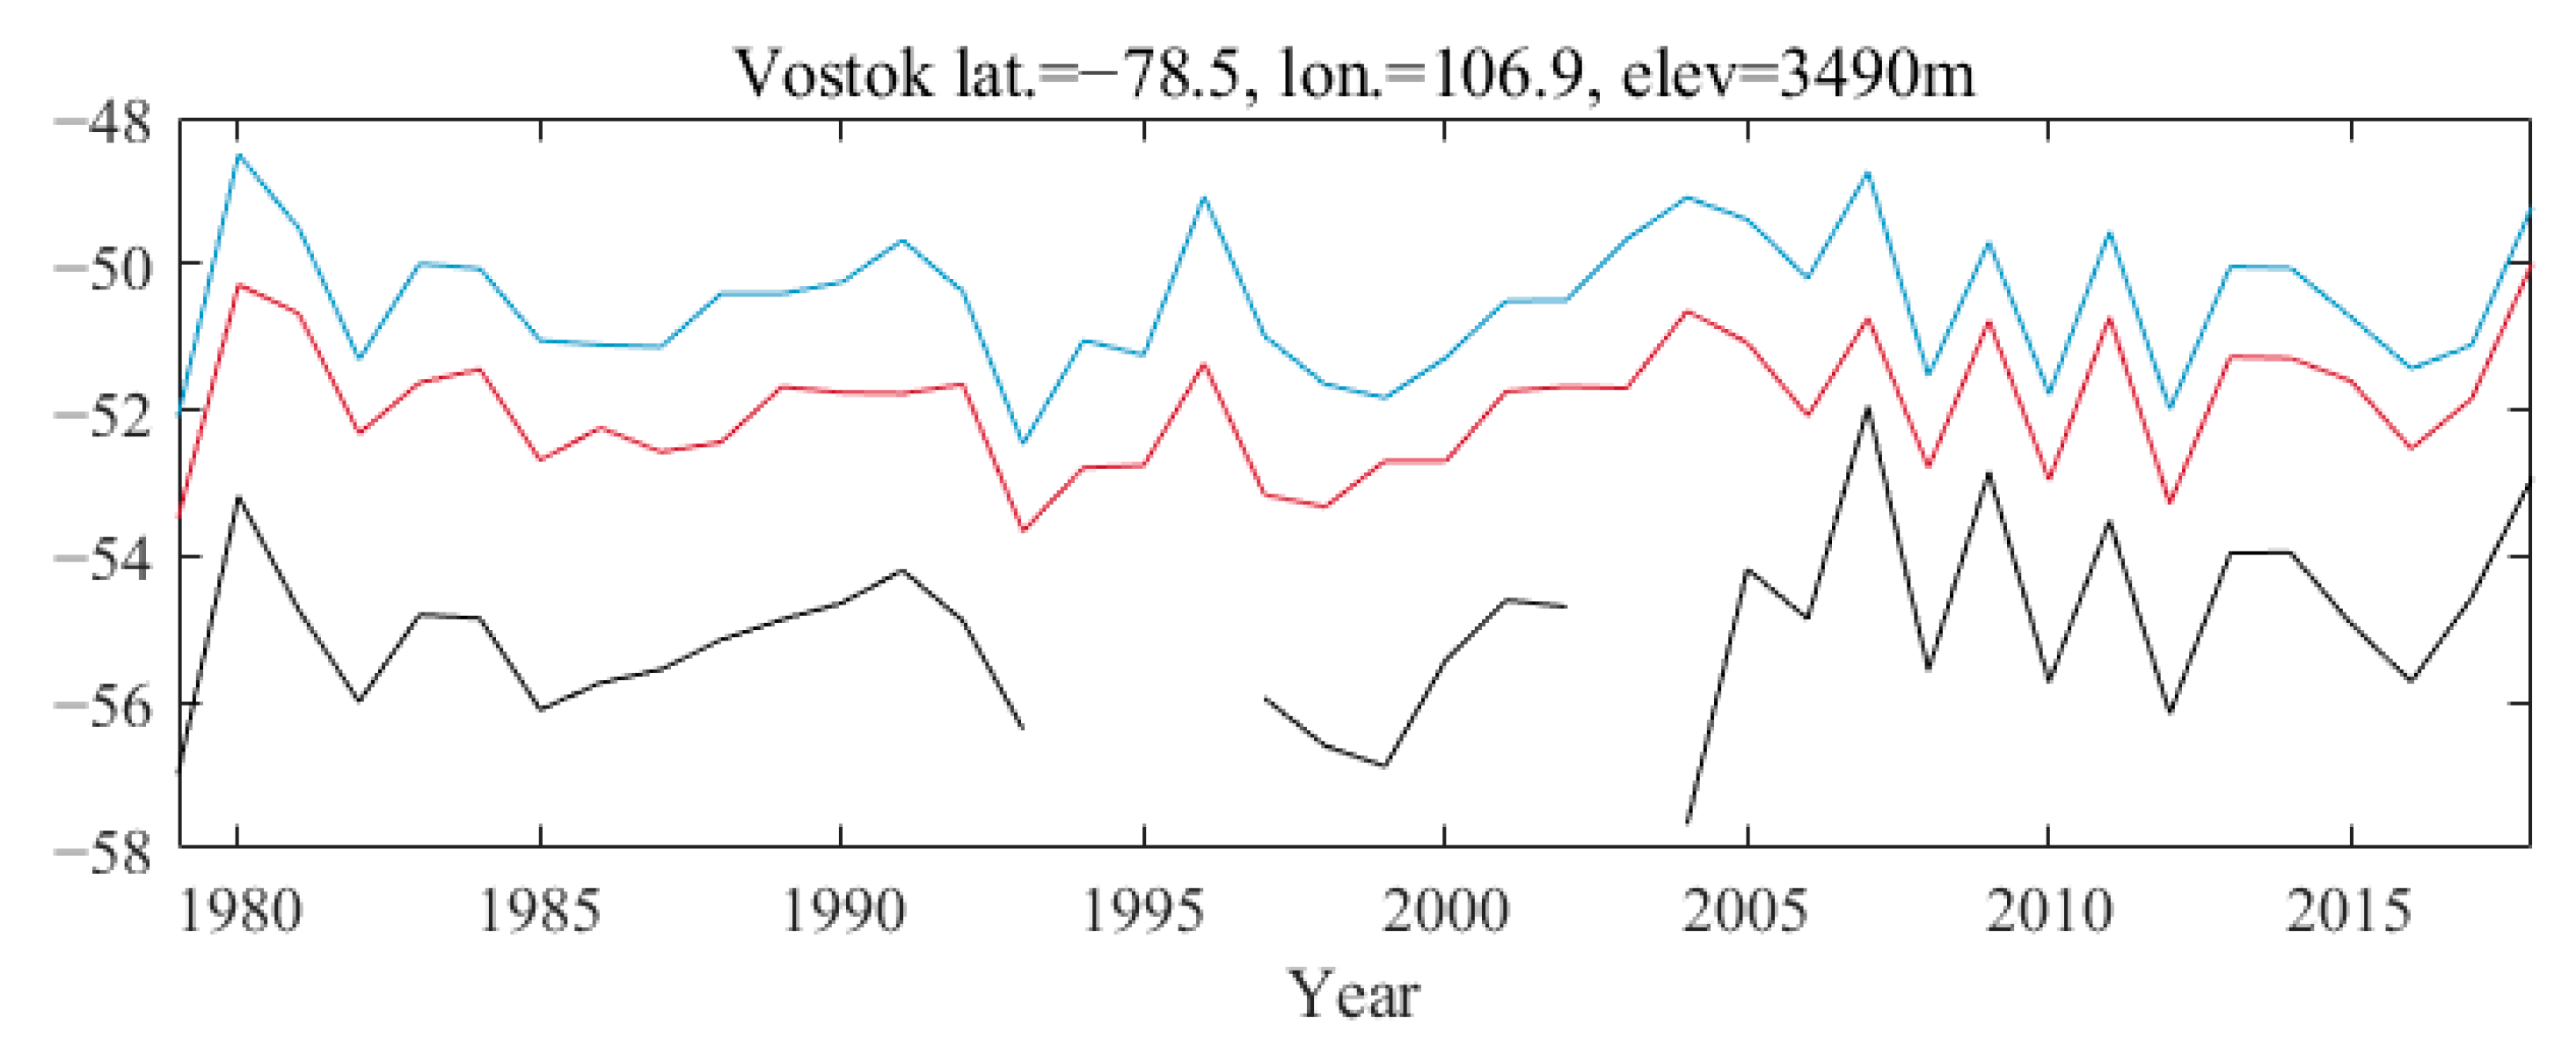
| 40 | Vostok | 78.5S | 106.9E | 3490 | 1979–2018 | Manual |
| 41 | Zhongshan | 69.4S | 76.4E | 18 | 1989–2018 | Manual |
| Antarctica | East Antarctica | West Antarctica | Antarctic Peninsula | ||
|---|---|---|---|---|---|
| Annual | ERA5 | 0.92 | 0.89 | 0.93 | 0.94 |
| ERA-Interim | 0.91 | 0.88 | 0.91 | 0.96 | |
| MAM | ERA5 | 0.90 | 0.88 | 0.93 | 0.92 |
| ERA-Interim | 0.90 | 0.88 | 0.90 | 0.93 | |
| JJA | ERA5 | 0.92 | 0.91 | 0.93 | 0.92 |
| ERA-Interim | 0.91 | 0.90 | 0.88 | 0.94 | |
| SON | ERA5 | 0.93 | 0.91 | 0.97 | 0.93 |
| ERA-Interim | 0.93 | 0.91 | 0.96 | 0.95 | |
| DJF | ERA5 | 0.84 | 0.85 | 0.89 | 0.82 |
| ERA-Interim | 0.86 | 0.87 | 0.88 | 0.83 |
| Antarctica | East Antarctica | West Antarctica | Antarctic Peninsula | ||
|---|---|---|---|---|---|
| Annual | ERA5 | 0.34 | 0.51 | −0.66 | 0.58 |
| ERA-Interim | 0.64 | 0.97 | 0.03 | 0.23 | |
| MAM | ERA5 | 0.16 | 0.07 | −0.77 | 0.67 |
| ERA-Interim | 0.64 | 0.93 | 0.20 | 0.15 | |
| JJA | ERA5 | −0.28 | −0.22 | −1.25 | 0.10 |
| ERA-Interim | 0.52 | 0.74 | 0.17 | −0.04 | |
| SON | ERA5 | 0.38 | 0.59 | −0.69 | 0.63 |
| ERA-Interim | 0.63 | 0.96 | −0.06 | 0.33 | |
| DJF | ERA5 | 1.06 | 1.53 | −0.01 | 0.96 |
| ERA-Interim | 0.76 | 1.25 | −0.20 | 0.53 |
| East Antarctica | West Antarctica | Antarctic Peninsula | ||
|---|---|---|---|---|
| ERA5 | −0.70 ± 0.24 | −0.42 ± 0.37 | 0.18 ± 0.23 | |
| Annual | ERA-Interim | −0.69 ± 0.23 | −0.06 ± 0.36 | 0.18 ± 0.24 |
| Stations | −0.56 ± 0.29 | −0.31 ± 0.33 | 0.17 ± 0.26 | |
| ERA5 | −1.20 ± 0.33 | −0.72 ± 0.64 | 0.24 ± 0.32 | |
| MAM | ERA-Interim | −1.10 ± 0.33 | −0.23 ± 0.60 | 0.17 ± 0.31 |
| Stations | −1.03 ± 0.34 | −0.55 ± 0.59 | 0.19 ± 0.34 | |
| ERA5 | −0.86 ± 0.43 | −0.80 ± 0.59 | 0.20 ± 0.53 | |
| JJA | ERA-Interim | −0.74 ± 0.44 | −0.26 ± 0.61 | 0.27 ± 0.55 |
| Stations | −0.69 ± 0.50 | −0.62 ± 0.57 | 0.17 ± 0.56 | |
| ERA5 | −0.52 ± 0.29 | −0.29 ± 0.47 | 0.05 ± 0.28 | |
| SON | ERA-Interim | −0.48 ± 0.29 | 0.12 ± 0.48 | 0.06 ± 0.30 |
| Stations | −0.33 ± 0.36 | −0.16 ± 0.48 | 0.10 ± 0.33 | |
| ERA5 | −0.39 ± 0.21 | −0.12 ± 0.30 | −0.03 ± 0.09 | |
| DJF | ERA-Interim | −0.56 ± 0.18 | −0.02 ± 0.31 | −0.07 ± 0.10 |
| Stations | −0.38 ± 0.22 | −0.06 ± 0.27 | −0.05 ± 0.11 |
| R | Bias | RSD | ||
|---|---|---|---|---|
| Annual | ERA5 | 0.94 | 0.08 | 0.98 |
| ERA-Interim | 0.95 | 1.45 | 1.00 | |
| MAM | ERA5 | 0.91 | 1.09 | 1.05 |
| ERA-Interim | 0.91 | 0.08 | 1.02 | |
| JJA | ERA5 | 0.89 | 1.19 | 0.98 |
| ERA-Interim | 0.88 | 0.21 | 0.98 | |
| SON | ERA5 | 0.96 | 0.03 | 0.97 |
| ERA-Interim | 0.96 | −4.72 | 0.99 | |
| DJF | ERA5 | 0.91 | 0.31 | 0.98 |
| ERA-Interim | 0.90 | 0.07 | 1.01 |
Publisher’s Note: MDPI stays neutral with regard to jurisdictional claims in published maps and institutional affiliations. |
© 2021 by the authors. Licensee MDPI, Basel, Switzerland. This article is an open access article distributed under the terms and conditions of the Creative Commons Attribution (CC BY) license (http://creativecommons.org/licenses/by/4.0/).
Share and Cite
Zhu, J.; Xie, A.; Qin, X.; Wang, Y.; Xu, B.; Wang, Y. An Assessment of ERA5 Reanalysis for Antarctic Near-Surface Air Temperature. Atmosphere 2021, 12, 217. https://doi.org/10.3390/atmos12020217
Zhu J, Xie A, Qin X, Wang Y, Xu B, Wang Y. An Assessment of ERA5 Reanalysis for Antarctic Near-Surface Air Temperature. Atmosphere. 2021; 12(2):217. https://doi.org/10.3390/atmos12020217
Chicago/Turabian StyleZhu, Jiangping, Aihong Xie, Xiang Qin, Yetang Wang, Bing Xu, and Yicheng Wang. 2021. "An Assessment of ERA5 Reanalysis for Antarctic Near-Surface Air Temperature" Atmosphere 12, no. 2: 217. https://doi.org/10.3390/atmos12020217