Article

Greenhouse Gas Emissions from Agriculture in EU Countries—State and Perspectives

by
Paulina Mielcarek-Bocheńska
1,* and
Wojciech Rzeźnik
2
1
Institute of Technology and Life Sciences, 05-090 Raszyn-Falenty, Poland
2
Institute of Environmental Engineering and Building Installations, Poznan University of Technology, 60-965 Poznań, Poland
*
Author to whom correspondence should be addressed.
Atmosphere 2021, 12(11), 1396; https://doi.org/10.3390/atmos12111396
Submission received: 30 September 2021 / Revised: 21 October 2021 / Accepted: 24 October 2021 / Published: 25 October 2021
(This article belongs to the Topic Climate Change and Environmental Sustainability)

Abstract

:
Agriculture is one of the main sources of greenhouse gas (GHG) emissions and has great potential for mitigating climate change. The aim of this study is to analyze the amount, dynamics of changes, and structure of GHG emissions from agriculture in the EU in the years 2005–2018. The research based on data about GHG collected by the European Environment Agency. The structure of GHG emissions in 2018 in the EU is as follows: enteric fermentation (45%), agricultural soils (37.8%), manure management (14.7%), liming (1.4%), urea application (1%), and field burning of agricultural residues (0.1%). Comparing 2018 with the base year, 2005, emissions from the agricultural sector decreased by about 2%, which is less than the assumed 10% reduction of GHG emissions in the non-emissions trading system (non-ETS) sector. The ambitious goals set by the EU for 2030 assume a 30% reduction in the non-ETS sector. This will require a significant reduction in GHG emissions from agriculture. Based on the analysis of the GHG emission structure and available reduction techniques, it was calculated that in this period, it should be possible to reduce emissions from agriculture by about 15%.

1. Introduction

The phenomenon of the natural greenhouse effect is positive for living conditions on the Earth. Thanks to this, the temperature of Earth surface is increased by 20–34 °C. Without the greenhouse effect, the average temperature of the Earth would be around −19 °C [1]. Gases that absorb radiation in the range emitted by the Earth’s surface cause the greenhouse effect and are called greenhouse gases (GHGs). The main GHGs are water vapor (H2O), carbon dioxide (CO2), methane (CH4), nitrous oxide (N2O), ozone (O3) [2]. Measurements carried out in recent decades have shown that the level of radiation escaping into space is getting smaller; so, the heat is accumulated on the Earth, and energy balance is disturbed. Therefore, it is observed the intensification of the greenhouse effect (global warming), which is caused by the growing concentration of greenhouse gases in the atmosphere [3,4,5].
The main anthropogenic GHG, carbon dioxide, is responsible for about 81% of global GHG emissions in the European Union (EU) (according to data for 2018); the next are methane and nitrous oxide, accounting for 10% and 6%, respectively [6]. Relatively high shares of methane and nitrous oxide in GHG emission, despite their low concentration in the atmosphere, are connected to global warming potential, which compares the ability of 1 kg of each gas to capture heat over a 100-year perspective. Methane has 21–36 times greater potential than CO2, and nitrous oxide 265–310 times greater than CO2 [7,8]. Another important parameter is the remaining time of gases in the atmosphere. Carbon dioxide does not break down easily and remains in the atmosphere for several centuries; nitrous oxide remains for about 121 years; and for methane, it is about 12 years [8,9].
The methane emission from agriculture is about 54% of total emissions of this gas in the EU, and for N2O, it is nearly 79% [6]. Therefore, despite the relatively small share of the agricultural sector in the EU’s global GHG emissions of around 10%, agriculture has great potential and is an important link in the strategy of reducing greenhouse gas emissions and mitigating climate change.
The intensification of the greenhouse effect and climate changes, for which the consequence is a necessity of GHG reduction, are currently some of the key issues in the EU’s environmental policy. One of the goals of the EU 2020 climate and energy package is to reduce greenhouse gas emissions by 20% compared with 1990 levels [10]. In sectors not covered by the emissions trading system (non-ETS sectors), reduction targets have been set individually for each member state [11]. On the other hand, according to the EU 2030 climate and energy framework, greenhouse gas emissions are to be reduced by at least 40% compared with those in 1990. In sectors covered by the emissions trading system, emission reductions of 43% compared with those in 2005 are assumed, and in non-ETS sectors, by 30%. The land use, land-use change, and forestry sector (LULUCF) were included in the UE 2030 climate and energy framework [12]. Moreover, at the EU meeting in December 2020, the target of GHG reduction was increased to at least 55% by 2030.
Considering the ambitious GHG reduction targets set by the EU, mainly those for 2030, their implementation requires comprehensive knowledge about the amount of emissions and their structure from each non-ETS area. Additionally, knowledge about the status of implementation of the GHG reduction levels in each EU country may be helpful and constitute a significant contribution to the planning of mitigation strategies. It will make it easier to take the necessary initiatives: defining the measures, changing legal regulations, etc. To realize such a high reduction level of GHG emissions, it will be necessary to act in each of the emission areas, including agriculture.
The aim of the study is to analyze the amount, dynamics of changes, and the structure of GHG emissions from agriculture in the EU in the years 2005–2018.

2. Materials and Methods

The study analyses the period from 2005 to 2018. The research is based on data about GHG collected by the European Environment Agency [13]. These annual data are reported by each EU state, which is obligatory under the United Nations Framework Convention on Climate Change (UNFCCC). These emissions are reported according to classification and in the Common Reporting Format (CRF) for five main categories: 1. Energy; 2. Industrial processes and product use; 3. Agriculture; 4. Land use, land use change and forestry (LULUCF); and 5. Waste. They are calculated according to the methodology published by the Intergovernmental Panel on Climate Change [14]. These guidelines allow for the estimation of emissions at various levels of detail, depending on the availability of national methods as well as emission parameters and indicators.
The analyses based on GHG emission data, expressed in CO2 equivalent, without the LULUCF sector, and emissions from international aviation and international maritime transport. The research covers all EU countries, including the United Kingdom (EU-28).
GHG EU’s emissions were reviewed in total from agriculture and individually for each member state. The dynamics of emission changes was calculated, assuming that the base year 1990 in the case of total GHG emissions and the base year 2005 in the case of GHG emissions from agriculture.
The structure of GHG emissions from the agriculture sector was studied for EU and individual member states. These are the included structures: enteric fermentation, manure management, agricultural soils, field burning of agricultural residues, liming, and urea application. For each agricultural source, the dynamics of changes in GHG emissions was calculated, assuming the base year of 2005. The trends in GHG emissions from individual sources in agriculture in the period 2005–2018 were also analyzed.

3. Results and Discussion

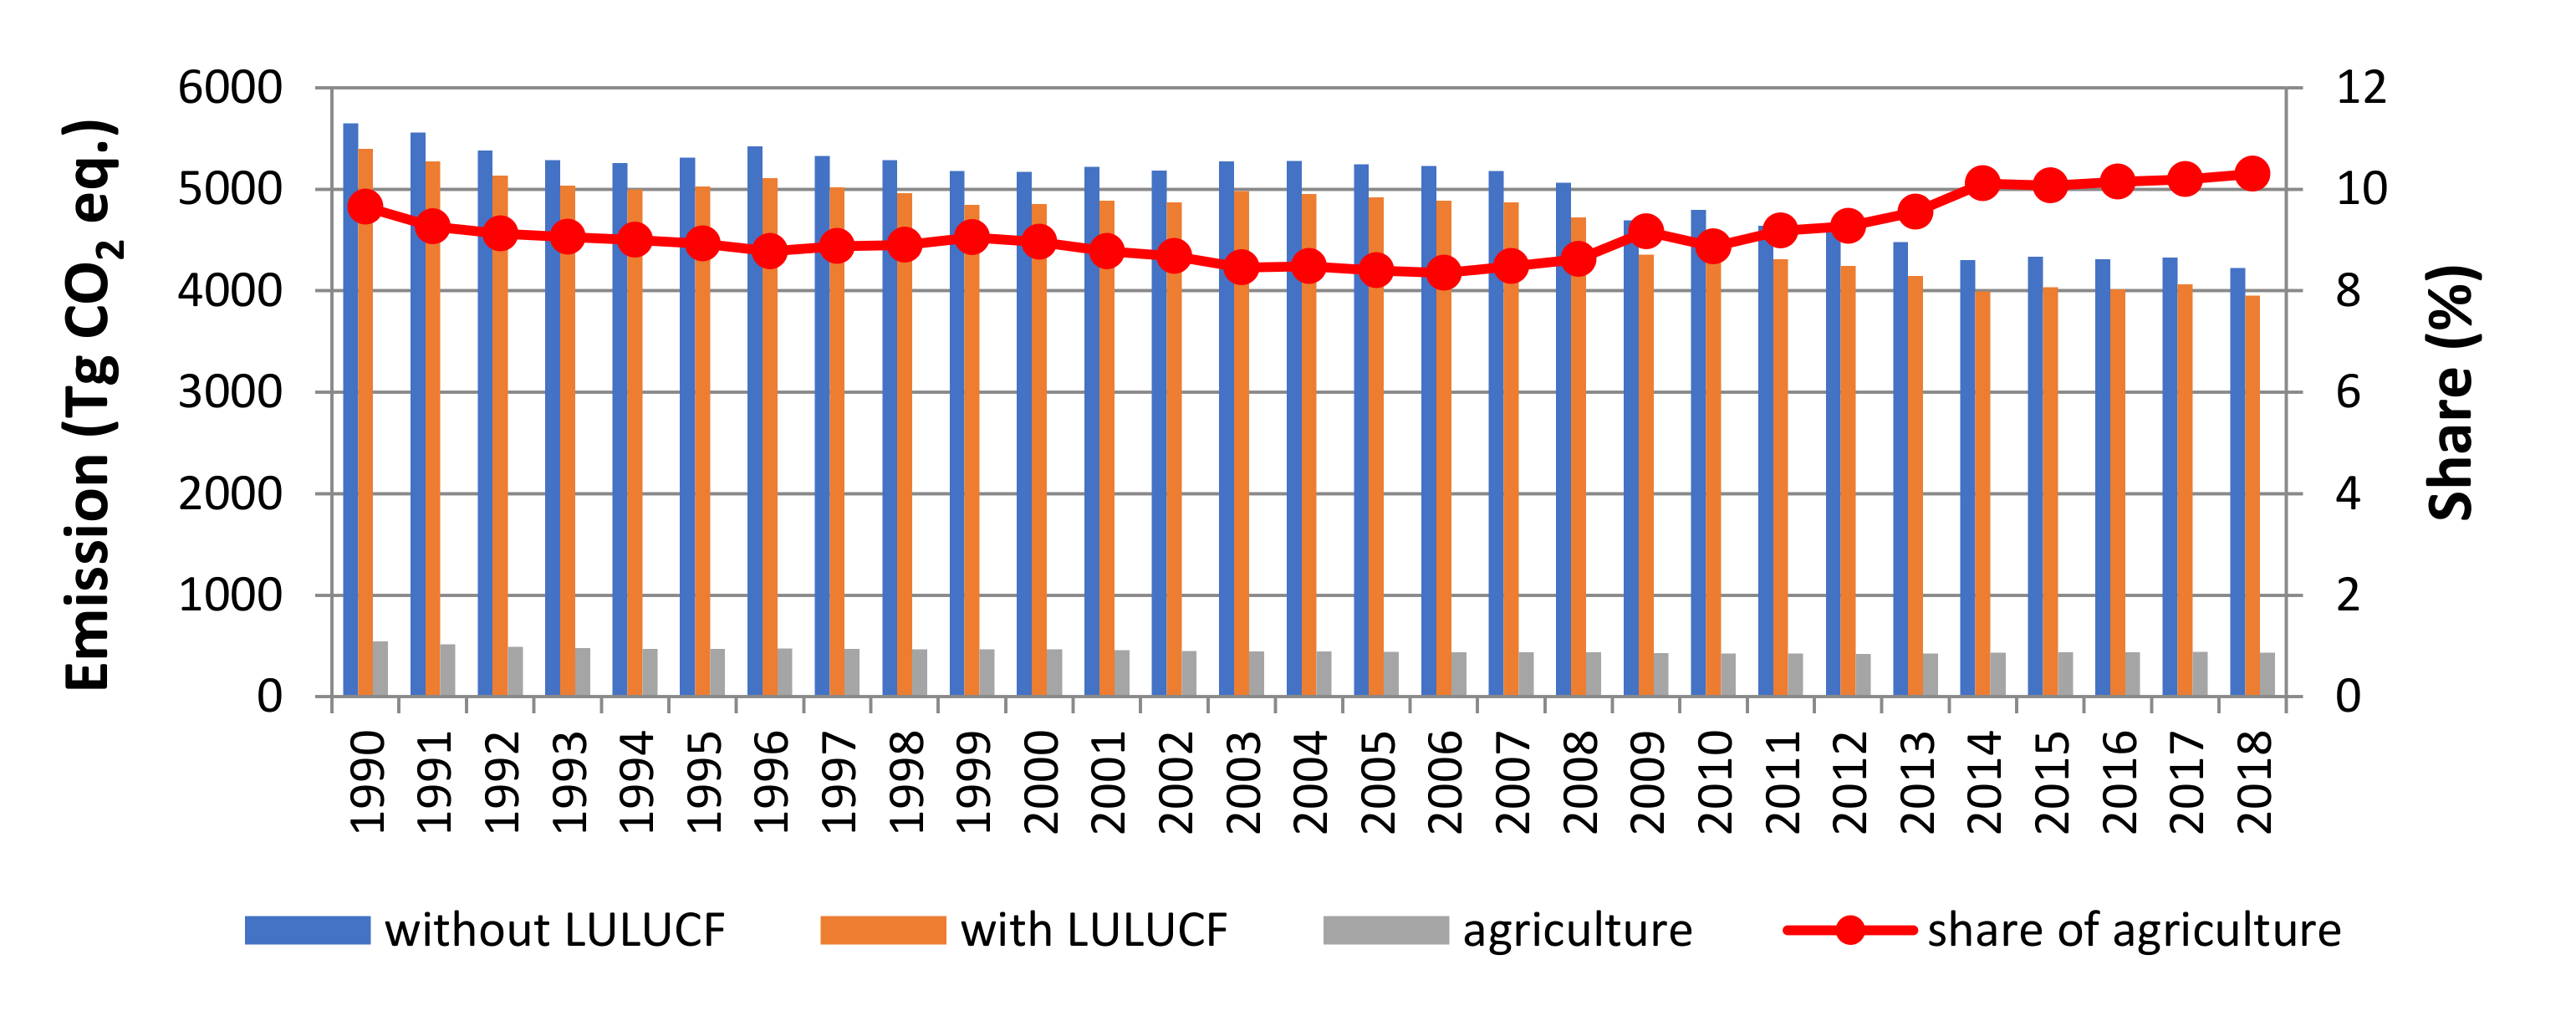
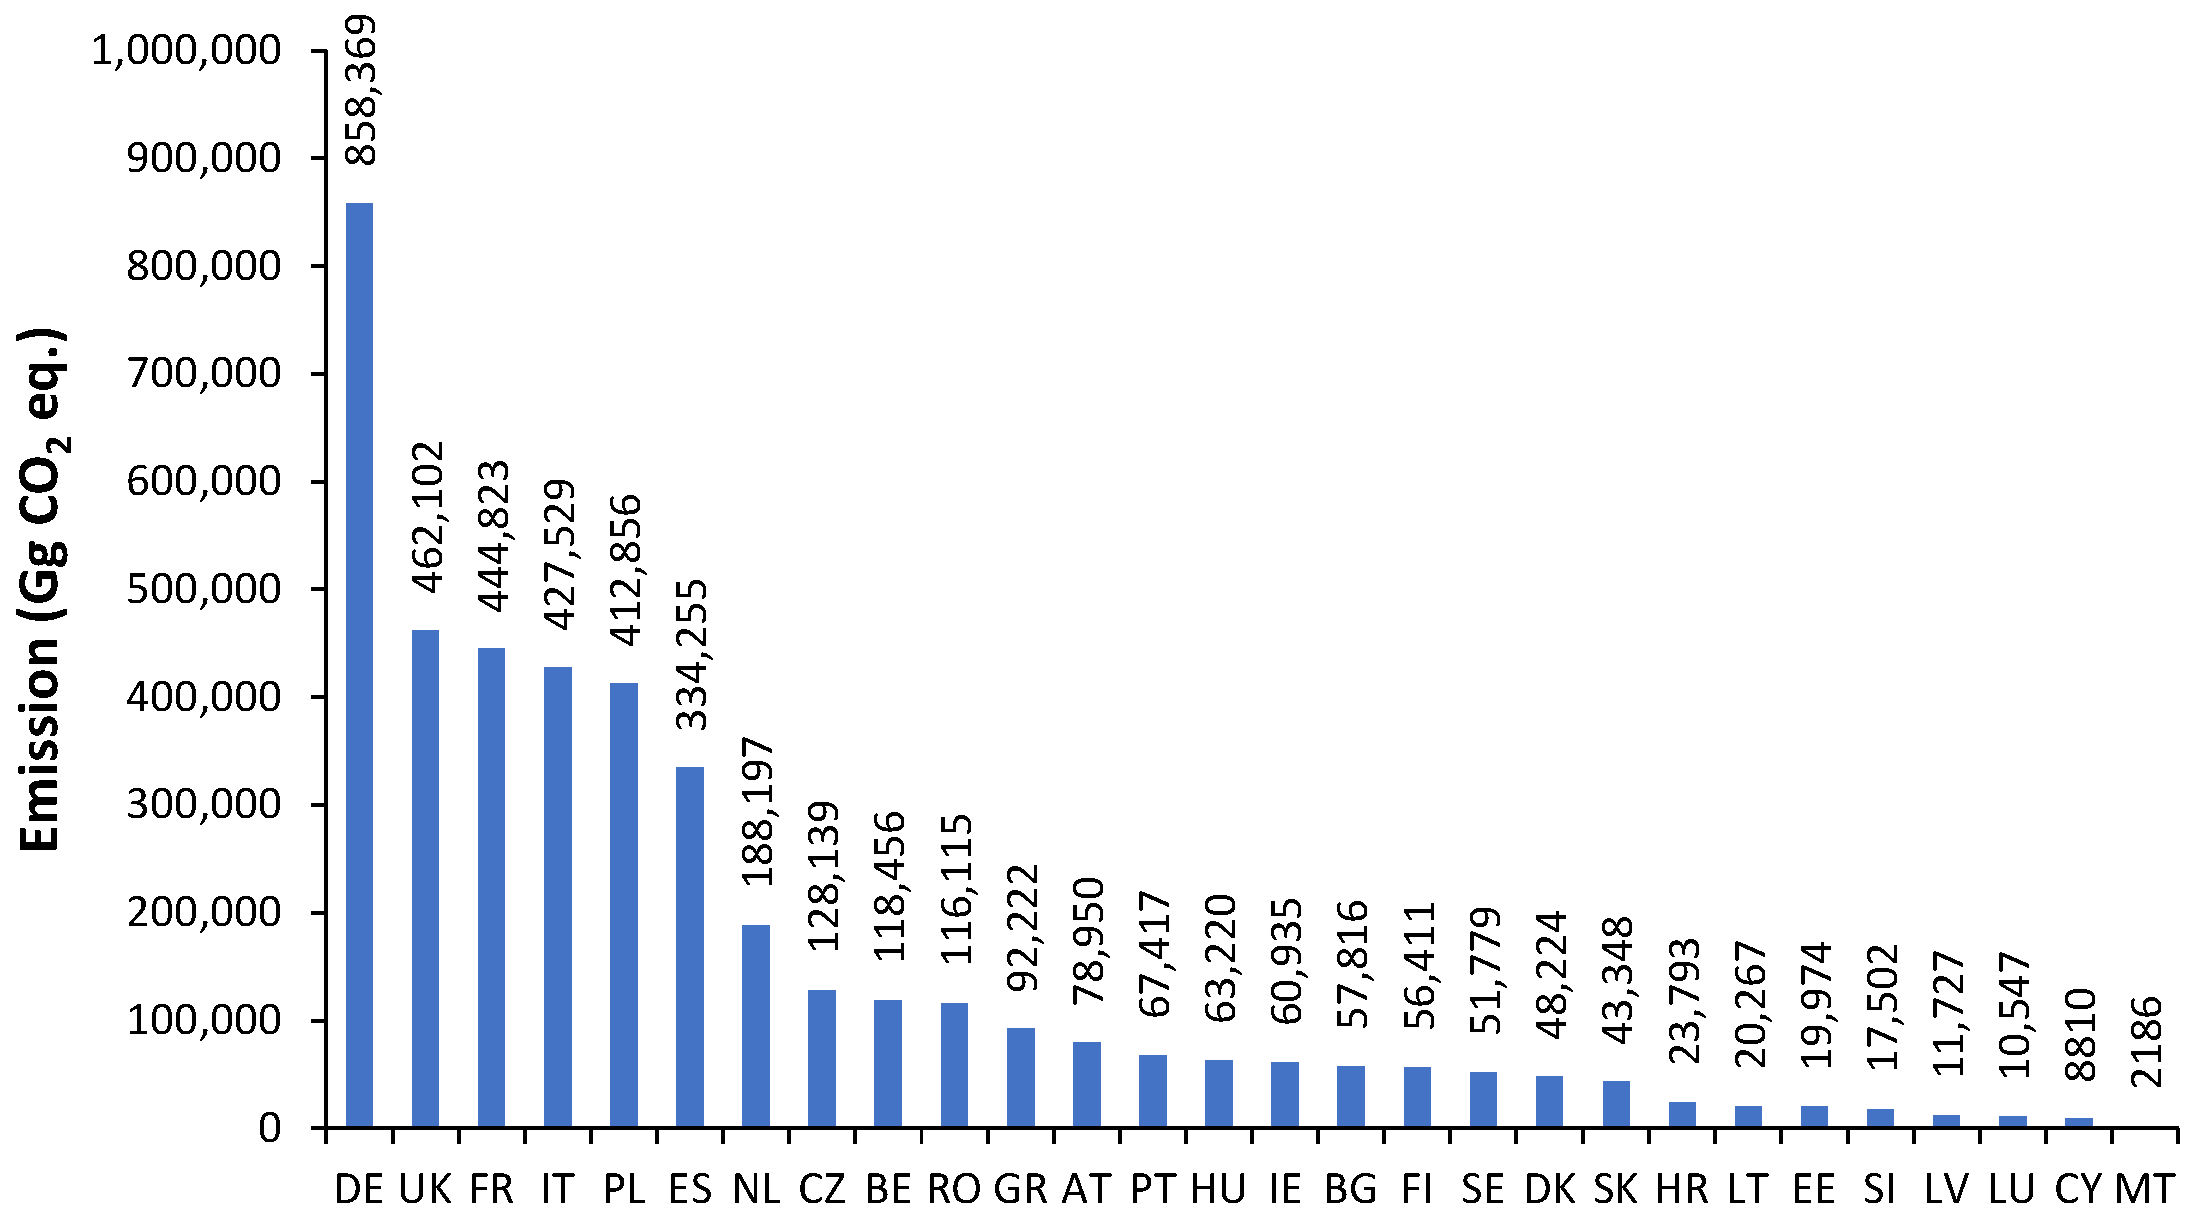
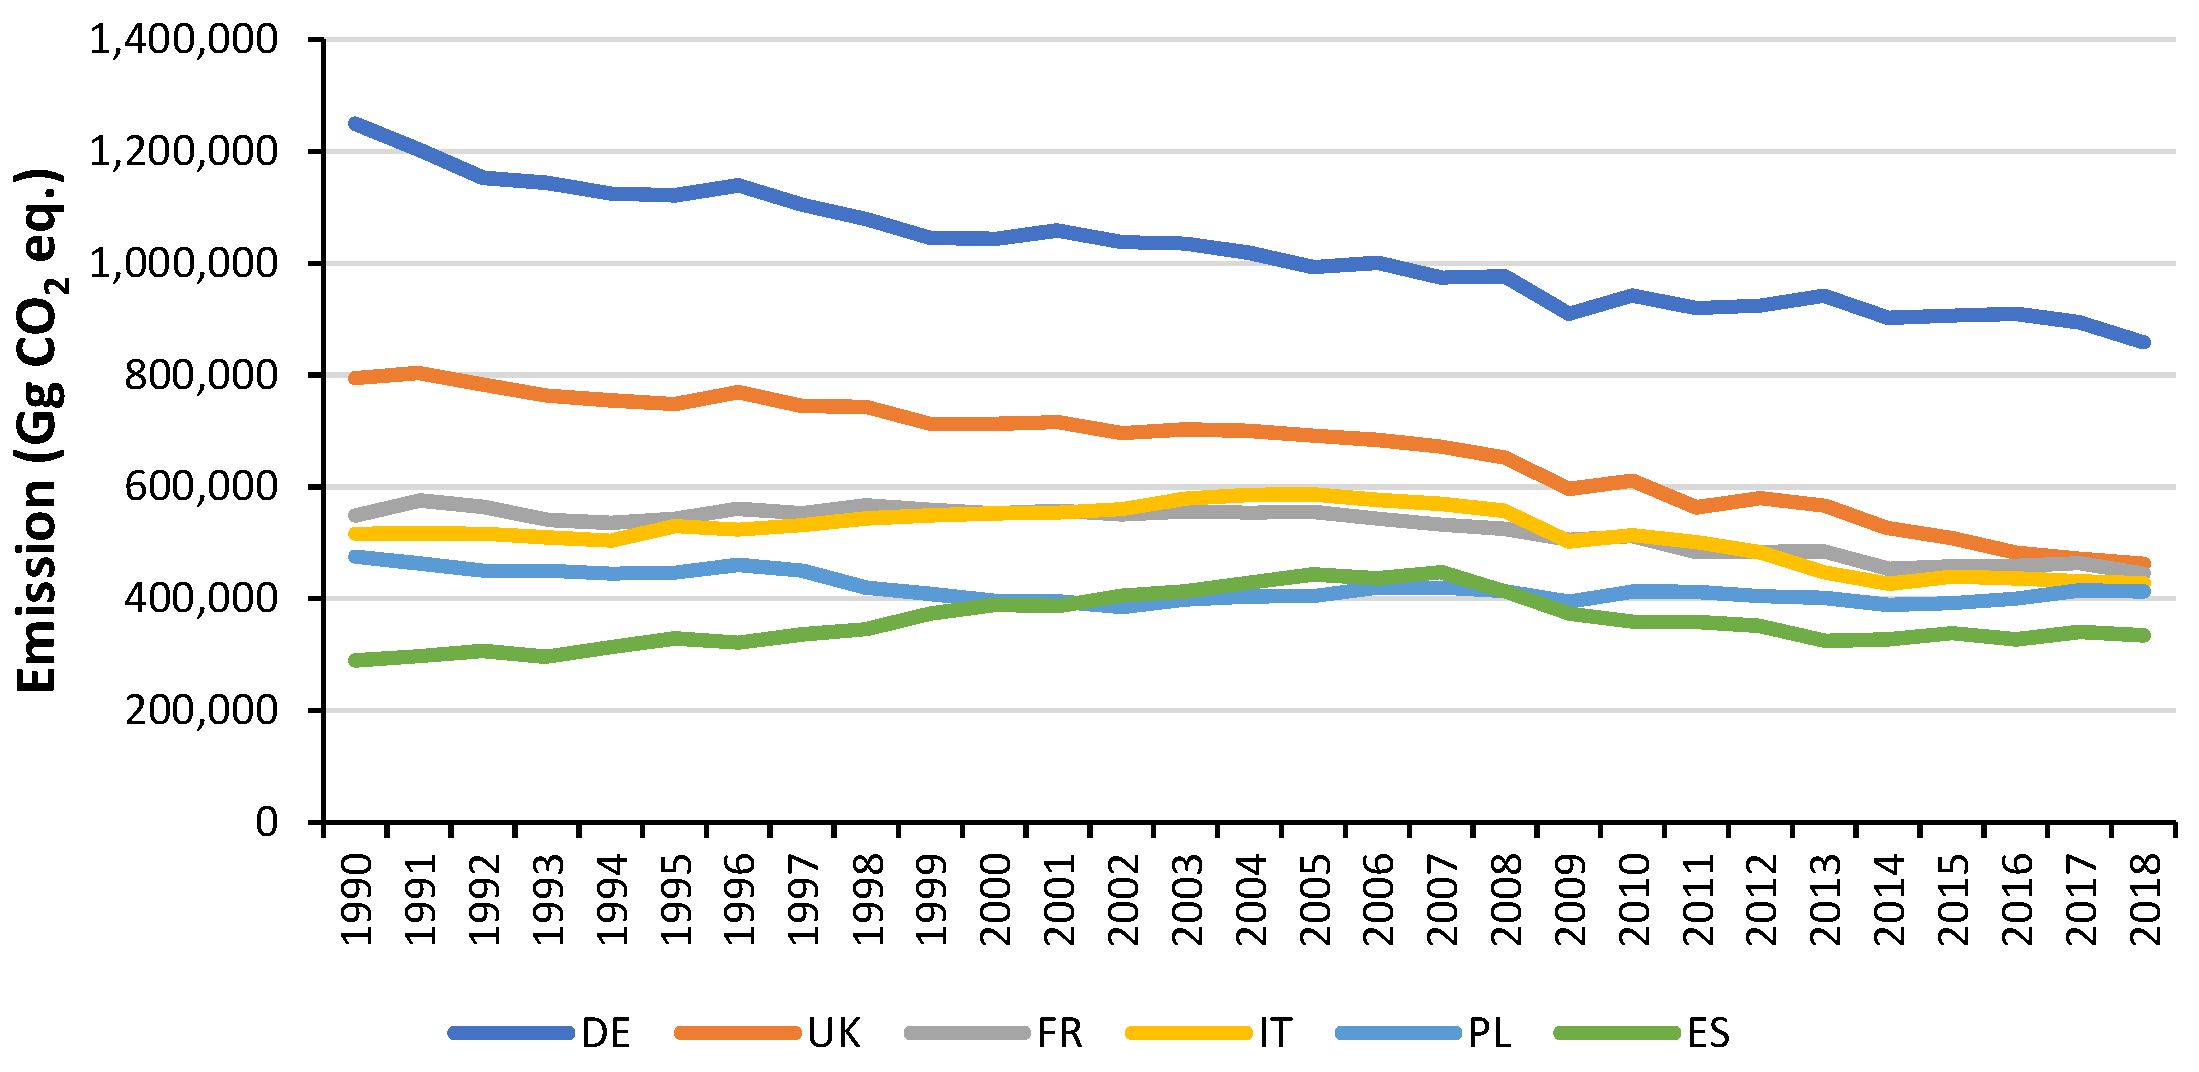
3.1. GHG Emissions in the EU

In the analyzed period (1990–2018), GHG emissions, compared with the base year 1990, showed a downward trend. However, between 1990 and 2004, GHG emissions in the EU fluctuated. There were both periodic increases and decreases in emissions. Since 2005, GHG emissions have been characterized by a constant downward trend. The largest decreases (over 10%) were observed over the last ten years (Figure 1). In 2018, the total GHG emission without the LULUCF sector was 4225.97 Tg CO2 eq. (CO2—81.4%, CH4—10.3%, N2O—5.6%) and was lower by 25.2% compared with that in 1990. With the LULUCF sector, the level of reduction was 26.8%. Considering the dynamics of GHG emissions in the analyzed period, it can be projected that the 20% GHG emission reduction will be achieved.
The values of GHG emissions in the EU countries in 2018 are presented in Figure 2.
From the analysis of the changes of GHG emissions in the EU countries, both decreases and increases were observed. The greatest reductions in GHG emissions, compared with those in 1990, were recorded in countries with a relatively small share in the total GHG emissions in the EU. These were Lithuania (−57.8%), Latvia (−55.5%), Romania (−53.2%), and Estonia (−50.4%). Probably, this is related to the economic changes taking place in these countries. In the countries with the highest share of GHG emissions in the EU, the reductions were, respectively, as follows: Germany (−31%), United Kingdom (−41.8%), France (−18.9%), Italy (−17.2%), and Poland (−13.1%) (Figure 3). The GHG emissions were higher in Cyprus (+55.0%), Spain (+15.5%), Portugal (+15.0%), Ireland (+9.9%), and Austria (+0.6%). Apart from Spain, countries in this group have a small share in the total EU’s GHG emissions, which practically does not affect the total emission.

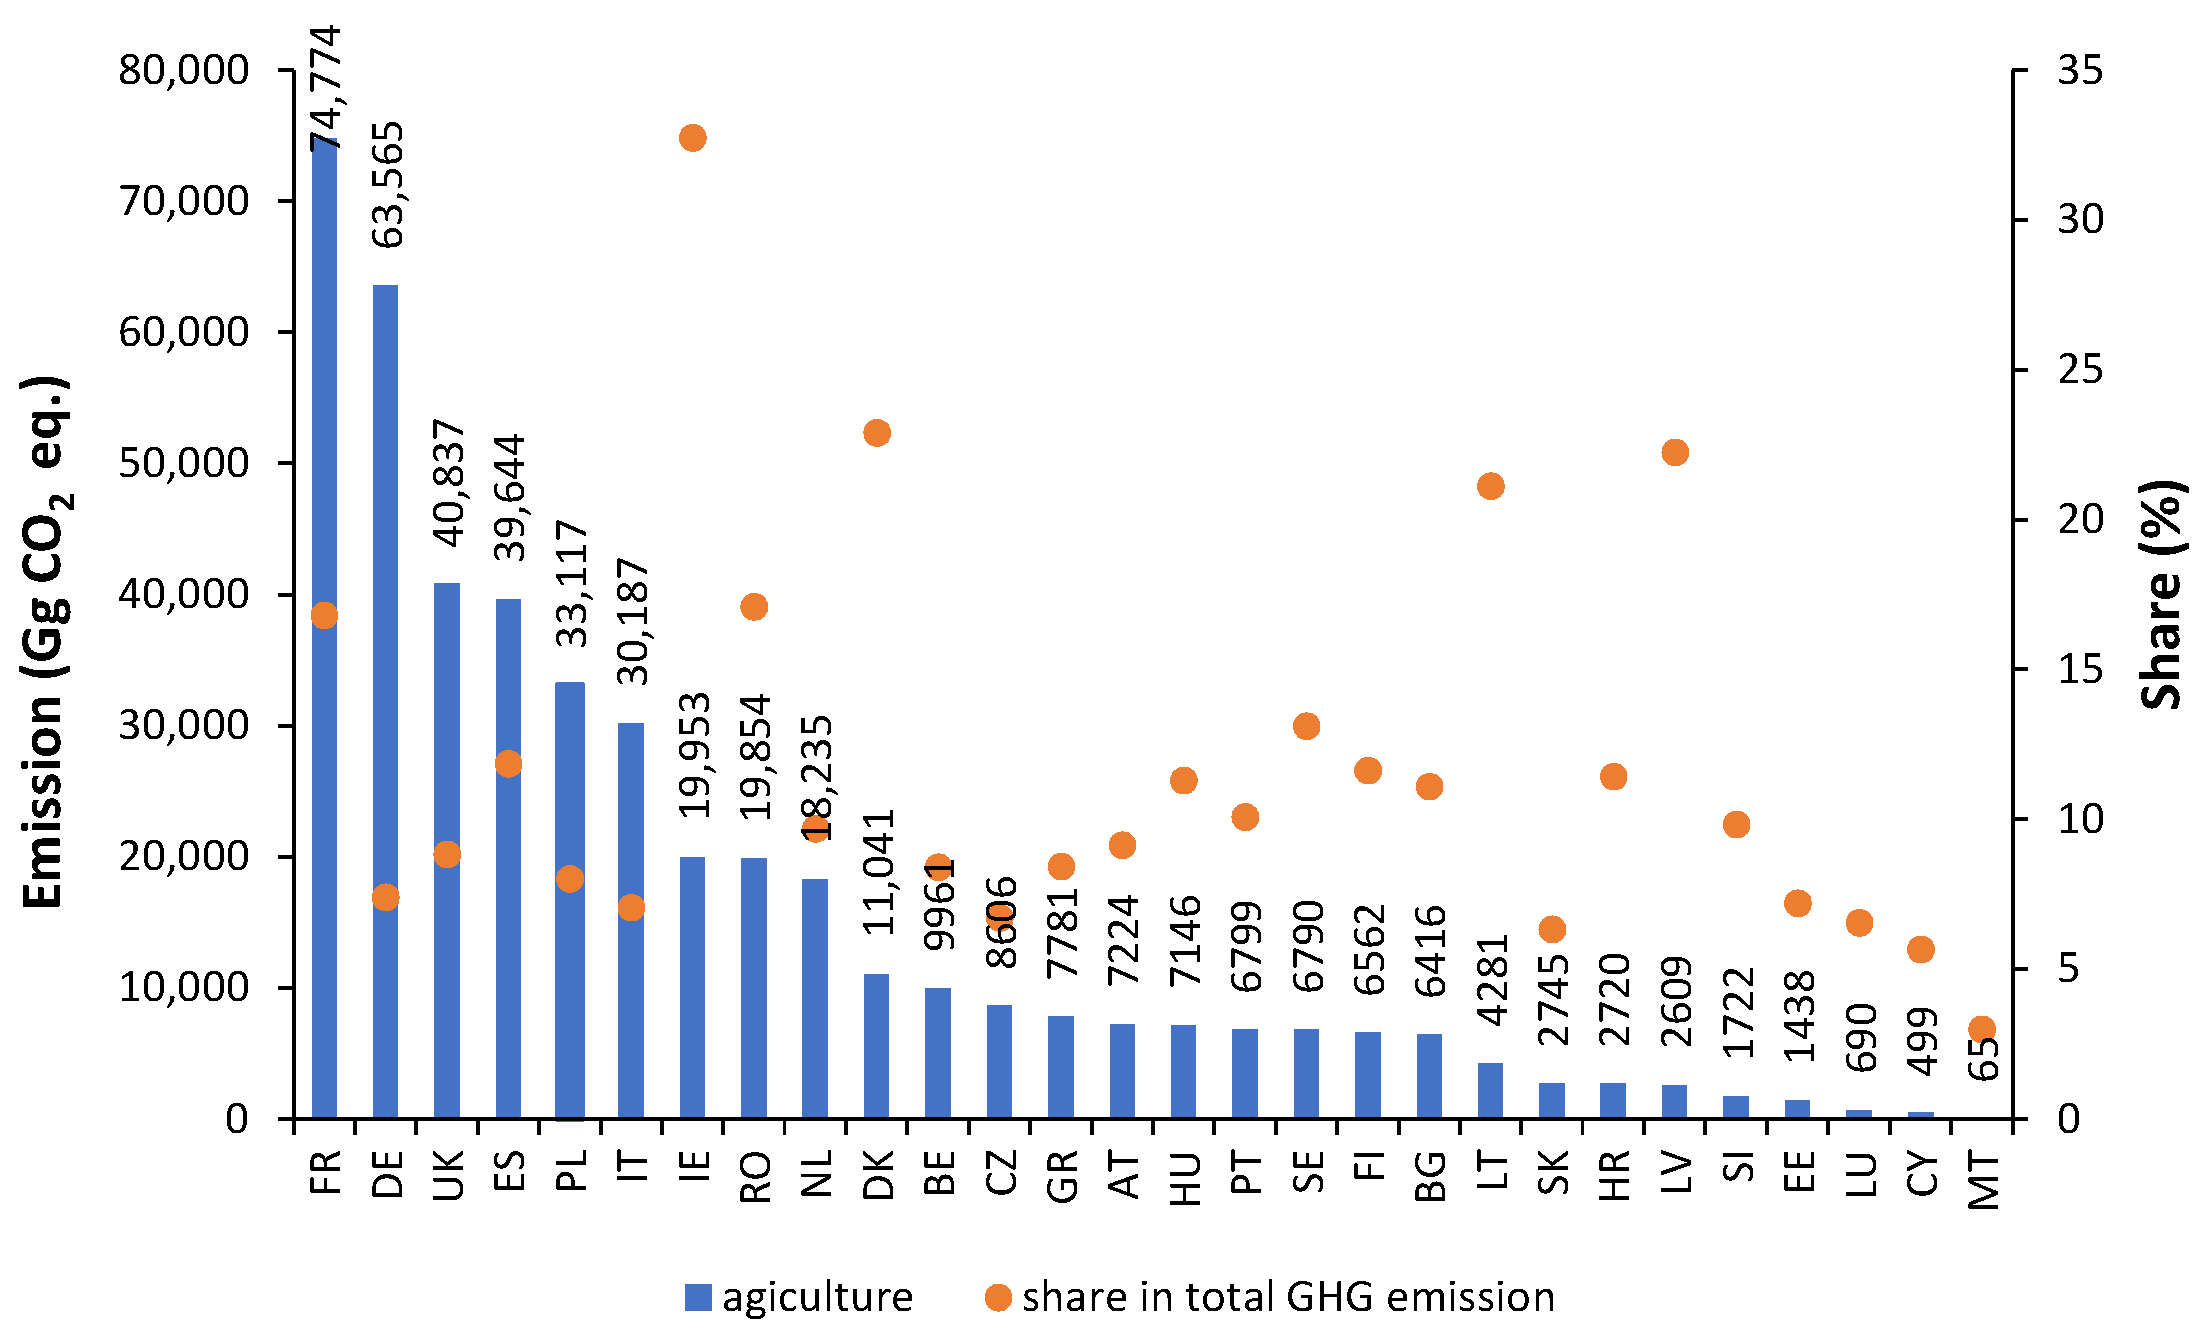
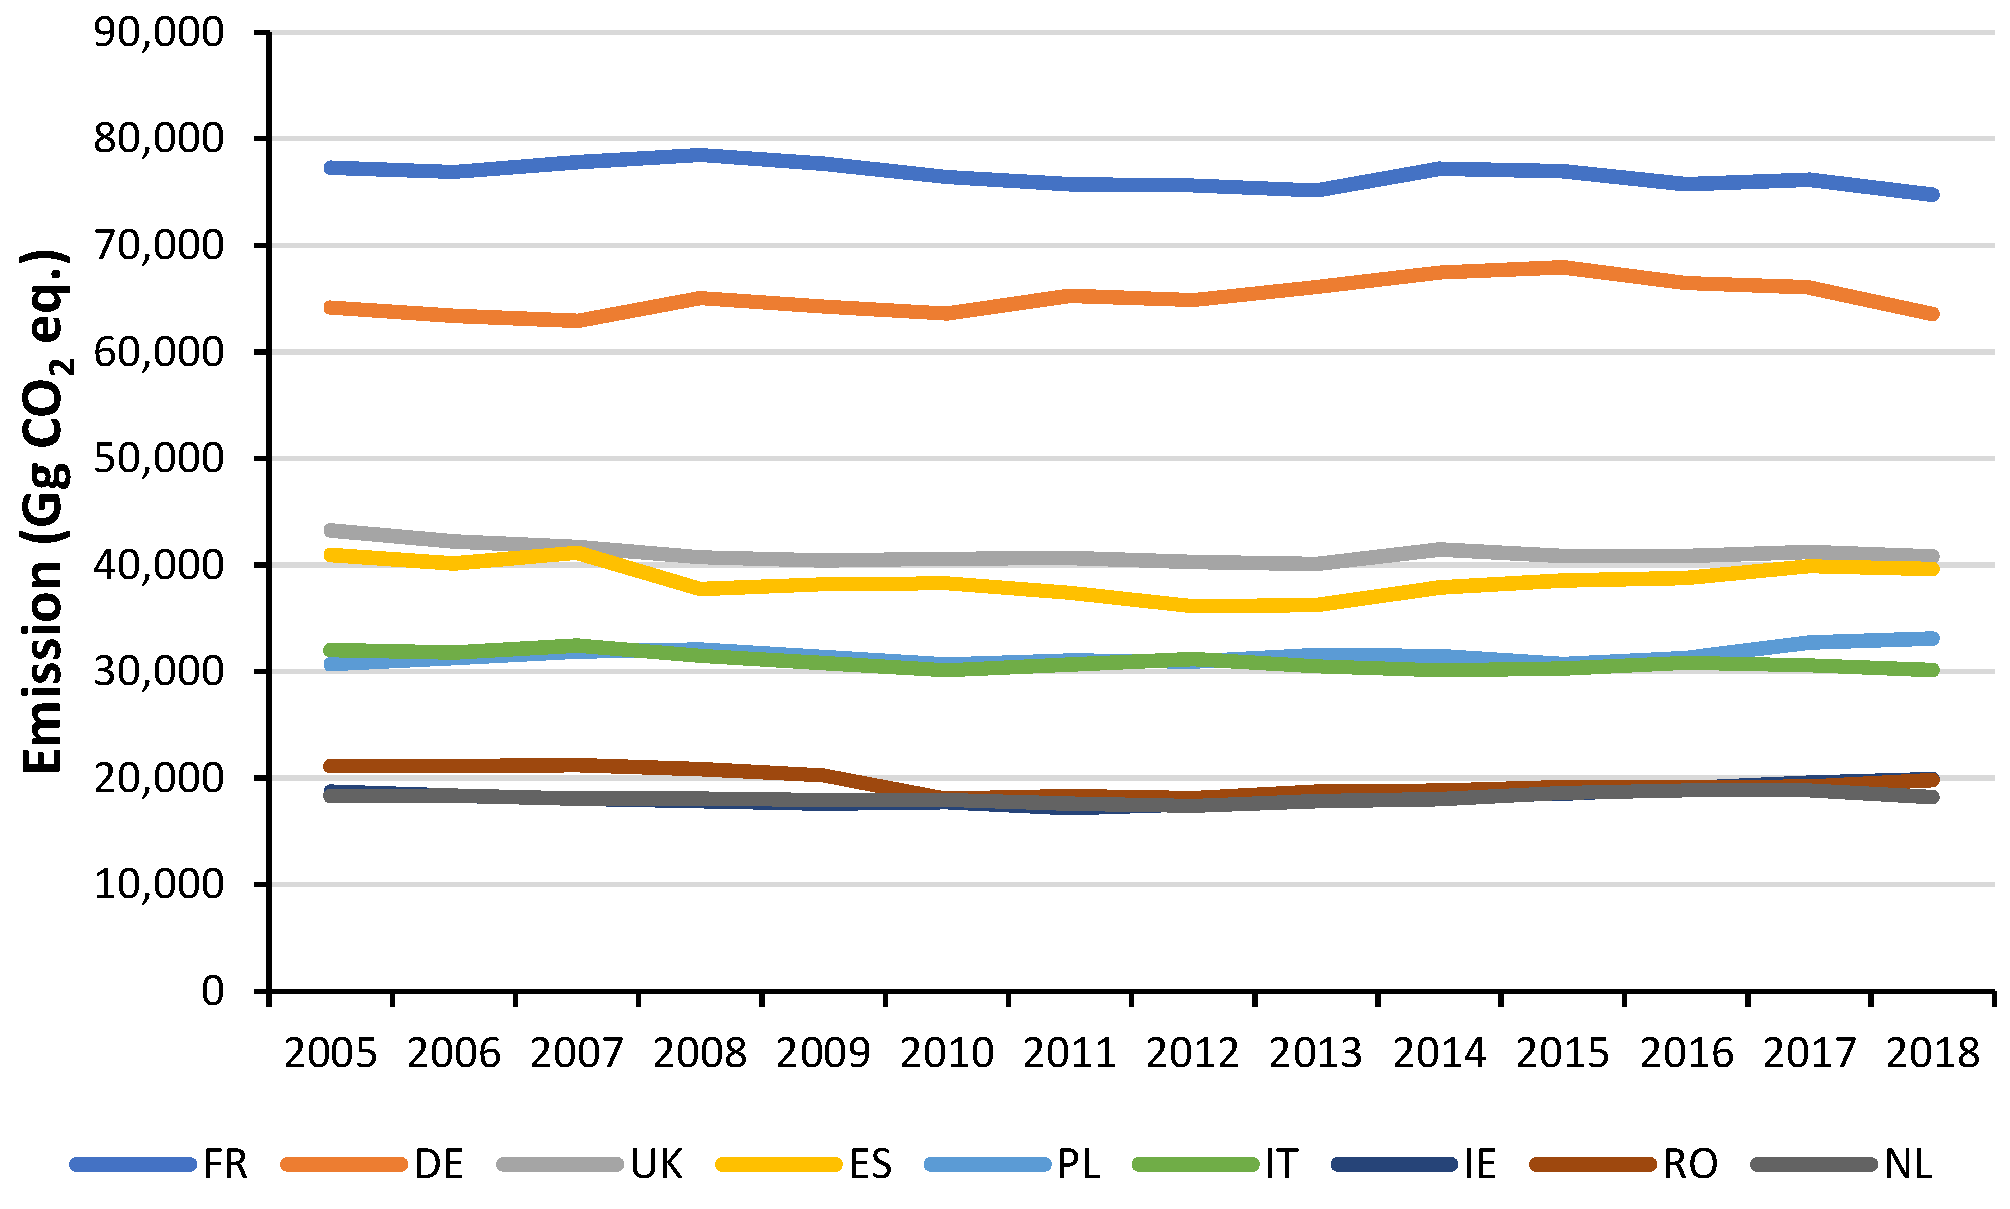
3.2. Agricultural GHG Emission in the EU

One of the sources of GHG emissions is agriculture. Its average share in total GHG emissions (without LULUCF) in the EU in 2005–2018 was 9.3%. The share of this sector in total GHG emissions in the EU has increased from 8.4% in 2005 to 10.3% in 2018 (Figure 1). Changes in GHG emissions from agriculture are not in line with the trend in total GHG emissions in the EU. The agricultural GHG emissions showed a downward trend in the years 2005–2012, whereas since 2013, GHG emissions increased slightly from 427.6 Tg CO2 eq. up to 440.8 Tg CO2 eq. in 2017. Compared with the previous year, only in 2018, it was recorded a slight decrease in emissions by 1.3%. The analysis of the dynamics of emission changes in relation to the base year 2005 generally showed a decrease in GHG emissions in 2006–2018. In 2018, GHG emissions from agriculture in the EU amounted to 435.3 Tg CO2 eq. (CO2–2.6%, CH4–53.7%, N2O–43.7%) and were lower by 1.2% compared with those in 2005.
Almost 60% of the GHG emissions from agriculture in the EU come from France, Germany, the United Kingdom, Spain, and Poland. Meanwhile, the countries with the lowest agricultural GHG emissions—Luxembourg, Cyprus, and Malta—were responsible for 0.3% of total EU GHG emissions. The share of agriculture in total GHG emissions differed in each country. It was the largest in Ireland (32.7%), Denmark (22.9%), Latvia (22.3%), and Lithuania (21.1%), and the lowest in Malta (3%), Cyprus (5.7%), Slovakia (6.3%), Luxembourg (6.5%), and the Czech Republic (6.7%) (Figure 4).
Based on the analysis of changes in GHG emissions from agriculture in the years 2005–2018, it was noticed that there was a generally downward trend in France. The situation was opposite in Romania and Spain. Meanwhile, in Ireland and the Netherlands, emissions decreased until about 2011 and then emissions increased. In other countries, the emission was characterized by high variability without a clear upward or downward slope (Figure 5).

3.3. State of Reduction of Agricultural GHG Emissions in the EU

The assumed reduction targets of GHG emissions from agriculture in the EU are related to 2005 (base year). The achievements of these targets in the EU countries are presented in Table 1.
According to decision 406/2009/EC of the European Parliament and of the Council of 23 April 2009 on the effort of Member States to reduce their greenhouse gas emissions to meet the Community’s greenhouse gas emission reduction commitments up to 2020, Member States have set GHG emission limits for 2020 compared with 2005 in non-ETS sectors, which include agriculture. Depending on the size of the country, the structure of agriculture, and the assumed changes in this sector, some of them are to reduce emissions, and some may increase them within the assumed limit. Comparing the assumed GHG limits for 2020 with the GHG emissions for 2018, 11 of the EU Member States meet the GHG emission limits (green color in Table 1). These are mainly countries with a small share in the EU GHG emissions, accessed to EU after 2004. The countries, which have not yet reached the GHG limits for 2020 (red color in Table 1) are mainly old EU Member States, and among them, the countries with the highest share in GHG emissions from agriculture in the EU.
Comparing the agricultural GHG emissions in the EU in 2005 and 2018, there was a 2% reduction in emissions during this time. This is lower than the limit for the non-ETS sector, which is 10% (base year 2005). It should be noted that the assumed 2020 GHG emission limits apply to all non-ETS sectors together, not only agriculture. On the other hand, the GHG reduction limit for 2030 is much higher and, for non-ETS sector, assumed 30%. It seems that to achieve this goal, it may be necessary to reach a significant reduction in each area of the non-ETS sector.
Studying the GHG limits established for 2030, it may be concluded that three countries should not have problems with reaching these limits: Malta, Greece, and Croatia. Other countries should take decisive steps to implement measures to reduce GHG emissions (Table 1).

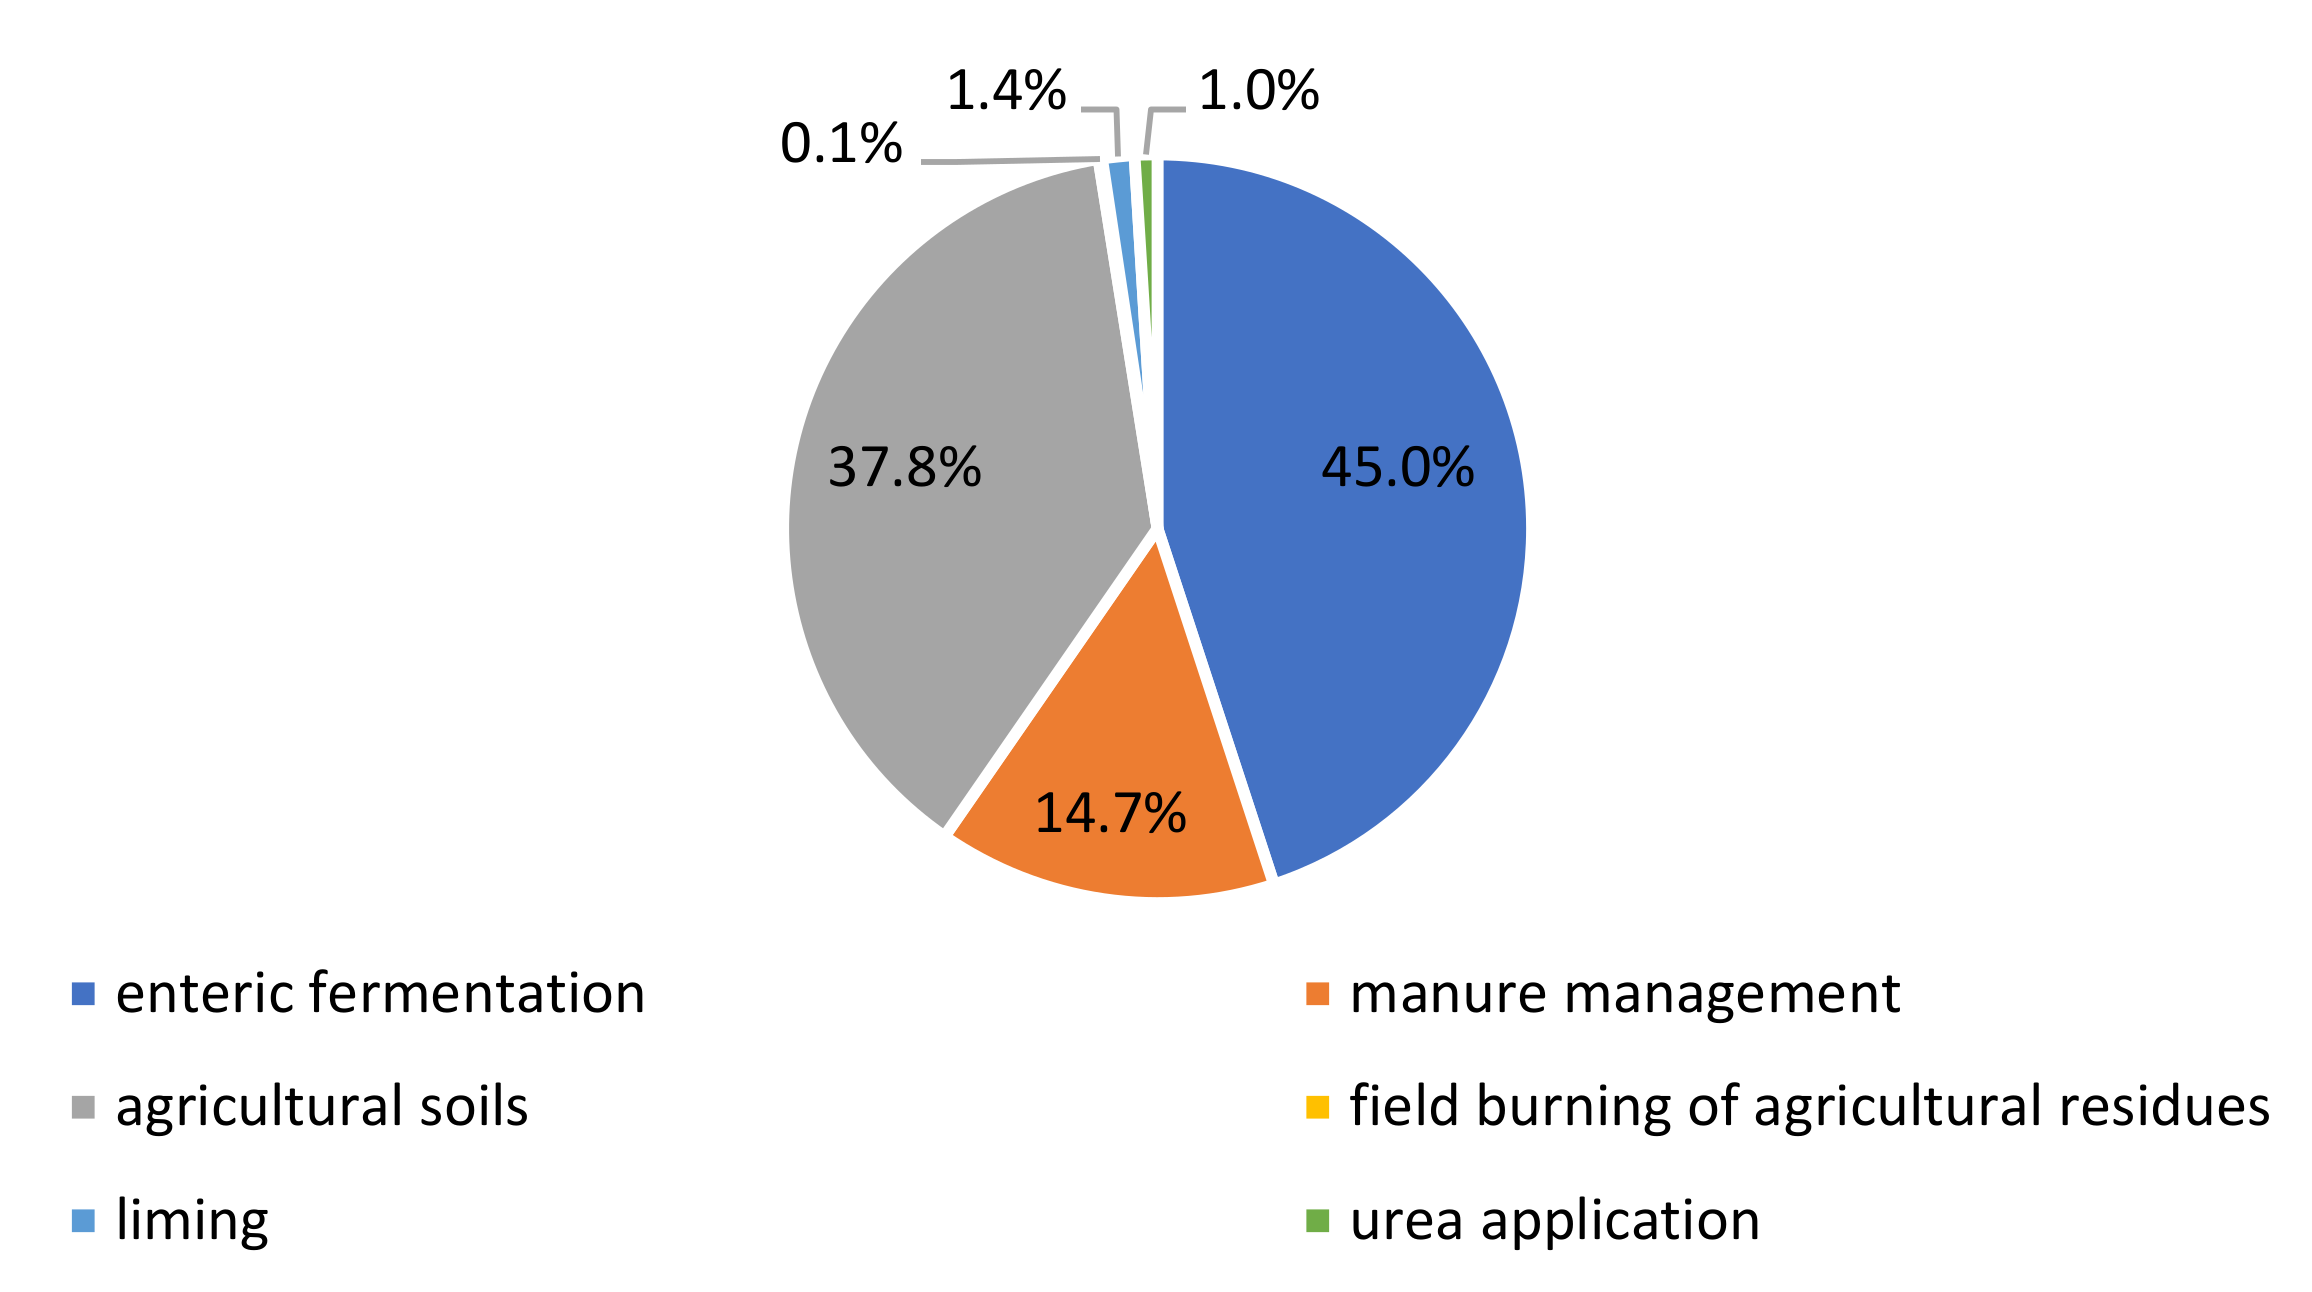
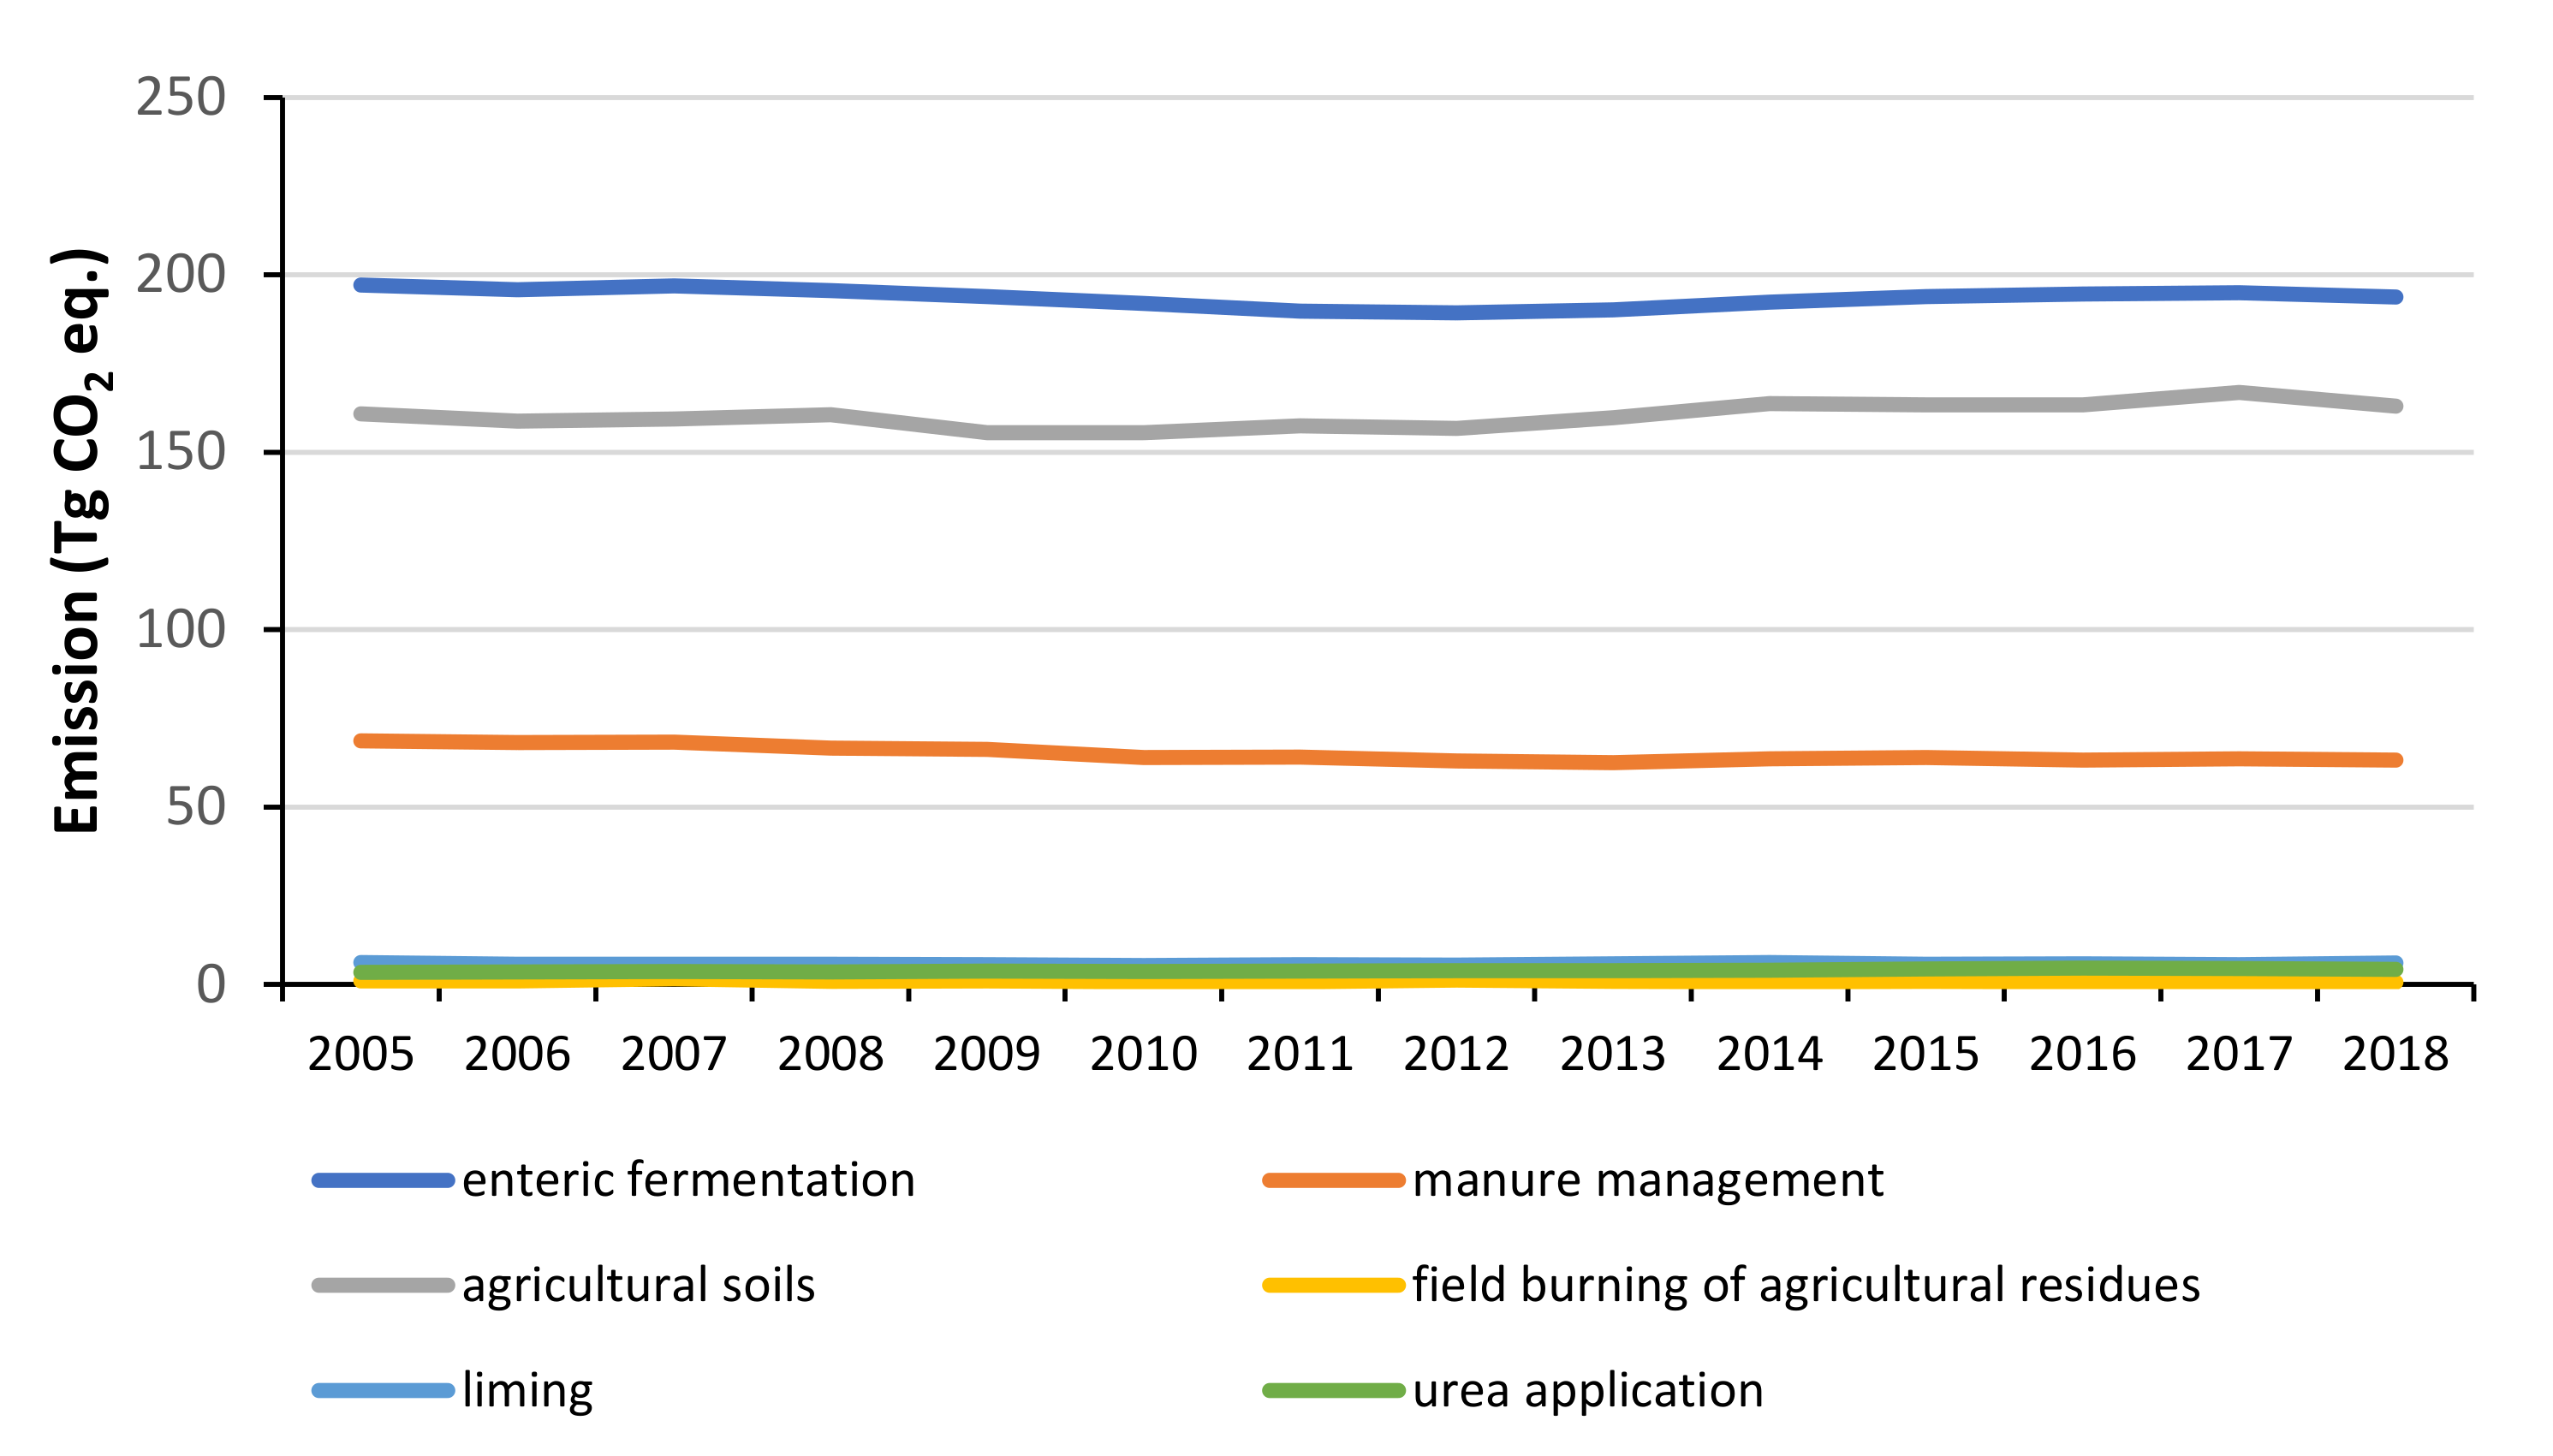
3.4. GHG Emissions from Main Agricultural Sources

According to the IPCC methodology [14], the main sources of GHG emissions from agriculture are enteric fermentation (CH4), manure management (CH4, N2O), agricultural soils (N2O), field burning of agricultural residues (CH4, N2O), liming (CO2), and urea application (CO2). The structure of GHG emissions in 2018 in the EU is shown in Figure 6. The largest sources were enteric fermentation (45%) and agricultural soils (37.8%), the emissions of which are mainly related to the use of natural and mineral fertilizers. Compared with the analysis conducted by Syp [15] for GHG emissions in the EU in 2014 in the agricultural sector, the shares of the two main emission sources were 45% agricultural soils and 38% enteric fermentation.
Based on an analysis of GHG emissions from agricultural sources for 2005–2018 in the EU, a downward trend was recorded in emissions from enteric fermentation, manure management, field burning of agricultural residues, and liming. Only the emissions from urea application increased. For agricultural soils, emissions decreased until 2009, after which an upward trend was observed (Figure 7).

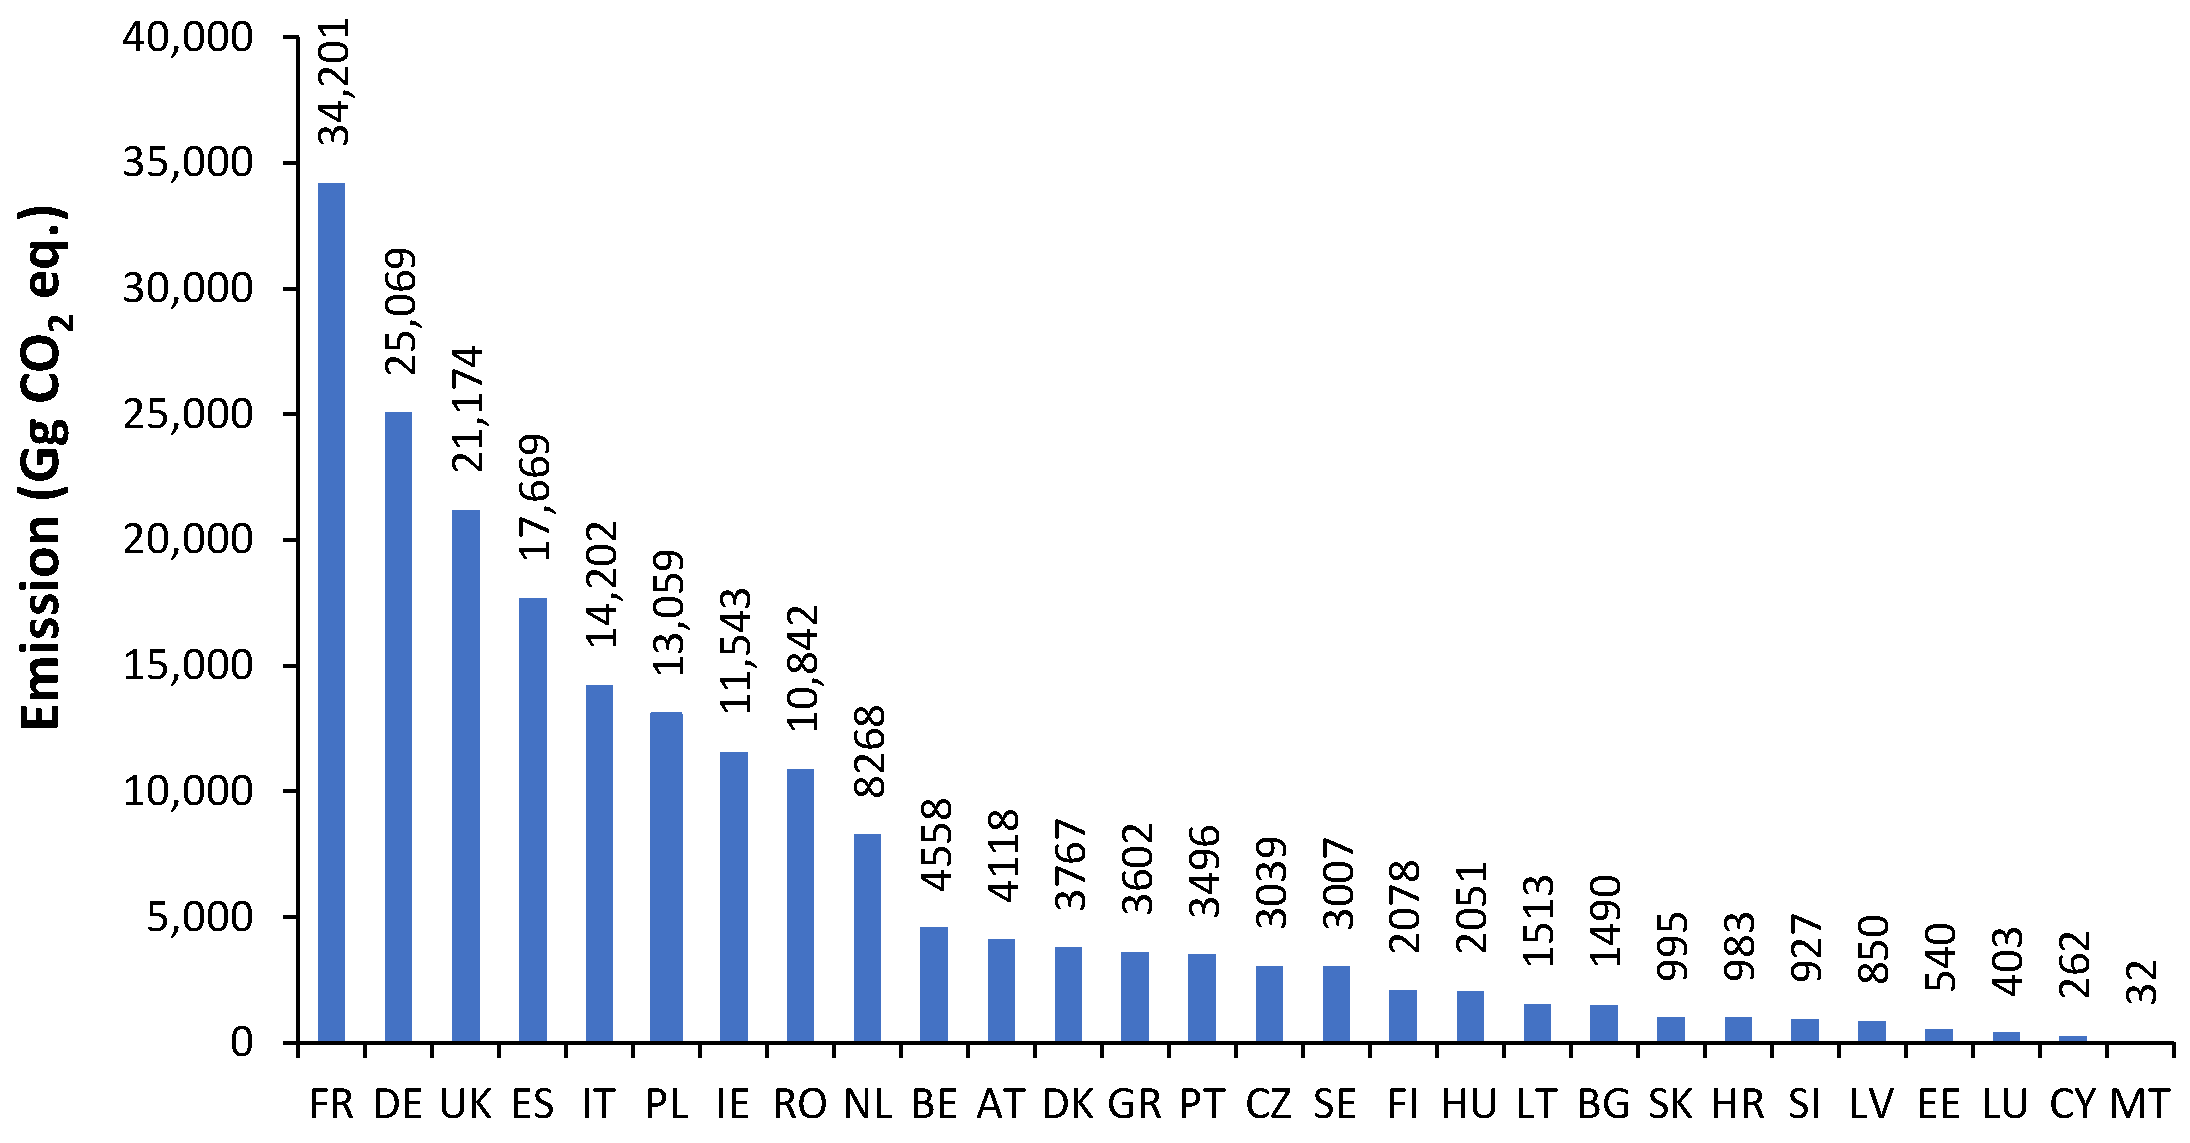
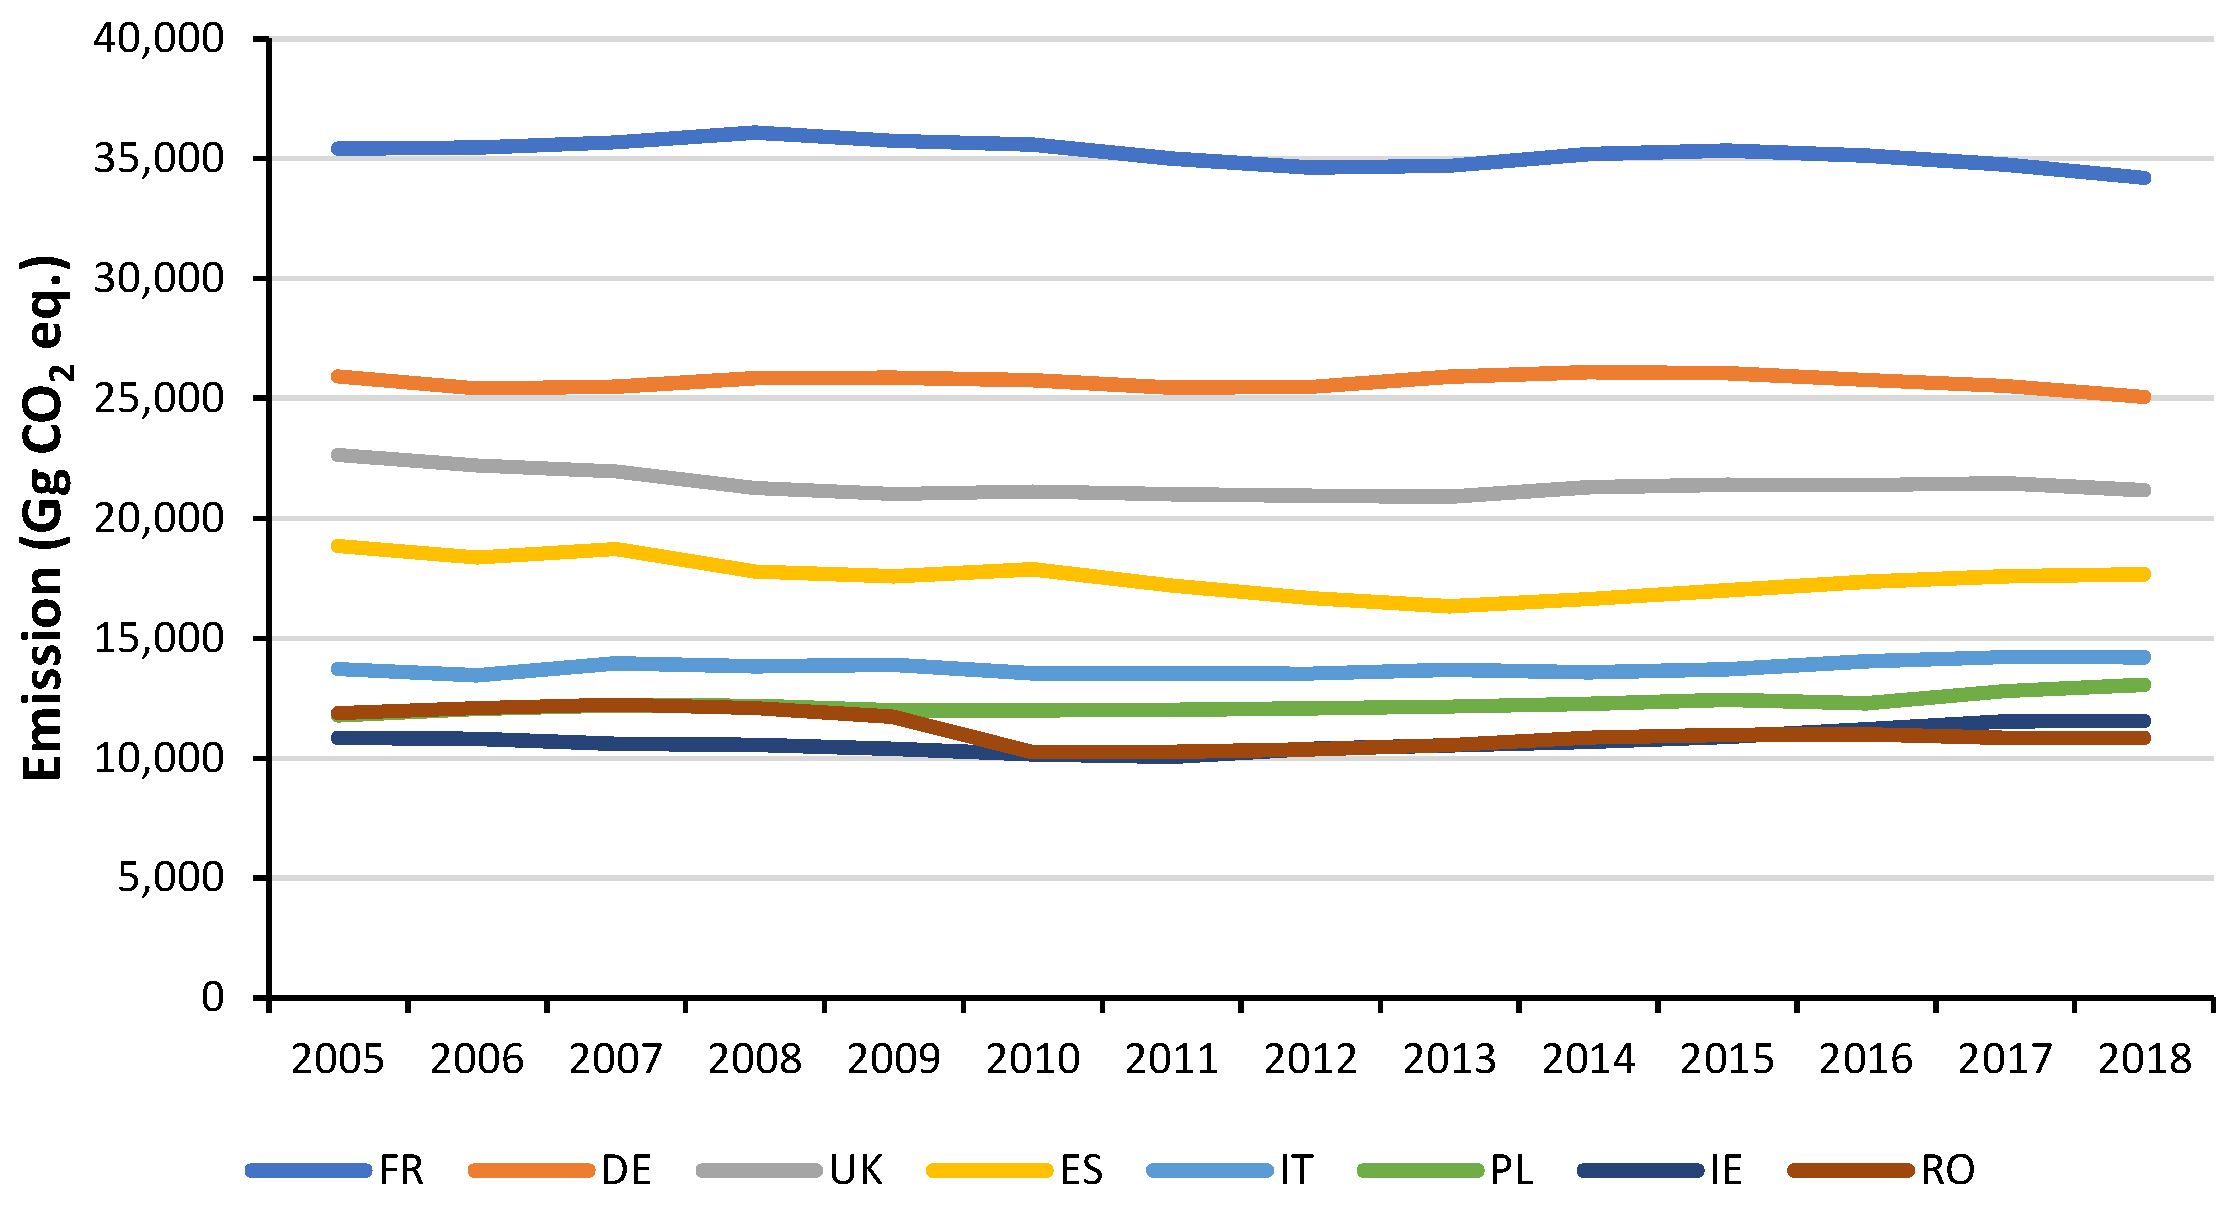
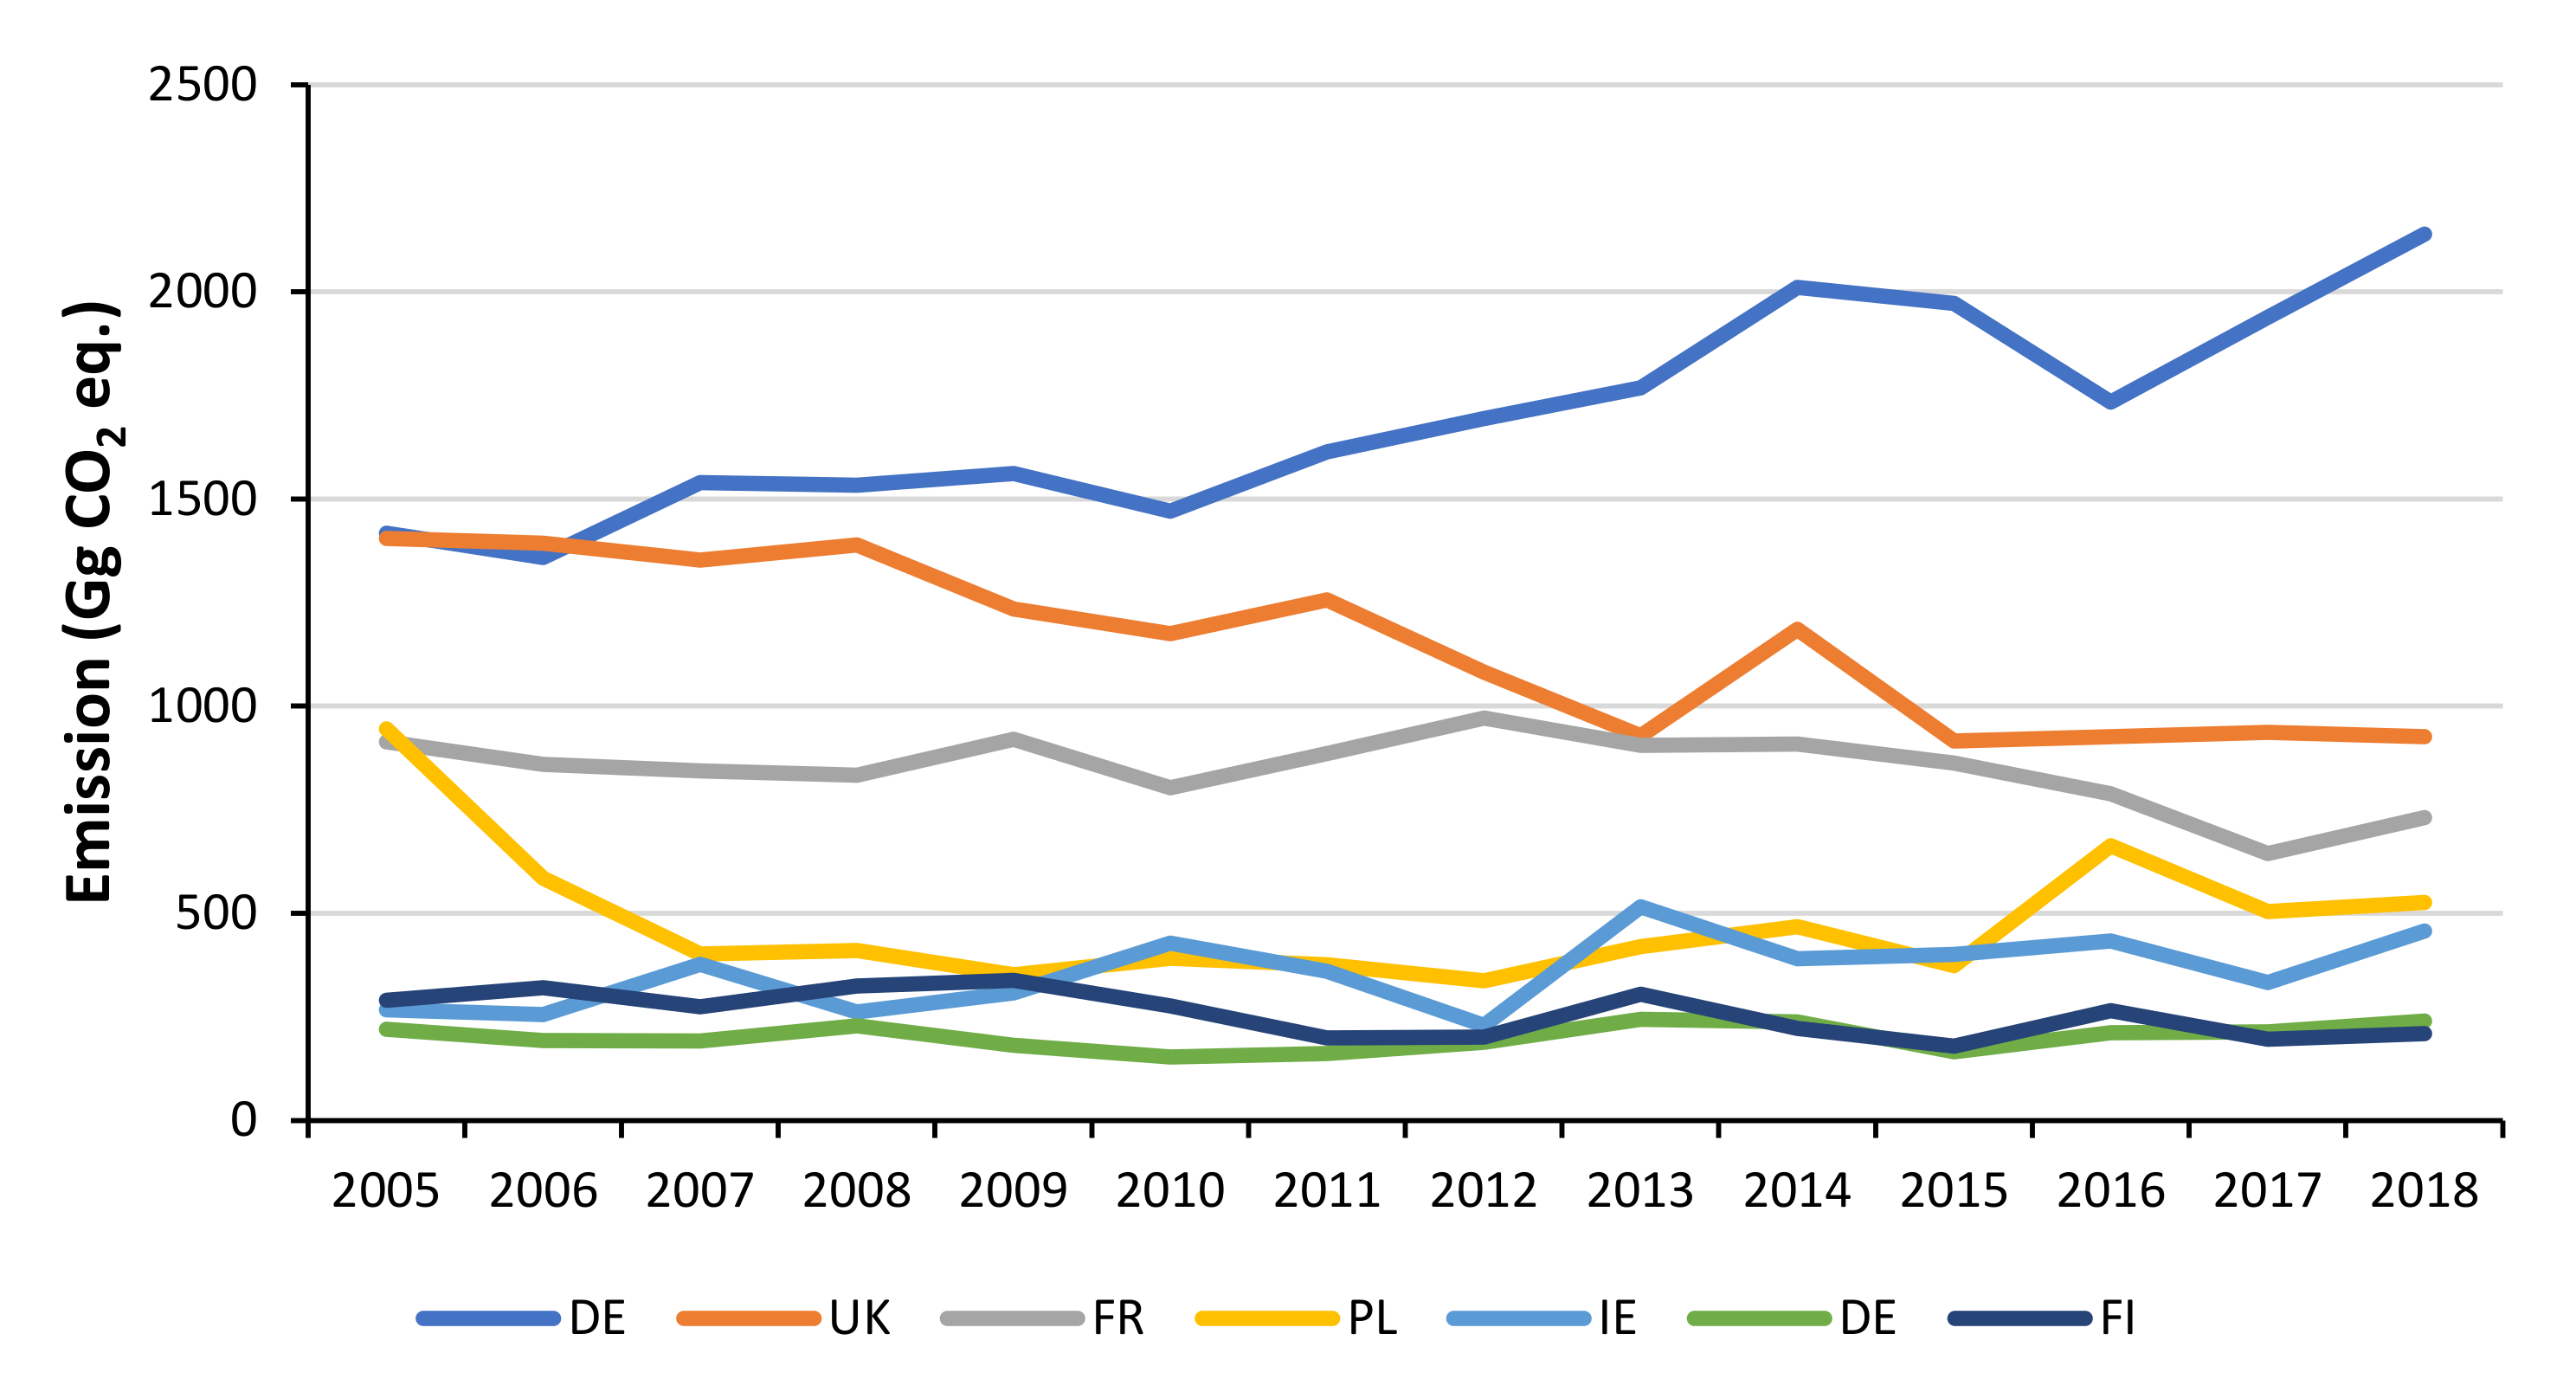
3.4.1. Enteric Fermentation

In 2018, GHG emissions from enteric fermentation in the EU amounted to 194 Tg CO2 eq. (CH4–100%). Analyzing the share of GHG emissions from enteric fermentation in 2018 in EU countries, it was noticed that over 40% of EU GHG emissions from enteric fermentation came from three countries: France, Germany, and the United Kingdom with shares of 17.7%, 12.9%, and 10.9%, respectively. Luxembourg, Cyprus, and Malta had the lowest emissions from enteric fermentation (Figure 8). The GHG emissions from enteric fermentation are related primarily to the amount of livestock production, resulting from the size, geographic location, and policies of the country. This has a significant impact on the share of enteric fermentation in the total GHG emissions from agriculture. In eight countries, enteric fermentation was over 50% of GHG emissions from agriculture: Luxembourg (58.4%), Ireland (57.9%), Austria (57.0%), Romania (54.6%), Slovenia (53.9%), Cyprus (52.4%), the United Kingdom (51.8%), and Portugal (51.4%). Only in two countries were the emissions from this source below 30%: Bulgaria (23.2%) and Hungary (28.7%).
The analysis of changes in GHG emissions from enteric fermentation in the period 2005–2018 showed a downward trend in the countries that are the largest sources (France, Germany, the United Kingdom). An upward trend was observed in Poland and Italy. In Ireland, emissions decreased until 2011 and then emissions increased.
The dynamics of changes in GHG emissions from enteric fermentation in relation to the 2005 base year showed emission reductions in France (−3.46%), Germany (−3.32%), the United Kingdom (−6.49%), Spain (−6.26%), and Romania (−8.71%). Increases in emissions were recorded in Poland (+10.87%), Ireland (+6.46%), and Italy (+3.60%) (Figure 9). This may be due to an increase in the cattle population.
In 2018, GHG emissions from enteric fermentation in the EU were lower by 1.75% compared with those in 2005. In this area, the majority of GHG emissions are related to dairy and beef cattle farming. It has a relatively high reduction potential for GHG emissions by 2030. The ongoing genetic and breeding work improve efficiencies such as feed conversion-to-milk yield ratio, which significantly reduce the amount of GHG emissions by 5–15% [16,17,18]. Further, modifications to nutrition by reducing fibre levels can lower emissions by 5–10% [18,19,20]. Additionally, the increase in the share of pasture feed in nutrition and the reduction in TMR consumption may result in reductions in GHG emissions [21,22]. In summary, the abovementioned actions may lead to a reduction in GHG emissions of up to 10%.

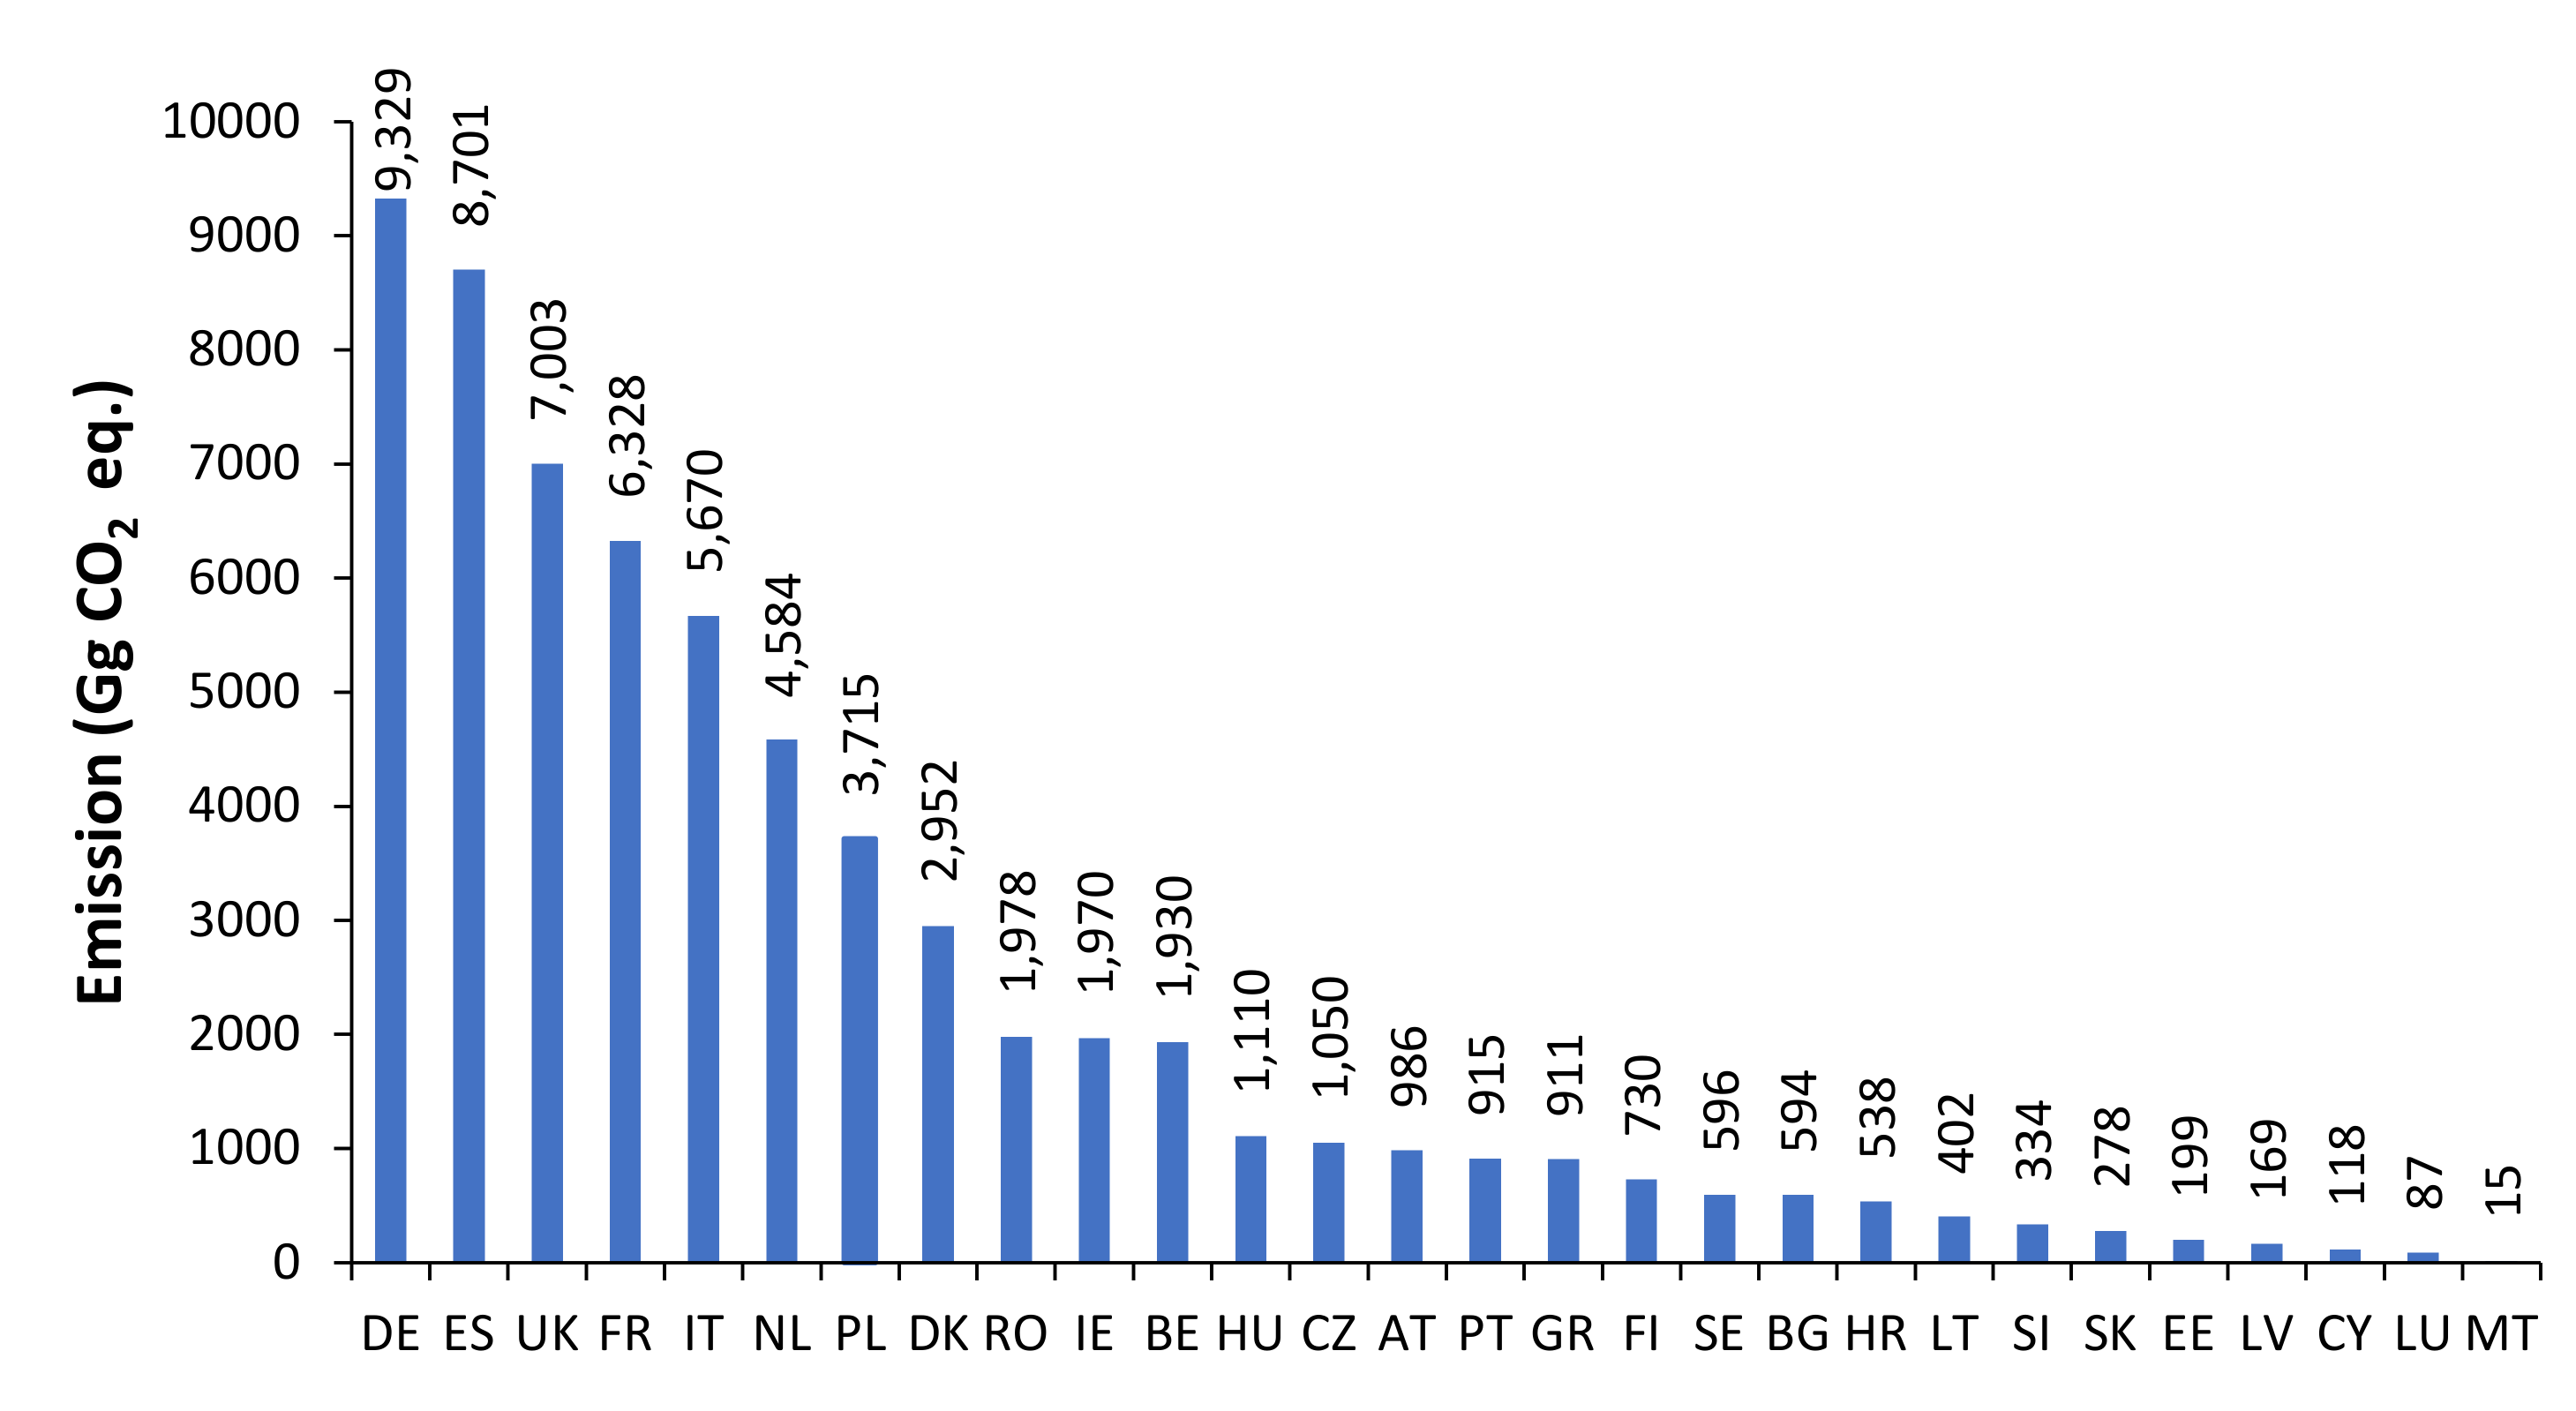
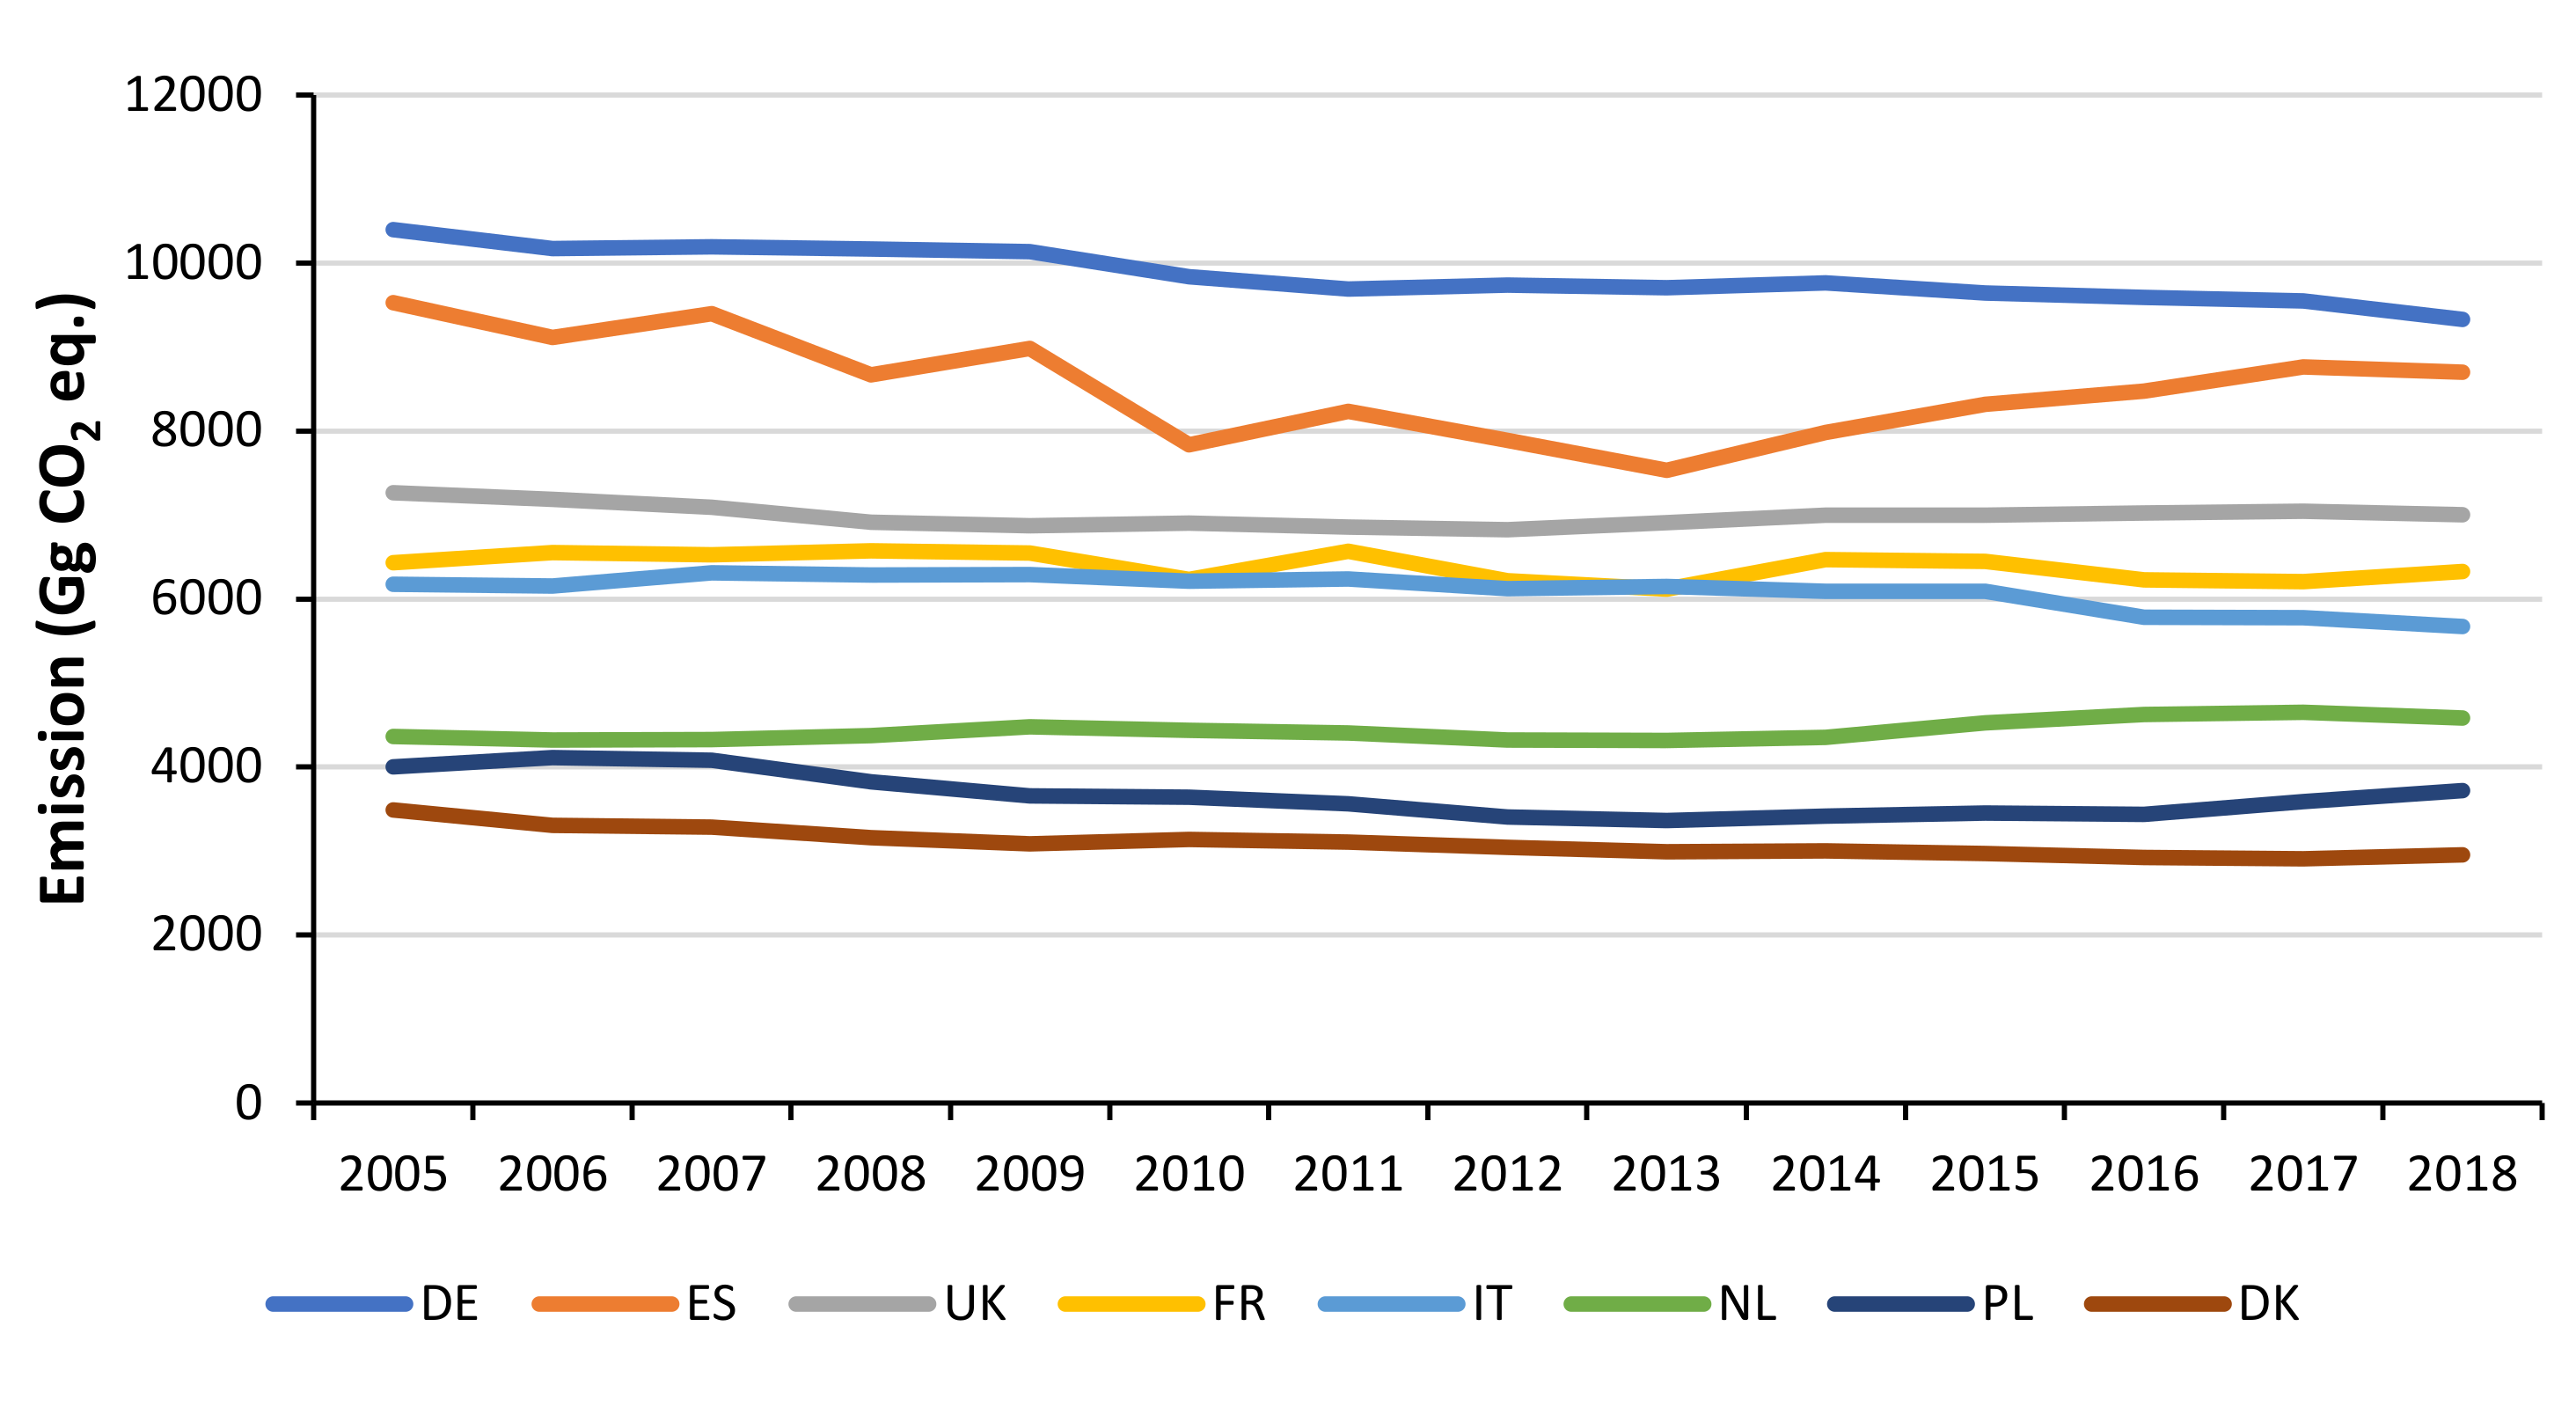
3.4.2. Manure Management

In 2018, GHG emissions from manure management in the EU amounted to 63 Tg CO2 eq. (CH4–65%, N2O–35%). The biggest sources of GHG emissions from manure management were Germany (14.8%), Spain (13.8%), the United Kingdom (11.1%), and France (10%); Cyprus, Luxembourg, and Malta had the lowest emissions (Figure 10).
Only in five countries, emissions from manure management in GHG emissions from agriculture in these countries was over 20%: Denmark (26.7%), the Netherlands (25.1%), Cyprus (23.7%), Malta (22.7%), and Spain (21.9%); meanwhile, in six countries, the share of emission from this source was below 10%: Ireland (9.9%), Lithuania (9.4%), Bulgaria (9.3%), Sweden (8.8%), France (8.5%), and Latvia (6.5%).
The analysis of GHG emissions from manure management in 2005–2018 showed that in Germany and Denmark, there was a clear downward trend in this period. In the Netherlands there was a clear upward trend. Emissions remained constant in the United Kingdom and France (Figure 11).
The dynamics of changes in GHG emissions from manure management in relation to the 2005 base year showed significant reductions in emissions in Denmark (−15.3%), Germany (−10.3%), Spain (−8.7%), Italy (−8.2%), and Poland (−7.2%). In the Netherlands, there were increases in emissions (+5.1%).
In 2018, GHG emissions from manure management in the EU were lower by 7.94% compared with those in 2005. Ongoing intensification of livestock production leads to increasing volumes of manure to be managed and may increase GHG emissions from the manure management area. At the same time, it changes the level of specialization and mechanization of European livestock production, which may reduce emissions. In larger farms, implementation of GHG emission reduction techniques is cheaper per animal, but complicated. One method of reducing GHG emissions is by improving or changing the housing system. It may result, depending on the type of animal, up to a 30% reduction of GHG emissions [23,24,25,26]. Another effective method is covering manure or slurry storage and closing the slurry channel, producing a 10% GHG reduction [27,28]. Total GHG emission reduction potential is quite low at about 10%. Changing the housing system is quite an effective way to reduce GHG emissions and is relatively cheap but only in new buildings. In existing livestock buildings, it often requires a change in construction, which is expansive. On the other hand, covering manure and slurry storages is not so expensive and may be forced by legal acts.

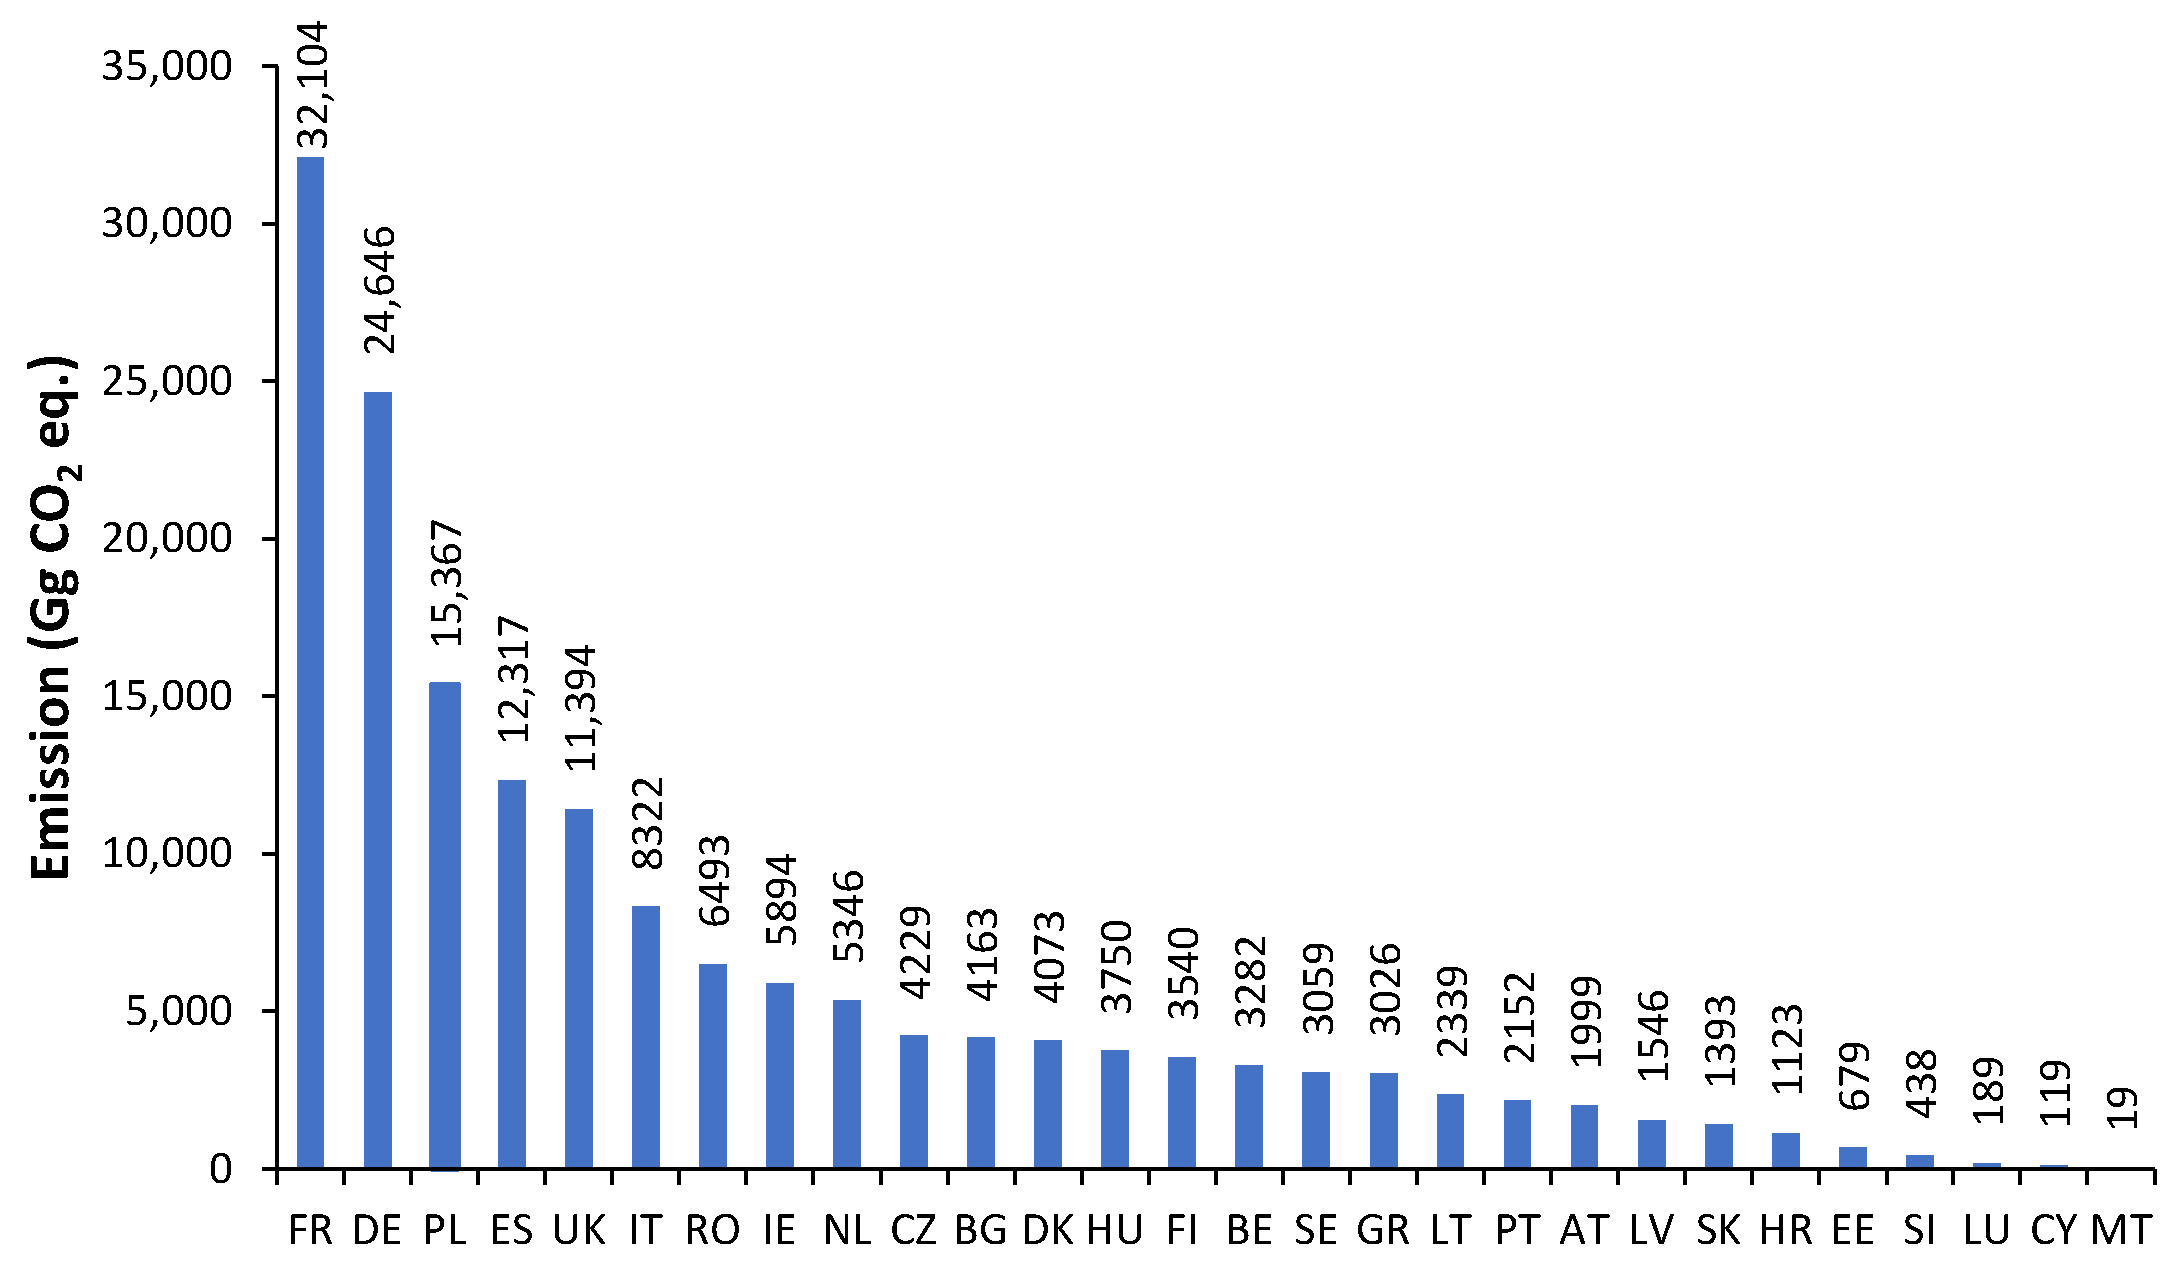
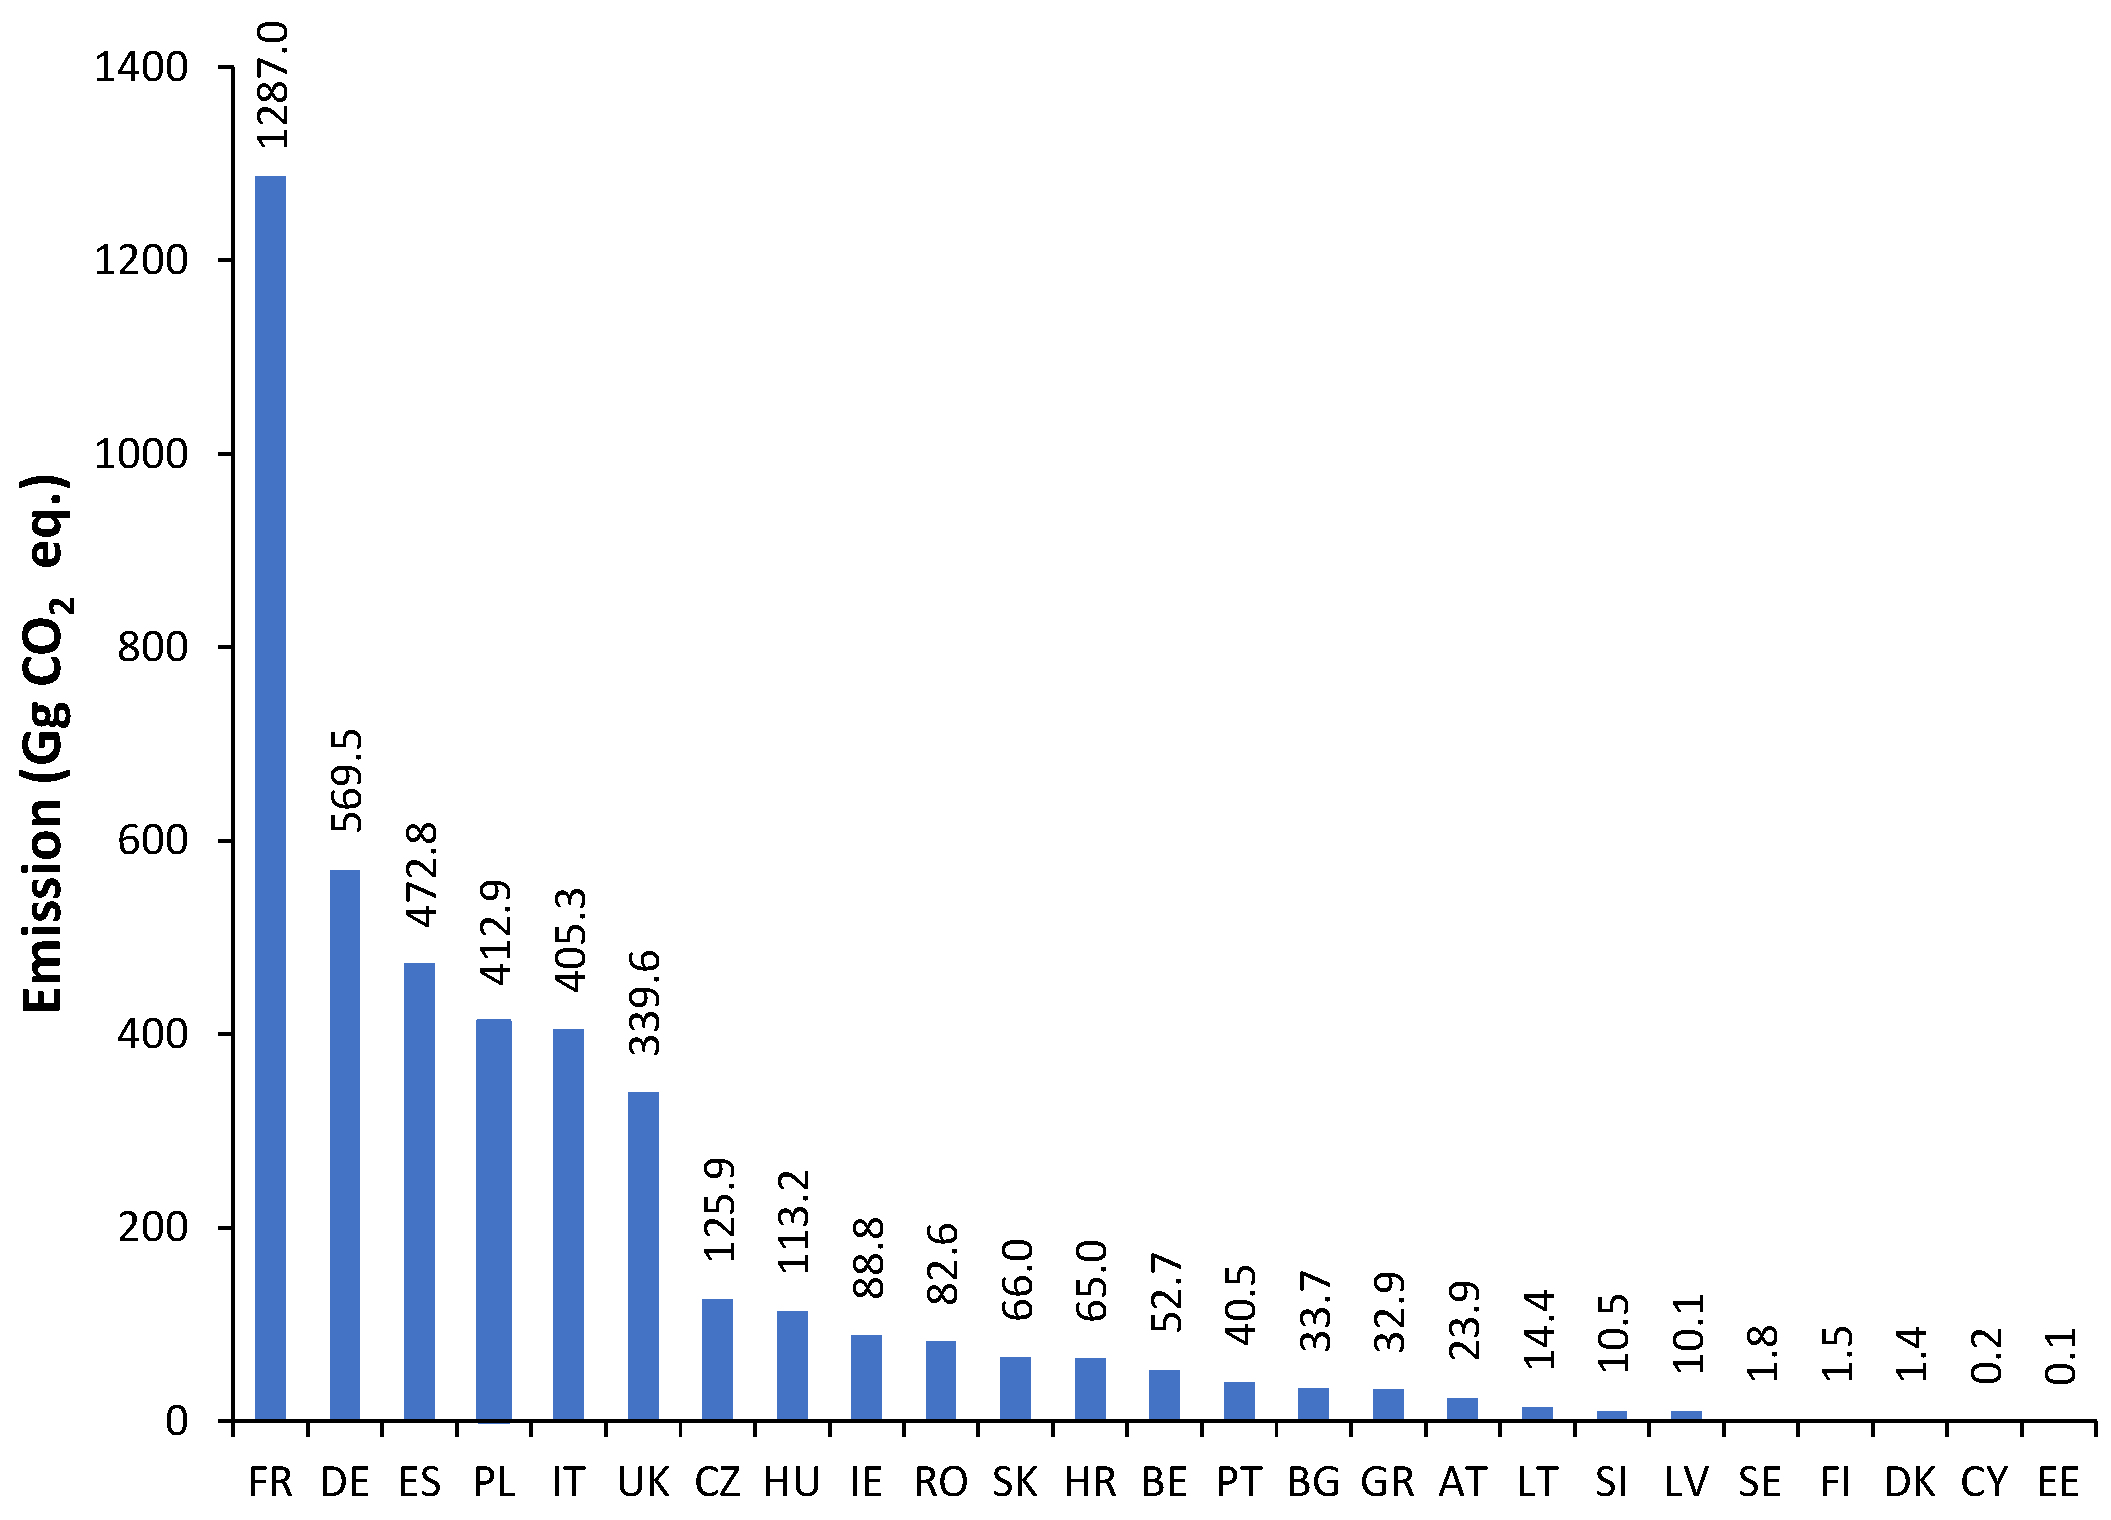
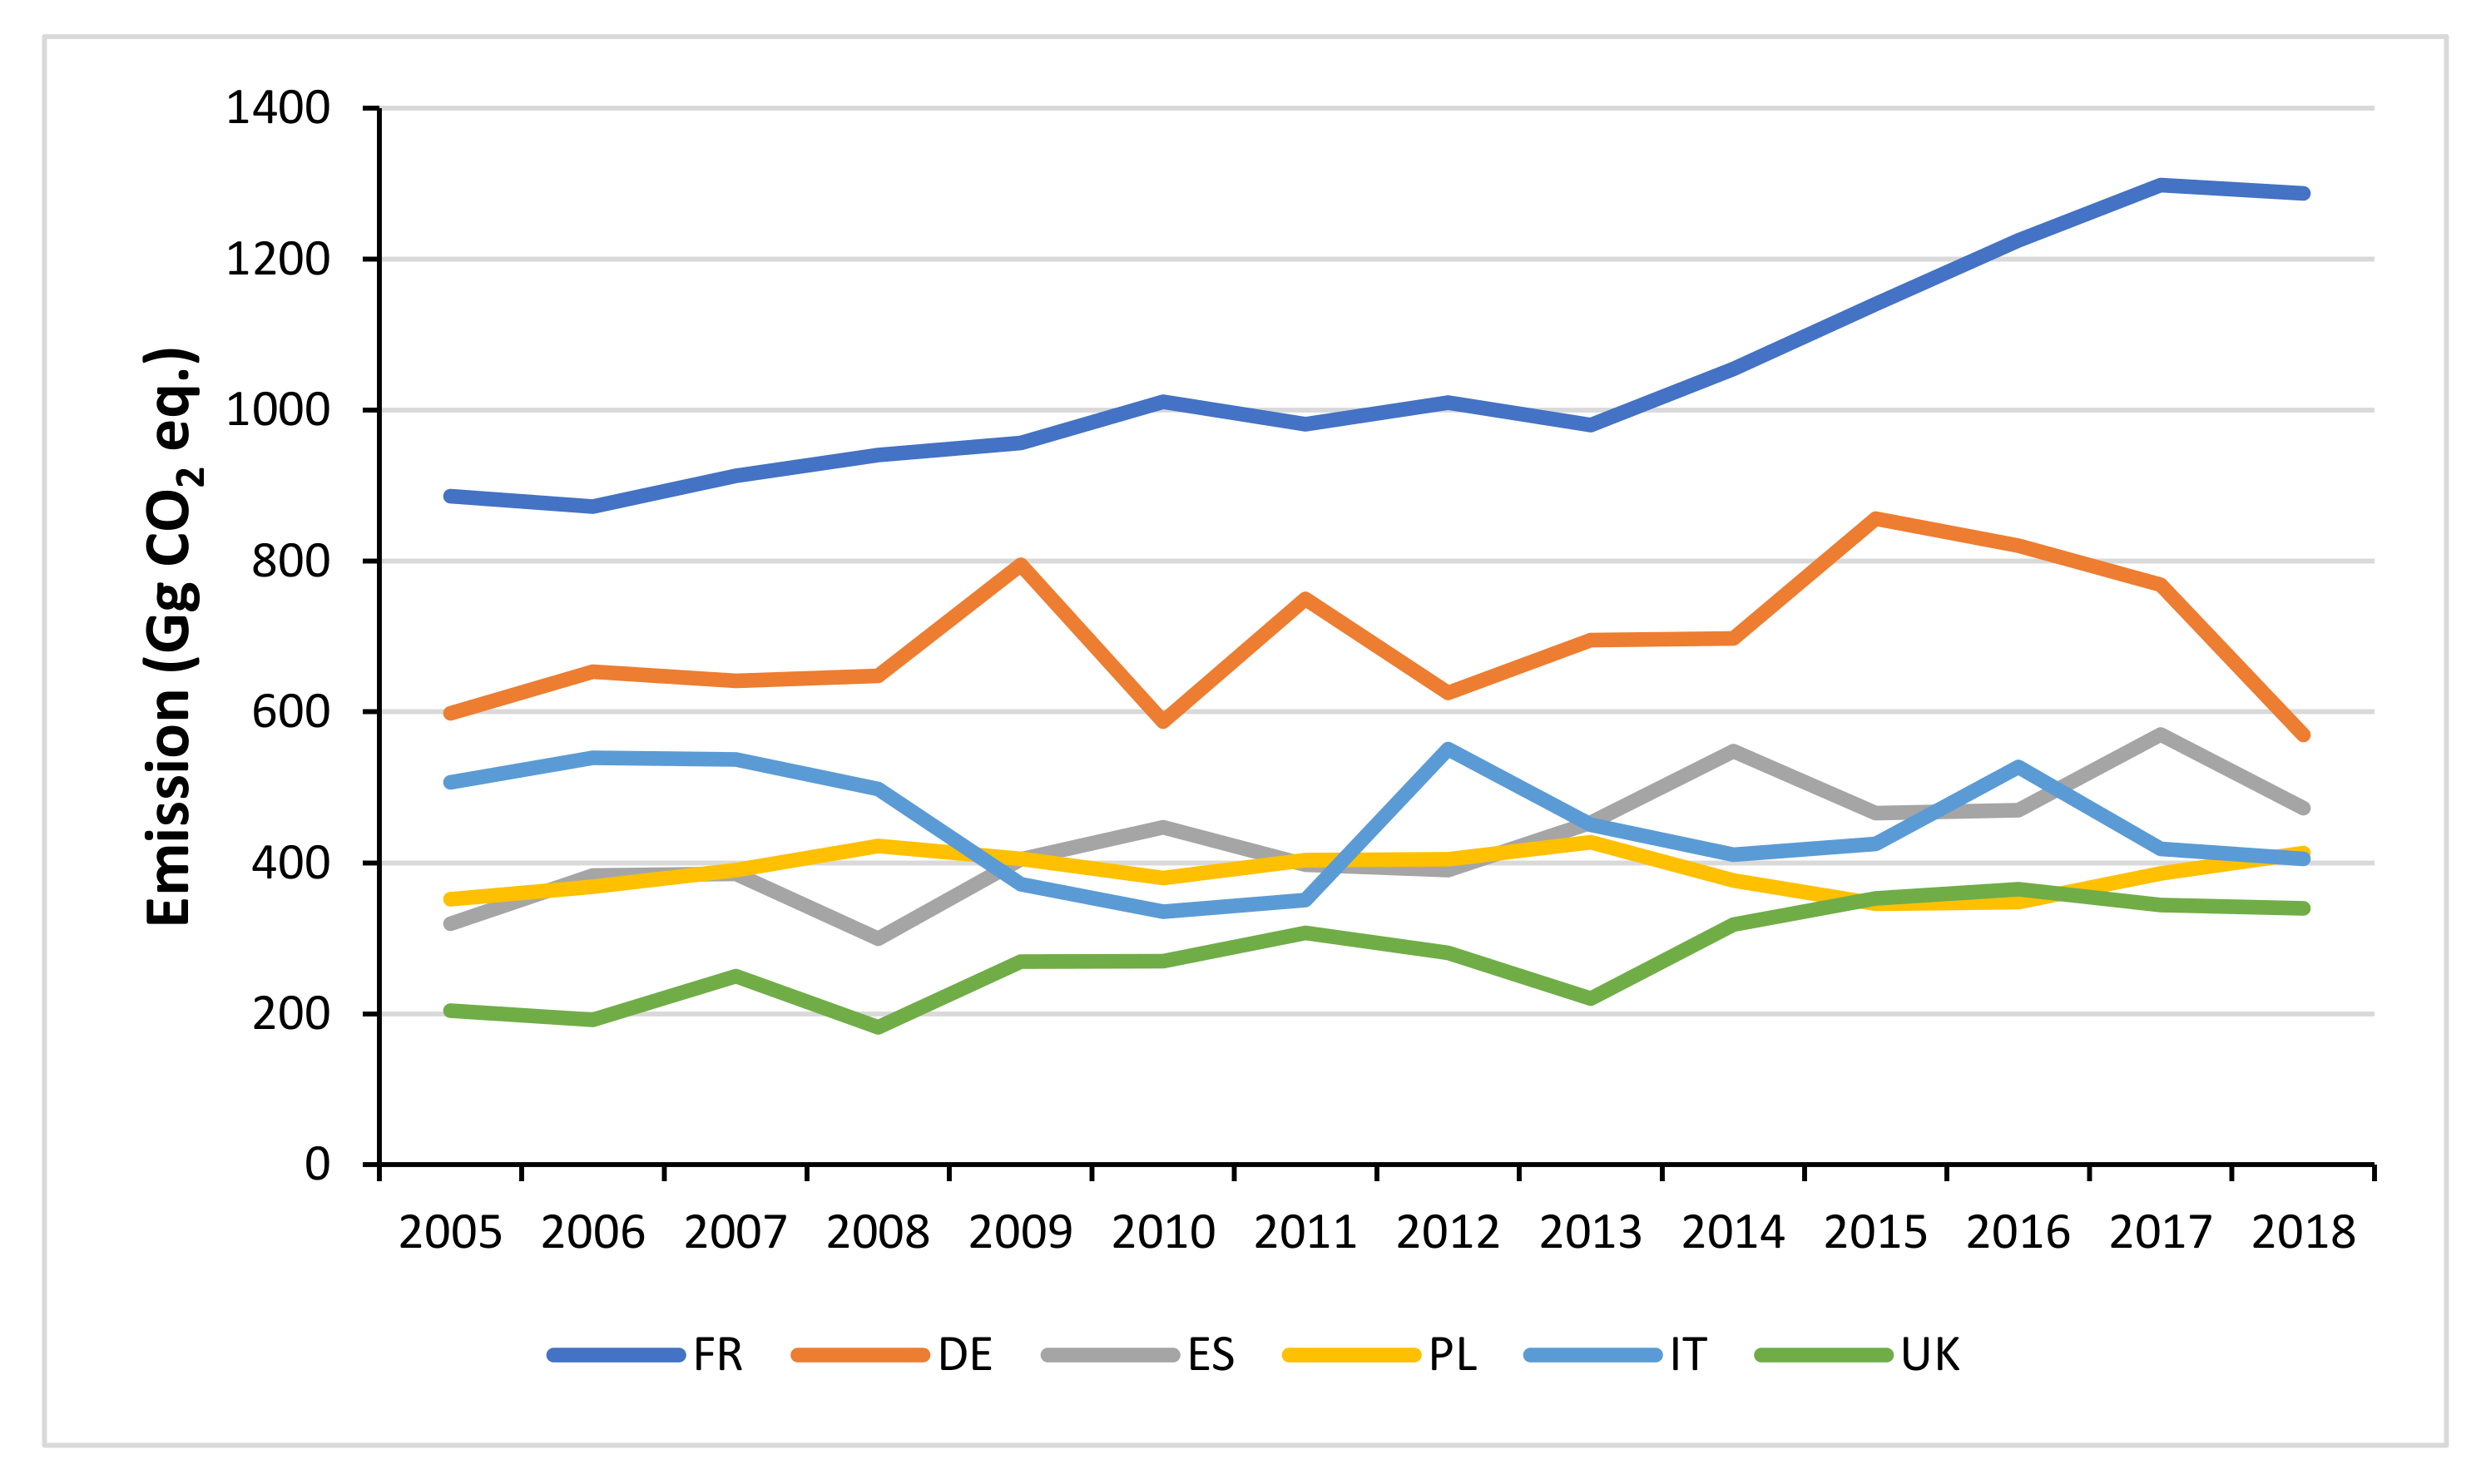
3.4.3. Agricultural Soils

In 2018, GHG emissions from agricultural soils in the EU amounted to 163 Tg CO2 eq. (N2O–100%). GHG emissions from agricultural soils in 2018 were the highest in France, Germany, and Poland whose shares were 19.7%, 15.1%, and 9.4%, respectively. Significant sources of emissions were also Spain (7.6%) and the United Kingdom (7.0%). The lowest emissions were again noted in Luxembourg, Cyprus, and Malta (Figure 12).
In six countries, the share of emissions from agricultural soils in the GHG emissions from agriculture in these countries was over 50%: Bulgaria (64.9%), Latvia (59.3%), Lithuania (54.7%), Finland (53.9%), Hungary (52.5%), and Slovakia (50.7%). In the next six countries, this share was over 40%: the Czech Republic (49.1%), Estonia (47.3%), Poland (46.4%), Sweden (45.0%), France (42.9%), and Croatia (41.3%); in nine countries, the share of GHG emissions from agricultural soils was below 30%: Ireland (29.5%), the Netherlands (29.3%), Malta (28.9%), the United Kingdom (27.9%), Austria (27.7%), Italy (27.6%), Luxembourg (27.3%), Slovenia (25.5%), and Cyprus (23.9%).
Changes in GHG emissions from agricultural soils in 2005–2018 were similar in the United Kingdom and Ireland; emissions remained constant. A downward trend was observed in Italy and France while the upward trend was in Spain, Poland, and Romania (Figure 13).
The analysis of the dynamics of changes in GHG emissions from agricultural soils in relation to the 2005 base year showed a clear increase in emissions in Poland (+13.1%) and Romania (+20%). These increases may result from the stabilization of the agricultural market and the decline in the fallow land. Lower increases in emissions were observed in Spain (+5.7%) and Ireland (+3.8%). Decreases occurred in Italy (−15.6%), France (−4.1%), the United Kingdom (−3.1%), and Germany (−2.2%).
In 2018, GHG emissions from agricultural soils in the EU were higher by 1.36% compared with those in 2005. The natural and synthetic fertilization is the main source of GHG emissions in the area of agricultural soils. The best way to reduce these emissions is to optimize the process of fertilization, understood as a precise selection of the fertilizer dose. The dose selection is closely related to the method of fertilization. To minimize the fertilizer dose and GHG emissions, the main direction is the direct land application of fertilizers. These solutions primarily reduce the time of contact between fertilizers and air by their covering by soil shortly after application in the field or their application directly into the soil. Using this method, it was observed that the GHG emissions reduced by 20% [29,30,31].

3.4.4. Field Burning of Agricultural Residues

In 2018, GHG emissions from field burning of agricultural residues in the EU amounted to 0.6 Tg CO2 eq. (CH4–73%, N2O–27%). In 2018, GHG emissions from field burning of agricultural residues were noted in only thirteen countries; it was the largest in Romania and accounted for nearly 57% of EU emissions in this source, followed by France (9.5%) and Portugal (8.2%). Austria (0.1%), Hungary (0.06%), and Cyprus (0.04%) had the smallest share in GHG emissions from field burning of agricultural residues in the EU (Figure 14).
The highest share of emissions from field burning of agricultural residues in the total emissions from agriculture was in Romania and was 1.8%. The next three countries were Portugal (0.76%), Bulgaria (0.55%), and Greece (0.49%). In other countries, this share was marginal.
According to the analysis of GHG emissions from field burning of agricultural residues in 2005–2018, it was noticed that in Poland and Bulgaria, emissions slowly increased; a downward trend was observed in Romania, Greece, and Spain. In other countries, emissions remained relatively constant (Figure 15).
The analysis of the dynamics of changes in GHG emissions from field burning of agricultural residues in relation to the base year 2005 showed significant increases in emissions in Poland (+29.1%) and Bulgaria (+75.1%). It may be due to increase in the share of crops, which generate the field burning residues. On the other hand, significant decreases in emissions from this source were noted in Romania (−49.9%), Spain (−39.8%), and Greece (−23.1%).
In 2018, GHG emissions from field burning of agricultural residues in the EU were lower by 36.56% compared with those in 2005. Field burning of agricultural residues is fast and economical, but it is highly unsustainable, as it produces large amounts of air pollutants. The best way to reduce GHG emissions from this area is through the legal prohibition of such practices and alternative agricultural residues management. It may be converted to formed fuel (brick, pellets) or combusted directly for energy [32,33]. Another method to reduce emissions from this area is to compost the residues for fertilization and incorporation into the soil [34,35]. Projected reduction level of GHG emissions in this area may be as much as 70%.

3.4.5. Liming

In 2018, GHG emissions from liming in the EU amounted to 6 Tg CO2 eq. (CO2–100%). GHG emissions from liming in 2018 were inventoried in 24 countries. The largest source was Germany, responsible for almost 36% of emissions in the EU. The next were the United Kingdom and France, whose shares were 15.4% and 12.2%, respectively. Slovakia, Slovenia, Lithuania, Luxembourg, Croatia, Hungary, and Portugal had a small share in GHG emissions from liming in the EU (Figure 16).
The largest share of emissions from liming in the total emissions from agriculture was in Germany and Finland, which amounted to 3.4% and 3.2%, respectively. In Denmark, Ireland, and the United Kingdom, the share was slightly above 2%. In contrast, a marginal share of 0.1% was noted in Portugal, Spain, Hungary, and Italy.
The analysis of GHG emissions from liming in 2005–2018 showed a clear upward trend in Denmark. On the other hand, a clear downward trend was observed in the United Kingdom. In other countries, the emissions were characterized by high variability without a clear upward or downward trend (Figure 17).
The dynamics of changes in GHG emissions from liming in relation to the base year 2005 showed reductions for France (−20%), Finland (−27.5%), the United Kingdom (−34.1%), and Poland (−44.2%). Germany and Ireland noted an increase in emissions from liming (+51%) and (+71.5%), respectively.
In 2018, GHG emissions from liming in the EU were lower by 3.35% compared with those in 2005. The reduction of GHG emissions from liming is a complex process. The change in soil pH during liming contributes to the reduction of N2O emissions from acid soils. However, this reduction effect is counterbalanced by CO2 emissions during the chemical dissolution of calcium carbonate. Actually, research is carried out on the chemical and biological processes taking place during liming and the release of CO2, N2O, and CH4 from the soil. There are a small number of studies on the effect of liming on GHG emissions due to changes in biological processes in soil, limiting the possibility of including these processes in the GHG emission modelling process [36,37,38]. The level of GHG emission reduction in the next 10 years can be assumed at the level of 0–5%.

3.4.6. Urea Application

In 2018, GHG emission from urea application in the EU amounted to 4 Tg CO2 eq. (CO2–100%). GHG emissions from urea application in 2018 were observed in 25 countries. France, with a share of over 30% of EU emissions, was the largest source. Subsequently, there were Germany, Spain, and Poland, whose shares amounted to 13.4%, 11.1%, and 9.7%, respectively. Sweden, Finland, Denmark, Cyprus, and Estonia had a small share in GHG emissions from urea application in the EU (Figure 18).
The largest shares of urea application in the total agricultural emissions were in Croatia and Slovakia, which was 2.4% in both countries. In six countries, this share was above 1%, they are France (1.72%), Hungary (1.58%), the Czech Republic (1.46%), Italy (1.34%), Poland (1.25%), and Spain (1.19%). On the other hand, a marginal share (0.04% and less) was recorded in Cyprus, Denmark, Estonia, Finland, and Sweden.
Based on the GHG emissions from urea application in the period 2005–2018, a clear upward trend in emissions was observed in France. An upward trend was also noted in the United Kingdom and Spain. In other countries, emissions were characterized by high variability without a clear upward or downward trend (Figure 19).
The analysis of the dynamics of changes in GHG emissions from urea application compared with the base year 2005 showed the largest emission increases in France (+45.3%), Spain (+48.3%), and the United Kingdom (+66.7%). Only in Italy, the GHG emissions significantly decreased (−20.1%).
In 2018, GHG emissions from urea application in the EU were higher by 25.72% compared with those in 2005. It is possible to significantly reduce GHG emissions in this area. One way is to replace urea with other ammonium nitrate fertilizers. For a long time, the potential of urease and nitrification inhibitors in reducing greenhouse gas emissions because of the massive use of agricultural fertilizers has also been recognized. Another method is by polymeric coating urea granules. The total GHG reduction potential of these methods ranges from 60 to 90% [39,40,41,42].

4. Conclusions

Climate change is a global problem, therefore, only the efforts of many countries—especially the largest ones—can bring measurable benefits in the form of stabilization and then reduction of anthropogenic GHG emissions into the atmosphere. For this reason, measures taken by individual EU countries should be coordinated, because then one can expect significantly beneficial effects of the policy, as a result of revealing synergistic effects. The proposed measures and instruments to reduce GHG emissions and to mitigate climate change result from the level of development of EU countries and their economic situation.
Comparing 2018 with the base year 2005, emissions from the agricultural sector decreased by about 2%, which is less than the assumed 10% reduction of GHG emissions in non-ETS sector. The ambitious goals set by the EU for 2030 assume a 30% reduction in the non-ETS sector. This will require a significant reduction of GHG emissions from agriculture. Based on the analysis of the GHG emission structure and available reduction techniques, it was calculated that in this period, it should be possible to reduce emissions from agriculture by about 15%. The concentration and intensification of agriculture in the EU, considered as a threat to the environment, may contribute to the reduction of GHG emissions. This is related to the areas where emissions may be significantly reduced, in particular, enteric fermentation, manure management, and agricultural soils, which together account for about 98% of GHG emissions. Reduction of emissions from these areas is associated with the rebuilding of existing buildings or the construction of new facilities, the purchase of equipment for the precise preparation of feed and the application of fertilizers, and the employment of qualified personnel. In large farms, the implementation of such techniques generates lower investment and operating unit costs. In smaller farms, the application of reduction techniques is simply unprofitable financially.
Reducing GHG emissions requires the involvement of significant human resources, changes in legal regulations, financial outlays, as well as organizational and technical changes. However, the level of reduction is difficult to predict because the changes in the livestock population and the crop structure for the next 10 years, which have a direct impact on GHG emission levels, are difficult to determine.

Author Contributions

Conceptualization, P.M.-B. and W.R.; methodology, P.M.-B. and W.R.; formal analysis, P.M.-B. and W.R.; investigation, P.M.-B. and W.R.; resources, P.M.-B. and W.R.; writing—original draft preparation, P.M.-B. and W.R.; writing—review and editing, P.M.-B. and W.R.; visualization, P.M.-B. and W.R.; supervision, P.M.-B. and W.R. All authors have read and agreed to the published version of the manuscript.

Funding

This research received no external funding.

Institutional Review Board Statement

Not applicable.

Informed Consent Statement

Not applicable.

Data Availability Statement

The data on greenhouse gas emissions are available online at https://www.eea.europa.eu/data-and-maps/data/data-viewers/greenhouse-gases-viewer, accessed on 15 February 2021.

Conflicts of Interest

The authors declare no conflict of interest.

References

  1. Kweku, D.; Bismark, O.; Maxwell, A.; Desmond, K.; Danso, K.; Oti-Mensah, E.; Quachie, A.; Adormaa, B. Greenhouse Effect: Greenhouse Gases and Their Impact on Global Warming. J. Sci. Res. Rep. 2018, 17, 1–9. [Google Scholar] [CrossRef]
  2. Cofała, J.; Amann, M.; Asman, W.; Bertok, I.; Heyes, C.; Höglund-Isaksson, L.; Klimont, Z.; Schöpp, W.; Wagner, F. Integrated Assessment of Air Pollution and Greenhouse Gases Mitigation in Europe. Arch. Environ. Prot. 2010, 36, 29–39. [Google Scholar]
  3. Le Treut, H.; Somerville, R.; Cubasch, U.; Ding, Y.; Mauritzen, C.; Musset, A.; Peterson, T.; Prather, M. Historical Overview of Climate Change. In Climate Change 2007: The Physical Science Basis. Contribution of Working Group I to the Fourth Assessment Report of the Intergovernmental Panel on Climate Change; Solomon, S., Qin, D., Manning, M., Chen, Z., Marquis, M., Averyt, K.B., Tignor, M., Miller, H.L., Eds.; Cambridge University Press: Cambridge, UK, 2007. [Google Scholar]
  4. Valipour, M.; Bateni, S.M.; Jun, C. Global Surface Temperature: A New Insight. Climate 2021, 9, 81. [Google Scholar] [CrossRef]
  5. Nijsse, F.J.; Cox, P.M.; Huntingford, C.; Williamson, M.S. Decadal Global Temperature Variability Increases Strongly with Climate sensitivity. Nat. Clim. Chang. 2019, 9, 598–601. [Google Scholar] [CrossRef]
  6. Eurostat. The Source Data for GHG Emissions. 2020. Available online: http://ec.europa.eu/eurostat/data/database (accessed on 12 December 2020).
  7. Schimel, D.; Alves, D.; Enting, I.; Heimann, M. Chapter 2: Radiative Forcing of Climate Change. In Climate Change 1995: The Science of Climate Change. Contribution of Working Group I to the Second Assessment Report of the Intergovernmental Panel on Climate Change; Houghton, J.T., Meira Filho, L.G., Callander, B.A., Harris, N., Kattenberg, A., Maskell, K., Eds.; Press Syndicate of the University of Cambridge: Cambridge, UK, 1996. [Google Scholar]
  8. Myhre, G.; Shindell, D.; Bréon, F.-M.; Collins, W.; Fuglestvedt, J.; Huang, J.; Koch, D.; Lamarque, J.-F.; Lee, D.; Mendoza, B.; et al. Anthropogenic and Natural Radiative Forcing. In Climate Change 2013: The Physical Science Basis. Contribution of Working Group I to the Fifth Assessment Report of the Intergovernmental Panel on Climate Change; Stocker, T.F., Qin, D., Plattner, G.-K., Tignor, M., Allen, S.K., Boschung, J., Nauels, A., Xia, Y., Bex, V., Midgley, P.M., Eds.; Cambridge University Press: Cambridge, UK, 2013. [Google Scholar]
  9. Prather, M.J.; Holmes, C.D.; Hsu, J. Reactive greenhouse gas scenarios: Systematic exploration of uncertainties and the role of atmospheric chemistry. Geophys. Res. Lett. 2012, 39, L09803. [Google Scholar] [CrossRef] [Green Version]
  10. COM. Communication from the Commission to the European Parliament, the Council, the European Economic and Social Committee and the Committee of the Regions. 20 20 by 2020 Europe’s Climate Change Opportunity. Available online: https://eur-lex.europa.eu/legal-content/EN/TXT/?uri=COM:2008:0030:FIN (accessed on 12 December 2020).
  11. PE. Decision No 406/2009/EC of the European Parliament and of the Council of 23 April 2009 on the Effort of Member States to Reduce Their Greenhouse Gas Emissions to Meet the Community’s Greenhouse Gas Emission Reduction Commitments Up to 2020. Available online: https://eur-lex.europa.eu/legal-content/EN/TXT/?uri=CELEX:32009D0406 (accessed on 12 December 2020).
  12. COM. Communication from the Commission to the European Parliament, the Council, the European Economic and Social Committee and the Committee of the Regions. A Policy Framework for Climate and Energy in the Period from 2020 to 2030. Available online: https://eur-lex.europa.eu/legal-content/EN/ALL/?uri=celex%3A52014DC0015 (accessed on 12 December 2020).
  13. EEA. European Environment Agency. 2020. Available online: https://www.eea.europa.eu/data-and-maps/data/data-viewers/greenhouse-gases-viewer (accessed on 12 December 2020).
  14. IPCC. IPCC Guidelines for National Greenhouse Gas Inventories. 2006. Available online: https://www.ipcc-nggip.iges.or.jp/public/2006gl (accessed on 12 December 2020).
  15. Syp, A. Greenhouse Gas Emissions from Agriculture in 1990–2014. Zeszyty Naukowe Szkoły Głównej Gospodarstwa Wiejskiego w Warszawie. Problemy Rolnictwa Światowego 2017, 17, 244–255. [Google Scholar] [CrossRef]
  16. Kiefer, L.; Menzel, F.; Bahrs, E. The effect of feed demand on greenhouse gas emissions and farm profitability for organic and conventional dairy farms. J. Dairy Sci. 2014, 97, 7564–7574. [Google Scholar] [CrossRef] [Green Version]
  17. Rotz, A.C. Modeling greenhouse gas emissions from dairy farms. J. Dairy Sci. 2017, 101, 6675–6690. [Google Scholar] [CrossRef] [PubMed]
  18. Capper, J.L.; Cady, R.A. The effects of improved performance in the U.S. dairy cattle industry on environmental impacts between 2007 and 2017. J. Anim. Sci. 2020, 98, 1–14. [Google Scholar] [CrossRef]
  19. Rendon-Huerta, J.A.; Pinos-Rodriguez, J.; Kebreab, E. Animal nutrition strategies to reduce greenhouse gas emissions in dairy cattle. Acta Univ. 2018, 28, 34–41. [Google Scholar] [CrossRef]
  20. Hammond, K.J.; Humphries, D.J.; Crompton, L.A.; Green, C.; Reynolds, C.K. Methane emissions from cattle: Estimates from short-term measurements using a GreenFeed system compared with measurements obtained using respiration chambers or sulphur hexafluoride tracer. Anim. Feed. Sci. Technol. 2015, 203, 41–52. [Google Scholar] [CrossRef]
  21. O’Brien, D.; Geoghegan, A.; McNamara, K.; Shalloo, L. How can grass-based dairy farmers reduce the carbon footprint of milk? Anim. Prod. Sci. 2016, 56, 495–500. [Google Scholar] [CrossRef]
  22. Van der Weerden, T.; Beukes, P.; De Klein, C.; Hutchinson, K.; Farrell, L.; Stormink, T.; Romera, A.; Dalley, D.; Monaghan, R.; Chapman, D.; et al. The Effects of System Changes in Grazed Dairy Farmlet Trials on Greenhouse Gas Emissions. Animals 2018, 8, 234. [Google Scholar] [CrossRef] [PubMed] [Green Version]
  23. Fournel, S.; Pelletier, F.; Godbout, S.; Lagacé, R.; Feddes, J. Greenhouse Gas Emissions from Three Cage Layer Housing Systems. Animals 2012, 2, 1–15. [Google Scholar] [CrossRef] [PubMed] [Green Version]
  24. Philippe, F.X.; Nicks, B. Review on greenhouse gas emissions from pig houses: Production of carbon dioxide, methane and nitrous oxide by animals and manure. Agric. Ecosyst. Environ. 2015, 199, 10–25. [Google Scholar] [CrossRef] [Green Version]
  25. Samsonstuen, S.; Åby, B.A.; Crosson, P.; Beauchemin, K.A.; Aass, L. Mitigation of greenhouse gas emissions from beef cattle production systems. Acta Agric. Scand. Sect. A—Anim. Sci. 2020, 69, 220–232. [Google Scholar] [CrossRef]
  26. Witkowska, D.; Korczyński, M.; Koziel, J.; Sowińska, J.; Chojnowski, B. The Effect of Dairy Cattle Housing Systems on the Concentrations and Emissions of Gaseous Mixtures in Barns Determined by Fourier-Transform Infrared Spectroscopy. Ann. Anim. Sci. 2020, 20, 1487–1507. [Google Scholar] [CrossRef]
  27. Kupper, T.; Häni, C.; Neftel, A.; Kincaid, C.; Bühler, M.; Amon, B.; Van der Zaag, A. Ammonia and greenhouse gas emissions from slurry storage—A review. Agric. Ecosyst. Environ. 2020, 300, 106963. [Google Scholar] [CrossRef]
  28. Amon, B.; Kryvoruchko, V.; Amon, T. Influence of different methods of covering slurry stores on greenhouse gas and ammonia emissions. Int. Congr. Ser. 2006, 1293, 315–318. [Google Scholar] [CrossRef]
  29. Shimizu, M.; Satoru, M.; Desyatkin, A.R.; Jin, T.; Hata, H.; Hatano, R. The effect of manure application on carbon dynamics and budgets in a managed grassland of Southern Hokkaido, Japan. Agric. Ecosyst. Environ. 2009, 130, 31–40. [Google Scholar] [CrossRef]
  30. Smith, K.; Watts, D.; Way, T.; Torbert, H.; Prior, S. Impact of Tillage and Fertilizer Application Method on Gas Emissions in a Corn Cropping System. Pedosphere 2012, 22, 604–615. [Google Scholar] [CrossRef]
  31. Duncan, E.W.; Dell, C.J.; Kleinman, P.J.A.; Beegle, D.B. Nitrous Oxide and Ammonia Emissions from Injected and Broadcast—Applied Dairy Slurry. J. Environ. Qual. 2017, 46, 36–44. [Google Scholar] [CrossRef] [PubMed]
  32. Statuto, D.; Picuno, P. Improving the greenhouse energy efficiency through the reuse of agricultural residues. Acta Hortic. 2017, 1170, 501–508. [Google Scholar] [CrossRef]
  33. Algieri, A.; Andiloro, S.; Tamburino, V.; Zema, D.A. The potential of agricultural residues for energy production in Calabria (Southern Italy). Renew. Sustain. Energy Rev. 2019, 104, 1–14. [Google Scholar] [CrossRef]
  34. Viaene, J.; Van Lancker, J.; Vandecasteele, B.; Willekens, K.; Bijttebier, J.; Ruysschaert, G.; De Neve, S.; Reubens, B. Opportunities and barriers to on-farm composting and compost application: A case study from northwestern Europe. Waste Manag. 2016, 48, 181–192. [Google Scholar] [CrossRef]
  35. Bedoić, R.; Ćosić, B.; Duić, N. Technical potential and geographic distribution of agricultural residues, co-products and by-products in the European Union. Sci. Total Environ. 2019, 686, 56–579. [Google Scholar] [CrossRef] [PubMed]
  36. Page, K.L.; Allen, D.E.; Dalal, R.C.; Slattery, W. Processes and magnitude of CO2, CH4, and N2O fluxes from liming of Australian acidic soils: A review. Aust. J. Soil Res. 2019, 47, 747–762. [Google Scholar] [CrossRef]
  37. Barton, L.; Gleeson, D.B.; Maccarone, L.D.; Zúñiga, L.P.; Murphy, D.V. Is Liming Soil a Strategy for Mitigating Nitrous Oxide Emissions from Semi-arid Soils? Soil Biol. Biochem. 2013, 62, 28–35. [Google Scholar] [CrossRef]
  38. Hénault, C.; Bourennane, H.; Ayzac, A.; Ratié, C.; Saby, N.P.A.; Cohan, J.-P.; Eglin, T.; Le Gall, C. Management of soil pH promotes nitrous oxide reduction and thus mitigates soil emissions of this greenhouse gas. Sci. Rep. 2019, 9, 20182. [Google Scholar] [CrossRef] [Green Version]
  39. Watson, C.J. Urease activity and inhibition—Principles and practice. In Proceedings of the International Fertiliser Society, York, UK, 1 April 2000. [Google Scholar]
  40. Krasuska, E.; Pudełko, R.; Faber, A.; Jarosz, Z.; Borzęcka-Walker, M.; Syp, A.; Kozyra, J. Optimization and risk analysis of greenhouse gas emissions depending on yield and nitrogen rates in winter wheat cultivation. J. Food Agric. Environ. 2013, 11, 2217–2219. [Google Scholar]
  41. Byrne, M.P.; Tobin, J.T.; Forrestal, P.J.; Danaher, M.; Nkwonta, C.G.; Richards, K.; Cummins, E.; Hogan, S.A.; O’Callaghan, T.F. Urease and Nitrification Inhibitors—As Mitigation Tools for Greenhouse Gas Emissions in Sustainable Dairy Systems: A Review. Sustainability 2020, 12, 6018. [Google Scholar] [CrossRef]
  42. Xie, Y.; Tang, L.; Han, Y.L.; Yang, L.; Xie, G.X.; Peng, J.W.; Tian, C.; Zhou, X.; Liu, Q.; Rong, X.M.; et al. Reduction in nitrogen fertilizer applications by the use of polymer-coated urea: Effect on maize yields and environmental impacts of nitrogen losses. J. Sci. Food Agric. 2019, 99, 2259–2266. [Google Scholar] [CrossRef] [PubMed]
Figure 1. Total greenhouse gas (GHG) emissions and agricultural GHG emissions in the EU for 1990–2018.
Atmosphere 12 01396 g001
Figure 2. GHG emissions in the EU countries in 2018. Explanation: DE—Germany, UK—United Kingdom, FR—France, IT—Italy, PL—Poland, ES—Spain, NL—The Netherlands, CZ—Czech Republic, BE—Belgium, RO—Romania, GR—Greece, AT—Austria, PT—Portugal, HU—Hungary, IE—Ireland, BG—Bulgaria, FI—Finland, SE—Sweden, DK—Denmark, SK—Slovakia, HR—Croatia, LT—Lithuania, EE—Estonia, SI—Slovenia, LV—Latvia, LU—Luxembourg, CY—Cyprus, MT—Malta.
Atmosphere 12 01396 g002
Figure 3. Total GHG emission in selected countries in 1990–2018.
Atmosphere 12 01396 g003
Figure 4. GHG emissions from agriculture and its share of national total GHG emissions in 2018.
Atmosphere 12 01396 g004
Figure 5. GHG emissions from agriculture in selected countries in 2005–2018.
Atmosphere 12 01396 g005
Figure 6. GHG emissions from agricultural sources in the EU in 2018.
Atmosphere 12 01396 g006
Figure 7. GHG emissions from agricultural sources in the EU in 2005–2018.
Atmosphere 12 01396 g007
Figure 8. GHG emissions from enteric fermentation in EU countries in 2018.
Atmosphere 12 01396 g008
Figure 9. GHG emissions from enteric fermentation in selected EU countries in 2005–2018.
Atmosphere 12 01396 g009
Figure 10. GHG emissions from manure management in EU countries in 2018.
Atmosphere 12 01396 g010
Figure 11. GHG emissions from manure management in selected EU countries in 2005–2018.
Atmosphere 12 01396 g011
Figure 12. GHG emissions from agricultural soils in EU countries in 2018.
Atmosphere 12 01396 g012
Figure 13. GHG emissions from agricultural soils in selected EU countries in 2005–2018.
Atmosphere 12 01396 g013
Figure 14. GHG emissions from field burning of agricultural residues in EU countries in 2018.
Atmosphere 12 01396 g014
Figure 15. GHG emissions from field burning of agricultural residues in selected EU countries in 2005–2018.
Atmosphere 12 01396 g015
Figure 16. GHG emissions from liming in EU countries in 2018.
Atmosphere 12 01396 g016
Figure 17. GHG emissions from liming in selected EU countries in 2005–2018.
Atmosphere 12 01396 g017
Figure 18. GHG emissions from urea application in EU countries in 2018.
Atmosphere 12 01396 g018
Figure 19. GHG emissions from urea application in selected EU countries in 2005–2018.
Atmosphere 12 01396 g019
Table 1. Agricultural greenhouse gases (GHG) emission changes in EU countries in 2005–2018.
CountryAgricultural GHG Emission in 2018
(Gg CO2 eq.)
Changes in Agricultural GHG Emissions for 2005–2018
(%)
GHG Emission Limits in 2020 Compared with 2005 GHG Levels
(%)
Reduction of GHG Emissions in 2030 Compared with 2005 GHG Levels
(%)
FR74,774.04−3.3−14−37
DE63,564.89−1.0−14−38
UK40,837.00−5.6−16−37
ES39,643.76−3.2−10−26
PL33,117.077.914−7
IT30,186.58−5.8−13−33
IE19,953.076.5−20−30
RO19,854.03−6.119−2
NL18,234.55−0.6−10−36
DK11,041.26−2.0−20−39
BE9960.88−3.8−15−35
CZ8606.505.19−14
GR7781.50−13.1−4−16
AT7224.353.3−16−36
HU7145.6416.510−7
PT6798.761.61−17
SE6790.17−3.6−17−40
FI6562.490.3−16−39
BG6415.6924.1200
LT4280.663.315−9
SK2745.294.513−12
HR2720.30−17.5-−7
LV2609.4012.317−6
SI1721.71−0.64−15
EE1437.7920.411−13
LU690.449.8−20−40
CY499.40−6.3−5−24
MT65.46−13.75−19
Explanation: red color—EU countries that have not yet reached the 2020 GHG limit in 2018; green color—EU countries that have reached the 2020 GHG limit in 2018. Source: [12,14].
Publisher’s Note: MDPI stays neutral with regard to jurisdictional claims in published maps and institutional affiliations.

