Next Issue
Volume 11, June
Previous Issue
Volume 11, April


Atmosphere, Volume 11, Issue 5 (May 2020) – 115 articles

Cover Story (view full-size image): 
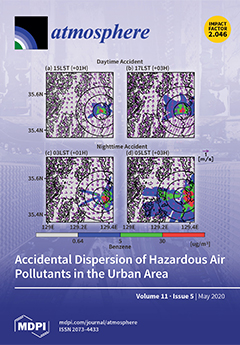
This study developed a numerical simulation system to predict the dispersion of HAPs due to accidental release. It is affected significantly by horizontal transport driven by local circulation in a diurnal timescale and also by vertical diffusion, suggesting that the local meteorological condition is critical in emergency response to chemical accidents. As this numerical simulation system based on the CALPUFF model can reflect the real-time meteorological condition, it is useful not only for assessing the potential risk and establishing long-term measures, but also in responding to actual accidents and enforcing instant safety measures for residents. View this paper
  • Issues are regarded as officially published after their release is announced to the table of contents alert mailing list.
  • You may sign up for e-mail alerts to receive table of contents of newly released issues.
  • PDF is the official format for papers published in both, html and pdf forms. To view the papers in pdf format, click on the "PDF Full-text" link, and use the free Adobe Reader to open them.
Order results
Result details
Section
Select all
Export citation of selected articles as:
27 pages, 5157 KiB  
Article
Modeling Compact Intracloud Discharge (CID) as a Streamer Burst
by Vernon Cooray, Gerald Cooray, Marcos Rubinstein and Farhad Rachidi
Atmosphere 2020, 11(5), 549; https://doi.org/10.3390/atmos11050549 - 25 May 2020
Cited by 13 | Viewed by 3276
Abstract
Narrow Bipolar Pulses are generated by bursts of electrical activity in the cloud and these are referred to as Compact Intracloud Discharges (CID) or Narrow Bipolar Events in the current literature. These discharges usually occur in isolation without much electrical activity before or [...] Read more.
Narrow Bipolar Pulses are generated by bursts of electrical activity in the cloud and these are referred to as Compact Intracloud Discharges (CID) or Narrow Bipolar Events in the current literature. These discharges usually occur in isolation without much electrical activity before or after the event, but sometimes they are observed to initiate lightning flashes. In this paper, we have studied the features of CIDs assuming that they consist of streamer bursts without any conducting channels. A typical CID may contain about 109 streamer heads during the time of its maximum growth. A CID consists of a current front of several nanosecond duration that travels forward with the speed of the streamers. The amplitude of this current front increases initially during the streamer growth and decays subsequently as the streamer burst continues to propagate. Depending on the conductivity of the streamer channels, there could be a low-level current flow behind this current front which transports negative charge towards the streamer origin. The features of the current associated with the CID are very different from those of the radiation field that it generates. The duration of the radiation field of a CID is about 10–20 μs, whereas the duration of the propagating current pulse associated with the CID is no more than a few nanoseconds in duration. The peak current of a CID is the result of a multitude of small currents associated with a large number of streamers and, if all the forward moving streamer heads are located on a single horizontal plane, the cumulative current that radiates at its peak value could be about 108 A. On the other hand, the current associated with an individual streamer is no more than a few hundreds of mA. However, if the location of the forward moving streamer heads are spread in a vertical direction, the peak current can be reduced considerably. Moreover, this large current is spread over an area of several tens to several hundreds of square meters. The study shows that the streamer model of the CID could explain the fine structure of the radiation fields present both in the electric field and electric field time derivative. Full article
(This article belongs to the Section Meteorology)
Show Figures

Figure 1

11 pages, 3686 KiB  
Article
Investigating the Large-Scale Transport of a Volcanic Plume and the Impact on a Secondary Site
by David Jean Du Preez, Hassan Bencherif, Nelson Bègue, Lieven Clarisse, Rebecca F. Hoffman and Caradee Yael Wright
Atmosphere 2020, 11(5), 548; https://doi.org/10.3390/atmos11050548 - 25 May 2020
Cited by 3 | Viewed by 3019
Abstract
Volcanic plumes can be transported across vast distances and can have an impact on solar ultraviolet radiation (UVR) reaching the surface due to the scattering and absorption caused by aerosols. The dispersion of the volcanic plume from the Puyehue-Cordón Caulle volcanic complex (PCCVC) [...] Read more.
Volcanic plumes can be transported across vast distances and can have an impact on solar ultraviolet radiation (UVR) reaching the surface due to the scattering and absorption caused by aerosols. The dispersion of the volcanic plume from the Puyehue-Cordón Caulle volcanic complex (PCCVC) eruption was investigated to determine the effect on aerosol loading at Cape Point, South Africa. The eruption occurred on 4 June 2011 and resulted in a plume reaching a height of between 9 and 12 km and was dispersed across the Southern Hemisphere. Satellite sulphur dioxide (SO2) observations and a dispersion model showed low concentrations of SO2 at the secondary site. However, satellite observations of volcanic ash and ground-based aerosol measurements did show increases between 10 and 20 June 2011 at the secondary site. Furthermore, there was good agreement with the dispersion model results and observations from satellites with most of the plume located between latitudes 40°–60° South. Full article
(This article belongs to the Special Issue Forecasting the Transport of Volcanic Ash in the Atmosphere)
Show Figures

Figure 1

23 pages, 2939 KiB  
Article
Spatiotemporal Variations and Health Implications of Hazardous Air Pollutants in Ulsan, a Multi-Industrial City in Korea
by Kyung-Min Baek, Min-Ji Kim, Young-Kyo Seo, Byung-Wook Kang, Jong-Ho Kim and Sung-Ok Baek
Atmosphere 2020, 11(5), 547; https://doi.org/10.3390/atmos11050547 - 25 May 2020
Cited by 7 | Viewed by 2682
Abstract
We measured a wide range of hazardous air pollutants (HAPs) simultaneously at five sites over four seasons in 2009–2010 in Ulsan, the largest industrial city in Korea. Target analytes included volatile organic compounds (VOCs), carbonyls, polycyclic aromatic hydrocarbons (PAHs), phthalates, and heavy metals [...] Read more.
We measured a wide range of hazardous air pollutants (HAPs) simultaneously at five sites over four seasons in 2009–2010 in Ulsan, the largest industrial city in Korea. Target analytes included volatile organic compounds (VOCs), carbonyls, polycyclic aromatic hydrocarbons (PAHs), phthalates, and heavy metals (HMs). The objectives of this study were to evaluate the occurrence and spatiotemporal distributions of HAPs, and to identify important HAPs based on health risk assessment. Industrial emissions affected ambient levels of VOCs and HMs, as demonstrated by spatial distribution analysis. However, concentrations of PAHs and phthalates were relatively uniform at all sites. VOCs and HMs exhibited little seasonal variation, while formaldehyde increased in the summer due to its secondary formation. PAHs exhibited notable seasonal variation; higher in cold seasons and lower in warm seasons. Cumulative cancer risks imposed by 35 HAPs were 4.7 × 10⁻⁴ and 1.7 × 10⁻⁴ in industrial and residential areas, respectively. The top five major cancer risk drivers appeared to be formaldehyde, benzene, benzo[a]pyrene, As, and Co. The sums of hazard quotients (HQ) derived by 47 HAPs were 10.0 (industrial) and 2.4 (residential). As the individual species, only two HAPs exceeded the HQ of 1, which are As (3.1) and Pb (2.1) in the industrial area. This study demonstrated the importance of a comprehensive monitoring and health risk assessment to prioritize potentially toxic pollutants in the ambient air of a large industrial city. Full article
(This article belongs to the Special Issue Health Impact Assessment of Air Pollution)
Show Figures

Figure 1

25 pages, 6463 KiB  
Article
An Integrated Cooling Jet and Air Curtain System for Stadiums in Hot Climates
by Fangliang Zhong and John Calautit
Atmosphere 2020, 11(5), 546; https://doi.org/10.3390/atmos11050546 - 25 May 2020
Cited by 4 | Viewed by 4264
Abstract
The 2022 FIFA World Cup brings Qatar great challenges in terms of minimizing the cooling energy consumption and providing thermal comfort for both spectators and players. This paper presents comparisons among the results of thermal and wind environment modelling of a semi-outdoor stadium [...] Read more.
The 2022 FIFA World Cup brings Qatar great challenges in terms of minimizing the cooling energy consumption and providing thermal comfort for both spectators and players. This paper presents comparisons among the results of thermal and wind environment modelling of a semi-outdoor stadium under three different cooling configurations and a baseline configuration without cooling using the Computational Fluid Dynamics (CFD) tool ANSYS Fluent 18.2. The three cooling configurations are: (1) vertical jets only above upper tiers, (2) vertical jets above upper tiers and horizontal jets at the back of lower tiers and around the pitch, (3) integrated vertical jets above upper tiers, horizontal jets at the back of lower tiers and air curtains at gates. De-coupled solar radiation simulations are implemented using the solar irradiance data in Doha under fair weather conditions method in Fluent in order to capture realistic thermal boundary conditions for the ground, stadium and surrounding buildings. On the basis of the set conditions, the results show that air curtains, employed in configuration 3 are effective in preventing the penetration of hot outside air through the gates of the stadium, which is an existing issue for stadiums in hot climates, and also contribute to lower energy consumption per match than the other configurations of cooling jets. The results presented in this study are useful not only for future design and retrofits of stadiums in hot climates but also for stadiums that incorporate mechanical cooling. Full article
(This article belongs to the Section Air Quality and Human Health)
Show Figures

Figure 1

20 pages, 1017 KiB  
Article
Quantifying the Economic Cost of Reducing GHG Emissions through Changes in Household Demand: A Linear Multi-Sectoral Approach for European Countries
by Alfredo J. Mainar-Causapé, Margarita I. Barrera-Lozano and Patricia D. Fuentes-Saguar
Atmosphere 2020, 11(5), 545; https://doi.org/10.3390/atmos11050545 - 24 May 2020
Cited by 1 | Viewed by 2230
Abstract
The mitigation of Greenhouse Gas Emissions can be approached in various ways: from the supply side, by using improvements in technologies and input uses; and from the changes in the demand for products, by influencing consumer behavior to achieve a more sustainable consumption [...] Read more.
The mitigation of Greenhouse Gas Emissions can be approached in various ways: from the supply side, by using improvements in technologies and input uses; and from the changes in the demand for products, by influencing consumer behavior to achieve a more sustainable consumption pattern. Either way it can be approached using multi-sectoral data based on an input–output or on a Social Accounting Matrix (SAM) framework, although a suitable database and the proposal of appropriate indicators are needed. A suitable database is developed through the estimation of new SAMs for the latest possible period, that of year 2015. This paper focuses on the demand approach: that of changes in the demand for products. It analyzes the different impacts among activities and commodities of a change in domestic household consumption patterns, compares the potential reductions in Greenhouse Gas (GHG) emissions obtained through the reduction of specific demands, and considers the consequent reduction in output and employment. For this purpose, a linear multi-sectoral analysis is employed that focuses on the main EU member states. Despite major differences between countries, the results show that a decrease in emissions through demand-reduction policies exerts greater negative effects on those less polluting sectors with a higher intensity in the labor force, and offers a more suitable option for those highly polluting sectors with a lower concentration of the work factor. Richer countries that are based on service sectors therefore suffer a sharper drop in employment using this kind of policy. Full article
(This article belongs to the Special Issue Greenhouse Gas Emission Mitigation: Feasibility and Economics)
Show Figures

Figure 1

12 pages, 3867 KiB  
Article
Heavy Rainfall and Landslide Event in January 1831 at the Pedregoso Mountains (Cabeza Del Buey, SW Spain)
by Juan Pedro García-Garrido, María Cruz Gallego, Teodoro Palacios, Ricardo M. Trigo and José Manuel Vaquero
Atmosphere 2020, 11(5), 544; https://doi.org/10.3390/atmos11050544 - 23 May 2020
Cited by 4 | Viewed by 2881
Abstract
In this work, a landslide event that took place on January 1831 at the Pedregoso Mountains, Cabeza del Buey, SW Spain, is described. This landslide had not been documented to date and was only described in the local press. This event involved an [...] Read more.
In this work, a landslide event that took place on January 1831 at the Pedregoso Mountains, Cabeza del Buey, SW Spain, is described. This landslide had not been documented to date and was only described in the local press. This event involved an estimated amount of dislodged material in the order of 104 m3. The amount of meteorological data is very scarce as the event occurred before the setting up of the national meteorological service in Spain. However, data from the relatively near location of SW Iberia suggest that the landslide was preceded by a prolonged period of unusually high precipitation totals and that this intense wet period is compatible with the large-scale atmospheric configuration in the winter of 1829–1830. In fact, the North Atlantic Oscillation (NAO) index for that winter achieved one of the most negative values observed in the bicentennial period spanning 1821 to 2019. This multidisciplinary work represents the first attempt to report and describe the main triggering mechanism for an historical landslide in the Extremadura region that is similar to other great historical landslides which have already been documented for other locations in Spain. Full article
(This article belongs to the Special Issue Long Term Climate Variability in the Mediterranean Region)
Show Figures

Figure 1

20 pages, 3212 KiB  
Article
The Climatological Analysis of Typhoon Tracks, Steering Flow, and the Pacific Subtropical High in the Vicinity of Taiwan and the Western North Pacific
by Chih-wen Hung, Ming-Fu Shih and Te-Yuan Lin
Atmosphere 2020, 11(5), 543; https://doi.org/10.3390/atmos11050543 - 23 May 2020
Cited by 8 | Viewed by 5399
Abstract
Taiwan frequently suffers from typhoon hits in the boreal summer and fall. The location of Taiwan makes it vulnerable to the pathways of typhoons mainly determined by the position of the Pacific subtropical high. In order to clarify the linkage between typhoon invasion [...] Read more.
Taiwan frequently suffers from typhoon hits in the boreal summer and fall. The location of Taiwan makes it vulnerable to the pathways of typhoons mainly determined by the position of the Pacific subtropical high. In order to clarify the linkage between typhoon invasion and associated large-scale environments from a climatological perspective, this study counts the historical typhoon invasion days for each month in the typhoon season to establish analyzed cases and then categorizes them with statistical thresholds. Besides, the categorized cases with less typhoon invasion are further sorted to distinguish different movements of tropical cyclones. Therefore, corresponding composites are applied for each category. The results reveal that when the subtropical high retreats eastward, the accompanying steering flow guides typhoons to make an early recurvature toward Japan and South Korea. While the subtropical high further extends its property to the west covering Taiwan, the steering flow on the south transfers typhoons moving westward to the South China Sea. However, when the subtropical high lies in areas between the above two scenarios, the steering flow along the periphery of the subtropical high continuously sends typhoons toward Taiwan and the vicinity, which greatly increases the threat to the island. Full article
(This article belongs to the Section Climatology)
Show Figures

Figure 1

23 pages, 1483 KiB  
Article
Secondary Ice Formation in Idealised Deep Convection—Source of Primary Ice and Impact on Glaciation
by Annette K. Miltenberger, Tim Lüttmer and Christoph Siewert
Atmosphere 2020, 11(5), 542; https://doi.org/10.3390/atmos11050542 - 23 May 2020
Cited by 5 | Viewed by 2988
Abstract
Secondary ice production via rime-splintering is considered to be an important process for rapid glaciation and high ice crystal numbers observed in mixed-phase convective clouds. An open question is how rime-splintering is triggered in the relatively short time between cloud formation and observations [...] Read more.
Secondary ice production via rime-splintering is considered to be an important process for rapid glaciation and high ice crystal numbers observed in mixed-phase convective clouds. An open question is how rime-splintering is triggered in the relatively short time between cloud formation and observations of high ice crystal numbers. We use idealised simulations of a deep convective cloud system to investigate the thermodynamic and cloud microphysical evolution of air parcels, in which the model predicts secondary ice formation. The Lagrangian analysis suggests that the “in-situ” formation of rimers either by growth of primary ice or rain freezing does not play a major role in triggering secondary ice formation. Instead, rimers are predominantly imported into air parcels through sedimentation form higher altitudes. While ice nucleating particles (INPs) initiating heterogeneous freezing of cloud droplets at temperatures warmer than −10 °C have no discernible impact of the occurrence of secondary ice formation, in a scenario with rain freezing secondary ice production is initiated slightly earlier in the cloud evolution and at slightly different places, although with no major impact on the abundance or spatial distribution of secondary ice in the cloud as a whole. These results suggest that for interpreting and analysing observational data and model experiments regarding cloud glaciation and ice formation it is vital to consider the complex vertical coupling of cloud microphysical processes in deep convective clouds via three-dimensional transport and sedimentation. Full article
(This article belongs to the Special Issue Microphysics of Precipitation Particles: Raindrops, Hail, and Snow)
Show Figures

Figure 1

27 pages, 11787 KiB  
Article
Application of Lightning Data Assimilation for the 10 October 2018 Case Study over Sardinia
by Rosa Claudia Torcasio, Stefano Federico, Silvia Puca, Gianfranco Vulpiani, Albert Comellas Prat and Stefano Dietrich
Atmosphere 2020, 11(5), 541; https://doi.org/10.3390/atmos11050541 - 22 May 2020
Cited by 5 | Viewed by 2314
Abstract
On 10 October 2018 an intense storm, characterized by heavy rainfall, hit the Sardinia island, reaching a peak of 452 mm of rain measured in 24 h. Among others, two particularly intense phases were registered between 3 and 6 UTC (Universal Coordinated Time), [...] Read more.
On 10 October 2018 an intense storm, characterized by heavy rainfall, hit the Sardinia island, reaching a peak of 452 mm of rain measured in 24 h. Among others, two particularly intense phases were registered between 3 and 6 UTC (Universal Coordinated Time), and between 18 and 24 UTC. The forecast of this case study is challenging because the precipitation was heavy and localized. In particular, the meteorological model used in this paper, provides a good prediction only for the second period over the eastern part of the Sardinia island. In this work, we study the impact of lightning data assimilation and horizontal grid resolution on the Very Short-term Forecast (VSF, 3 and 1 h) for this challenging case, using the RAMS@ISAC meteorological model. The comparison between the 3 h VSF control run and the simulations with lightning data assimilation shows the considerable improvement given by lightning data assimilation, especially for the precipitation that occurred in the eastern part of the island. Reducing the VSF range to 1 h, resulted in higher model performance with a good precipitation prediction over eastern and south-central Sardinia. In addition, the comparison between simulated and observed reflectivity shows an important improvement of simulations with lightning data assimilation compared to the control forecast. However, simulations assimilating lightning overestimated the precipitation in the last part of the day. The increasing of the horizontal resolution to 2 km grid spacing reduces the false alarms and improves the model performance. Full article
(This article belongs to the Special Issue Forecasting Heavy Weather in Mediterranean Region)
Show Figures

Figure 1

14 pages, 3860 KiB  
Article
Bio-Aerosols Negatively Affect Prochlorococcus in Oligotrophic Aerosol-Rich Marine Regions
by Eyal Rahav, Adina Paytan, Esra Mescioglu, Edo Bar-Zeev, Francisca Martínez Ruiz, Peng Xian and Barak Herut
Atmosphere 2020, 11(5), 540; https://doi.org/10.3390/atmos11050540 - 22 May 2020
Cited by 11 | Viewed by 2782
Abstract
The marine cyanobacterium Prochlorococcus is a dominant photoautotroph in many oligotrophic Low-Nutrients-Low-Chlorophyll (LNLC) regions. While the chemical impact of aerosols upon interaction with surface seawater was documented in numerous studies, we show that Prochlorococcus cells are affected also by bio-aerosols (potentially biological agents [...] Read more.
The marine cyanobacterium Prochlorococcus is a dominant photoautotroph in many oligotrophic Low-Nutrients-Low-Chlorophyll (LNLC) regions. While the chemical impact of aerosols upon interaction with surface seawater was documented in numerous studies, we show that Prochlorococcus cells are affected also by bio-aerosols (potentially biological agents in the dust/aerosols such as membrane-bound extracellular vesicles, small-size bacteria and/or viruses), resulting in lower surface seawater abundances in the oligotrophic Mediterranean Sea. We conducted experimental amendments of ‘live’ aerosol/dust particles and aerosol filtrates (<0.22-µm) to surface Southeastern Mediterranean seawater or to pure Prochlorococcus cultures (MED4). Results show a significant decline in cell biomass (<90%), while UV-sterilized aerosols elicited a much weaker and non-significant response (~10%). We suggest that the difference is due to a negative effect of bio-aerosols specific to Prochlorococcus. Accordingly, the dominance of Synechococcus over Prochlorococcus throughout the surface Mediterranean Sea (observed mainly in spring when atmospheric aerosol levels are relatively high) and the lack of spatial westward gradient in Prochlorococcus biomass as typically observed for chlorophyll-a or other cyanobacteria may be attributed, at least to some extent, to the impact of bio-aerosol deposition across the basin. Predictions for enhanced desertification and increased dust emissions may intensify the transport and potential impact of bio-aerosols in LNLC marine systems. Full article
(This article belongs to the Section Aerosols)
Show Figures

Figure 1

32 pages, 2177 KiB  
Review
Balancing Waste and Nutrient Flows Between Urban Agglomerations and Rural Ecosystems: Biochar for Improving Crop Growth and Urban Air Quality in The Mediterranean Region
by Anastasia Zabaniotou and Katerina Stamou
Atmosphere 2020, 11(5), 539; https://doi.org/10.3390/atmos11050539 - 22 May 2020
Cited by 8 | Viewed by 3725
Abstract
Mediterranean ecosystems are threatened by water and nutrient scarcity and continuous loss of soil organic carbon. Urban agglomerations and rural ecosystems in the Mediterranean region and globally are interlinked through the flows of resources/nutrients and wastes. Contributing to balancing these cycles, the present [...] Read more.
Mediterranean ecosystems are threatened by water and nutrient scarcity and continuous loss of soil organic carbon. Urban agglomerations and rural ecosystems in the Mediterranean region and globally are interlinked through the flows of resources/nutrients and wastes. Contributing to balancing these cycles, the present study advocates standardized biochar as a soil amendment, produced from Mediterranean suitable biowaste, for closing the nutrient loop in agriculture, with parallel greenhouse gas reduction, enhancing air quality in urban agglomerations, mitigating climate change. The study’s scope is the contextualization of pyrolytic conditions and biowaste type effects on the yield and properties of biochar and to shed light on biochar’s role in soil fertility and climate change mitigation. Mediterranean-type suitable feedstocks (biowaste) to produce biochar, in accordance with biomass feedstocks approved for use in producing biochar by the European Biochar Certificate, are screened. Data form large-scale and long-period field experiments are considered. The findings advocate the following: (a) pyrolytic biochar application in soils contributes to the retention of important nutrients for agricultural production, thereby reducing the use of fertilizers; (b) pyrolysis does not release carbon dioxide to the atmosphere, contributing positively to the balance of carbon dioxide emissions to the atmosphere, with carbon uptake by plant photosynthesis; (c) biochar stores carbon in soils, counterbalancing the effect of climate change by sequestering carbon; (d) there is an imperative need to identify the suitable feedstock for the production of sustainable and safe biochar from a range of biowaste, according to the European Biochar Certificate, for safe crop production. Full article
Show Figures

Graphical abstract

18 pages, 3190 KiB  
Article
Predictability of the Strong Ural blocking Event in January 2012 in the Subseasonal to Seasonal Models of Europe and Canada
by Dong Chen, Shaobo Qiao, Shankai Tang, Ho Nam Cheung, Jieyu Liu and Guolin Feng
Atmosphere 2020, 11(5), 538; https://doi.org/10.3390/atmos11050538 - 22 May 2020
Cited by 3 | Viewed by 2136
Abstract
The occurrence of a Ural blocking (UB) event is an important precursor of severe cold air outbreaks in Siberia and East Asia, and thus is significant to accurately predict UB events. Using subseasonal to seasonal (S2S) models of the European Centre for Medium-Range [...] Read more.
The occurrence of a Ural blocking (UB) event is an important precursor of severe cold air outbreaks in Siberia and East Asia, and thus is significant to accurately predict UB events. Using subseasonal to seasonal (S2S) models of the European Centre for Medium-Range Weather Forecasts (ECMWF) and the Environment and Climate Change Canada (ECCC), we evaluated the predictability of a persistent UB event on 18 to 26 January 2012. Results showed that the ECCC model was superior to the ECMWF model in predicting the development stage of the UB event ten days in advance, while the ECMWF model had better predictions than the ECCC model for more than ten days in advance and the decaying stage of the UB event. By comparing the dynamic and thermodynamic evolution of the UB event predicted by the two models via the geostrophic vorticity tendency equation and temperature tendency equation, we found that the ECCC model better predicted the vertical vorticity advection, ageostrophic vorticity tendency, the tilting effect, horizontal temperature advection, and adiabatic heating during the development stage, whereas the ECMWF model better predicted the three dynamic and the two thermodynamic terms during the decaying stage. In addition, during both the development and decaying stages, the two models were good (bad) at predicting the vortex stretching term (horizontal vorticity advection), with the PCC between both the predictions and the observations larger (smaller) than +0.70 (+0.10) Thus, we suggest that the prediction of the persistent UB event in the S2S model might be improved by the better prediction of the horizontal vorticity advection. Full article
Show Figures

Graphical abstract

9 pages, 2250 KiB  
Article
Long-Term Trends of Air Pollution at National Atmospheric Observatory Košetice (ACTRIS, EMEP, GAW)
by Milan Váňa, Adéla Holubová Smejkalová, Jaroslava Svobodová and Pavel Machálek
Atmosphere 2020, 11(5), 537; https://doi.org/10.3390/atmos11050537 - 21 May 2020
Cited by 8 | Viewed by 2417
Abstract
The National Atmospheric Observatory Košetice operated by the Czech Hydrometeorological Institute was established in 1988 as a station specializing in air quality monitoring at the background scale. The observatory is located in the free area outside of the settlement and represents the Czech [...] Read more.
The National Atmospheric Observatory Košetice operated by the Czech Hydrometeorological Institute was established in 1988 as a station specializing in air quality monitoring at the background scale. The observatory is located in the free area outside of the settlement and represents the Czech Republic in various international projects. The objective of the present study is to detect the long-term trends of air quality at the background scale of the Czech Republic. The statistical method used for trend analysis is based on the nonparametric Mann–Kendall test. Generally, the results show that the fundamental drop in emission of basic air pollutants was reflected in the significant decrease in pollution levels. A most significant drop was detected for sulphur. No trend was found for NO2 in 1990–2012, but a visibly decreasing tendency was registered in the last 7 years. A slightly decreasing trend was registered for O3 in the whole period, but a slightly increasing tendency was found after 2006. More importantly, the number of episodes exceeding the target value for human health dropped significantly. The reduction of volatile organic compounds (VOCs) emissions was reflected in a statistically significant decrease of concentrations. Only isoprene, which is of natural origin, displays an inverse trend. Concentrations of elemental carbon (EC) and organic carbon (OC) dropped since 2010, but only for EC is the trend statistically significant. Full article
(This article belongs to the Special Issue Ambient Air Quality in the Czech Republic)
Show Figures

Figure 1

12 pages, 1387 KiB  
Article
Applying a Delphi-Type Approach to Estimate the Adaptation Cost on Agriculture to Climate Change in Cyprus
by Marinos Markou, Anastasios Michailidis, Efstratios Loizou, Stefanos A. Nastis, Dimitra Lazaridou, Georgios Kountios, Mohammad S. Allahyari, Andreas Stylianou, George Papadavid and Konstadinos Mattas
Atmosphere 2020, 11(5), 536; https://doi.org/10.3390/atmos11050536 - 21 May 2020
Cited by 11 | Viewed by 3841
Abstract
Agriculture is highly dependent on climate change, and Cyprus especially is experiencing its impacts on agricultural production to a greater extent, mainly due to its geographical location. The adaptation of farming to the effects of global climate change may lead to the maximization [...] Read more.
Agriculture is highly dependent on climate change, and Cyprus especially is experiencing its impacts on agricultural production to a greater extent, mainly due to its geographical location. The adaptation of farming to the effects of global climate change may lead to the maximization of agricultural production, which is an important and desirable improvement. The main aim of this paper is to rank and quantify the impacts of climate change on the agricultural sector of Cyprus, through a multi-round Delphi survey seeking a consensus agreement in a group of experts. A multidisciplinary group of 20 experts stated their willingness-to-pay for various impacts of climate change. By applying this method, the individual impacts of climate change on crop production and water resources were brought into the modeling effort on equal footing with cost values. The final cost impact estimate represents the total estimated cost of climate change in the agricultural sector. According to the results, this cost reaches EUR 25.08 million annually for the agricultural sector, and EUR 366.48 million for the whole country. Therefore, it is expected that in the seven-year programming period 2014–2020 the total cost of climate change on agriculture ranges from EUR 176 to EUR 2565 million. The most significant impacts are due to the increasing level of CO2 in the atmosphere and the burden of biodiversity and ecosystems. Full article
(This article belongs to the Special Issue Adaptation of Cyprus Agriculture to Climate Change)
Show Figures

Figure 1

23 pages, 4857 KiB  
Article
Climate Scenarios and Agricultural Indices: A Case Study for Switzerland
by Flavian Tschurr, Iris Feigenwinter, Andreas M. Fischer and Sven Kotlarski
Atmosphere 2020, 11(5), 535; https://doi.org/10.3390/atmos11050535 - 21 May 2020
Cited by 6 | Viewed by 3835
Abstract
The CH2018 Climate Scenarios for Switzerland are evaluated with respect to the representation of 24 indices with agricultural relevance. Furthermore, future projections of the considered indices until the end of the 21st century are analyzed for two greenhouse gas scenarios (Representative Concentrations Pathways [...] Read more.
The CH2018 Climate Scenarios for Switzerland are evaluated with respect to the representation of 24 indices with agricultural relevance. Furthermore, future projections of the considered indices until the end of the 21st century are analyzed for two greenhouse gas scenarios (Representative Concentrations Pathways RCP2.6 and RCP8.5). The validation reveals good results for indices that are based on one or two climate variables only and on simple temporal aggregations. Indices that involve multiple climate variables, complex temporal statistics or extreme conditions are less well represented. The climate projection analysis indicates an intensification of temperature-related extreme events such as heat waves. In general, climate change signals in the indices considered are subject to three main patterns: a horizontal pattern across Switzerland, a vertical pattern depending on elevation and a temporal pattern with an intensification of change in the course of the 21st century. Changes are in most cases more pronounced for the high-emission RCP8.5 scenario compared to the mitigation scenario RCP2.6. Overall, the projections indicate a challenging 21st century climate for the agricultural sector. Our findings furthermore show the value and the necessity of a robust validation of climate scenario products to enable trustworthy and valuable impact analyses, especially for more complex indices and models. Full article
(This article belongs to the Special Issue Climate Data for Agricultural Applications: Downscaling and Scenarios)
Show Figures

Figure 1

14 pages, 1717 KiB  
Article
Ozone Trends in the United Kingdom over the Last 30 Years
by Florencia M. R. Diaz, M. Anwar H. Khan, Beth M. A. Shallcross, Esther D. G. Shallcross, Ulrich Vogt and Dudley E. Shallcross
Atmosphere 2020, 11(5), 534; https://doi.org/10.3390/atmos11050534 - 21 May 2020
Cited by 19 | Viewed by 4283
Abstract
Previous work regarding the behaviour of ozone surface concentrations over many years in the United Kingdom had predicted that the frequency and severity of ozone episodes would become less marked in the future as a response to environmental regulations. The aim of this [...] Read more.
Previous work regarding the behaviour of ozone surface concentrations over many years in the United Kingdom had predicted that the frequency and severity of ozone episodes would become less marked in the future as a response to environmental regulations. The aim of this study is to extend these studies and compare the results with their predictions. The ozone data of 13 rural and six urban sites in the UK collected from the Department for Environment, Food and Rural Affairs over a period from 1992 to mid-2019 were used to investigate this behaviour. The yearly ozone exceedances (the number of hours that the ozone concentration exceeded the 50 ppbv limit) in the United Kingdom were found to have decreased over the last 30 years regardless of the type of site (rural or urban), showing that the adopted emission controls have so far been successful in the abatement of pollutant emissions. In the past three decades, the highest numbers of exceedances were reached in May regardless of the type of site. Furthermore, these episodes have become less frequent and less severe in recent years. In fact, the number of hours of exceedance is lower than that in previous decades, and it is almost constant throughout the week. Full article
(This article belongs to the Special Issue Ozone Evolution in the Past and Future)
Show Figures

Figure 1

12 pages, 2559 KiB  
Article
Mineral Dust and Iron Solubility: Effects of Composition, Particle Size, and Surface Area
by Aurelie R. Marcotte, Ariel D. Anbar, Brian J. Majestic and Pierre Herckes
Atmosphere 2020, 11(5), 533; https://doi.org/10.3390/atmos11050533 - 21 May 2020
Cited by 26 | Viewed by 4399
Abstract
There is significant iron deposition in the oceans, approximately 14–16 Tg annually from mineral dust aerosols, but only a small percentage (approx. 3%) of it is soluble and, thus, bioavailable. In this work, we examine the effect of mineralogy, particle size, and surface [...] Read more.
There is significant iron deposition in the oceans, approximately 14–16 Tg annually from mineral dust aerosols, but only a small percentage (approx. 3%) of it is soluble and, thus, bioavailable. In this work, we examine the effect of mineralogy, particle size, and surface area on iron solubility in pure mineral phases to simulate atmospheric processing of mineral dust aerosols during transport. Pure iron-bearing minerals common to Saharan dust were partitioned into four size fractions (10–2.5, 2.5–1, 1–0.5, and 0.5–0.25 µm) and extracted into moderately acidic (pH 4.3) and acidic (pH 1.7) leaching media to simulate mineral processing during atmospheric transport. Results show that, in general, pure iron-bearing clay materials present an iron solubility (% dissolved Fe/total Fe in the mineral) an order of magnitude higher than pure iron oxide minerals. The relative solubility of iron in clay particles does not depend on particle size for the ranges examined (0.25–10 μm), while iron in hematite and magnetite shows a trend of increasing solubility with decreasing particle size in the acidic leaching medium. Our results indicate that while mineralogy and aerosol pH have an effect on the solubilization of iron from simulated mineral dust particles, surface processes of the aerosol might also have a role in iron solubilization during transport. The surface area of clay minerals does not change significantly as a function of particle size (10–0.25 µm), while the surface area of iron oxides is strongly size dependent. Overall, these results show how mineralogy and particle size can influence iron solubility in atmospheric dust. Full article
(This article belongs to the Special Issue The Formation and Transformation of Atmospheric Soluble Iron)
Show Figures

Figure 1

24 pages, 8940 KiB  
Article
Investigation of the Successive Ozone Episodes in the El Paso–Juarez Region in the Summer of 2017
by Nakul N. Karle, Suhail Mahmud, Ricardo K. Sakai, Rosa M. Fitzgerald, Vernon R. Morris and William R. Stockwell
Atmosphere 2020, 11(5), 532; https://doi.org/10.3390/atmos11050532 - 21 May 2020
Cited by 14 | Viewed by 3253
Abstract
The adjacent cities of El Paso in Texas, USA, and Juarez in Mexico commonly experience pollution episodes, especially during the summer months. In the summer of 2017, successive high and low ozone episodes were observed. Aerosol backscattered data from a laser ceilometer was [...] Read more.
The adjacent cities of El Paso in Texas, USA, and Juarez in Mexico commonly experience pollution episodes, especially during the summer months. In the summer of 2017, successive high and low ozone episodes were observed. Aerosol backscattered data from a laser ceilometer was used to monitor and continuously measure the aerosol-layer characteristics. Meteorological parameters together with the aerosol layer height were used to determine the reason behind these successive high and low ozone events. In our research, both modelling and experimental data of the planetary boundary layer height (PBLH) were obtained and related to atmospheric stability. Aerosol backscatter data was used to investigate the structure, evolution, and influence of the top of the aerosol layer, which is a proxy for PBLHs. A shallow aerosol layer height (1164 ± 59 m) was observed during the high ozone episodes, in contrast to a deep aerosol layer (1990 ± 79 m) during the low ozone episodes. The ozone precursors, the ozone, and the ground-level aerosol concentrations were also examined during these episodes. It was observed that when the ozone was high, the PM2.5 was high, and when the ozone was low, the PM10 concentrations were high. Analysis of the wind patterns and synoptic scale meteorology also contributed to a better explanation of the nature of these events. Full article
(This article belongs to the Special Issue Atmospheric Aerosols in North America)
Show Figures

Figure 1

19 pages, 11498 KiB  
Review
Some Aspects of the Scattering of Light and Microwaves on Non-Spherical Raindrops
by Victor V. Sterlyadkin
Atmosphere 2020, 11(5), 531; https://doi.org/10.3390/atmos11050531 - 21 May 2020
Cited by 4 | Viewed by 2117
Abstract
A review of the author’s work on the study of the microphysics of rain is carried out. The effect of an anomalously high modulation of light scattered by oscillating drops of water, which consists in the formation of powerful pulses of light when [...] Read more.
A review of the author’s work on the study of the microphysics of rain is carried out. The effect of an anomalously high modulation of light scattered by oscillating drops of water, which consists in the formation of powerful pulses of light when illuminating an oscillating drop with continuous light and observation at scattering angles near a first-order rainbow, is described and explained. The anomalous scattering tracks obtained in the photographs provide information on the mass, average shape, mode, and amplitude of oscillations for each drop, by analogy with the Wilson camera. In field measurements, spatial selection of droplets by size was detected, when droplets of different sizes were grouped in different parts of space. The theoretical substantiation of the grouping of rain particles in space under the influence of wind gusts is carried out. It has been shown that the grouping and clustering of raindrops affects the relationship between radar reflectivity Z and rain intensity R. The influence of non-sphericity and oscillation of raindrops on the scattering of microwave radiation is studied. Polarization methods are proposed for enhancing or sharply reducing the contributions of the asphericity of raindrops to reflected radar signals. Full article
(This article belongs to the Special Issue Microphysics of Precipitation Particles: Raindrops, Hail, and Snow)
Show Figures

Figure 1

10 pages, 505 KiB  
Article
Field Survey on Concentration and Emission of Dust in Different Types of Poultry Houses of South Korea
by Ki Youn Kim and Han Jong Ko
Atmosphere 2020, 11(5), 530; https://doi.org/10.3390/atmos11050530 - 21 May 2020
Cited by 3 | Viewed by 2525
Abstract
The dust generated from poultry houses has an adverse effect on farmers and poultry in terms of hygiene and welfare problems. However, there is little information on concentration and emission of dust derived from poultry houses located in South Korea. An objective of [...] Read more.
The dust generated from poultry houses has an adverse effect on farmers and poultry in terms of hygiene and welfare problems. However, there is little information on concentration and emission of dust derived from poultry houses located in South Korea. An objective of this study is to provide fundamental data regarding particulate matters generated from the poultry houses situated in South Korea. A total 27 poultry houses, including nine broiler houses, nine layer houses, and nine layer houses with feces conveyors were surveyed. Dust was measured by gravimetric methods. Emission of dust was calculated by multiplying the mean concentration (mg/m3) measured at the center of the poultry house by the ventilation rate (m3 h−1). Mean indoor concentrations of total and respirable dust in poultry houses were 4.39 (SD: 2.38) mg/m3 and 2.33 (SD: 2.21) mg/m3, respectively. Mean emission rates based on area and rearing number were estimated as 3.04 (±1.64) mg head−1 h−1 and 57.48 (±24.66) mg m−2 h−1 for total dust and 2.34 (±1.27) mg head−1 h−1 and 26.80 (±10.81) mg m−2 h−1 for respirable dust, respectively. The distribution of total and respirable dust between indoor concentration and emission rate was a similar pattern, regardless of type of poultry house. Among types of poultry house, the broiler house showed the highest levels of indoor concentration and emission rate, followed by the layer house with feces conveyor belt, and the caged layer house. In terms of seasonal aspect, indoor concentrations of total and respirable dust were highest in winter and lowest in summer, and their emission rates were the opposite at all the poultry houses. In spring and autumn, both indoor concentration and emission rate were moderate, and there was no significant difference between spring and autumn. It was assumed that the levels of indoor concentration and emission rate of dust generated from poultry houses were determined mainly by use of bedding material and ventilation rate among various environmental agents. Full article
Show Figures

Figure 1

13 pages, 5242 KiB  
Article
Dynamics of Muddy Rain of 15 June 2018 in Nepal
by Ashok Kumar Pokharel, Tianli Xu, Xiaobo Liu and Binod Dawadi
Atmosphere 2020, 11(5), 529; https://doi.org/10.3390/atmos11050529 - 21 May 2020
Cited by 2 | Viewed by 3373
Abstract
It has been revealed from the Modern-Era Retrospective analysis for Research and Applications MERRA analyses, Moderate Resolution Imaging Spectroradiometer MODIS/Terra satellite imageries, Naval Aerosol Analysis and Prediction System NAAPS model outputs, Cloud –Aerosol Lidar and Infrared Pathfinder Satellite Observations CALIPSO imageries, Hybrid Single [...] Read more.
It has been revealed from the Modern-Era Retrospective analysis for Research and Applications MERRA analyses, Moderate Resolution Imaging Spectroradiometer MODIS/Terra satellite imageries, Naval Aerosol Analysis and Prediction System NAAPS model outputs, Cloud –Aerosol Lidar and Infrared Pathfinder Satellite Observations CALIPSO imageries, Hybrid Single Particle Lagrangian Integrated Trajectory HYSPLIT model trajectories, atmospheric soundings, and observational records of dust emission that there were multiple dust storms in the far western parts of India from 12 to 15 June 2018 due to thunderstorms. This led to the lifting of the dust from the surface. The entry of dust into the upper air was caused by the generation of a significant amount of turbulent kinetic energy as a function of strong wind shear generated by the negative buoyancy of the cooled air aloft and the convective buoyancy in the lower planetary boundary layer. Elevated dust reached a significant vertical height and was advected towards the northern/northwestern/northeastern parts of India. In the meantime, this dust was carried by northwesterly winds associated with the jets in the upper level, which advected dust towards the skies over Nepal where rainfall was occurring at that time. Consequently, this led to the muddy rain in Nepal. Full article
(This article belongs to the Section Meteorology)
Show Figures

Figure 1

19 pages, 3395 KiB  
Article
Transcriptomics of Mature Rice (Oryza Sativa L. Koshihikari) Seed under Hot Conditions by DNA Microarray Analyses
by Ranjith Kumar Bakku, Randeep Rakwal, Junko Shibato, Kyoungwon Cho, Soshi Kikuchi, Masami Yonekura, Abhijit Sarkar, Seiji Shioda and Ganesh Kumar Agrawal
Atmosphere 2020, 11(5), 528; https://doi.org/10.3390/atmos11050528 - 20 May 2020
Cited by 6 | Viewed by 3301
Abstract
Higher temperature conditions during the final stages of rice seed development (seed filling and maturation) are known to cause damage to both rice yield and rice kernel quality. The western and central parts of Japan especially have seen record high temperatures during the [...] Read more.
Higher temperature conditions during the final stages of rice seed development (seed filling and maturation) are known to cause damage to both rice yield and rice kernel quality. The western and central parts of Japan especially have seen record high temperatures during the past decade, resulting in the decrease of rice kernel quality. In this study, we looked at the rice harvested from a town in the central Kanto-plains (Japan) in 2010. The daytime temperatures were above the critical limits ranging from 34 to 38 °C at the final stages of seed development and maturity allowing us to investigate high-temperature effects in the actual field condition. Three sets of dry mature rice seeds (commercial), each with specific quality standards, were obtained from Japan Agriculture (JA Zen-Noh) branch in Ami-town of Ibaraki Prefecture in September 2010: grade 1 (top quality, labeled as Y1), grade 2 (medium quality, labeled as Y2), and grade 3 (out-of-grade or low quality, labeled as Y3). The research objective was to examine particular alterations in genome-wide gene expression in grade 2 (Y2) and grade 3 (Y3) seeds compared to grade 1 (Y1). We followed the high-temperature spike using a high-throughput omics-approach DNA microarray (Agilent 4 × 44 K rice oligo DNA chip) in conjunction with MapMan bioinformatics analysis. As expected, rice seed quality analysis revealed low quality in Y3 > Y2 over Y1 in taste, amylose, protein, and fatty acid degree, but not in water content. Differentially expressed gene (DEG) analysis from the transcriptomic profiling data revealed that there are more than one hundred upregulated (124 and 373) and downregulated (106 and 129) genes in Y2 (grade 2 rice seed) and Y3 (grade 3 rice seed), respectively. Bioinformatic analysis of DEGs selected as highly regulated differentially expressed (HRDE) genes revealed changes in function of genes related to metabolism, defense/stress response, fatty acid biosynthesis, and hormones. This research provides, for the first time, the seed transcriptome profile for the classified low grades (grade 2, and out-of-grade; i.e., grade 3) of rice under high-temperature stress condition. Full article
(This article belongs to the Special Issue Plant Adaptation to Global Climate Change)
Show Figures

Figure 1

21 pages, 2009 KiB  
Article
Microbial Community Composition Analysis in Spring Aerosols at Urban and Remote Sites over the Tibetan Plateau
by Prakriti Sharma Ghimire, Shichang Kang, Wasim Sajjad, Barkat Ali, Lekhendra Tripathee and Pengfei Chen
Atmosphere 2020, 11(5), 527; https://doi.org/10.3390/atmos11050527 - 20 May 2020
Cited by 4 | Viewed by 3277
Abstract
This study presents features of airborne culturable bacteria and fungi from three different sites (Lanzhou; LZ; 1520 m ASL, Lhasa; LS; 3640 m ASL and Qomolangma; ZF; 4276 m ASL) representing urban (LZ and LS) and remote sites (ZF) over the Tibetan Plateau [...] Read more.
This study presents features of airborne culturable bacteria and fungi from three different sites (Lanzhou; LZ; 1520 m ASL, Lhasa; LS; 3640 m ASL and Qomolangma; ZF; 4276 m ASL) representing urban (LZ and LS) and remote sites (ZF) over the Tibetan Plateau (TP). Total suspended particle (TSP) samples were collected with an air sampler (Laoying 2030, China) on a quartz filter. Community structures of bacteria and fungi were studied and compared among three different locations. The average levels of bacterial load in the outdoor air ranged from approximately 8.03 × 101 to 3.25 × 10² CFU m–3 (Colony forming unit per m3). However, the average levels of fungal loads ranged from approximately 3.88 × 100 to 1.55 × 101 CFU m−3. Bacterial load was one magnitude higher at urban sites LZ (2.06 × 10²–3.25 × 10² CFU m−3) and LS (1.96 × 10²–3.23 × 10² CFU m−3) compared to remote sites ZF (8.03 × 101–9.54 × 101 CFU m−3). Similarly, the maximum fungal load was observed in LZ (1.02 × 101–1.55 × 101 CFU m−3) followed by LS (1.03 × 101–1.49 × 101 CFU m−3) and ZF (3.88 × 100–6.26 × 100 CFU m−3). However, the maximum microbial concentration was observed on the same day of the month, corresponding to a high dust storm in Lanzhou during the sampling period. The reported isolates were identified by phylogenetic analysis of 16S rRNA genes for bacteria and ITS sequences for fungi amplified from directly extracted DNA. Bacterial isolates were mostly associated with Proteobacteria, Eurotiomycetes and Bacillus, whereas fungal isolates were mostly Aspergillus and Alternaria. Overall, this is a pioneer study that provides information about the airborne microbial concentration and composition of three sites over the TP region depending on environmental parameters. This study provided preliminary insight to carry out more advanced and targeted analyses of bioaerosol in the sites presented in the study. Full article
Show Figures

Figure 1

12 pages, 5958 KiB  
Article
Seasonal Asian Dust Forecasting Using GloSea5-ADAM
by Sang-Boom Ryoo, Yun-Kyu Lim and Young-San Park
Atmosphere 2020, 11(5), 526; https://doi.org/10.3390/atmos11050526 - 20 May 2020
Cited by 4 | Viewed by 2427
Abstract
The springtime dust events in Northeast Asia pose many economic, social, and health-related risks. Statistical models in the forecasting of seasonal dust events do not fully account for environmental variations in dust sources due to climate change. The Korea Meteorological Administration (KMA) recently [...] Read more.
The springtime dust events in Northeast Asia pose many economic, social, and health-related risks. Statistical models in the forecasting of seasonal dust events do not fully account for environmental variations in dust sources due to climate change. The Korea Meteorological Administration (KMA) recently developed the GloSea5-ADAM, a numerically based seasonal dust forecasting model, by incorporating the Asian Dust and Aerosol Model (ADAM)’s emission algorithm into Global Seasonal Forecasting Model version 5 (GloSea5). The performance of GloSea5 and GloSea5-ADAM in forecasting seasonal Asian dust events in source (China) and leeward (South Korea) regions was compared. The GloSea5-ADAM solved the limitations of GloSea5, which were mainly attributable to GloSea5′s low bare-soil fraction, and successfully simulated 2017 springtime dust emissions over Northeast Asia. The results show that GloSea5-ADAM’s 2017 and 2018 forecasts were consistent with surface PM10 mass concentrations observed in China and South Korea, while there was a large gap in 2019. This study shows that the geographical distribution and physical properties of soil in dust source regions are important. The GloSea5-ADAM model is only a temporary solution and is limited in its applicability to Northeast Asia; therefore, a globally applicable dust emission algorithm that considers a wide variety of soil properties must be developed. Full article
(This article belongs to the Section Atmospheric Techniques, Instruments, and Modeling)
Show Figures

Figure 1

23 pages, 1121 KiB  
Article
SSH-Aerosol v1.1: A Modular Box Model to Simulate the Evolution of Primary and Secondary Aerosols
by Karine Sartelet, Florian Couvidat, Zhizhao Wang, Cédric Flageul and Youngseob Kim
Atmosphere 2020, 11(5), 525; https://doi.org/10.3390/atmos11050525 - 20 May 2020
Cited by 18 | Viewed by 4621
Abstract
Particles are emitted by different sources and are also formed in the atmosphere. Despite the large impact of atmospheric particles on health and climate, large uncertainties remain concerning their representation in models. To reduce these uncertainties as much as possible, a representation of [...] Read more.
Particles are emitted by different sources and are also formed in the atmosphere. Despite the large impact of atmospheric particles on health and climate, large uncertainties remain concerning their representation in models. To reduce these uncertainties as much as possible, a representation of the main processes involved in aerosol dynamics and chemistry is necessary. For that purpose, SSH-aerosol was developed to represent the evolution of the mass and number concentrations of primary and secondary particles, across different scales, using state-of-the-art modules, taking into account processes that are usually not considered in air-quality or climate modelling. For example, the particle mixing state and the growth of ultra-fine particles are taken into account in the aerosol dynamics, the affinity of semi-volatile organic compounds with water and viscosity are taken into account in the partitioning between the gas and particle phases of organics and the formation of extremely low-volatility organic compounds from biogenic precursors is represented. SSH-aerosol is modular and can be used with different levels of complexity. It may be used as standalone to analyse chamber measurements. It is also designed to be easily coupled to 3D models, adapting the level of complexity to the spatial scale studied. Full article
(This article belongs to the Special Issue Atmospheric Modeling Study)
Show Figures

Figure 1

12 pages, 5162 KiB  
Article
The Record-Breaking High Temperature over Europe in June of 2019
by Wei Zhao, Ningfang Zhou and Shangfeng Chen
Atmosphere 2020, 11(5), 524; https://doi.org/10.3390/atmos11050524 - 20 May 2020
Cited by 11 | Viewed by 2902
Abstract
Observational and reanalysis data show that the surface air temperature (SAT) over most parts of Europe in June of 2019 broke the highest temperature on record. In this study, we investigate the factors for the formation of this record-breaking high temperature over Europe, [...] Read more.
Observational and reanalysis data show that the surface air temperature (SAT) over most parts of Europe in June of 2019 broke the highest temperature on record. In this study, we investigate the factors for the formation of this record-breaking high temperature over Europe, focusing on the role of atmospheric circulation anomalies. A strong anomalous anticyclone appeared over Europe, with a quasi-barotropic vertical structure. On one hand, the downward motion anomalies associated with this anomalous anticyclone led to less cloud cover and an increase in downward shortwave radiation, which contributed to the SAT warming over Europe. On the other hand, southerly wind anomalies to the west side of the anomalous anticyclone also resulted in SAT warming via carrying warmer and wetter air northward from lower latitudes. The formation of the anticyclonic anomaly over Europe in June of 2019 was closely related to an atmospheric wave train propagating eastward from the mid-high latitudes of the North Atlantic to Eurasia. The atmospheric wave train over the North Atlantic–Eurasia region is suggested to be mainly related to the Atlantic–Eurasia teleconnection pattern. Further analysis indicates that a decrease in the local soil moisture over Europe may also have escalated the surface temperature warming through a positive land–atmosphere feedback. Full article
Show Figures

Figure 1

13 pages, 2483 KiB  
Article
Nanoparticle Number Concentration in the Air in Relation to the Time of the Year and Time of the Day
by Jáchym Brzezina, Klaudia Köbölová and Vladimír Adamec
Atmosphere 2020, 11(5), 523; https://doi.org/10.3390/atmos11050523 - 19 May 2020
Cited by 5 | Viewed by 2615
Abstract
The paper analyzes suspended particles number concentrations of 61 size fractions (184 nm to 17,165 nm) in the air at a traffic location. The average course of the individual fractions was analyzed at various intervals – daily, weekly, monthly and annually, in the [...] Read more.
The paper analyzes suspended particles number concentrations of 61 size fractions (184 nm to 17,165 nm) in the air at a traffic location. The average course of the individual fractions was analyzed at various intervals – daily, weekly, monthly and annually, in the period between 2017 and 2019. The data was then used to calculate the arithmetic mean for all the fractions (MS Excel, R) and then using a proprietary web application, heatmaps were constructed. The obtained results showed significant differences in both the annual and daily variation of number concentrations between the individual fractions differing in particle size. In the case of the annual variation, one can see a greater variability of smaller particles, which is most likely due to the source of the actual suspended particles. Meteorological and dispersion conditions are found as important factors for suspended particle concentrations. These can lead to significant differences from year to year. However, a comparison between 2018 and 2019 showed that even though the average absolute number concentrations can differ between years, the actual relative number concentrations, i.e., the ratios between the individual fractions remain very similar. In conclusion it can be said that the difference between the number concentration variation of the size fractions depends on both the actual pollution sources (especially in the long-term, i.e., the annual variation) and the actual size of the particles, which plays a role especially in the short-term (daily, weekly variation). Full article
(This article belongs to the Special Issue Ambient Air Quality in the Czech Republic)
Show Figures

Figure 1

28 pages, 11766 KiB  
Article
Air Pollution Sources’ Contribution to PM2.5 Concentration in the Northeastern Part of the Czech Republic
by Radim Seibert, Irina Nikolova, Vladimíra Volná, Blanka Krejčí and Daniel Hladký
Atmosphere 2020, 11(5), 522; https://doi.org/10.3390/atmos11050522 - 19 May 2020
Cited by 25 | Viewed by 3357
Abstract
This article focuses on the source apportionment of air pollution in a specific northeastern part of the Czech Republic. The research area, located around the city of Třinec, is significantly affected by a complex spectrum of air pollution sources, including local residential heating [...] Read more.
This article focuses on the source apportionment of air pollution in a specific northeastern part of the Czech Republic. The research area, located around the city of Třinec, is significantly affected by a complex spectrum of air pollution sources, including local residential heating (coal and wood burning), heavy industry (mainly iron and steel production), road traffic, and regional and long-range air pollution transport from the nearby cities, Poland, and other countries. The main pollution sources contributing to the total concentration of fine suspended particles (PM2.5) were evaluated on the basis of the measurements at three sites and on subsequent positive matrix factorization modeling. The six major air pollution factors were identified, and their relative and absolute contributions were quantified. The result of the study is that the most important current task of air protection is to reduce the residential emissions from solid fuels, which are responsible for approximately 50–60% of PM2.5 concentration, followed by the regional primary and secondary aerosol sources (up to 40% of the total PM2.5 aerosol mass). Lower contributions have been identified in the case of resuspended mineral and biogenic particles (15–20%), long-range (trans-European) air pollution transport (up to 10%), and heavy industry (up to 10% in the most affected location). A detailed discussion has been provided considering specific regional EC (elemental carbon)–OC (organic carbon) relations in the region with traditional coal-burning for household heating which complicate the interpretation of the PMF (Positive Matrix Factorization) results, especially due to the interference between the traffic, residential heating, and biogenic aerosol factors. Full article
(This article belongs to the Special Issue Ambient Air Quality in the Czech Republic)
Show Figures

Figure 1

21 pages, 6529 KiB  
Article
Tidal Wave-Driven Variability in the Mars Ionosphere-Thermosphere System
by Scott A. Thaller, Laila Andersson, Marcin Dominik Pilinski, Edward Thiemann, Paul Withers, Meredith Elrod, Xiaohua Fang, Francisco González-Galindo, Stephen Bougher and Geoffrey Jenkins
Atmosphere 2020, 11(5), 521; https://doi.org/10.3390/atmos11050521 - 19 May 2020
Cited by 15 | Viewed by 2975
Abstract
In order to further evaluate the behavior of ionospheric variations at Mars, we investigate the Martian ionosphere-thermosphere (IT) perturbations associated with non-migrating thermal tides using over four years of Mars Atmosphere and Volatile Evolution (MAVEN) in situ measurements of the IT electron and [...] Read more.
In order to further evaluate the behavior of ionospheric variations at Mars, we investigate the Martian ionosphere-thermosphere (IT) perturbations associated with non-migrating thermal tides using over four years of Mars Atmosphere and Volatile Evolution (MAVEN) in situ measurements of the IT electron and neutral densities. The results are consistent with those of previous studies, namely strong correlation between the tidal perturbations in electron and neutral densities on the dayside at altitudes ~150–185 km, as expected from photochemical theory. In addition, there are intervals during which this correlation extends to higher altitudes, up to ~270 km, where diffusive transport of plasma plays a dominant role over photochemical processes. This is significant because at these altitudes the thermosphere and ionosphere are only weakly coupled through collisions. The identified non-migrating tidal wave variations in the neutral thermosphere are predominantly wave-1, wave-2, and wave-3. Wave-1 is often the dominant wavenumber for electron density tidal variations, particularly at high altitudes over crustal fields. The Mars Climate Database (MCD) neutral densities (below 300 km along the MAVEN orbit) shows clear tidal variations which are predominantly wave-2 and wave-3, and have similar wave amplitudes to those observed. Full article
(This article belongs to the Special Issue Observations and Measurements of the Martian Atmosphere)
Show Figures

Figure 1

18 pages, 5483 KiB  
Article
WRF-Chem Simulation of Winter Visibility in Jiangsu, China, and the Application of a Neural Network Algorithm
by Peishu Zong, Yali Zhu, Huijun Wang and Duanyang Liu
Atmosphere 2020, 11(5), 520; https://doi.org/10.3390/atmos11050520 - 18 May 2020
Cited by 7 | Viewed by 4385
Abstract
In this paper, the winter visibility in Jiangsu Province is simulated by WRF-Chem (Weather Research and Forecasting (WRF) model coupled with Chemistry) with high spatiotemporal resolutions. Simulation results show that WRF-Chem has good capability to simulate the visibility and related local meteorological elements [...] Read more.
In this paper, the winter visibility in Jiangsu Province is simulated by WRF-Chem (Weather Research and Forecasting (WRF) model coupled with Chemistry) with high spatiotemporal resolutions. Simulation results show that WRF-Chem has good capability to simulate the visibility and related local meteorological elements and air pollutants in Jiangsu in the winters of 2013–2017. For visibility inversion, this study adopts the neural network algorithm. Meteorological elements, including wind speed, humidity and temperature, are introduced to improve the performance of WRF-Chem relative to the visibility inversion scheme, which is based on the Interagency Monitoring of Protected Visual Environments (IMPROVE) extinction coefficient algorithm. The neural network offers a noticeable improvement relative to the inversion scheme of the IMPROVE visibility extinction coefficient, substantially improving the underestimation of winter visibility in Jiangsu Province. For instance, the correlation coefficient increased from 0.17 to 0.42, and root mean square error decreased from 2.62 to 1.76. The visibility inversion results under different humidity and wind speed levels show that the underestimation of the visibility using the IMPROVE scheme is especially remarkable. However, the underestimation issue is essentially solved using the neural network algorithm. This study serves as a basis for further predicting winter haze events in Jiangsu Province using WRF-Chem and deep-learning methods. Full article
Show Figures

Figure 1

Previous Issue
Next Issue
Back to TopTop