Article

NOx Emission Reduction and Recovery during COVID-19 in East China

1
School of Earth and Atmospheric Sciences, Georgia Institute of Technology, Atlanta, GA 30332, USA
2
ClimaCell Inc., 280 Summer Street Floor 8, Boston, MA 02210, USA
3
School of Engineering, Westlake University, Hangzhou 310024, China
4
Institute of Advanced Technology, Westlake Institute for Advanced Study, Hangzhou 310024, China
5
School of Engineering and Applied Sciences, Harvard University, Cambridge, MA 02138, USA
6
Department of Atmospheric and Oceanic Sciences, School of Physics, Peking University, Beijing 100871, China
7
School of Environmental Science and Engineering, Southern University of Science and Technology, Shenzhen 518055, China
*
Authors to whom correspondence should be addressed.
Atmosphere 2020, 11(4), 433; https://doi.org/10.3390/atmos11040433
Submission received: 8 April 2020 / Revised: 20 April 2020 / Accepted: 21 April 2020 / Published: 24 April 2020
(This article belongs to the Special Issue Asian/Pacific Air Pollution and Environment)

Abstract

:
Since its first confirmed case at the end of 2019, COVID-19 has become a global pandemic in three months with more than 1.4 million confirmed cases worldwide, as of early April 2020. Quantifying the changes of pollutant emissions due to COVID-19 and associated governmental control measures is crucial to understand its impacts on economy, air pollution, and society. We used the WRF-GC model and the tropospheric NO2 column observations retrieved by the TROPOMI instrument to derive the top-down NOx emission change estimation between the three periods: P1 (January 1st to January 22nd, 2020), P2 (January 23rd, Wuhan lockdown, to February 9th, 2020), and P3 (February 10th, back-to-work day, to March 12th, 2020). We found that NOx emissions in East China averaged during P2 decreased by 50% compared to those averaged during P1. The NOx emissions averaged during P3 increased by 26% compared to those during P2. Most provinces in East China gradually regained some of their NOx emissions after February 10, the official back-to-work day, but NOx emissions in most provinces have not yet to return to their previous levels in early January. NOx emissions in Wuhan, the first epicenter of COVID-19, had no sign of emission recovering by March 12. A few provinces, such as Zhejiang and Shanxi, have recovered fast, with their averaged NOx emissions during P3 almost back to pre-lockdown levels.

Graphical Abstract

1. Introduction

The recent outbreak of Coronavirus Disease 2019 (COVID-19) became a global pandemic impacting over 200 countries with over 1.4 million confirmed cases and 80,000 deaths [1]. Countries around the globe have enacted control measures including social distancing, stay-at-home orders, closing non-essential businesses, and regional lockdown. As the first country fighting COVID-19, China imposed provincial lockdown in Hubei and enforced outdoor restrictions nationwide, resulting in greatly suppressed human activities [2]. The first COVID-19 cases were reported as unknown pneumonia cases in Wuhan, capital of Hubei, in December 2019. With increasing confirmed cases, the government of Wuhan and other cities of Hubei announced lockdown on January 23rd and 24th, 2020, respectively, followed by other provinces [2,3]. Non-essential businesses had been closed since then. Most provincial governments allowed non-essential businesses to resume work after February 10th [4], while non-essential businesses in Wuhan remained closed until March 20th [5].
The reduced human activities would lead to decreasing anthropogenic pollutant emissions and decreasing pollutant levels. Quantifying these pollutant emission changes is crucial to future air quality and climate change studies.
Nitrogen oxides (NOx = NO + NO2) is an excellent tracer of human activity as NOx is primarily emitted as NO from anthropogenic combustion sources, including transportation, powerplants, industries, and residential combustion [6,7]. Natural sources of NOx include soil, lightning, and wildfire [7,8,9,10,11,12,13,14,15,16,17]. NO2 is primarily produced from the oxidation of NO, which is produced from atmospheric nitrogen and oxygen at high temperatures [7,11,17]. NOx is a major precursor of particulate matter and ozone [17]. NO2 can cause respiratory diseases and is also detrimental to the ecosystems through the formation of nitric acid and acid rain [11,13]. Satellite retrievals have been widely used to detect NO2 changes [7,11,13,16,17,18]. The recently launched Tropospheric Monitoring Instrument (TROPOMI) has revealed that tropospheric NO2 concentration dropped sharply after Wuhan lockdown [19]. However, the NO2 concentration changes could result from changes of either emissions or meteorology, or both. Therefore, NO2 concentration changes are not equivalent to the emission changes and are not good measures of human activities [7,17].
In this study, we presented the first estimation of NOx emission changes corresponding to the COVID-19 lockdown in China using a top-down approach [7,10,11,12,14,15,18,20] with TROPOMI NO2 retrievals and WRF-GC simulations.

2. Methods

We used a 3-D regional meteorology-chemistry model, WRF-GC (Section 2.2), to derive the top-down NOx emissions (Section 2.3) using TROPOMI tropospheric NO2 vertical column densities (VCDs) (Section 2.1). The model simulated NO2 under normal circumstance without the impact of COVID-19 on emissions, covering the period from January 1st to March 12th, 2020 with a two-week spin-up beforehand. To better illustrate the NOx emission changes according to governmental intervention, we grouped it into three periods in this analysis: P1 (January 1st to January 22nd, before Wuhan lockdown), P2 (January 23rd to February 9th, lockdown and restrictions on activities), and P3 (February 10th to March 12th, after the official back-to-work day). Socioeconomic activities during P1 were least affected by COVID-19 control measures, while the ones during P2 were most affected. Non-essential businesses could resume work in most regions other than Wuhan during P3, and socioeconomic activities during P3 were considered less impacted compared to those during P2 [4,5].

2.1. KNMI TROPOMI NO2 Data
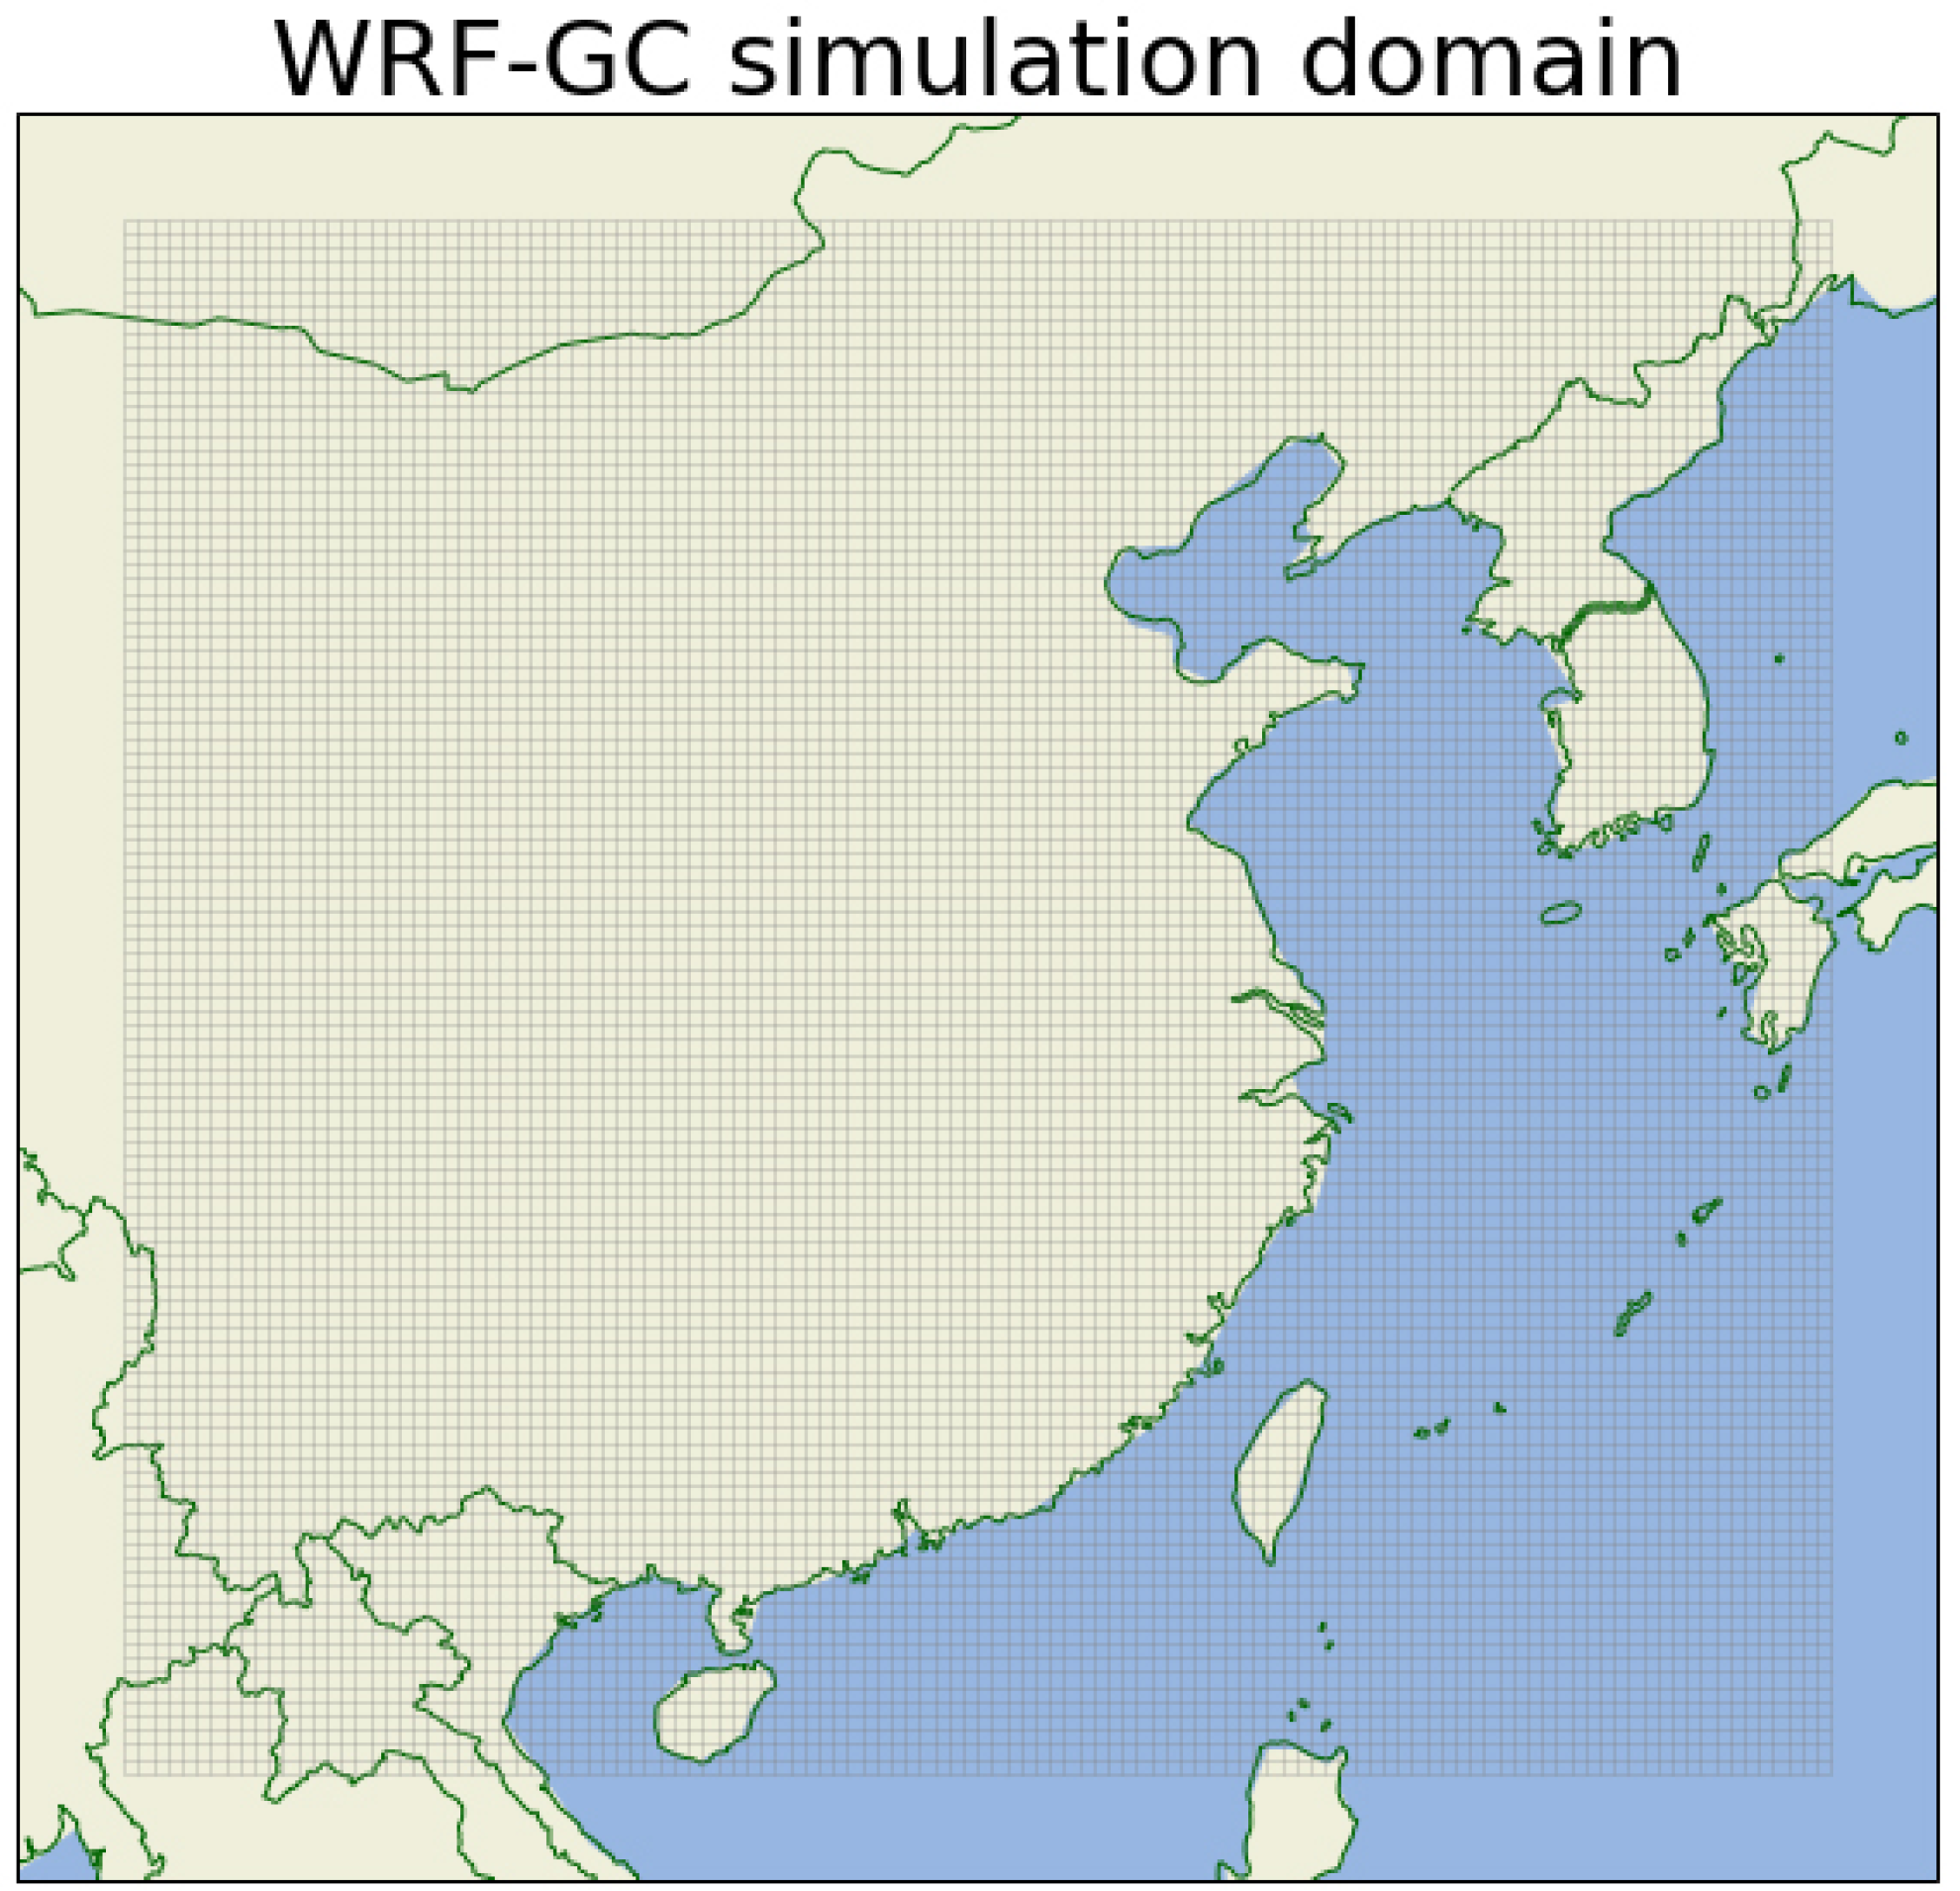
TROPOMI [21] is on board Europe Space Agency’s Sentinel-5p satellite, which was launched in October 2017. TROPOMI overpasses the equator at around 13:30 local time (LT) with a sun-synchronous polar orbit [22]. TROPOMI achieves global coverage in one day and has a spatial resolution of 7.2 × 3.6 km2 at nadir, greatly surpassing its predecessors, such as the Ozone Monitoring Instrument (OMI, 13 × 24 km2) and the Global Ozone Monitoring Experiment-2 (GOME-2, 40 × 40 km2). Although OMI is often used in NO2 studies, it suffers from row anomalies [7,23] and has poor coverage compared to the newly deployed TROPOMI.
The Royal Dutch Meteorological Institute (KNMI) TM5-MP-DOMINO NO2 retrieval algorithm employs the differential optical absorption spectroscopy (DOAS) to derive NO2 slant column densities (SCDs) using visible wavelengths between 400 and 496 nm [22,24]. The tropospheric portion of total SCDs are then separated and converted to tropospheric vertical column densities (VCDs) using air mass factors (AMFs), which are calculated by the Doubling-Adding KNMI (DAK) radiative transfer model (v3.2) with a priori NO2 profiles from a chemistry transport model (CTM) TM5-MP [22].
In this study, we used the offline TROPOMI NO2 retrieval (version 1.03.02). Compared to its near-real-time (NRT) counterpart, the offline retrieval uses the TM5-MP CTM analysis, instead of TM5-MP CTM forecasts to calculate AMFs [22].
For quality assurance, we only used the level-2 swath data with overall quality flag (qa_value) > 0.5, which filtered out errors and problematic retrievals [22]. The overall uncertainty of tropospheric NO2 VCDs was estimated to be approximately 0.5 × 10¹⁵ molecules/cm2 in systematic bias plus a 20–50% relative random error [22]. For detailed discussions on the uncertainties, we would refer readers to previous studies [22,24,25,26]. The TM5-MP-DOMINO NO2 retrieval algorithm implicitly accounts for the impacts of aerosols on retrieval, whereas the other TROPOMI NO2 retrieval product, POMINO-TROPOMI [27], explicitly models aerosols in the retrieval algorithm. The implicit aerosol corrections in TM5-MP-DOMINO NO2 retrieval algorithm might lead to ~25% of the underestimations over the Northern East China region [27,28]. As the focus of our analysis is on the relative changes of regional averages, such uncertainties would not change our conclusions.

2.2. WRF-GC Model

WRF-GC (v1.0, wrf.geos-chem.org) is an open source regional air quality model [29] that couples the Weather Research and Forecasting (WRF v3.9.1.1 [30]) mesoscale meteorological model and the GEOS-Chem atmospheric chemistry model (v12.2.1 [31]). The original GEOS-Chem model is driven by the offline meteorological data from Goddard Earth Observation System (GEOS) of the NASA Global Modeling and Assimilation Office (GMAO), whereas WRF-GC simulates meteorological conditions online using the latest meteorological data as boundary conditions. Comparisons with surface observations show that WRF-GC simulations were able to reproduce the observed meteorological conditions and PM2.5 concentrations over East China in winter [29].
The WRF-GC simulation in this study was configured with a horizontal resolution of 27 × 27 km2 and 50 hybrid sigma-eta vertical levels spanning from surface up to 10 hPa. The simulation domain covered most of East Asia (Figure A1 in the Appendix) with a Mercator projection. The WRF-GC simulation was driven by analysis data from the National Centers for Environmental Prediction Global Forecast System (NCEP GFS [32]), which has a spatial resolution of 0.5° × 0.5°.
Initial and boundary conditions of chemical species to drive WRF-GC were taken from an original GEOS-Chem global simulations at 2° × 2.5° resolution. WRF-GC used the most updated full Ox-NOx-VOC-halogen-aerosol chemistry from GEOS-Chem v12.2.1. The emission inventories used in the simulation are Multiresolution Emission Inventory for China (MEIC, monthly) for year 2017 in mainland China and MIX emission inventory for year 2010 elsewhere in East Asia [6,33]. WRF-GC also included biogenic emissions [34]. The soil NOx emissions [35], biomass burning NOx emissions, and meteorology-driven lightning NOx emissions are turned off. As these NOx emission sources are not active during the study period in East China and they are implicitly accounted for in the top-down emission estimation (Section 2.3), these settings would have negligible effects on this analysis [11].
For detailed descriptions and validation of WRF-GC or GEOS-Chem, we refer readers to Lin et al. (2020) [29].

2.3. Top-Down NOx Emission Estimate

To make a fair comparison between TROPOMI NO2 retrievals and WRF-GC NO2 simulations, we calculated WRF-GC simulated tropospheric NO2 VCDs using TROIPOMI averaging kernels [22]. First, we calculated WRF-GC simulated NO2 VCDs at individual pressure level (i.e., partial VCDs) using the simulated NO2 mixing ratios and pressure levels at TROPOMI overpassing time. We then interpolated the partial VCDs to match the pressure levels of TM5-MP with mass conservation from coincident TROPOMI retrievals. Finally, we applied the tropospheric averaging kernels from TROPOMI retrievals to the interpolated partial VCDs to derive the WRF-GC simulated tropospheric NO2 VCDs. We would refer such derived NO2 VCDs as NO2WRF-GC and the TROPOMI retrieved tropospheric NO2 VCDs as NO2TROPOMI. We only used WRF-GC simulations spatially and temporally coincident with valid TROPOMI retrievals (qa_value > 0.5).
To align the spatial resolution of both products, we oversampled both NO2TROPOMI and NO2WRF-GC at a resolution of 0.01° × 0.01°, taking the shapes of satellite pixels and model grids into consideration. The distributions of NO2TROPOMI are shown and discussed in Section 3.1.
We derived the top-down NOx emissions using the following equation [8,10,11,12,14,15,17,18].
Top-down Emission = NO2TROPOMI/NO2WRF-GC × Bottom-up Emission (MEIC)
The main sinks of NOx during daytime in winter and spring are N2O5 hydrolysis and oxidation by HOx radicals, which are produced by photolytic reactions [36,37]. Due to the weak sunlight during this time of year, NOx lifetime is about 21–29 hours [36,37], much longer than its lifetime of several hours during summer. On the other hand, the night-time lifetime is around 6 hours [36]. NOx can be advected as far as a few hundred kilometers with its longer lifetime during winter.
We estimated the top-down emissions on a provincial basis rather than grid by grid. The Chinese province-level administrations covered by the model domain include Anhui, Beijing, Chongqing, Fujian, Guangdong, Guangxi, Guizhou, Hebei, Henan, Hubei, Hunan, Jiangsu, Jiangxi, Jilin, Liaoning, Ningxia, Shaanxi, Shandong, Shanghai, Shanxi, Sichuan, Tianjin, Yunnan, and Zhejiang. Additionally, we analyzed the cities of Wuhan (Hubei Province), Changsha (Hunan Province), Guangzhou (Guangdong Province), as well as the whole of East China. We calculated the averages of NO2TROPOMI and NO2WRF-GC in each region, respectively, and applied Equation (1) to calculate top-down NOx emission estimates. To reduce sampling bias, we excluded data if less than 70% area of the region is observed by TROPOMI (please refer to the bottom panels of the regional figures in the Supplement Files). The top-down emission estimates are shown in Section 3.2, and we discussed in detail the top-down emissions of eight regions in Section 3.3.
We also filtered out daily top-down emissions beyond 4 sigma levels of all-time averages to exclude extreme events. This results in exclusion of one data point in Guizhou, Henan, Hubei, Jiangxi, Jilin, Ningxia, Sichuan, and Wuhan, respectively (please refer to the bottom panels of the regional figures in the Supplement Files). The NO2TROPOMI, NO2WRF-GC, and MEIC NOx emission data used in this study are available in the Supplementary Materials.

3. Results

The daily top-down emissions at regional levels are subject to large day-to-day variations, which may result from real signals, random error, or uncertainties. To better illustrate the changes of top-down emissions, we grouped the data into three periods: P1 (January 1st to January 23rd, 2020), P2 (January 24th to February 9th, 2020), and P3 (February 10th to March 12th, 2020). Note that our conclusions are not sensitive to small changes in the selection of the periods. We presented the analysis of period-averaged data in Section 3.1 and Section 3.2. We also investigated on the time series of top-down NOx emissions in typical regions in Section 3.3. The complete data for each region, including NO2TROPOMI, top-down emissions, and bottom-up emissions from MEIC, are included in Table S1 (Table_S1.xlsx in the Supplementary Materials).

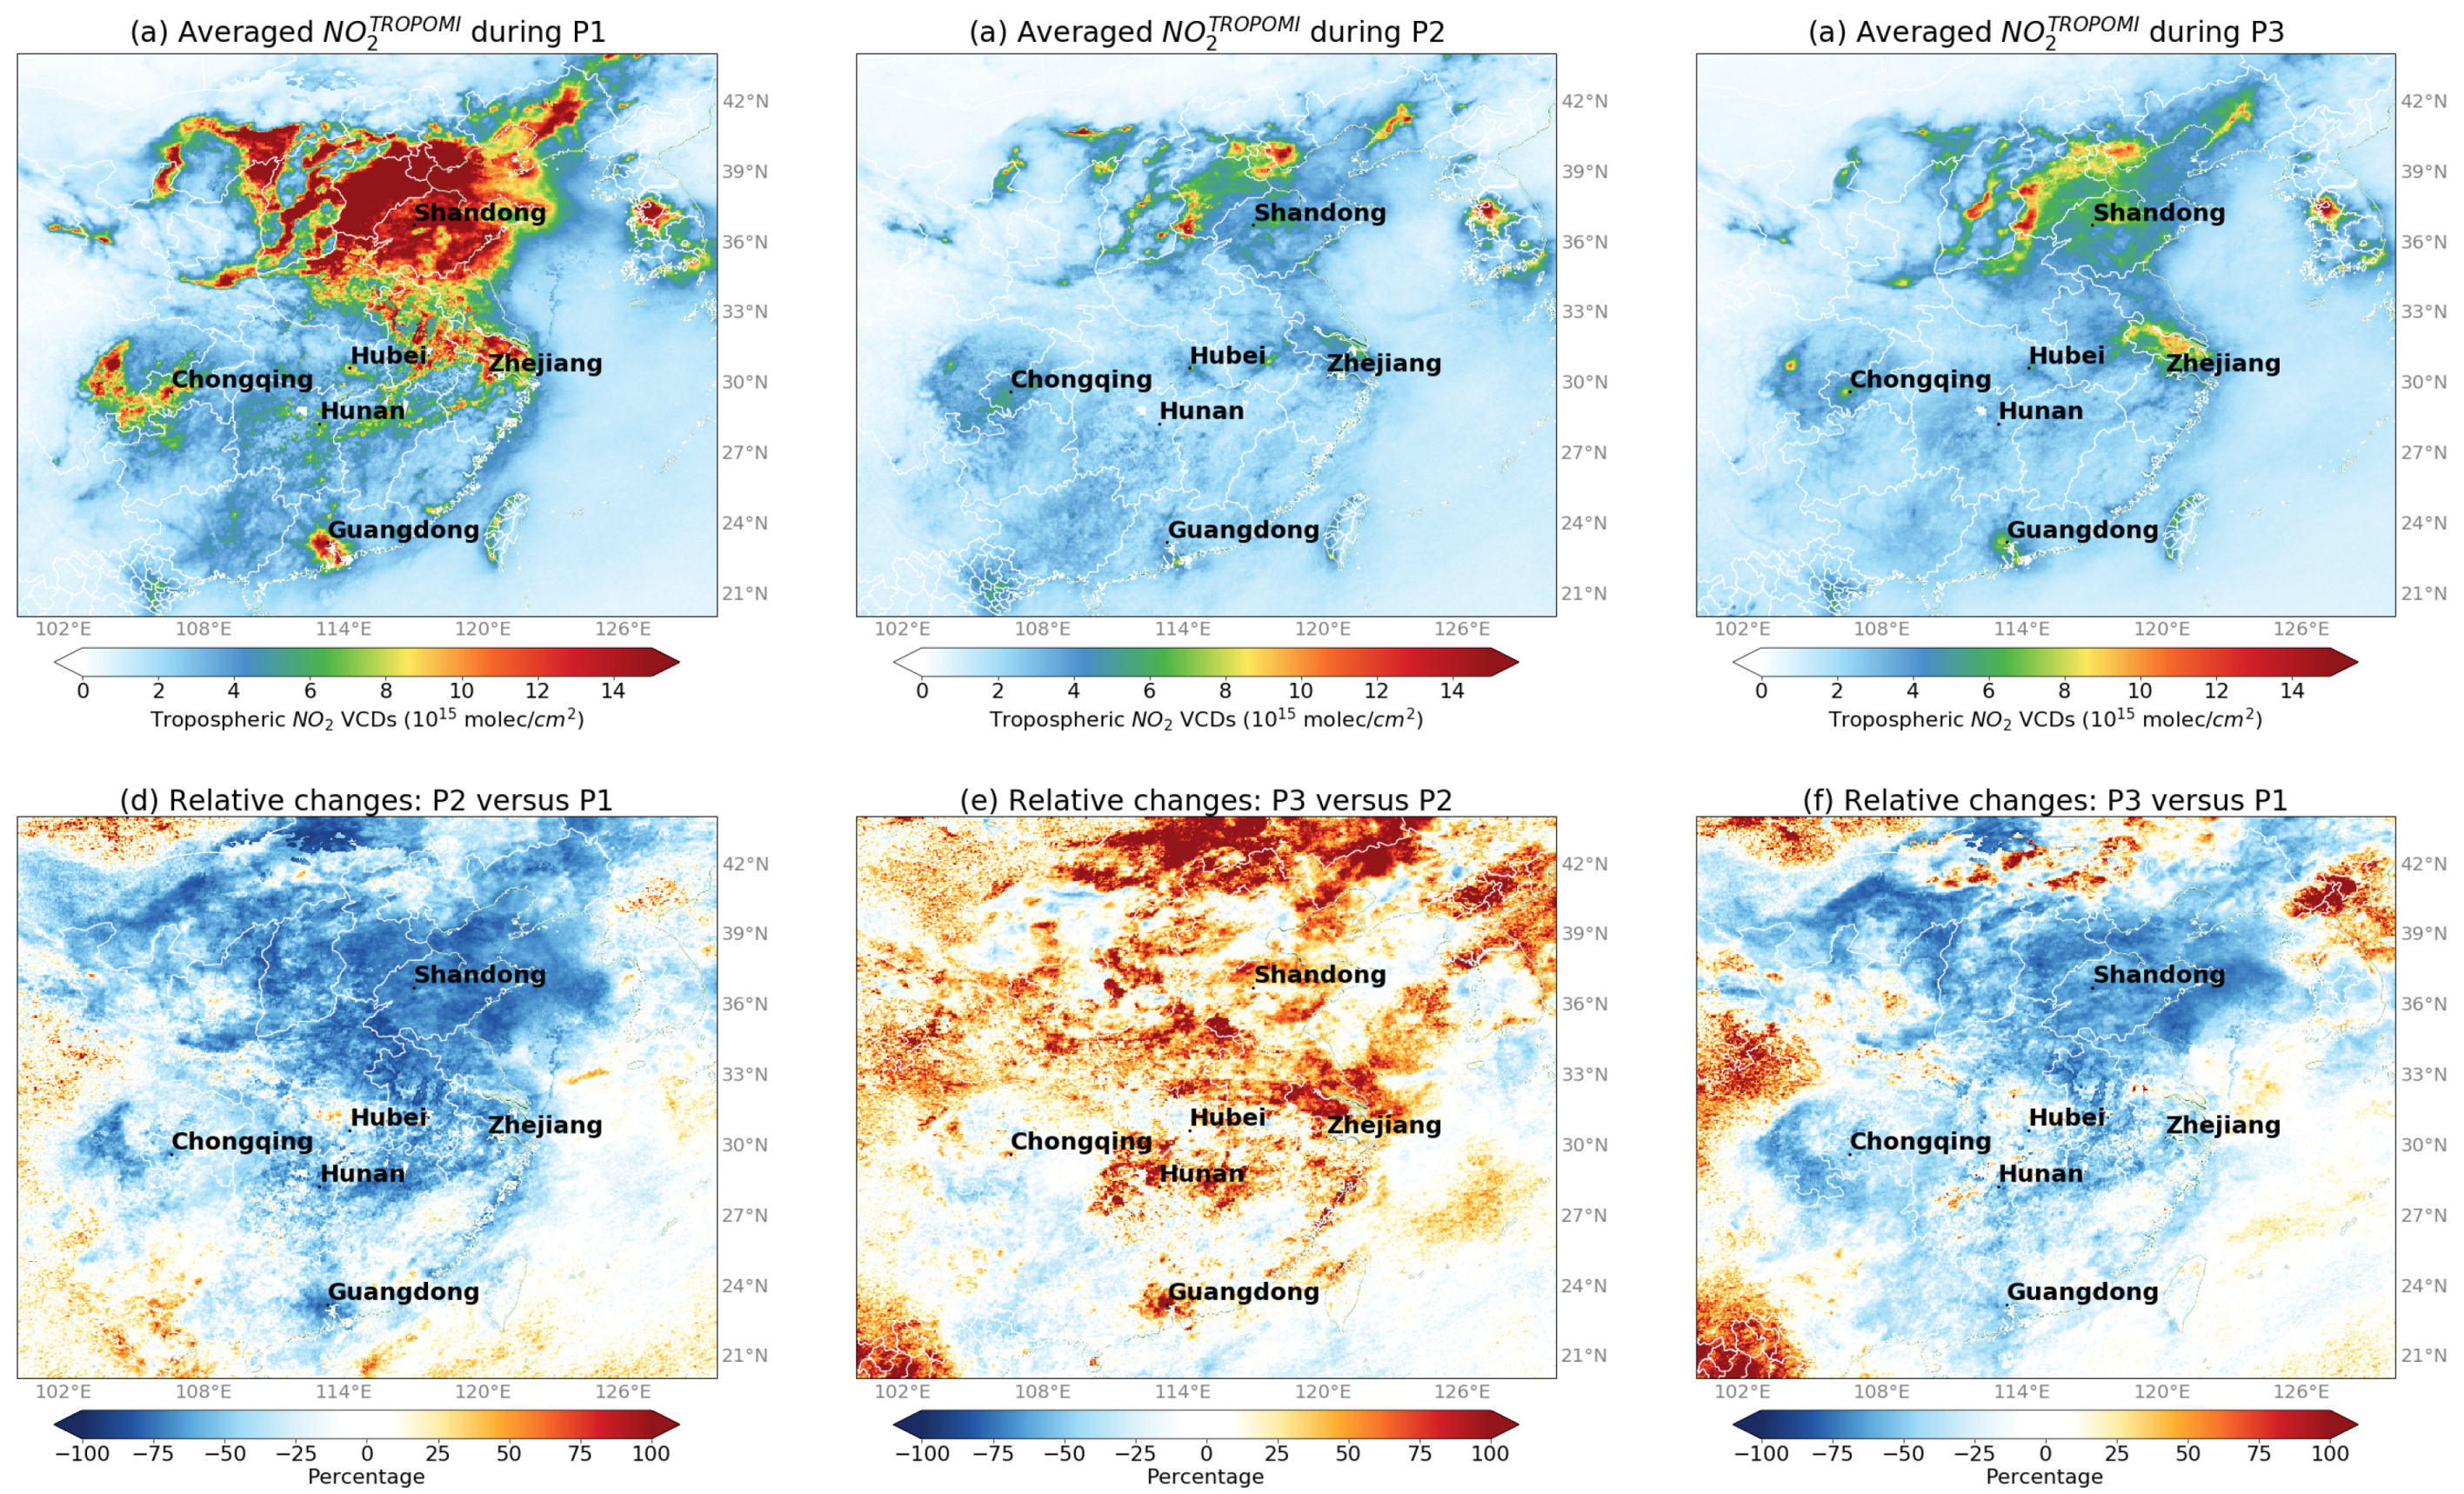
3.1. NO2TROPOMI Changes

Figure 1 shows the NO2TROPOMI averaged during three periods and the relative changes between them. “P3 versus P1” means the relative change of NO2TROPOMI between P3 and P1. It is clear that NO2TROPOMI decreased greatly in P2 relative to P1, and there is a limited recovery during P3, in accordance with a previous report [19]. The levels of NO2TROPOMI can be controlled by many factors, including anthropogenic NOx emissions, meteorology (such as sunlight, precipitation, advection, and convection), and other pollution emissions.
Table 1 shows the NO2TROPOMI changes in eight selected regions, which would be discussed in more detail in Section 3.3. Overall, in East China, the NO2TROPOMI decreased by 52% from P1 to P2 and increased by 19% from P2 to P3. The averaged NO2TROPOMI increase of 0.3 × 10¹⁵ molecules/cm2 from P2 to P3 only recovered 14% of the NO2TROPOMI decrease from P1 to P2 (2.1 × 10¹⁵ molecules/cm2).

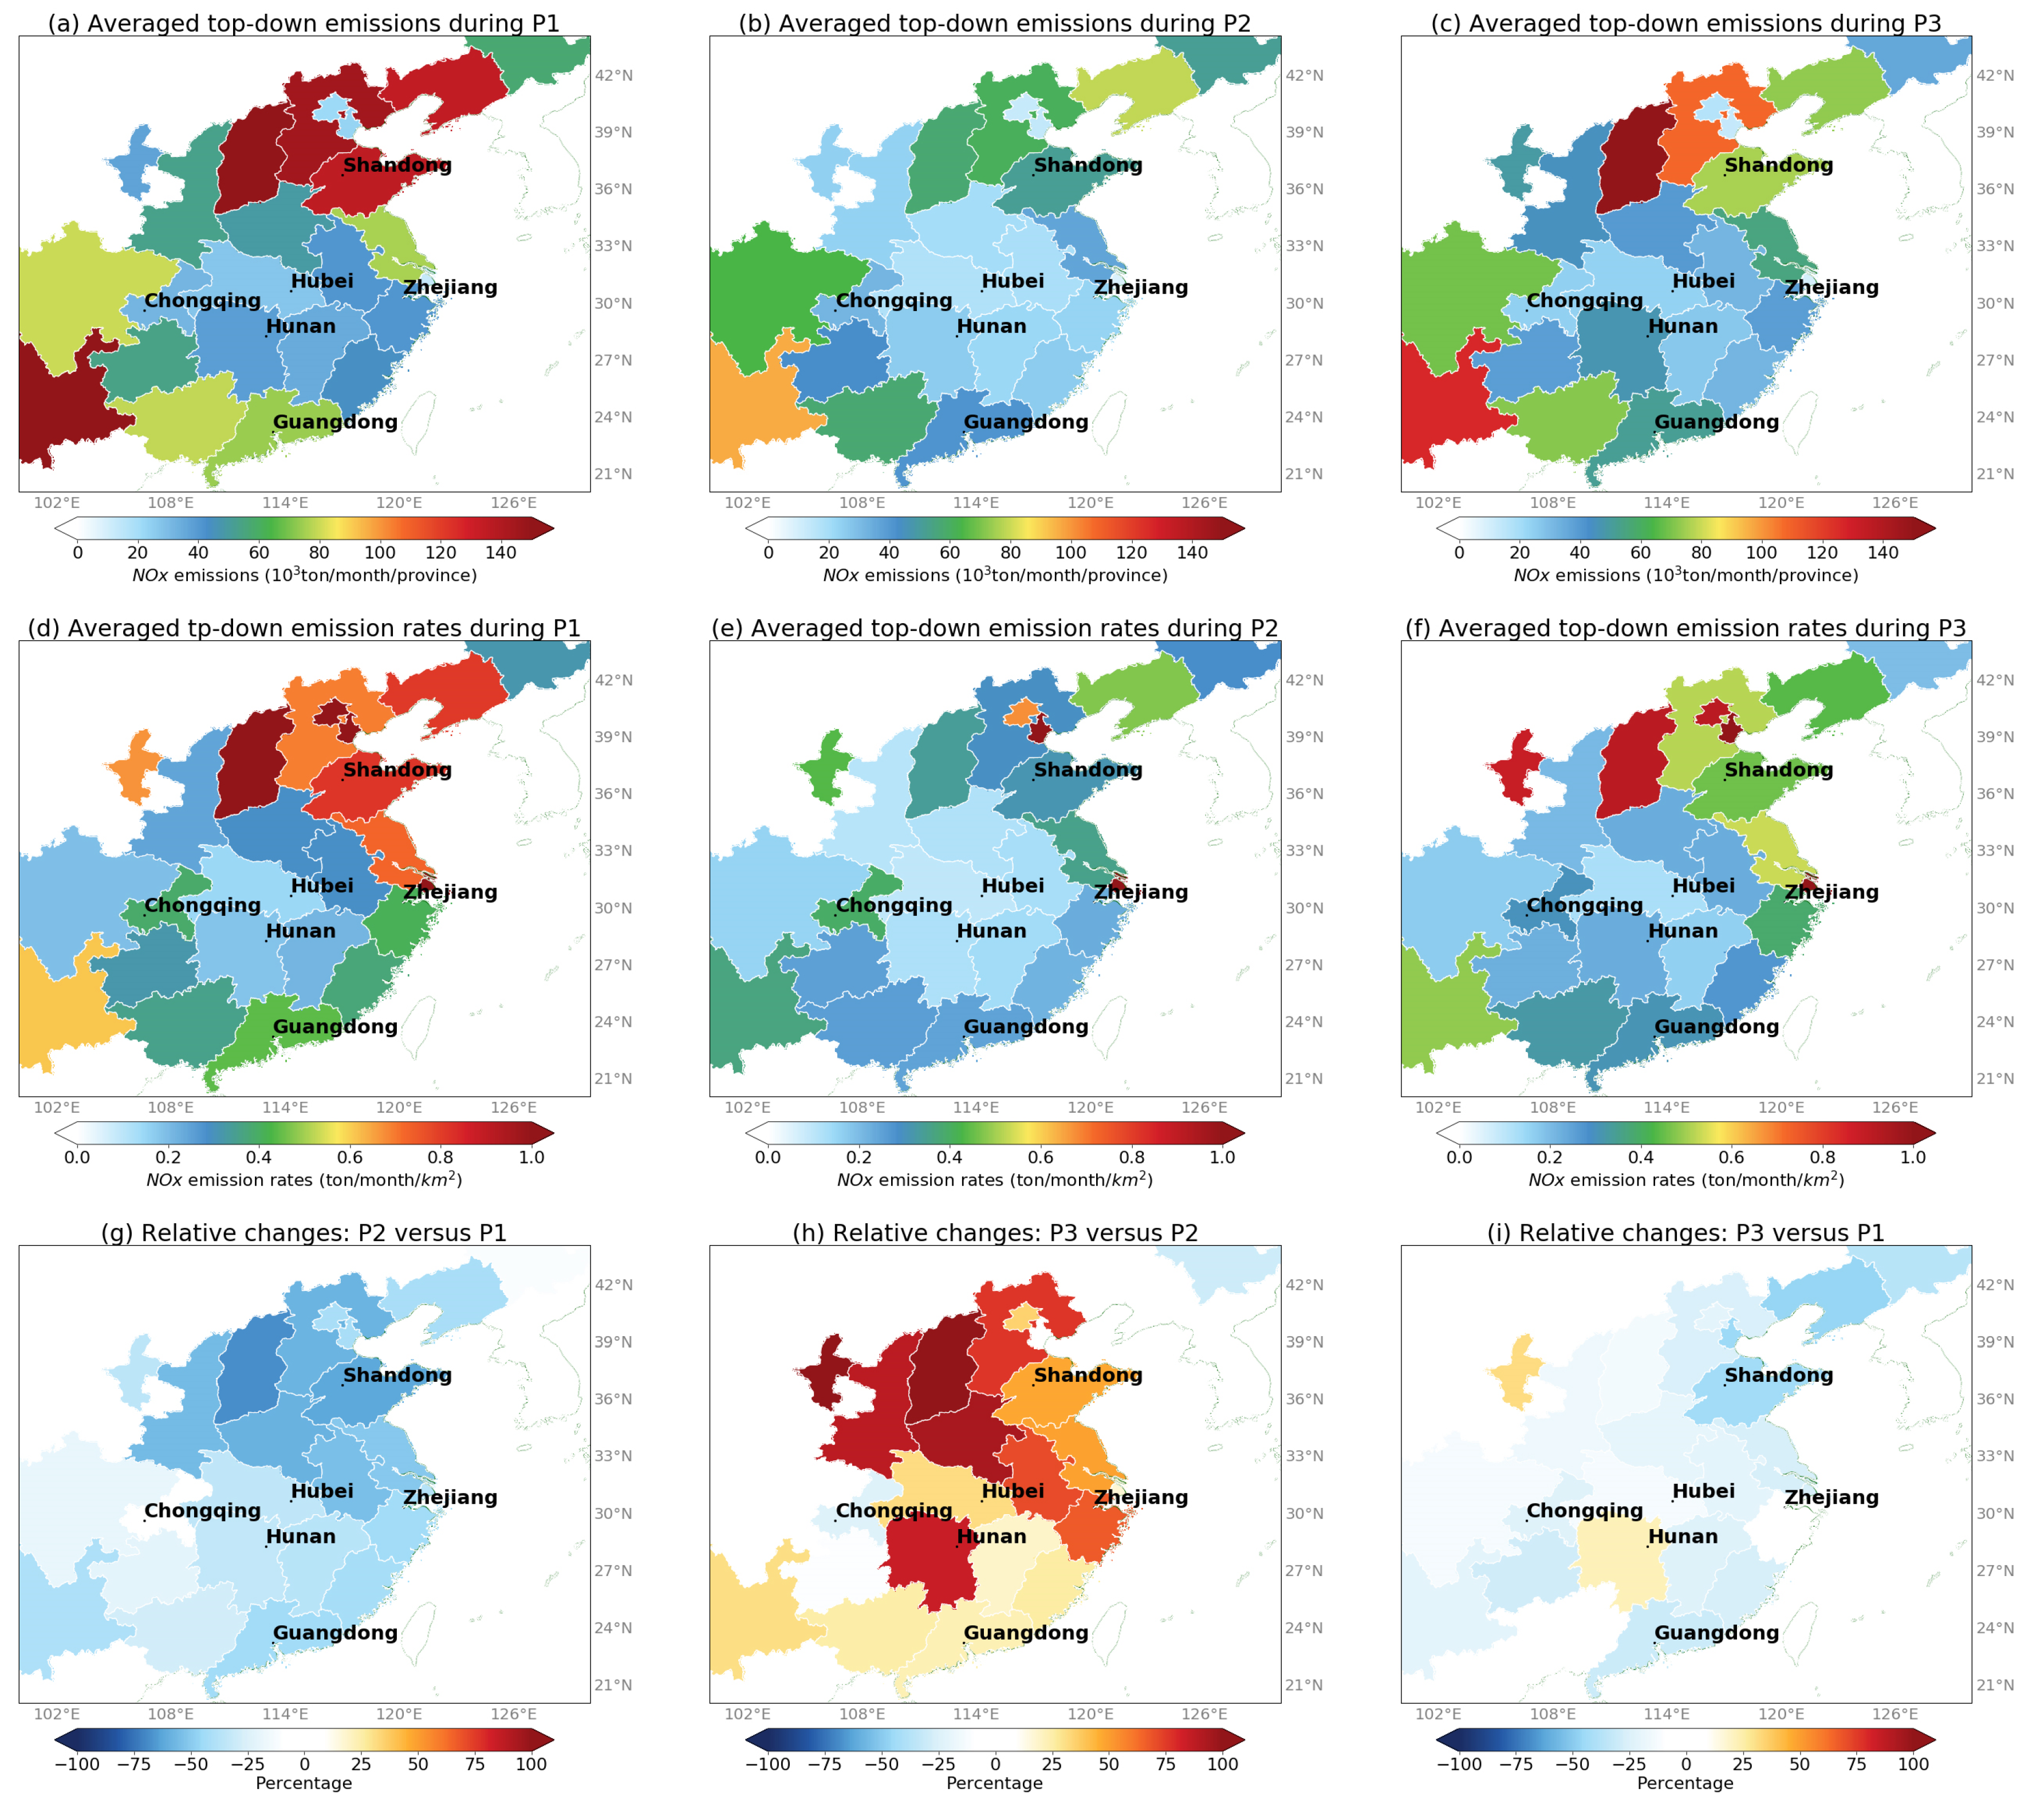
3.2. Top-Down NOx Emission Changes

The top-down NOx emissions (as derived in Section 2.3) averaged during the three periods and the relative changes between them are shown in Figure 2 and Table 2. The top-down NOx emission for East China was estimated as 1589.3 ± 449.8 Gg/month during P1, compared to 1250.6 Gg/month estimated by the bottom-up emission inventory (MEIC). Because the focus of this research is on the relative changes of top-down emissions, the differences between top-down and bottom-up emissions are not discussed. NOx emissions decreased from P1 to P2 (Figure 2g) and increased from P2 to P3 (Figure 2h) in almost all regions in East China, consistent with emissions being the main driver of NO2TROPOMI changes during the periods. Overall, in East China, NOx emissions decreased by 50% from P1 to P2 and increased by 26% from P2 to P3. As a result, the NOx emissions during P3 were still 37% lower than the ones during P1. NOx emissions only recovered 206 Gg/month from P1 to P3, which was 26% of the emission decrease (794 Gg/month) from P1 to P2 (Figure 2i). Hereafter, an emission recovery refers to regain the emission decrease from P1 to P2 (i.e., P2-P1) in P3.
The top-down NOx emissions decreased most in North China and Central China (e.g., Shandong) during P2 versus P1, while those in Southwest China (e.g., Chongqing) merely changed (Table 2, Table S1).
Although top-down NOx emissions changes (P2vP1: −50%, P3vP2: 26%) were very close to NO2TROPOMI changes (P2vP1: −52%, P3vP2:19%) in East China, the discrepancies between the two were evident at the provincial level. Between P1 and P2, in Jilin, Chongqing, Yunnan, and Sichuan, the relative changes of NO2TROPOMI were −54%, −30%, −2%, and −35%, respectively, and those of top-down NOx emissions were −10%, 1%, −39%, and −20%, respectively. Between P2 and P3 in Shandong, Zhejiang, and Hunan, the relative changes of NO2TROPOMI were 26%, 38%, and 33%, respectively, and these of top-down NOx emissions were 48%, 67%, and 85%, respectively.
This implies that the recovery of human activity and subsequent anthropogenic emissions was much faster than what is implied by the NO2TROPOMI in these regions. NO2TROPOMI changes are dependent on both NOx emission changes and meteorological changes. For example, it is likely that increasing precipitation, higher temperature, and stronger sunlight would shorten NOx lifetime and decrease NO2TROPOMI after February, given fixed NOx emissions. Assuming that WRF-GC reasonably captured the meteorological impact on NO2, NO2WRF-GC can serve as a baseline which shows how tropospheric NO2 VCDs should have behaved with changing meteorology but fixed emissions. The top-down NOx emissions, which were derived partly based on NO2WRF-GC, were largely independent of meteorological factors. Still, the top-down NOx emissions were subject to the uncertainties of both WRF-GC, TROPOMI retrievals, and bottom-up emissions. However, as this research focuses on the relative changes of top-down NOx emissions, as long as there is no systematic bias of temporal changes of both WRF-GC simulation and TROPOMI retrievals, we consider the results presented here to be reasonable. In East China, where primary sources of NOx emissions are anthropogenic, the actual anthropogenic NOx emission changes can be better captured by top-down NOx emission changes. The changes of NO2TROPOMI can be significantly larger or smaller than the changes of NOx emission in individual regions. Therefore, one needs to be careful when attributing the changes of NO2TROPOMI solely to the changes of human activity.
Figure 3 better illustrates the top-down NOx emission changes in each region. The recovery rate can be measured by the relative changes of top-down emissions between P3 and P1, as shown by the colored contours. The contour of “relative change P3vP1 = 0%” means a full recovery from the emission decrease in P2. Most regions have decreased emissions between P1 and P2 and increased emissions between P2 and P3. Only Ningxia and Hunan have increased emissions in P3 compared to P1, while other regions have not fully recovered in P3.

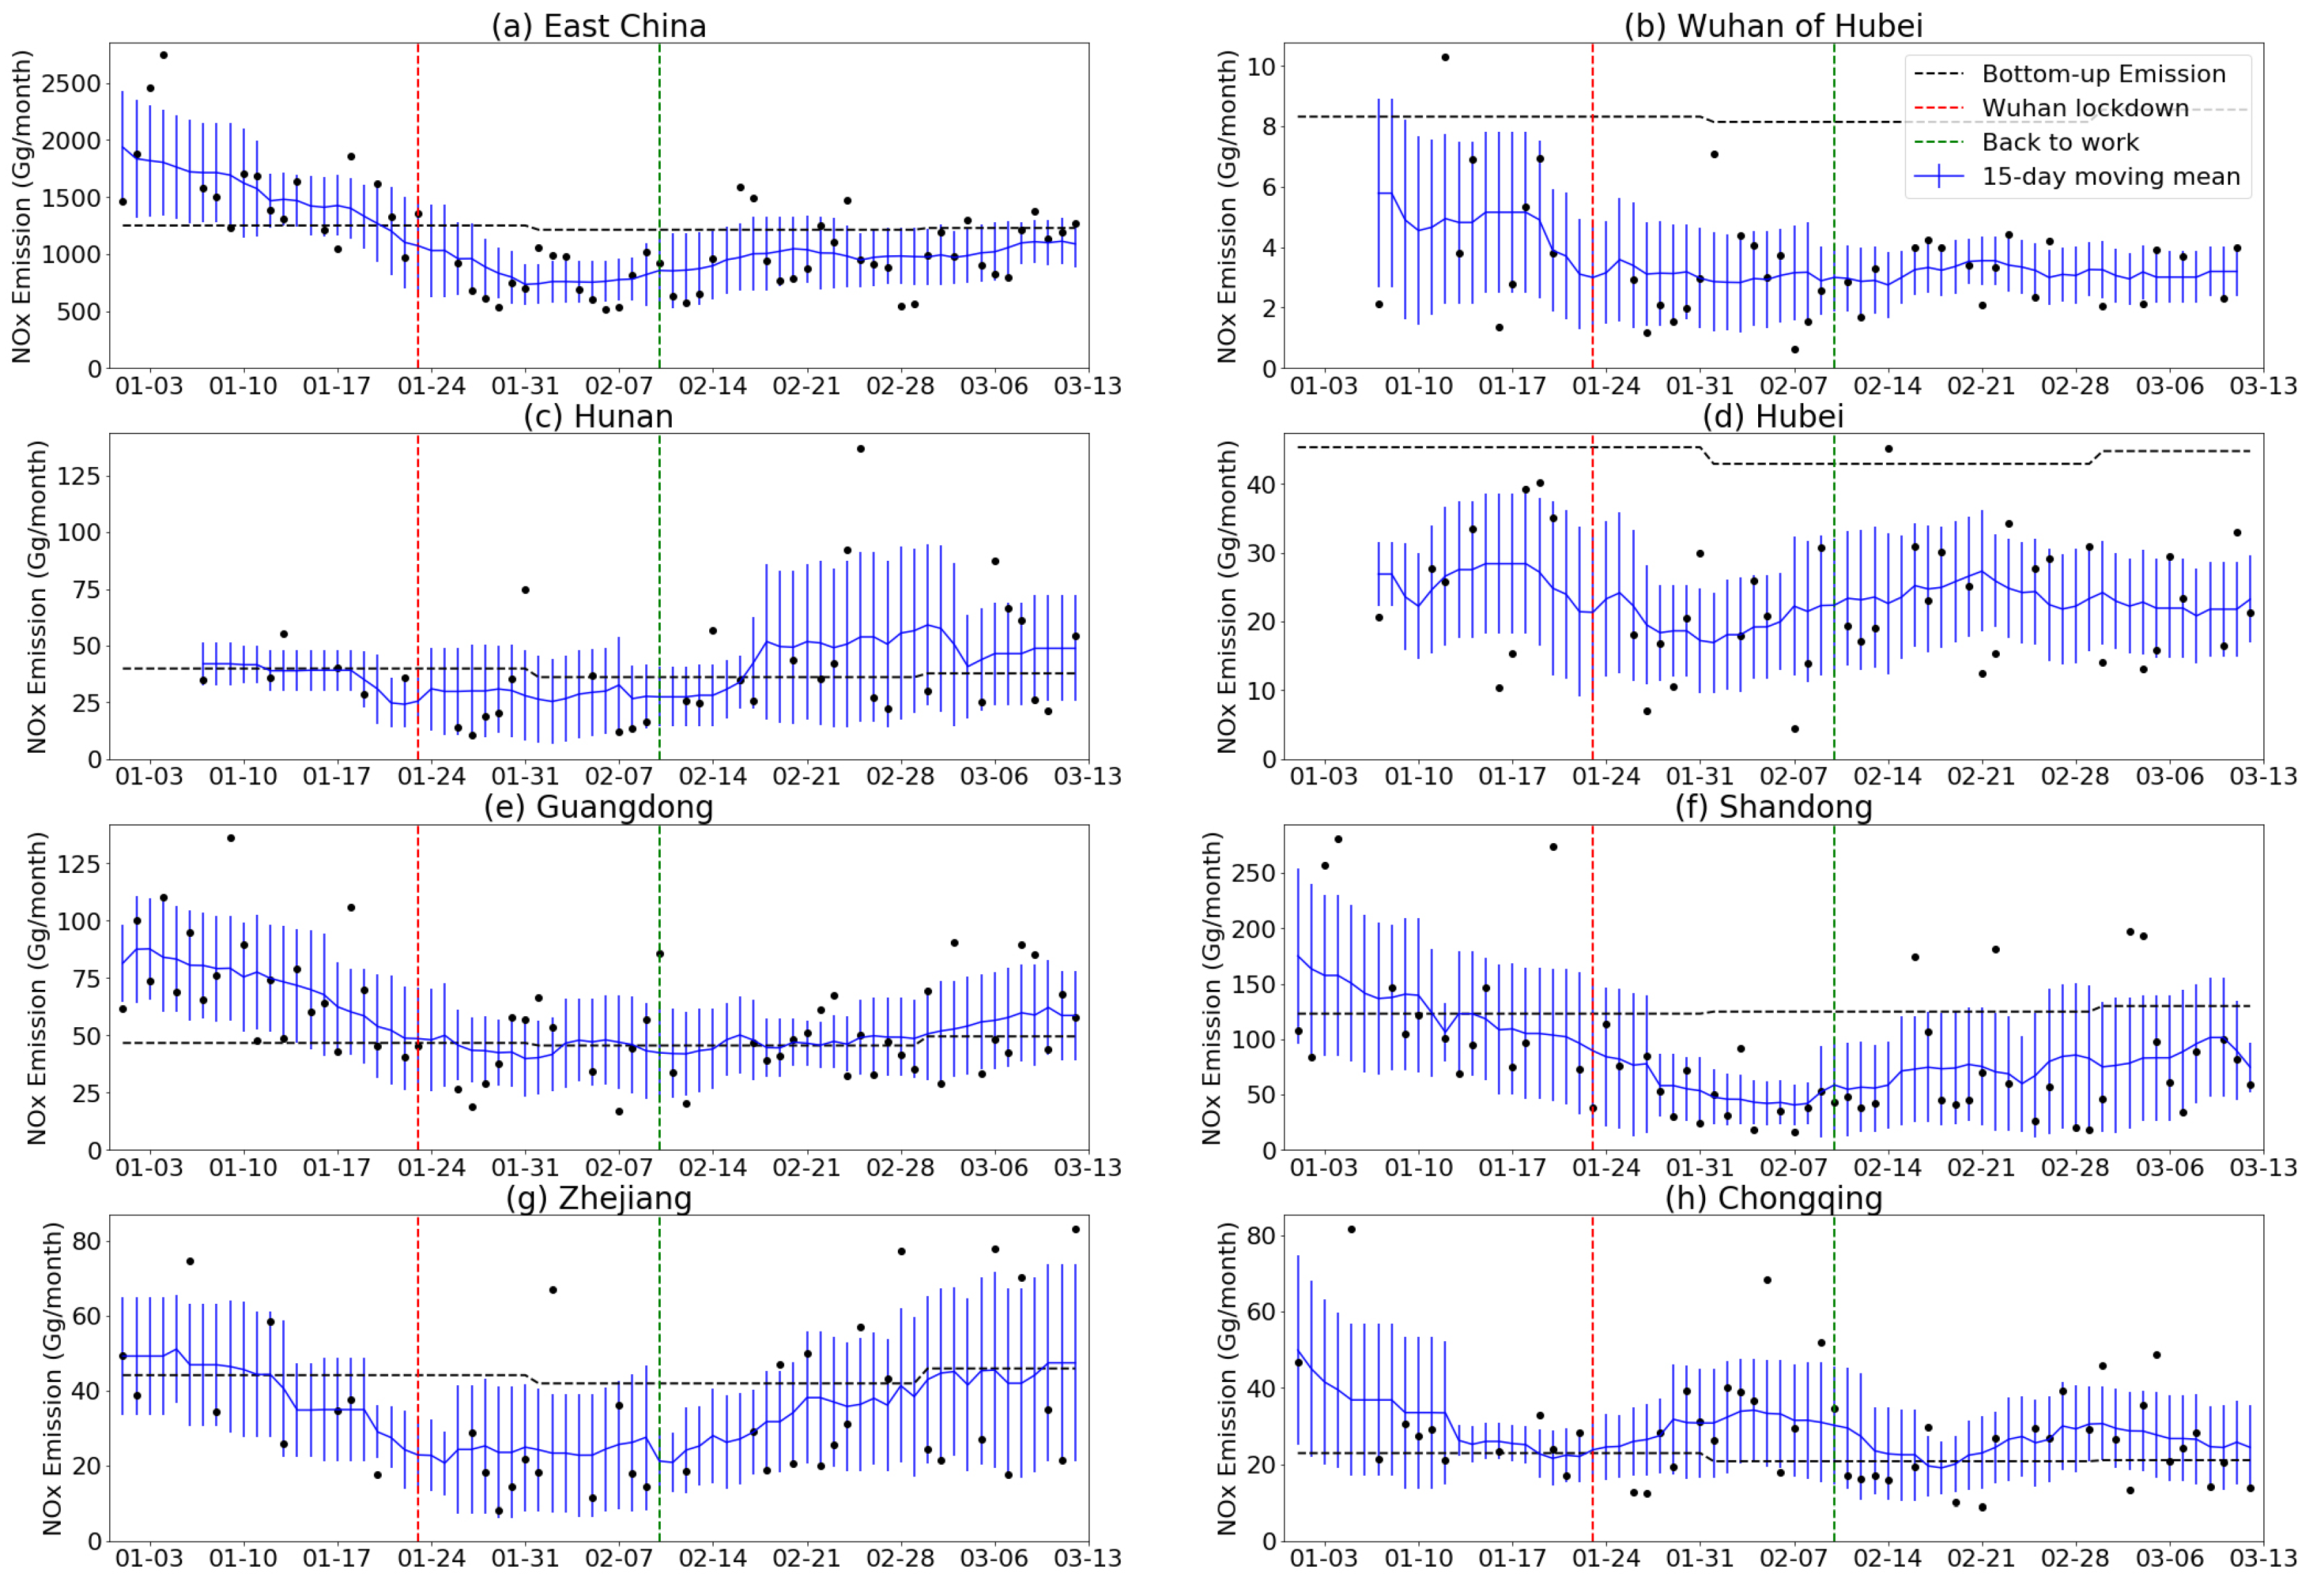
3.3. Timeseries in Selected Regions

To better understand the different emission reduction and recovery patterns, we examined the timeseries of daily regional top-down emissions of the eight selected regions in Figure 4. These regions serve as good examples of different emission change patterns. As the daily top-down NOx emissions have high day-to-day fluctuations, we also presented 14-day central moving averages in Figure 4 to better reflect the general trends. We included similar time-series of all regions, for more information see the Supplementary Materials. For readers’ references, we included several reference lines: the monthly emissions from the MEIC emission inventories, the dates for Wuhan lockdown, and official nationwide back-to-work day. The MEIC emissions serve as references on how the emissions should change temporally.

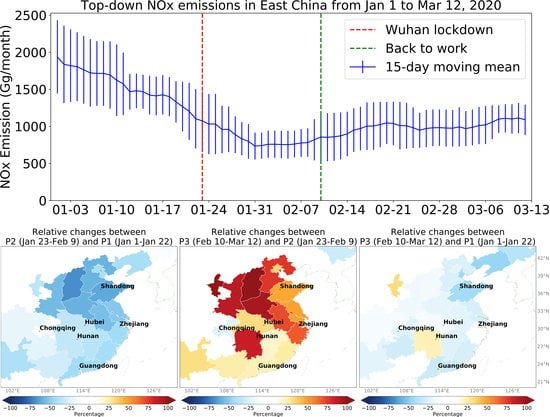
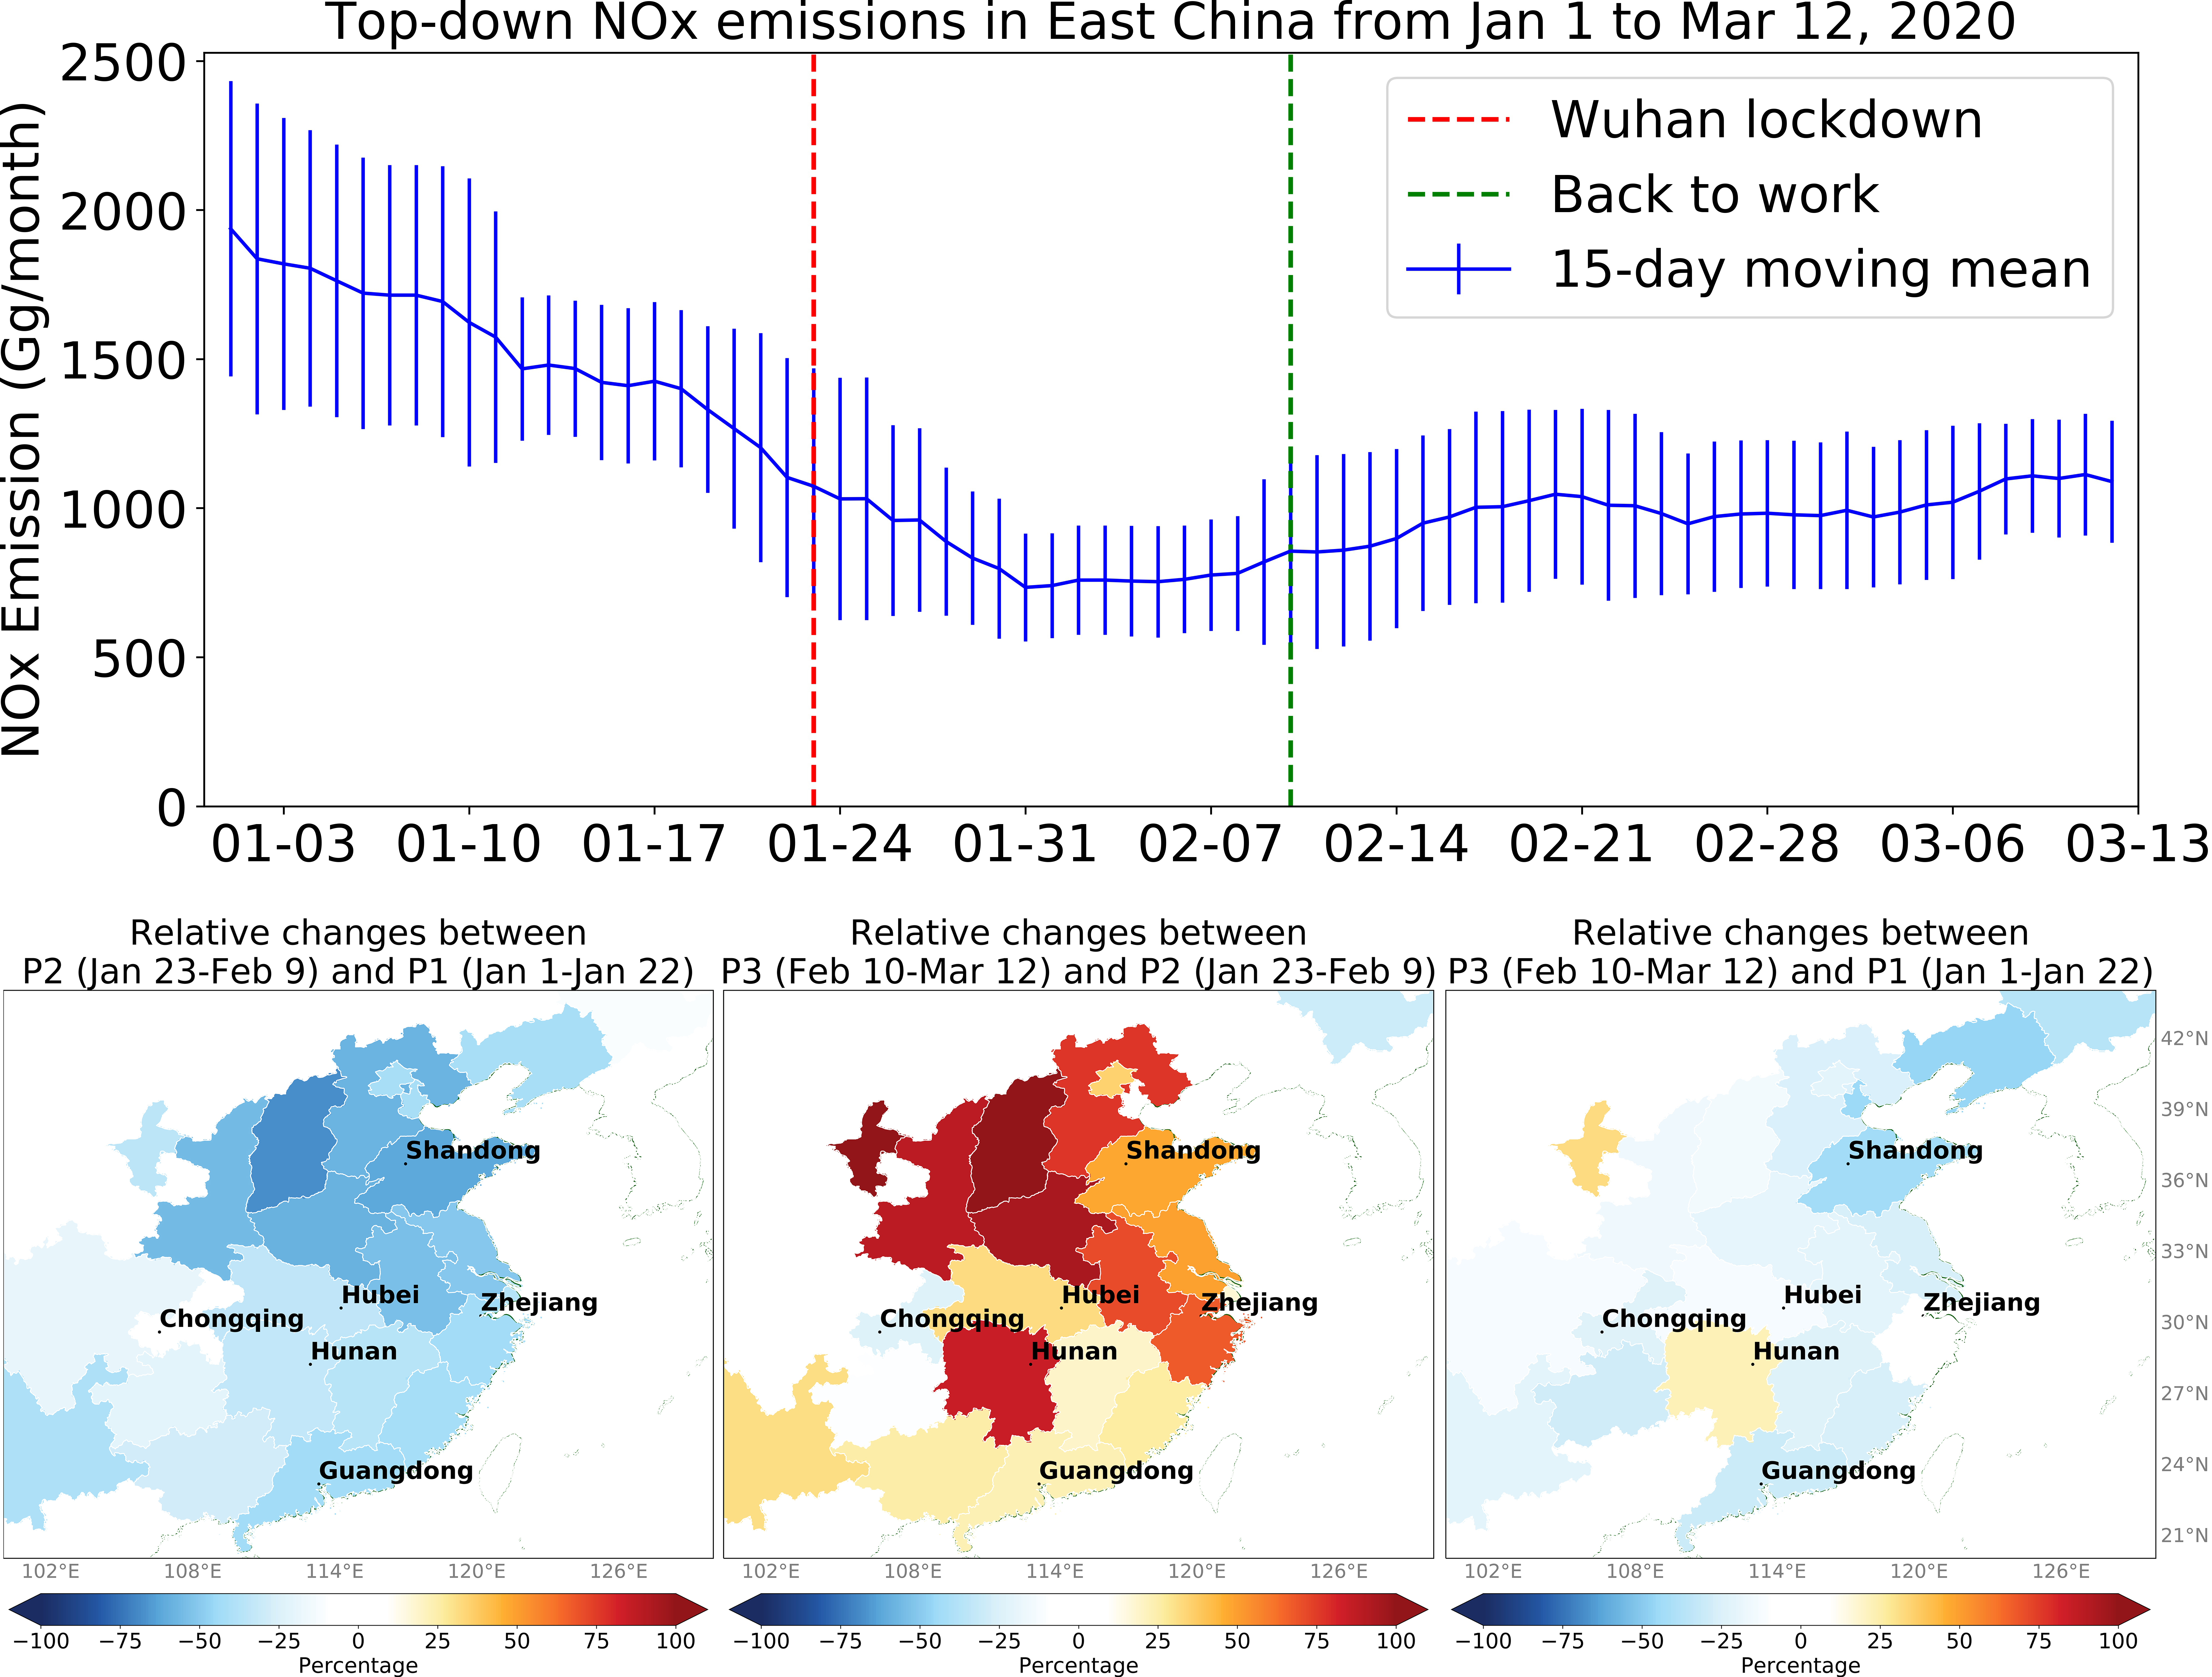
3.3.1. East China: Recovering

The top-down NOx emissions decreased before the Wuhan lockdown, reached their lowest point after the Chinese New Year (January 24 to February 2), and then gradually increased afterwards (Figure 4a). Assuming that the NOx emissions keep increasing at current rate, it would still take a few months for the emissions to return to their levels back in January.

3.3.2. Wuhan of Hubei: No Sign of Recovering

Being the first epicenter of COVID-19, NOx emissions decreased in Wuhan (Figure 4b) before the lockdown and there was no sign of recovering by March 12. In fact, non-essential businesses were only allowed to return to work after March 20th [5]. Although Table 2 shows there was a possible 13% increase from P2 to P3, the p-value from an ANOVA test is 0.41 (ANOVA: p = 0.41), meaning that the difference between the P2 and P3 periods was not significant at all. This suggests a similar lockdown state of Wuhan when businesses were limitedly functioning from January 24 to March 12.
Wuhan, however, was not the only region without a successful recovery. Figure 3 shows that Liaoning and Tianjin suffered from similar emission reductions (−41%, ANOVA: p = 0.01; −42%, ANOVA: p = 0.01) from P1 to P2 and the emissions stayed about the same from P2 to P3 (−8%, ANOVA: p = 0.73; −6%, ANOVA-p = 0.79). While businesses in Tianjin and Liaoning were ordered to return to work after February 10, they seem to need more time to recover.

3.3.3. Hubei and Hunan: Possibly Recovered

Wuhan is the capital of Hubei, and Hunan is adjacent to Hubei and generally very close to Wuhan. However, they shared a quite different emission pattern compared to Wuhan. Hubei (Figure 4d) and Hunan (Figure 4c) both have decreased NOx emissions from P1 to P2 by 34%; they featured NOx emission increases of 32% and 85% from P2 to P3, respectively. Considering the staggering NOx emission in Wuhan, the NOx emission increase was even larger in Hubei excluding Wuhan. As a result, the top-down NOx emissions in Hubei and Hunan during P3 had no significant difference compared to these during P1 (ANOVA: p = 0.32 and 0.5).

3.3.4. Guangdong and Shandong: Recovering Slowly

NOx emissions in many more developed and industrialized provinces greatly decreased prior to P3. Among them, we chose to use Shandong (Figure 4f) in North China and Guangdong (Figure 4e) in South China as examples. Similar to the pattern of East China, Shandong and Guangdong had NOx emission decreases of −62% and −43% from P1 to P2 (ANOVA: p = 0.00 and 0.00). The NOx emissions gradually increased (48% ANOVA: p = 0.10; 23%, ANOVA: p = 0.13) after February 9 but they had not fully recovered before March 12 (Figure 4e,f). Like Guangdong and Shandong, most other provinces followed this similar pattern, such as Jiangsu, Fujian, Guizhou, Beijing, Shanghai, and Shenzhen (Table S1 in the Supplementary Materials).

3.3.5. Zhejiang: Almost Recovered

The top-down NOx emissions of Zhejiang decreased by 44% from P1 to P2 but increased by 67% from P2 to P3 (Table 2). As a result, the difference between P3 and P1 was not significant (−6%, ANOVA: p = 0.77). Zhejiang was the first province to declare a highest level response to coronavirus on January 23 and the first province to urge its local governments to relax control measures and support business resumption [38]. Zhenhai of Zhejiang has nearly 200 chemical plants including the largest oil refinery in China [39]. Zhejiang is also known for its thriving private sector, which constitutes 65.5% of the total gross domestic product (GDP) in the province in 2018 [40]. It is possible that both the efficient order execution of local governments and the rising pressure to resume work of private sectors resulted in the faster recovery of business activity and NOx emissions.
Besides, Zhejiang, Shanxi, Shaanxi, Guangxi, and Beijing also recovered fast with no significant difference between P1 and P3 (ANOVA: p = 0.55, 0.38, 0.49, 0.31, respectively). Among these, top-down emissions of Shanxi rebounded with the most rate, the emissions decreased by 68% (ANOVA: p = 0.00) from P1 to P2 and increased by 169% (ANOVA: p = 0.01) from P2 to P3. There are several possible reasons why the NOx emissions in Shanxi increased fast. Shanxi was one of the provinces with fewest confirmed cases (138 cases as of April 7th, 2020) [41]. Moreover, MEIC emission inventory indicates that 31% and 26% of total NOx emissions came from powerplants in Shanxi and Shaanxi, respectively (Table S1), which were much higher than the averaged percentage in East China (19%).

3.3.6. Chongqing: No Significant Changes

Surprisingly, there are a few regions not showing significant changes of NOx emissions from P1 to P2. Chongqing (Figure 4h) had no significant change of top-down NOx emissions from P1 to P2 (1%, ANOVA-p = 0.96). Jilin was also barely affected from P1 to P2 (−10%, ANOVA-p = 0.71). The reason why these regions were hardly impacted during COVID-19 is yet to be investigated.

4. Discussion

4.1. Chinese New Year

The official holidays for Chinese New Year were from January 24 to February 2, within P2 (January 23 to February 9). This may partly explain why we see the top-down NOx emission decreased steadily before Wuhan lockdown. Before the official holidays started, the business activities decreased as people may use paid time-off to travel back to their hometowns and unite with families. Moreover, it might be possible that some small businesses were taking extra caution and halted their operations even before Wuhan lockdown. The Chinese government prolonged the holidays to February 9 for spreading control purpose, which would certainly contribute to the emission decrease during P2.
Lin et al. (2011) estimated that the emission reduction associated with the Chinese New Year is about 10% in January 2009 using multiple satellite retrievals [11]. Gu et al. (2014) found that the top-down NOx emission estimated using OMI and the Global Ozone Monitoring Experiment-2 (GOME-2) retrievals decreased by 35% and 31% from January to February and increased by about 13% and 27% from February to March during 2011 in China [14]. Meanwhile, the bottom-up NOx emissions from MEIC showed little temporal changes in the study period (Figure 4, Table A1 in the Appendix).
In this study, we observed much more evident reduction (−50%) between P1 and P2 in East China and the emissions remained at low level during P3 compared to P1 (−37%). It is likely that a significant portion of the emission reductions are COVID-19 related.
The slow NOx emission increase during P3 after the prolonged holidays implied that the human activity was slowly recovering. During P3, the emissions only recovered 26% and might need at least a few months to reach its early January level at current rate. We would not anticipate such slow recovery after holidays under normal circumstances.
Future studies may compare the TROPOMI-based top-down NOx emission changes in early 2020 to the climatology of them to better quantify the impact of COVID-19. As of April 2020, TROPOMI NO2 retrievals are only available at a different version for early 2019 so that they are not directly comparable.

4.2. Economic Downturn

Even if the COVID-19-related control measures such as mandatory business halt and social distance were not enforced anymore, there could be impact on the economy if people lost their jobs, businesses went bankrupt, and people spent less for fear of an economic recession. This aftershock of COVID-19 might partly explain the slow recovery during P3.
Besides the economic interruption in China, the slow recovery of NOx emissions may result from the change of foreign economies. As COVID-19 became a global pandemic, it affected the global economy besides Chinese economy. Previous studies have shown that the previous 2007–2009 global economic recession may have reduced Chinese NOx emissions by ~20% [11,13]. Although the exports of goods and services as a percentage of GDP decreased from 32% in 2008 to 20% in 2018 [42], the decreasing demand from other countries would nevertheless impact Chinese businesses focusing on exports and the domestic suppliers.
By April 19th, 2020, more than 80 countries have established lockdown or other control measures in March and early April and the lockdown continues with numerous businesses closed [43]. Applying the method of this study to derive the different emission changes corresponding to the different control measures would be important to (1) understand how the control measures affected the environment and (2) evaluate how to minimize the economy interruption (partly reflected by the emission changes) while controlling the spread of virus.
This study focuses on the changes of NOx since it is a better indicator of human activity. Future studies may also perform similar analyses using satellite retrievals of SO2, CH4, CHOCHO, and aerosol optical depth (AOD). A comprehensive analysis on different atmospheric components would help us better understand the activity changes of each sector (e.g., powerplant, industry, transportation, and residential) and their impact on the environment and climate.

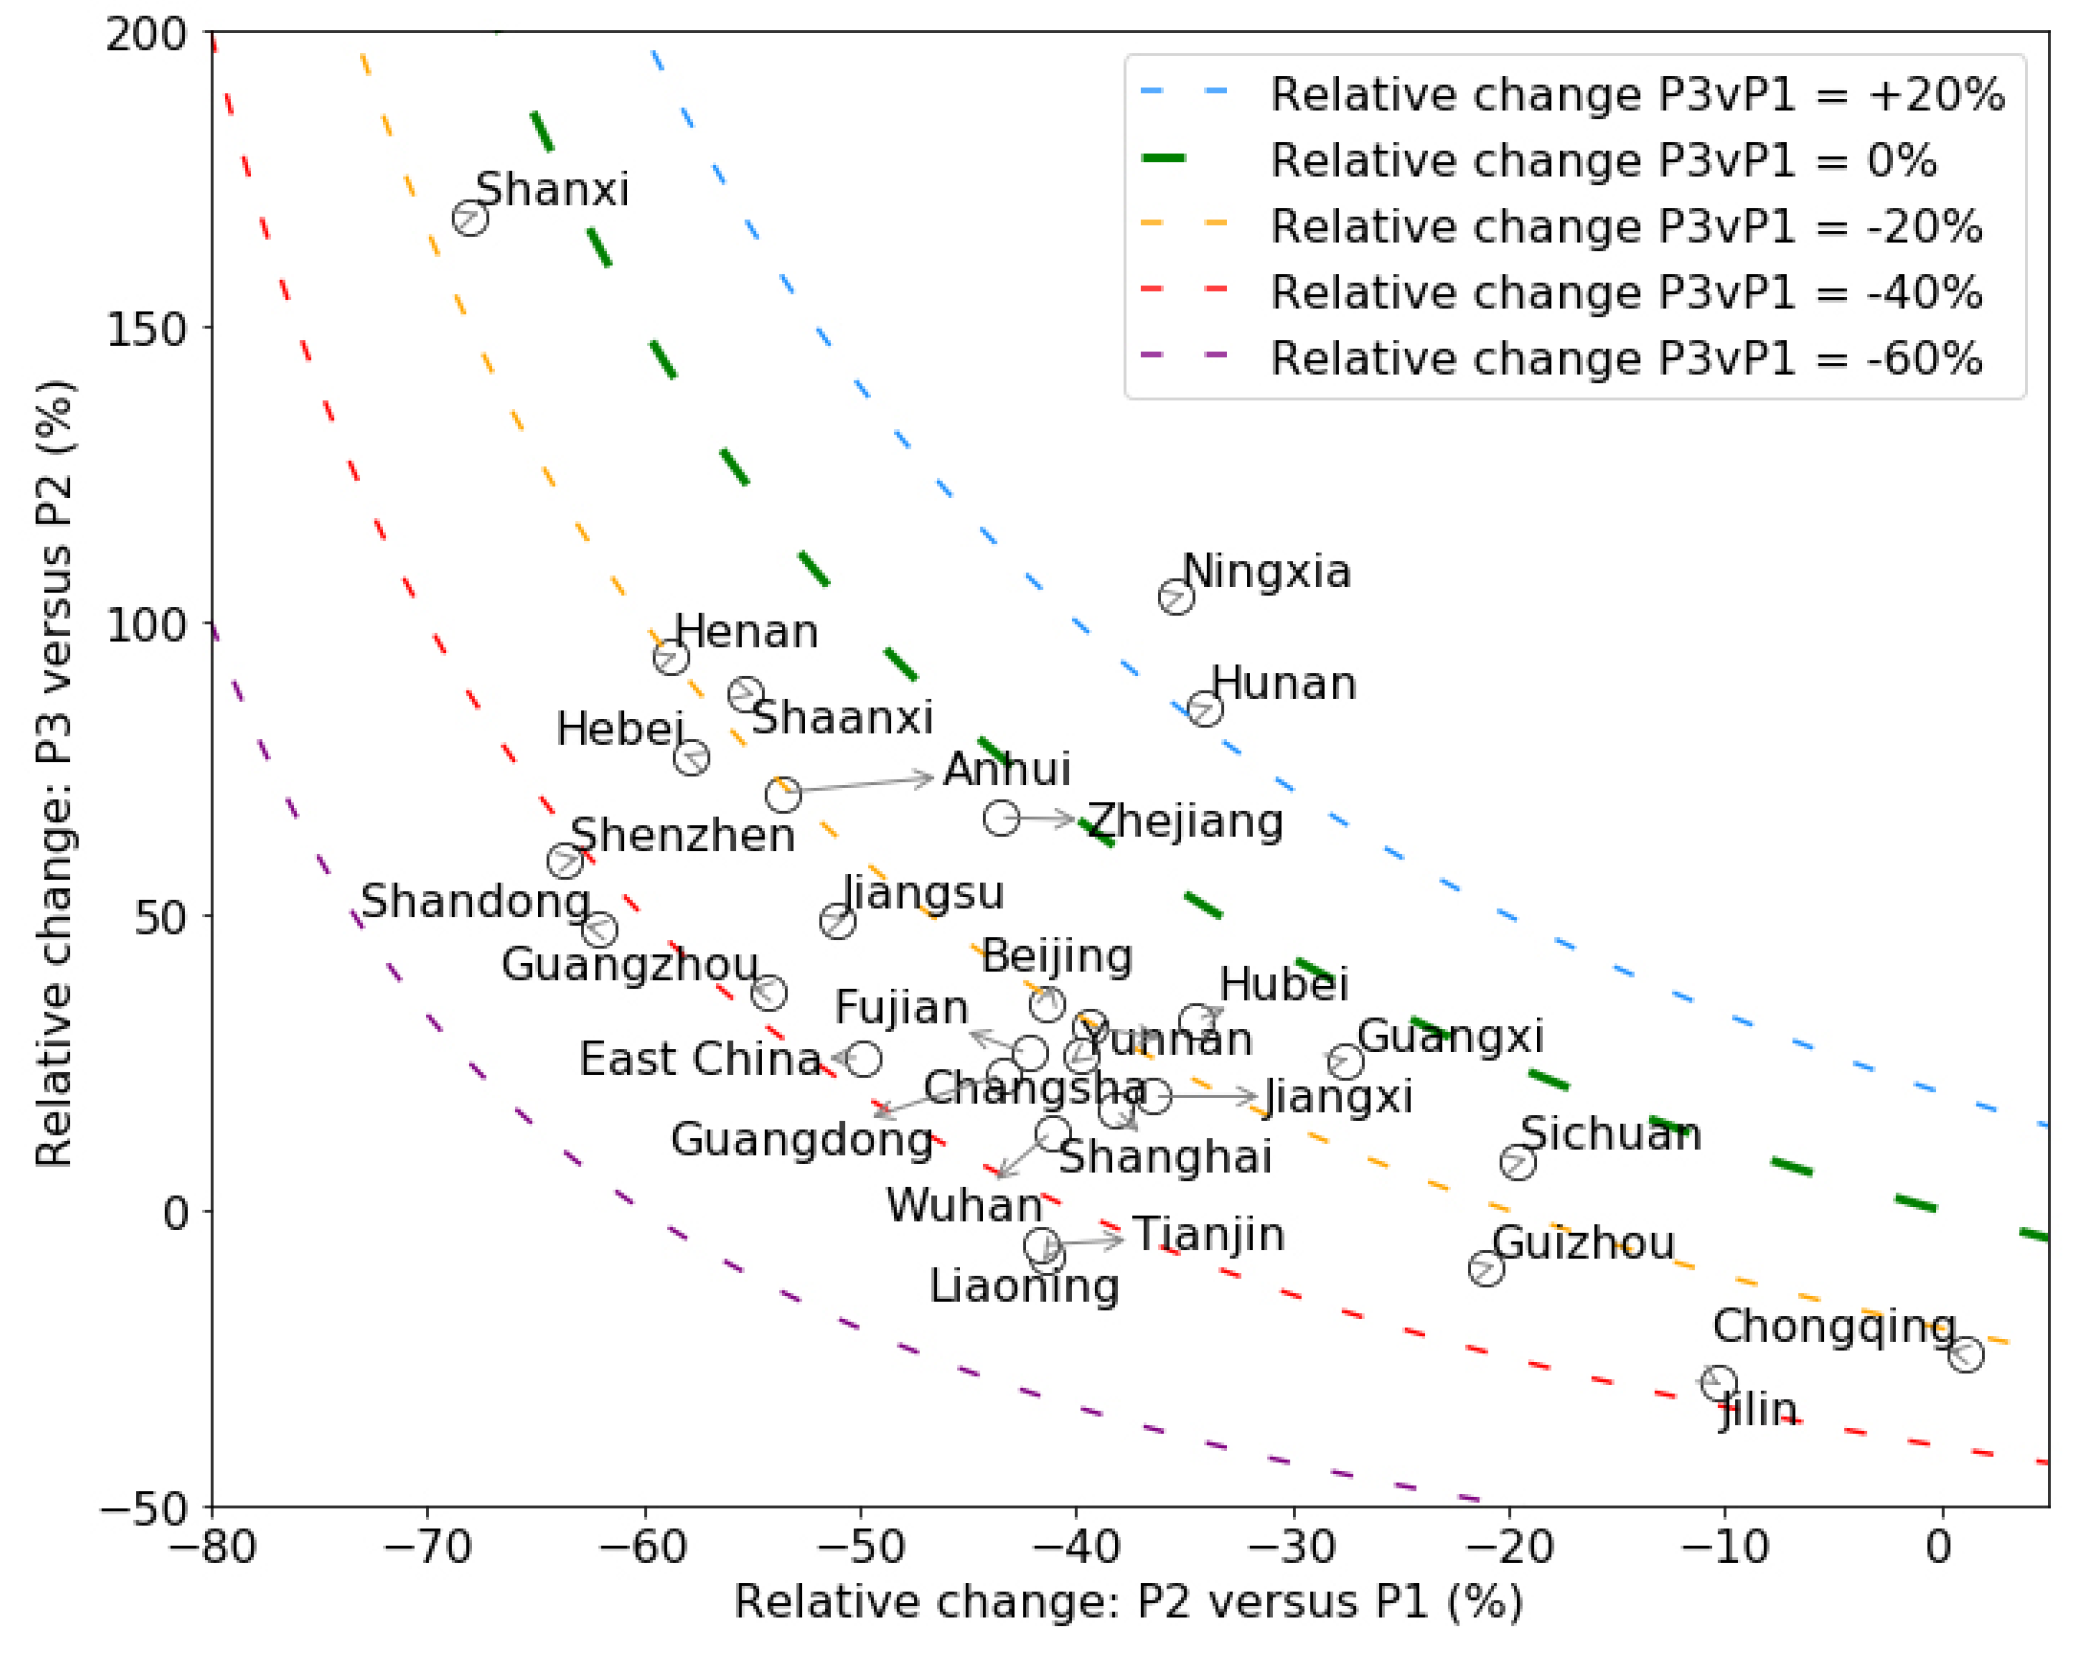
4.3. Relative Changes of Top-Down NOx Emissions and Tropospheric NO2 VCDs

The early results of NO2TROPOMI in East China and Wuhan were released by NASA and European Space Agency [19] and drew considerable attention from mass media. Although we found that the difference between the relative changes of NO2TROPOMI and top-down NOx emissions during the study period was limited (<10%) in East China, the difference was evident in specific provinces, as discussed in Section 3.2. Although NO2TROPOMI and surface NO2 concentrations are directly measured by satellite instruments and governmental monitoring systems, they are affected by both NOx emission and meteorology. Hereby, they are not direct measures of anthropogenic activities. It is possible that these NO2 concentration measures show different directions of changes compared to those of NOx emissions, like the case in Chongqing (Section 3.2). Future media releases may want to be cautious about the implications of NO2TROPOMI changes.

5. Conclusions

We used WRF-GC and TROPOMI tropospheric NO2 data to derive top-down NOx emissions of regions in East China. We found that different provinces were affected differently during January 1 to March 12, 2020 in response to COVID-19. East China was still recovering its NOx emissions by March 12. Wuhan, the first epicenter of COVID-19, showed no sign of NOx emission recovery by March 12. A few provinces, such as Zhejiang and Shanxi, featured huge NOx emission decreases during the lock-down period but almost fully recovered by March 12.
The reported emission changes and the method of this analysis can be used to (1) adjust bottom-up emissions in air quality and climate studies covering the studied period, (2) quantify socioeconomic activity changes, and (3) assess the effectiveness and impact of different measures in different regions on socioeconomic activities.

Supplementary Materials

The following are available online at https://www.mdpi.com/2073-4433/11/4/433/s1, regional timeseries figures: regional_timeseries.zip, Table S1: Table_S1.xlsx. The tropospheric NO2 data from TROPOMI and WRF-GC and MEIC NOx emission data are available at http://doi.org/10.5281/zenodo.3759985, doi: 10.5281/zenodo.3759985.

Author Contributions

Conceptualization, formal analysis, and investigation, R.Z. and Y.Z.; data curation, visualization, and writing—original draft preparation, R.Z., Y.Z., and H.L.; funding acquisition, Y.Z., T.-M.F., and Y.W.; resources, Y.W.; methodology, all coauthors; writing—review and editing, all coauthors. All authors have read and agreed to the published version of the manuscript.

Funding

R. Zhang and Y. Wang were supported by the National Science Foundation Atmospheric Chemistry Program. Y. Zhang was supported by foundation of Westlake University. This research was partially funded by the National Natural Science Foundation of China (41975158).

Acknowledgments

We thank Xue Bao, Landon Zhang and Hang Qu for their technical support. We acknowledge the free use of tropospheric NO2 column data from the TROPOMI sensor from www.temis.nl.

Conflicts of Interest

The authors declare no conflicts of interest.

Appendix A

Figure A1. Domain setting of WRF-GC. Gray bordered grids represent the model grids of 27 × 27 km2 resolution.
Atmosphere 11 00433 g0a1
Table A1. Averages of the bottom-up NOx emissions (MEIC, prepared for year 2017) during the three periods and relative changes between the three periods: P1 (January 1 to January 23), P2 (January 24 to February 9), and P3 (February 10 to March 12).
RegionBottom-up Emission (Gg/Month)
P1P2P3P2vP1 1P3vP2P3vP1
East China1250.612321219−1% *−1% *−3% *
Shandong123124126.81% *2% *3% *
Guangdong46.746.147.1−1% *2%1%
Hubei45.344.143.6−3% *−1%−4% *
Zhejiang44.243.143.5−3% *1%−2%
Hunan39.93836.7−5% *−3% *−8% *
Chongqing22.921.820.9−5% *−4% *−9% *
Wuhan8.38.28.3−1% *1%0%
1 P2vP1 means the relative changes of bottom-up NOx emissions averaged during P2 versus those during P1, i.e., 100% × (P2-P1)/P1. The same logic applies to P3vP2 and P3vP1. * The difference between periods are not significant using ANOVA test with p-values < 0.05.

References

  1. The World Health Organization. Coronavirus Disease (COVID-19) Pandemic. Available online: https://www.who.int/emergencies/diseases/novel-coronavirus-2019 (accessed on 5 April 2020).
  2. Wikipedia. 2019–20 Coronavirus Pandemic in Mainland China. Available online: https://en.wikipedia.org/wiki/2019%E2%80%9320_coronavirus_pandemic_in_mainland_China (accessed on 5 April 2020).
  3. Pratitya. COVID-19 Timeline. Available online: https://github.com/Pratitya/COVID-19-timeline/blob/master/%E6%97%B6%E9%97%B4%E7%BA%BFTIMELINE.md (accessed on 20 April 2020).
  4. Caixin News. Back-to-Work Schedules of 31 Provinces. Available online: http://www.xinhuanet.com/politics/2020-02/02/c_1125520608.htm (accessed on 5 April 2020).
  5. Hubei COVID-19 Headquarter. Hubei Back-to-Work Notice. Available online: https://www.hubei.gov.cn/zhuanti/2020/gzxxgzbd/zxtb/202003/t20200311_2178823.shtml (accessed on 7 April 2020).
  6. Li, M.; Zhang, Q.; Kurokawa, J.I.; Woo, J.H.; He, K.; Lu, Z.; Ohara, T.; Song, Y.; Streets, D.G.; Carmichael, G.R.; et al. MIX: A mosaic Asian anthropogenic emission inventory under the international collaboration framework of the MICS-Asia and HTAP. Atmos. Chem. Phys. 2017, 17, 935–963. [Google Scholar] [CrossRef] [Green Version]
  7. Zhang, R.; Wang, Y.; Smeltzer, C.; Qu, H.; Koshak, W.; Boersma, K.F. Comparing OMI-based and EPA AQS in situ NO2 trends: Towards understanding surface NOx emission changes. Atmos. Meas. Tech. 2018, 11, 3955–3967. [Google Scholar] [CrossRef] [Green Version]
  8. Martin, R.V.; Jacob, D.J.; Chance, K.; Kurosu, T.P.; Palmer, P.I.; Evans, M.J. Global inventory of nitrogen oxide emissions constrained by space-based observations of NO2 columns. J. Geophys. Res. Atmos. 2003, 108, D17. [Google Scholar] [CrossRef] [Green Version]
  9. Streets, D.G.; Bond, T.C.; Carmichael, G.R.; Fernandes, S.D.; Fu, Q.; He, D.; Klimont, Z.; Nelson, S.M.; Tsai, N.Y.; Wang, M.Q.; et al. An inventory of gaseous and primary aerosol emissions in Asia in the year 2000. J. Geophys. Res. Atmos. 2003, 108, 8809. [Google Scholar] [CrossRef]
  10. Zhao, C.; Wang, Y. Assimilated inversion of NOx emissions over east Asia using OMI NO2 column measurements. Geophys. Res. Lett. 2009, 36, L06805. [Google Scholar] [CrossRef] [Green Version]
  11. Lin, J.T.; McElroy, M.B. Detection from space of a reduction in anthropogenic emissions of nitrogen oxides during the Chinese economic downturn. Atmos. Chem. Phys. 2011, 11, 8171–8188. [Google Scholar] [CrossRef] [Green Version]
  12. Gu, D.S.; Wang, Y.H.; Smeltzer, C.; Liu, Z. Reduction in NOx emission trends over China: Regional and seasonal variations. Environ. Sci. Technol. 2013, 47, 12912–12919. [Google Scholar] [CrossRef]
  13. Lin, J.-T.; Pan, D.; Zhang, R.-X. Trend and interannual variability of Chinese air pollution since 2000 in association with socioeconomic development: A brief overview. Atmos. Ocean. Sci. Lett. 2013, 6, 84–89. [Google Scholar] [CrossRef]
  14. Gu, D.; Wang, Y.; Smeltzer, C.; Boersma, K.F. Anthropogenic emissions of NOx over China: Reconciling the difference of inverse modeling results using GOME-2 and OMI measurements. J. Geophys. Res. Atmos. 2014, 119, 2014JD021644. [Google Scholar] [CrossRef]
  15. Gu, D.; Wang, Y.; Yin, R.; Zhang, Y.; Smeltzer, C. Inverse modelling of NOx emissions over eastern China: Uncertainties due to chemical non-linearity. Atmos. Meas. Tech. 2016, 9, 5193–5201. [Google Scholar] [CrossRef] [Green Version]
  16. Han, K.M. Temporal analysis of OMI-observed tropospheric NO2 columns over East Asia during 2006–2015. Atmosphere 2019, 10, 658. [Google Scholar] [CrossRef] [Green Version]
  17. Kong, H.; Lin, J.; Zhang, R.; Liu, M.; Weng, H.; Ni, R.; Chen, L.; Wang, J.; Yan, Y.; Zhang, Q. High-resolution (0.05° × 0.05°) NOx emissions in the Yangtze River Delta inferred from OMI. Atmos. Chem. Phys. 2019, 19, 12835–12856. [Google Scholar] [CrossRef] [Green Version]
  18. Zhang, Y.; Gautam, R.; Zavala-Araiza, D.; Jacob, D.J.; Zhang, R.; Zhu, L.; Sheng, J.-X.; Scarpelli, T. Satellite-observed changes in Mexico’s offshore gas flaring activity linked to oil/gas regulations. Geophys. Res. Lett. 2019, 46, 1879–1888. [Google Scholar] [CrossRef] [Green Version]
  19. Patel, K.; Stevens, J.; European Space Agency; NASA Aura team; NASA SPoRT team. Airborne Nitrogen Dioxide Plummets over China. Available online: https://earthobservatory.nasa.gov/images/146362/airborne-nitrogen-dioxide-plummets-over-china (accessed on 7 April 2020).
  20. Zhang, R.; Wang, Y.; He, Q.; Chen, L.; Zhang, Y.; Qu, H.; Smeltzer, C.; Li, J.; Alvarado, L.M.A.; Vrekoussis, M.; et al. Enhanced trans-Himalaya pollution transport to the Tibetan Plateau by cut-off low systems. Atmos. Chem. Phys. 2017, 17, 3083–3095. [Google Scholar] [CrossRef] [Green Version]
  21. Veefkind, J.P.; Aben, I.; McMullan, K.; Förster, H.; de Vries, J.; Otter, G.; Claas, J.; Eskes, H.J.; de Haan, J.F.; Kleipool, Q.; et al. TROPOMI on the ESA sentinel-5 precursor: A GMES mission for global observations of the atmospheric composition for climate, air quality and ozone layer applications. Remote Sens. Environ. 2012, 120, 70–83. [Google Scholar] [CrossRef]
  22. Van Geffen, J.; Eskes, H.J.; Boersma, K.F.; Maasakkers, J.D.; Veefkind, J.P. TROPOMI ATBD of the Total and Tropospheric NO2 Data Products; KNMI: De Bilt, The Netherlands, 2019. [Google Scholar]
  23. Schenkeveld, V.M.E.; Jaross, G.; Marchenko, S.; Haffner, D.; Kleipool, Q.L.; Rozemeijer, N.C.; Veefkind, J.P.; Levelt, P.F. In-flight performance of the ozone monitoring instrument. Atmos. Meas. Tech. 2017, 10, 1957–1986. [Google Scholar] [CrossRef] [PubMed] [Green Version]
  24. Van Geffen, J.; Boersma, K.F.; Eskes, H.; Sneep, M.; ter Linden, M.; Zara, M.; Veefkind, J.P. S5P TROPOMI NO2 slant column retrieval: method, stability, uncertainties and comparisons with OMI. Atmos. Meas. Tech. 2020, 13, 1315–1335. [Google Scholar] [CrossRef] [Green Version]
  25. Boersma, K.F.; Eskes, H.J.; Brinksma, E.J. Error analysis for tropospheric NO2 retrieval from space. J. Geophys. Res. Atmos. 2004, 109, D04311. [Google Scholar] [CrossRef]
  26. Boersma, K.F.; Eskes, H.J.; Richter, A.; De Smedt, I.; Lorente, A.; Beirle, S.; van Geffen, J.H.G.M.; Zara, M.; Peters, E.; Van Roozendael, M.; et al. Improving algorithms and uncertainty estimates for satellite NO2 retrievals: Results from the quality assurance for the essential climate variables (QA4ECV) project. Atmos. Meas. Tech. 2018, 11, 6651–6678. [Google Scholar] [CrossRef] [Green Version]
  27. Liu, M.; Lin, J.; Kong, H.; Boersma, K.F.; Eskes, H.; Kanaya, Y.; He, Q.; Tian, X.; Qin, K.; Xie, P.; et al. A new TROPOMI product for tropospheric NO2 columns over East Asia with explicit aerosol corrections. Atmos. Meas. Tech. Discuss. 2020, 2020, 1–22. [Google Scholar] [CrossRef]
  28. Lin, J.T.; Liu, M.Y.; Xin, J.Y.; Boersma, K.F.; Spurr, R.; Martin, R.; Zhang, Q. Influence of aerosols and surface reflectance on satellite NO2 retrieval: Seasonal and spatial characteristics and implications for NOx emission constraints. Atmos. Chem. Phys. 2015, 15, 11217–11241. [Google Scholar] [CrossRef] [Green Version]
  29. Lin, H.; Feng, X.; Fu, T.M.; Tian, H.; Ma, Y.; Zhang, L.; Jacob, D.J.; Yantosca, R.M.; Sulprizio, M.P.; Lundgren, E.W.; et al. WRF-GC: Online coupling of WRF and GEOS-Chem for regional atmospheric chemistry modeling, Part 1: Description of the one-way model (v1.0). Geosci. Model Dev. Discuss. 2020, 2020, 1–39. [Google Scholar] [CrossRef] [Green Version]
  30. Skamarock, W.C.; Klemp, J.B.; Dudhia, J.; Gill, D.O.; Barker, D.M.; Duda, M.G.; Huang, X.-Y.; Wang, W.J.; Powers, G. A Description of the Advanced Research WRF; Version 3 (No. NCAR/TN-475+STR); University Corporation for Atmospheric Research: Boulder, CO, USA, 2008. [Google Scholar] [CrossRef]
  31. Bey, I.; Jacob, D.J.; Yantosca, R.M.; Logan, J.A.; Field, B.D.; Fiore, A.M.; Li, Q.B.; Liu, H.G.Y.; Mickley, L.J.; Schultz, M.G. Global modeling of tropospheric chemistry with assimilated meteorology: Model description and evaluation. J. Geophys. Res. Atmos. 2001, 106, 23073–23095. [Google Scholar] [CrossRef]
  32. National Centers for Environmental Prediction; National Weather Service; National Oceanic and Atmospheric Administration; United States Department of Commerce. NCEP Global Forecast System (GFS) Analyses and Forecasts. In Research Data Archive at the National Center for Atmospheric Research; Computational and Information Systems Laboratory: Boulder, CO, USA, 2007. [Google Scholar] [CrossRef]
  33. Li, M.; Zhang, Q.; Streets, D.G.; He, K.B.; Cheng, Y.F.; Emmons, L.K.; Huo, H.; Kang, S.C.; Lu, Z.; Shao, M.; et al. Mapping Asian anthropogenic emissions of non-methane volatile organic compounds to multiple chemical mechanisms. Atmos. Chem. Phys. 2014, 14, 5617–5638. [Google Scholar] [CrossRef] [Green Version]
  34. Guenther, A.B.; Jiang, X.; Heald, C.L.; Sakulyanontvittaya, T.; Duhl, T.; Emmons, L.K.; Wang, X. The model of emissions of gases and aerosols from nature version 2.1 (MEGAN2.1): An extended and updated framework for modeling biogenic emissions. Geosci. Model Dev. 2012, 5, 1471–1492. [Google Scholar] [CrossRef] [Green Version]
  35. Hudman, R.C.; Moore, N.E.; Mebust, A.K.; Martin, R.V.; Russell, A.R.; Valin, L.C.; Cohen, R.C. Steps towards a mechanistic model of global soil nitric oxide emissions: Implementation and space based-constraints. Atmos. Chem. Phys. 2012, 12, 7779–7795. [Google Scholar] [CrossRef] [Green Version]
  36. Kenagy, H.S.; Sparks, T.L.; Ebben, C.J.; Wooldrige, P.J.; Lopez-Hilfiker, F.D.; Lee, B.H.; Thornton, J.A.; McDuffie, E.E.; Fibiger, D.L.; Brown, S.S.; et al. NOx Lifetime and NOy Partitioning During WINTER. J. Geophys. Res. Atmos. 2018, 123, 9813–9827. [Google Scholar] [CrossRef]
  37. Shah, V.; Jacob, D.J.; Li, K.; Silvern, R.F.; Zhai, S.; Liu, M.; Lin, J.; Zhang, Q. Effect of changing NOx lifetime on the seasonality and long-term trends of satellite-observed tropospheric NO2 columns over China. Atmos. Chem. Phys. 2020, 20, 1483–1495. [Google Scholar] [CrossRef] [Green Version]
  38. Yeung, K. Coronavirus: Zhejiang Province Orders Relaxation of Excessive Controls to Allow Life to Return to Normal. Available online: https://www.scmp.com/economy/china-economy/article/3049821/coronavirus-chinese-province-orders-relaxation-excessive (accessed on 5 April 2020).
  39. Wikipedia. Zhenhai District. Available online: https://en.wikipedia.org/wiki/Zhenhai_District (accessed on 5 April 2020).
  40. He, L.; Cui, L.; Ma, X.; Li, L.; Wei, Y.; Zheng, M. Economic Powerhouse Leads Legislation in Beefing up Private Sector. Available online: http://www.xinhuanet.com/english/2020-01/22/c_138727326.htm (accessed on 20 April 2020).
  41. National Helath Commission of the People’s Republic of China. Live Data of COVID-19 Cases in China. Available online: https://datanews.caixin.com/interactive/2020/pneumonia-h5/#live-data (accessed on 7 April 2020).
  42. The World Bank. Exports of Goods and Services (Percentage of GDP). Available online: https://data.worldbank.org/indicator/NE.EXP.GNFS.ZS?locations=CN (accessed on 5 April 2020).
  43. Wikipedia. Curfews and Lockdowns Related to the 2019–20 Coronavirus Pandemic. Available online: https://en.wikipedia.org/wiki/Curfews_and_lockdowns_related_to_the_2019%E2%80%9320_coronavirus_pandemic (accessed on 20 April 2020).
Figure 1. (ac) TROPOMI tropospheric NO2 VCDs (NO2TROPOMI) averaged during the three periods. (df) Relative changes between periods.
Atmosphere 11 00433 g001
Figure 2. (ac) Top-down NOx emissions summed up in each province during the three periods. (df) Top-down NOx emission rates (emission per area) of each province during the three periods. (gi) Relative changes of top-down emissions between the periods.
Atmosphere 11 00433 g002
Figure 3. Relative changes between the three periods of individual modeled region, represented by the annotated circles. Colored contours represent the relative changes between top-down emissions during P3 vs these during P1.
Atmosphere 11 00433 g003
Figure 4. (ah) Daily top-down emissions (black dots) in different regions. The horizontal black dash lines represent bottom-up emissions (MEIC) to show the a priori knowledge of the month-to-month variation of NOx emissions. The blue solid line represents 15-day center moving averages of daily top-down emissions, and the error bars represent corresponding standard deviations of the data in the 15-day window. Vertical red and green dashed lines represent the dates of Wuhan lockdown and official back-to-work day.
Atmosphere 11 00433 g004
Table 1. Averages and standard deviations (temporal variability) of NO2TROPOMI during three periods and the relative changes between the three periods.
RegionNO2TROPOMI ± Standard Deviation (1015 Molecules/cm2)NO2TROPOMI Relative Changes (%)
P1P2P3P2vP1 1P3vP2P3vP1
East China4.1 ± 1.02.0 ± 0.42.3 ± 0.5−52% *19% *−43% *
Shandong13.1 ± 5.93.8 ± 1.14.8 ± 2.0−71% *26%−63% *
Guangdong3.9 ± 0.92.2 ± 0.62.7 ± 0.8−45% *22%−33% *
Hubei2.5 ± 0.61.6 ± 0.62.0 ± 0.7−37% *25%−21%
Zhejiang4.2 ± 1.42.1 ± 1.12.9 ± 1.0−49% *38% *−30% *
Hunan2.7 ± 1.01.8 ± 0.92.4 ± 0.9−33%33%−11%
Chongqing4.0 ± 1.82.8 ± 1.32.7 ± 1.0−30%−5%−33% *
Wuhan5.1 ± 1.43.3 ± 1.83.3 ± 1.1−35% *0%−35% *
1 P2vP1 means the relative changes of NO2TROPOMI averaged during P2 versus those during P1, i.e., 100% × (P2-P1)/P1. The same logic applies to P3vP2 and P3vP1. * The differences between periods are significant using ANOVA test with p-values < 0.05.
Table 2. Averages and standard deviations (temporal variability) of top-down NOx emissions during the three periods and the relative changes between the three periods.
RegionTop-Down Emission ± Standard Deviation (Gg/Month)Relative Changes
P1P2P3P2vP1 1P3vP2P3vP1
East China1589 ± 449795 ± 2361001 ± 283−50% *26% *−37% *
Shandong135 ± 7351 ± 2876 ± 53−62% *48%−44% *
Guangdong74 ± 2441 ± 1651 ± 19−43% *23%−30% *
Hubei27 ± 1018 ± 823 ± 8−34% *32%−13%
Zhejiang41 ± 1723 ± 1638 ± 22−44% *67% *−6%
Hunan38 ± 925 ± 1946 ± 30−34%85% *22%
Chongqing31 ± 1732 ± 1524 ± 101%−24%−23%
Wuhan4 ± 22 ± 13 ± 0−41% *13%−33% *
1 P2vP1 means the relative changes of top-down NOx emissions averaged during P2 versus those during P1, i.e., 100% × (P2-P1)/P1. The same logic applies to P3vP2 and P3vP1. * The difference between periods are significant using ANOVA test with p-values < 0.05.

