Article

Indoor Comfort and Symptomatology in Non-University Educational Buildings: Occupants’ Perception

by
Miguel Ángel Campano-Laborda
,
Samuel Domínguez-Amarillo
,
Jesica Fernández-Agüera
* and
Ignacio Acosta
Instituto Universitario de Arquitectura y Ciencias de la Construcción, Escuela Técnica Superior de Arquitectura, Universidad de Sevilla, 41012 Seville, Spain
*
Author to whom correspondence should be addressed.
Atmosphere 2020, 11(4), 357; https://doi.org/10.3390/atmos11040357
Submission received: 14 February 2020 / Revised: 17 March 2020 / Accepted: 2 April 2020 / Published: 7 April 2020

Abstract

:
The indoor environment in non-university classrooms is one of the most analyzed problems in the thermal comfort and indoor air quality (IAQ) areas. Traditional schools in southern Europe are usually equipped with heating-only systems and naturally ventilated, but climate change processes are both progressively increasing average temperatures and lengthening the warm periods. In addition, air renewal is relayed in these buildings to uncontrolled infiltration and windows’ operation, but urban environmental pollution is exacerbating allergies and respiratory conditions among the youth population. In this way, this exposure has a significant effect on both the academic performance and the general health of the users. Thus, the analysis of the occupants’ noticed symptoms and their perception of the indoor environment is identified as a potential complementary tool to a more comprehensive indoor comfort assessment. The research presents an analysis based on environmental sensation votes, perception, and indoor-related symptoms described by students during lessons contrasted with physical and measured parameters and operational scenarios. This methodology is applied to 47 case studies in naturally ventilated classrooms in southern Europe. The main conclusions are related to the direct influence of windows’ operation on symptoms like tiredness, as well as the low impact of CO2 concentration variance on symptomatology because they usually exceeded recommended levels. In addition, this work found a relationship between symptoms under study with temperature values and the environmental perception votes, and the special impact of the lack of suitable ventilation and air purifier systems together with the inadequacy of current thermal systems.

1. Introduction

1.1. State of the Art

Non-university educational buildings are one of the most widespread building typologies, in which teenagers, a more sensitive population than adults and with specific different thermal preferences due to their different metabolic rate values [1,2,3,4], spend more than 25% of their day time during winter and midseasons. Thus, indoor environment in non-university classrooms is one of the most analyzed problems in the thermal comfort and indoor air quality (IAQ) areas [5], being widely studied for cold [6,7,8,9,10], mild [11,12,13,14,15,16,17], and warm climates [18].
Traditional schools in southern Europe solve thermal control basically by heating-only systems (without mechanical ventilation), relying on air renewal to uncontrolled infiltration and users’ frequent windows’ operation, much more than usually found in central and northern Europe. This develops a behavior that could be defined as hybrid or mixed mode, with thermal systems operated and with a significant part of the time with the windows open. In addition, climate change processes are progressively lengthening the warm periods with greater presence within the school season. In addition, urban environmental pollution and pollen are exacerbating allergies and respiratory conditions among the youth population [19,20], especially in the case of outdoor atmospheric particulate matter (PM) with a diameter of less than 2.5 micrometers (PM 2.5) [12,21,22]. This context generates a situation of specificity where further study is necessary, given the different exposure scenarios with a greater influx from the outside although varying over time.
Given that ventilation is one of the main variables which affects the degree of environmental comfort [23,24], the European ventilation standard EN 13779:2008 [25], through its Spanish transposition [26], establishes a minimum outdoor airflow to guarantee the adequate indoor air quality (IAQ) in non-residential buildings. Mainly, its focus is to control CO2 concentration, pollutants, and suspended particles [27] to avoid the development of symptomatology and respiratory health related to prolonged periods of exposure [28]. According to the national regulation, this ventilation must be mechanically controlled since 2007, also including an air filtering system, to ensure this IAQ, but given that the adaptation could entail a huge investment and a higher energy consumption, several public institutions in Spain are imposing natural ventilation as the only system for IAQ control, against standards.
In this way, previous studies in classrooms of southern Spain [16,17], Portugal [12], France [29], Italy [30], and other south European locations [31] have shown poor indoor conditions, both thermal and clean air, which can relate to the appearance of symptoms like dizziness, dry skin, headache, or tiredness. This environmental exposure has a significant effect on both the academic performance [32,33,34], the general health of the users and their psychological and social development [35], existing evidences of poor indoor air quality in schools with correlation with negative effects on the students’ health, which potentially can lead to asthma or allergic diseases [36], which are two of the most prevalent diseases in children and young people [37], and can be mainly related to the high values found in classrooms for bacteria and PM, given their pro-inflammatory role [38].
In this way, previous studies in European schools analyzed the link between the IAQ conditions, obtained through measurements of CO2, PM, and volatile organic compounds (VOCs), with health questionnaires made by parents, spirometry, exhaled nitric oxide tests, and asthma tests with medical kits [29,38]. This approach required complex equipment and tests, and were not directly related to on-site symptomatology but to long-term symptom development, as it was gathered in housing studies [39]. Users’ perception of environmentally related symptoms had a direct potential to draw an actual comfort situation, not only determined by room-physical conditions but to occupants’ responses, as was shown in [40,41,42,43], also with the capacity to identify individual answers, such as those related to gender or emotional situation [44,45,46].
Thus, the analysis of the occupants’ symptoms and their environmental perception was identified as a potentially affordable complementary tool to obtain a more accurate indoor comfort condition assessment with a high degree of widespread applicability, together with the widely accepted rational (RTC) [23,47,48] or adaptive (ATC) [49,50] thermal comfort indicators, especially those analyzed in the Mediterranean area including educational buildings [51,52,53] or in non-air conditioned buildings in warm climates [54].

1.2. Objectives

The first objective of this research was to present the physical and operational characterization of the indoor environment of a representative sample of multipurpose classrooms in a wide area of southern Spain, as well as the environmental perception votes, personal clothing, and symptoms expressed by the occupants (aged 12–17 years) exposed to this environment during the measurement campaigns.
The second objective of the study was to contrast environmental sensation votes, perception, and indoor-related symptoms described by students during lessons with physical and environmental parameters and operational scenarios (focusing on windows’ and doors’ operation), in order to evaluate the impact and relationship between them.

2. Methods and Materials

The acquisition of both the physical measurement data and the occupants’ sensation votes during a normal school day was developed through the following phases:
(1)
Definition of the study sample;
(2)
Characterization of the airtightness of the samples;
(3)
Field measurements; and
(4)
Design and distribution of surveys.
The data collection was performed both in winter and midseason in two sets per day: One in the early morning, at the beginning of the first lesson, and another previous to the midmorning break.

2.1. Definition of the Study Sample

The study sample was composed of 47 multipurpose classrooms (for ages 12–17) from 8 educational buildings, selected from the most representative climate zones of the region of Andalusia according to the Spanish energy performance zoning [55,56,57] (zones A4, B4, C3, and C4), which include temperate to cold zones in winter (types A, B, or C), as well as average to warm summers (3 or 4). These zones can also be classed in the Köppen climate scale [58] as cold semi-arid climate (Köppen BSk) and hot summer Mediterranean climate (Köppen CSa), as it can be seen in Table 1.
These multipurpose classrooms followed the design standards established by the regional educational agency (Andalusian Agency of Public Education) [59], with classrooms measuring approximately 50 m² and 3 meters high for accommodating up to 30 students with their teacher. This standard also defined the common access corridor with the adjoining classrooms and the distribution of the furniture, as well as the location of the windows to the left of the occupants and the two entrance doors in the partition to the corridor, as it can be seen in Figure 1.
The most common composition of the external vertical wall was a brick masonry cavity wall with some kind of thermal insulation with a simple hollow brick wall with plaster setting in the inner surface. The internal partitions were usually composed of a half-brick wall with plaster on either side.
The regional standards established hot water (HW) radiators as the main heating system of schools, with no provision for cooling systems [59]. In this way, all the classrooms under study were equipped with this heating system and, in addition, two of the schools had some add-on split-systems for cooling. Ventilation is traditionally performed in the Mediterranean area by user windows’ operation and uncontrolled infiltrations. Despite the current Spanish standard on thermal installations in buildings (RITE) [26] that establishes the mechanical ventilation as the only option for new non-residential buildings, these systems are not normally started up in order to save energy when the building is equipped with them.

2.2. Characterization of the Airtightness of the Samples

The assessment of the infiltration level of the classrooms under study was performed by a series of airtightness tests (doors and windows closed) in order to obtain their expected average infiltrations rates (Figure 2). These tests consisted of decreasing the room pressure by using a fan, which extracted air until the indoor-outdoor differential pressure was stabilized. It was achieved by balancing the extracted airflow with the entering airflow through the envelope cracks. Then, the depressurization was decreased in steps by lowering the fan speed, in order to obtain the regression curve of the pressure/extracted airflow relation, which showed the entering airflow when the indoor pressure was equal to the atmospheric one.
These tests were performed by using enclosure pressurization-depressurization equipment or “blower door”, as specified in the ISO standard 9972: 2015 [6], considering each classroom as a single zone to be analyzed. The specific model used was the Minneapolis Blower Door Model 4/230 V System, which was controlled by the TECTITE Express software.
The higher-pressure difference used to create this regression curve must be at least ± 50 Pa; in this study, it was reached until a ± 70 Pa differential pressure.
When the classroom had a single access point, the pressurization-depressurization test characterized the airflow that can pass through the envelope by sealing the corresponding door and the adjacent classrooms and common area. However, in most of the studied classrooms there were two access points, so it was necessary to perform three measurements in each classroom, changing the location of the blower door and sealing, or not, and the door in which the blower door was disposed. In this way, it was possible to determine the real airflow that entered the classroom during its normal operation. Adjacent classrooms and common area were sealed, too.
This protocol was designed for medium rooms with two access doors like the one under study, and required three different measurements (Figure 2):
  • Airtight test 1 (AT1) to obtain V50,P1: Blower door was placed in door A, and door B and windows were closed but not sealed.
  • Airtight test 2 (AT2) to obtain V50,P2: Blower door was placed in door B, and door A and windows were closed but not sealed.
  • Airtight test 3 (AT3) to obtain V50,P3: Blower door was placed in door B, and door A was sealed and windows were closed but not sealed.
where V50 P1 is the air leakage rate at 50 Pa in Protocol 1, V50 P2 is the air leakage rate at 50 Pa in Protocol 2, V50 P3 is the air leakage rate at 50 Pa in Protocol 3.
Infiltration values measured in each of these three ± 50 Pa depressurization test hypotheses, developed in each classroom, were obtained by the following expressions of the British Standard 5925 standard, obtained from a simplification of the “crack flow equation”:
n 50 , A T 1 = V 50 , D o o r A + V 50 , e n v V
n 50 , A T 2 = V 50 , D o o r B + V 50 , e n v V
n 50 , A T 3 = V 50 , e n v V
n 50 , t = V 50 , D o o r A + V 50 , D o o r B + V 50 , e n v V
n 50 , t = n 50 , P 1 + n 50 , P 2 n 50 , P 3
where n50,AT1 is the infiltration rate at 50 Pa in protocol 1, in h−1; n50,AT2 is the infiltration rate at 50 Pa in protocol 2, in h−1; n50,AT3 is the infiltration rate at 50 Pa in protocol 3, in h−1; n50,t is the infiltration rate at 50 Pa through the envelope and doors of the room, in h−1. V50,DoorA is the air leakage rate at 50 Pa which circulates through door A, in m3/h; V50,DoorB is the air leakage rate at 50 Pa which circulates through door B, in m3/h; V50,env is the air leakage rate at 50 Pa which circulates through the envelope, in m3/h; V is the internal volume of the room, in m3.

2.3. Field Measurements

The measurement campaign was developed in the selected classrooms according a data collection protocol [16,17,60] in which physical parameters relating to hygrothermal comfort, CO2 concentration, and illuminance were obtained in a spatial matrix [61] previously and throughout the survey distribution period (30 min, twice per day), taking the average of the values obtained, both outdoor and indoor, as can be seen in Figure 3 and Table 2:
During the measurements both the initial state and the operation of doors, windows, solar devices, heating systems, and electric lighting, as well as changes in the occupants’ distribution, were collected. Performance and uncertainty of measurement instrumental are described in Table 3:
Mean radiant temperature ( t ¯ r , in °C) was calculated using Equation (6) [63]:
t r ¯ = [ ( t g + 273 ) 4 + 1.10 · 10 8 · v a 0.6 ε · D g 0.4 · ( t g T a ) ] 1 4 273 ,
where va is air velocity (in m/s), Ta is dry bulb air temperature (°C), tg is black globe temperature (°C), ɛ is emissivity (dimensionless, 0.95 for black globe), and Dg is globe diameter (m).
The operative temperature (to, in °C) was obtained through Equations (7) and (8) [64]:
T o = A   ×   T a + ( 1 A ) × t r ¯
A = { 0.5        if   V a < 0.2   m / s 0.6        if   0.2   m / s   v a < 0.6   m / s 0.7        if   0.6    m / s v a < 1.0   m / s
where va is air velocity (in m/s), Ta is dry bulb air temperature (°C), and tg is black globe temperature (°C).

2.4. Design and Distribution of Surveys

The survey was designed to collect information and votes from occupants in order to comprehensively assess the environment in conjunction with the measurement of the physical parameters. The survey design was based on the experience of previous research [16,17,60,61,65] with the aim to collect data with an objective approach. The completion of the survey took around 20 minutes per classroom, being distributed during the measurement campaigns, and were performed twice per day both in a winter and a midseason day.
The survey distributed included questions about the following issues (the specific layout of the questionnaire is presented in Appendix A):
(1)
The occupant’s age and sex.
(2)
The respondent’s position inside the classroom.
(3)
The occupant’s thermal vote [23] for:
  • Sensation: Thermal sensation vote (TSV) using the 7-points ASHRAE scale.
  • Preference: Thermal preference vote (TPV) using the 7-points ASHRAE scale.
  • Acceptance: Thermal environment rejection percentage (PDacc) from 0 (rejection) to 1 (acceptance).
  • Level of comfort: Thermal comfort vote (TCV) from 4 (extremely uncomfortable) to 0 (comfortable).
(4)
The occupant’s environmental perception vote (EPV) from 4 (repugnant odor) to 0 (without odor).
(5)
Symptoms and related health effects during the measurements:
Difficulty concentrating (DC).
Dry throat (DT).
Dizziness (D).
Itchiness (I).
Dry skin (DS).
Nausea (N).
Nasal congestion (NC).
Eye irritation (EI).
Headache (H).
Chest oppression (CO).
Tiredness (T).
The perception of the hygrothermal environment was formulated to the occupants according the protocol established in the Spanish version of Standard ISO 10551 [66].
The clothing insulation values worn by the occupants were obtained from the surveys and subsequently quantified according to EN ISO 9920 [67] and EN ISO 7730 [23], considering the corrections proposed by Havenith et al. [68] for seated occupants, with a thermal insulation of clothing (Icl) lower than 1.84 clo and air velocities under 0.15 m/s.
In addition, the protocol for the analysis of the surveys included a screening for the exclusion of the sample when the participant had previous and subsequent symptoms, related health problems, were developing some sickness, were taking medication for a long time, or when a strange answer was found for the multiple choices of a given question. In this way, during the measurements, a total number of 977 valid surveys was obtained (Table 4).

3. Results

The results of the present study, part of a PhD dissertation [69], can be grouped into five subsections:
  • Mean values of physical parameters;
  • Mean values of airtightness of the samples;
  • Mean values of occupants’ votes;
  • Mean values of occupants’ clothing insulation; or
  • Mean values of occupants’ symptoms and related health effects.
These values were analyzed according to seasons (winter, W, and midseasons, MS) and windows’ and doors’ operation (open windows, OW, closed windows, CW, open door, OD). In this way, 26 classrooms (55% of the case studies) had the windows closed during the measurement period, with 23 of these during the winter session, and 21 had the windows open (45% of the case studies), with 11 of them during the winter period. No intervention by the researchers was made to modify classroom-state, allowing us to gather operational actual conditions.

3.1. Mean Values of Physical Parameters

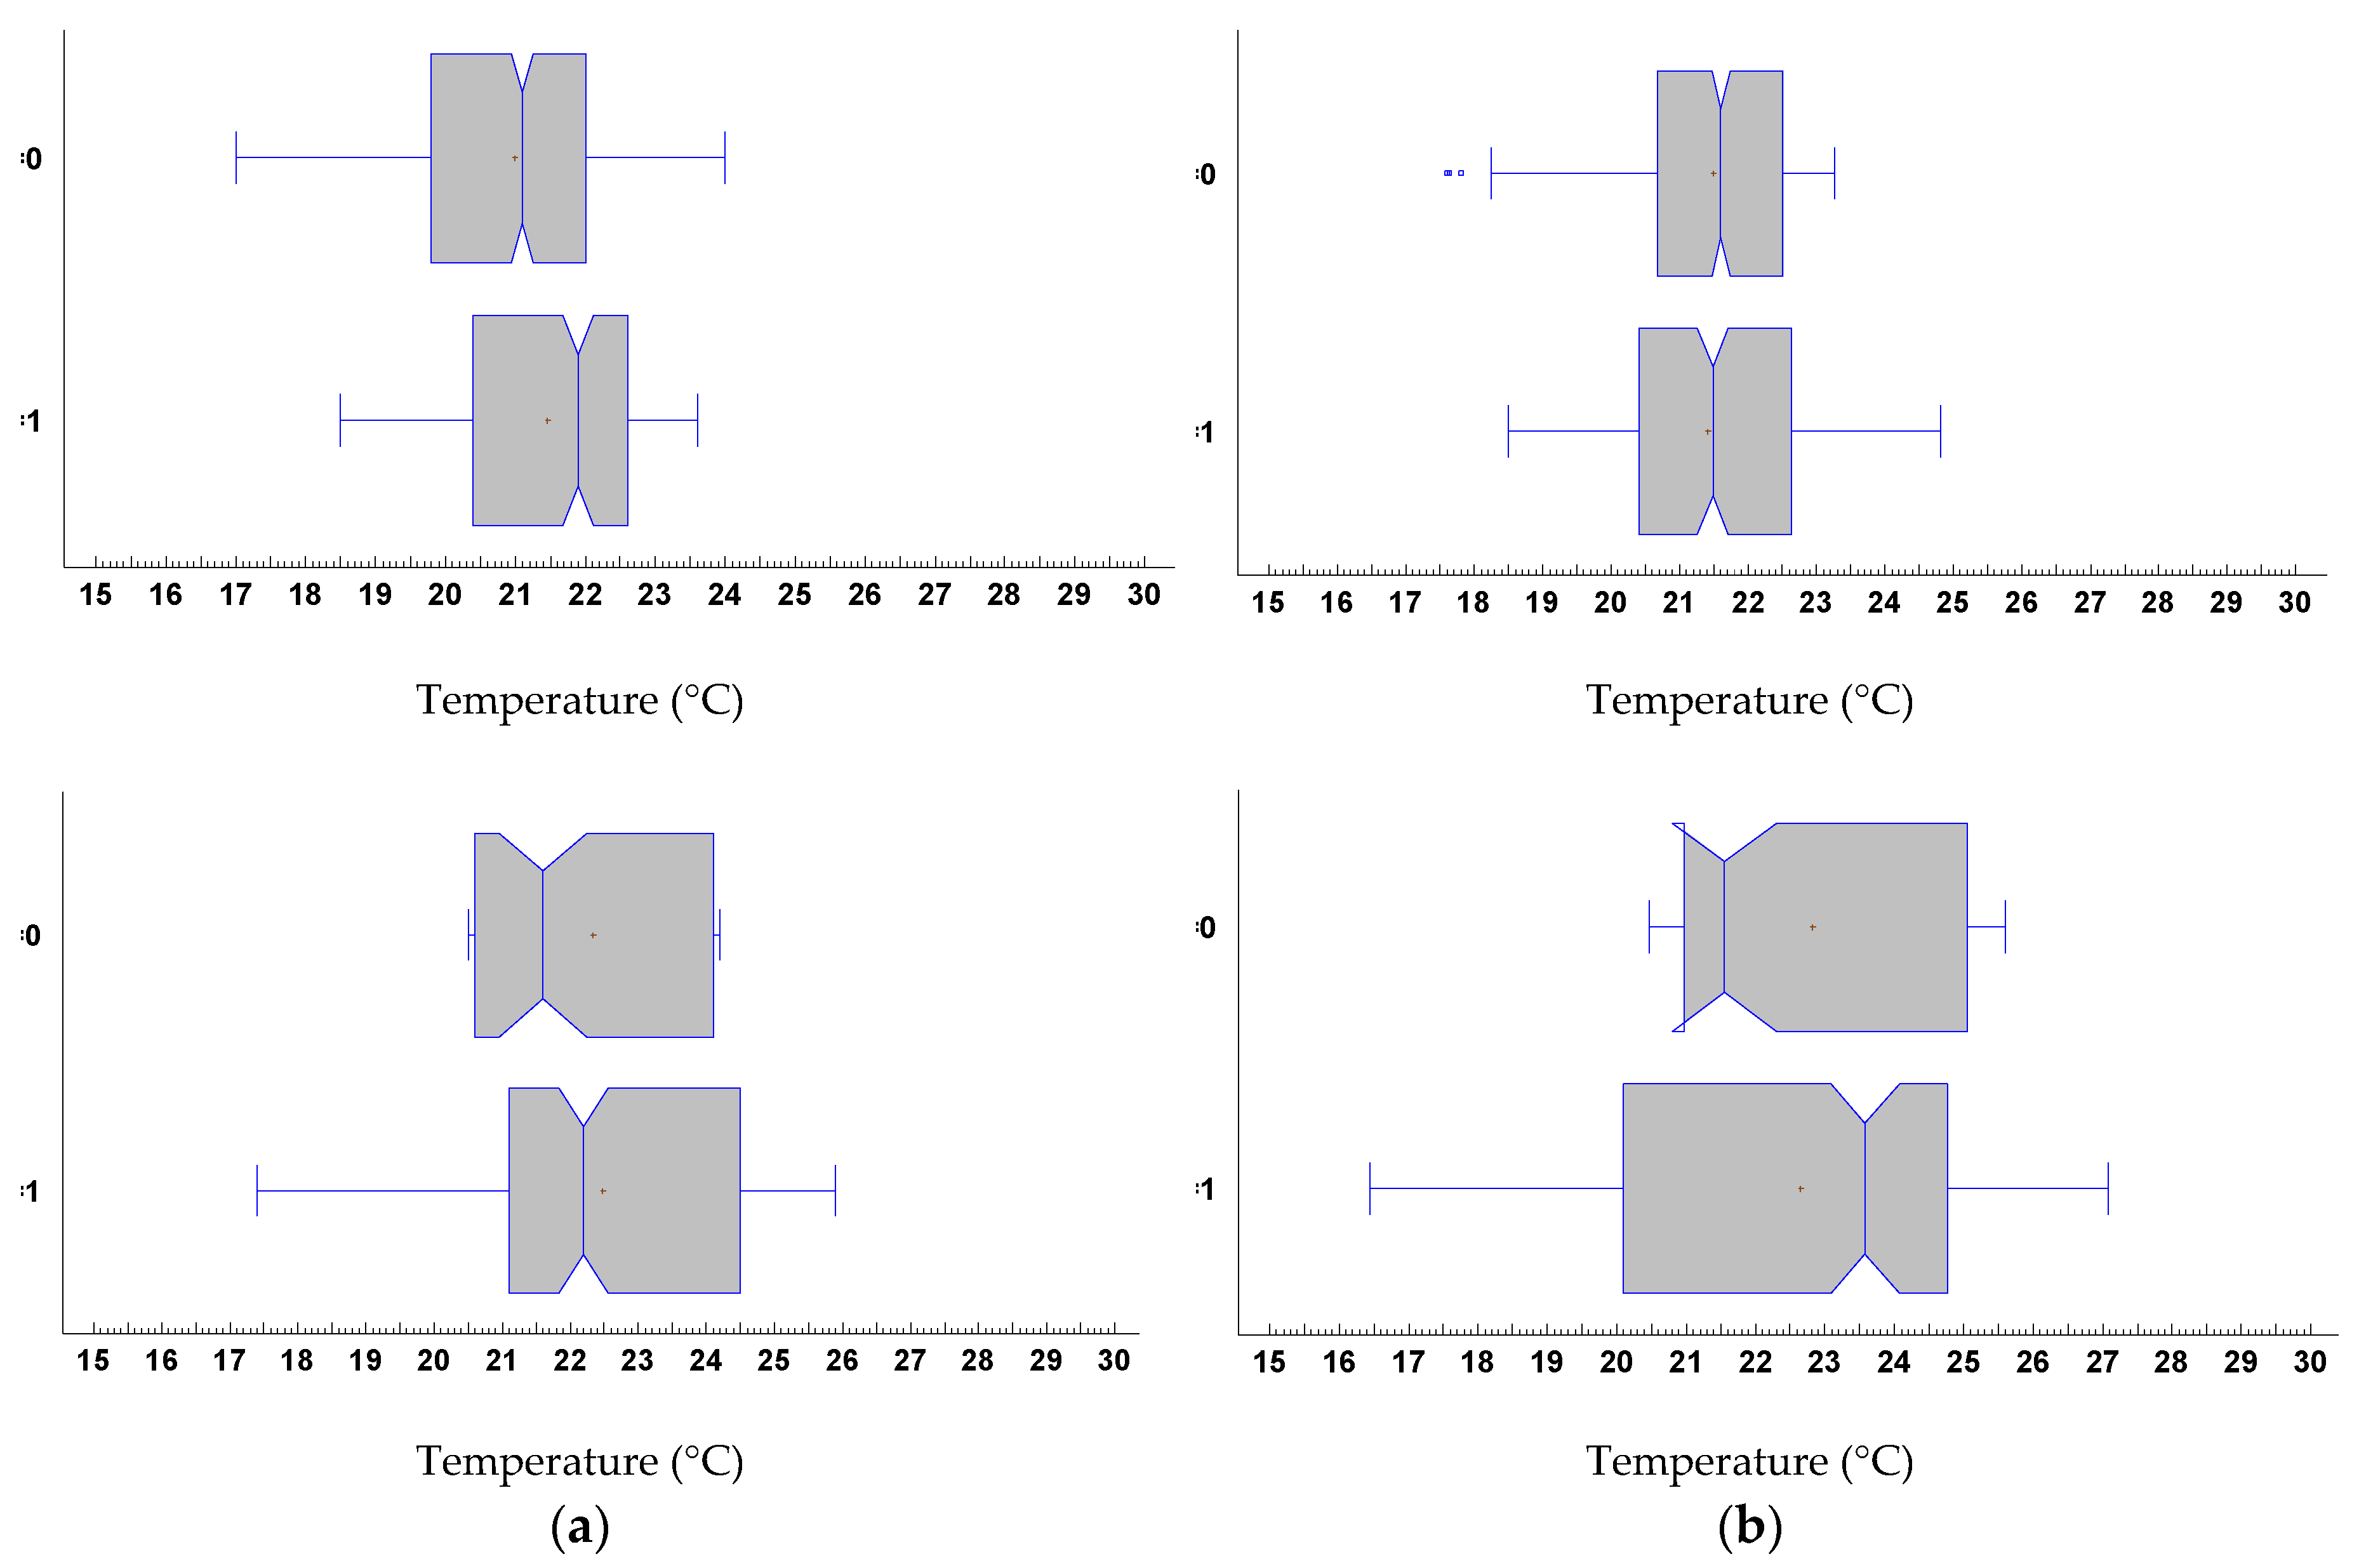
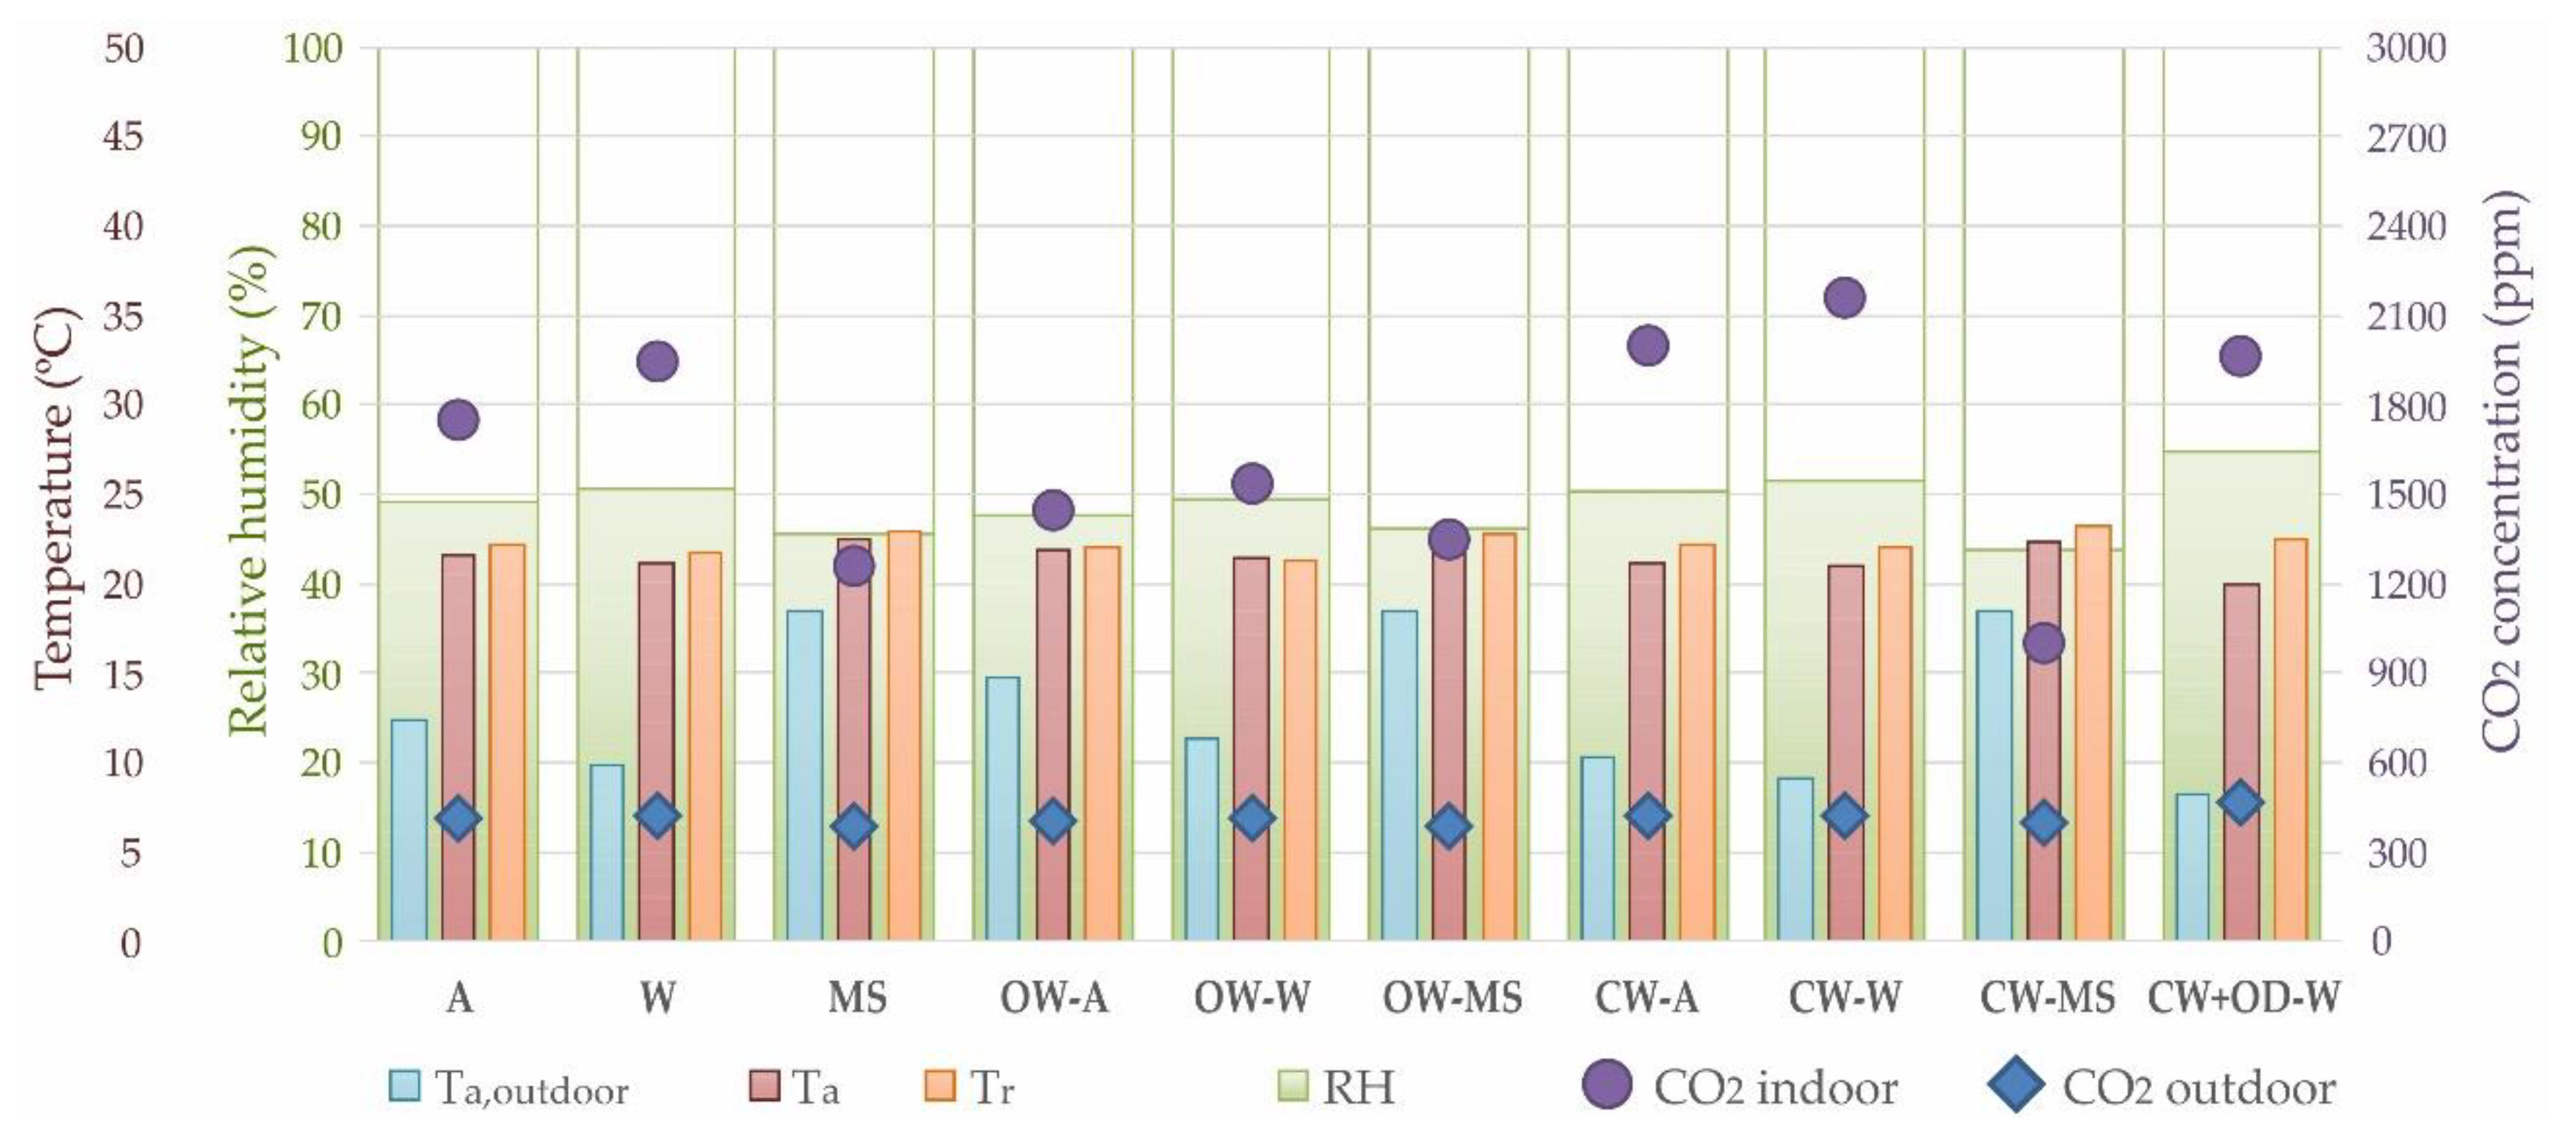
The measured interior air temperature (Ta) ranged between 17.8 and 22.7 °C during winter season (Table 5), with the lowest mean temperature values obtained for the case studies with closed windows, especially when inner doors were open, with values of 20 °C. It can be related with the outdoor conditions, given that the lowest outdoor temperature values (Ta, outdoor) were measured for classrooms with closed windows and open inner doors. In addition, 8 of the case studies had the windows open during winter, which can mean that there was a bad regulation of the heating system and the heat excess had to be dissipated, or that the students considered that they had to ventilate the classroom due to a poor environment perception. Indoor air temperature in midseasons was oscillating around 22.4 °C, without a direct relation with window operation. Although winter time temperature expectations range between near 20–22 °C to 20.4–22.6 °C if windows are open (central quartile lower and upper values), this band nearly doubles in middle season, when temperatures from 20.6 to 24 °C may be expected (21.1 to 24.5 °C if windows are open). A quartile distribution plot for indoor thermal parameters, air temperature, and operative temperature is proposed in Figure 4. It is noteworthy to highlight that there was a statistical significance between seasons in a windows-state with independent behavior aspect that was verified through test of comparison of samples, F-test for the variance and a K-S (Kolmogórov-Smirnov) for the distributions of probability with p-values under 0.05 in all the cases.
Although average values of mean radiant temperature ( t r ¯ ) were within the recommended operating temperature ranges for classrooms according to ISO 7730 standard [23] (22.0 ± 2.0 °C for category B), there was a high dispersion of figures with a standard deviation (SD) between 1.7 °C in winter with closed windows and 3.7 °C in midseasons with open windows, which was due to the operation of HW radiator system, especially when windows were open, with t r ¯ values of 27.2–28.0 °C with radiators on and values of 17.5–19.0 °C when radiators were turned off. This caused operative temperature to swing usually between 20 and 25 (central quartiles) during middle season, with typical values of 20.6 to 22.5 °C during winter, with a very similar band of 20.4 to 22.6 °C if windows were open, highlighting the effect of surface thermal control performed by the radiator heating system.
Relative humidity (RH) in winter was always over 40%, with a maximum value of 64% in the case of one of the classrooms with windows closed and inner doors opened. In midseasons, relative humidity was lower but with a higher oscillation, with a minimum value of 29%.
Air velocity (Va) values were oscillating under 0.05 m/s, both in winter and midseasons, only exceeding the recommended design limit for comfort category B established by the ISO 7730 standard [23] of 0.16 m/s in one of the case studies with open windows, with a value of 0.18 m/s. In the case of closed windows, air velocity was always under 0.09 m/s. This showed poor air movement and limited air displacement potential.
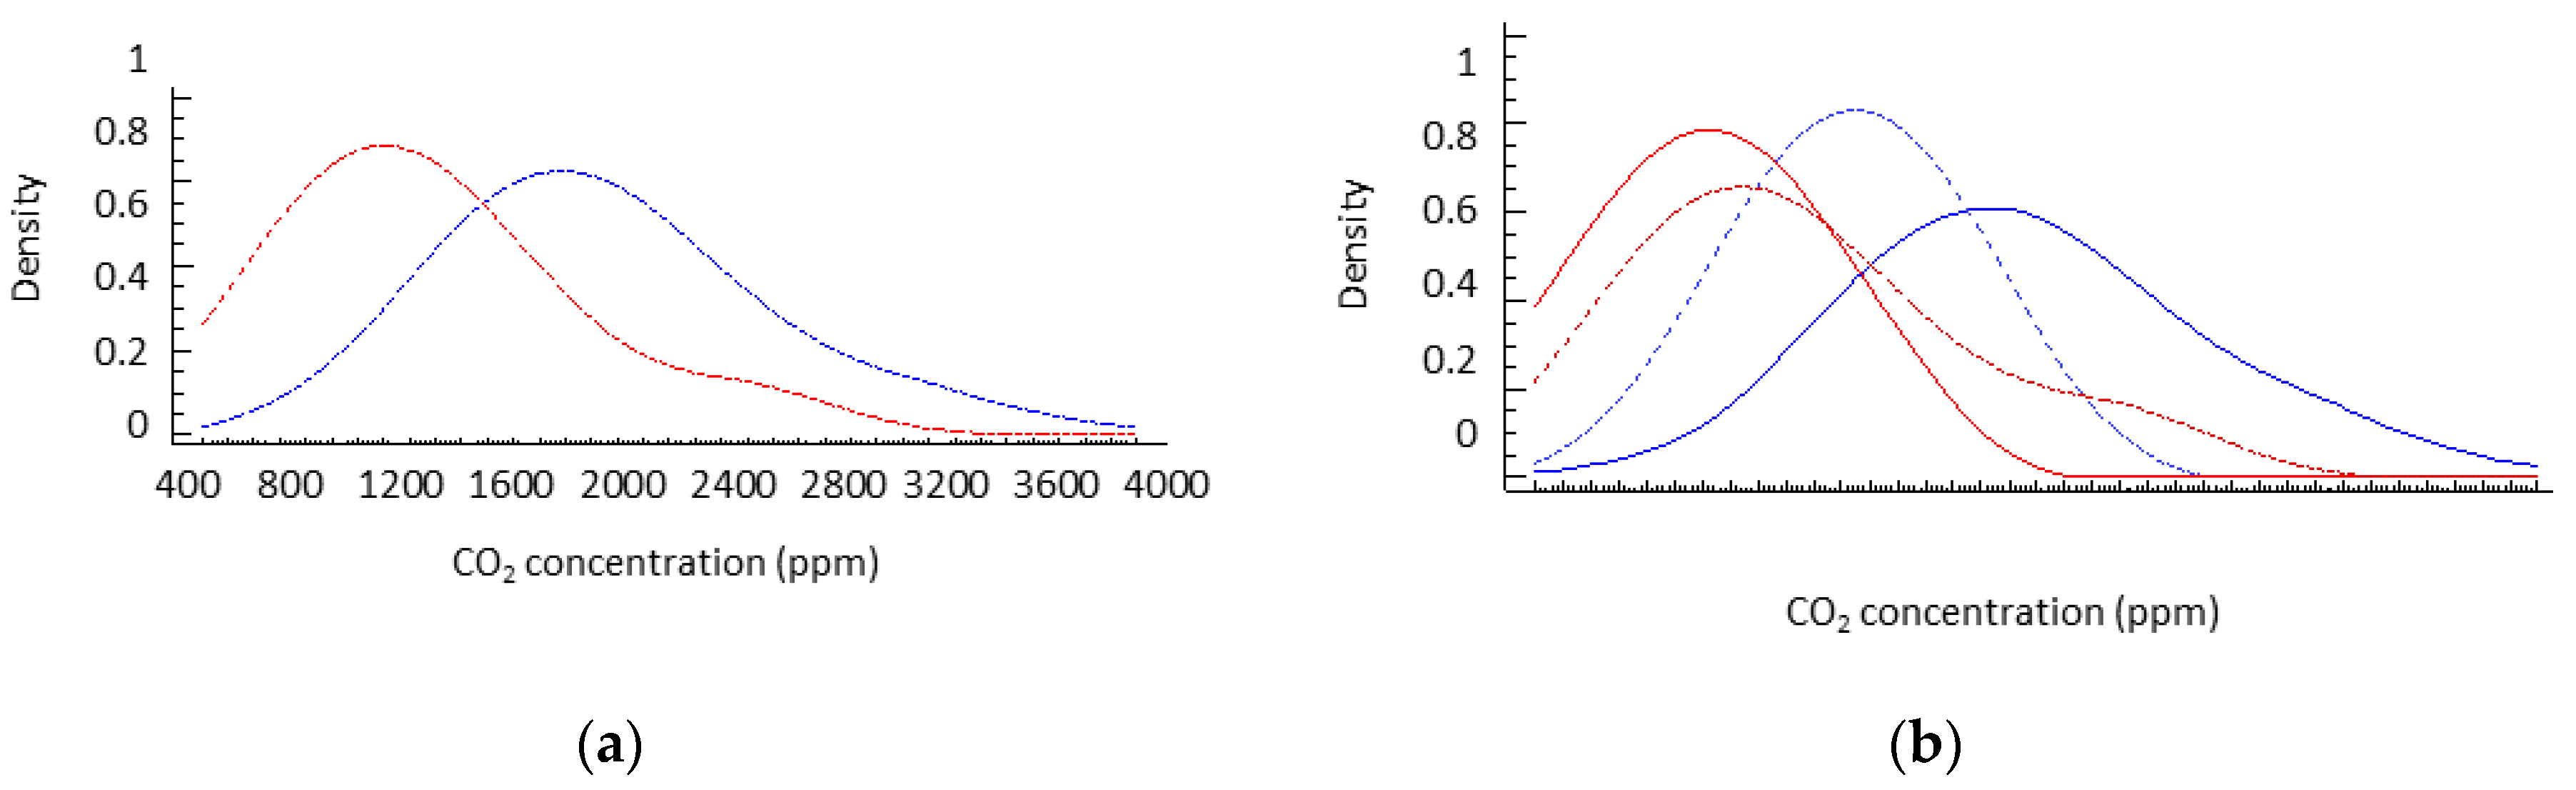
Measurements of the CO2 concentration usually show figures well above typical thresholds (Figure 5). The World Health Organization (WHO) recommends a limit for healthy indoor spaces of 1000 ppm [70]. In this way, the probability distribution derived from the measures showed that more than 92% of the distribution for closed windows was above this limit, while this only decreased to 88% of the time when windows were open. In addition, 47.5% of classrooms with windows closed exceeded the 2000 ppm threshold. The greatest relative effect of window operation was seen in the winter, when CO2 concentration can be decreased by 25%, comparing median values. However, figures were above desirable levels, indicating the lack of capacity of the window operation to solve a suitable ventilation. In general, during the intermediate season, the operation of the windows did not provide a significant improvement of indoor air quality, which may be related to the lack of thermal differential between indoor and outdoor air, limiting the air exchange due to the absence of a thermodynamic effect (Figure 6).
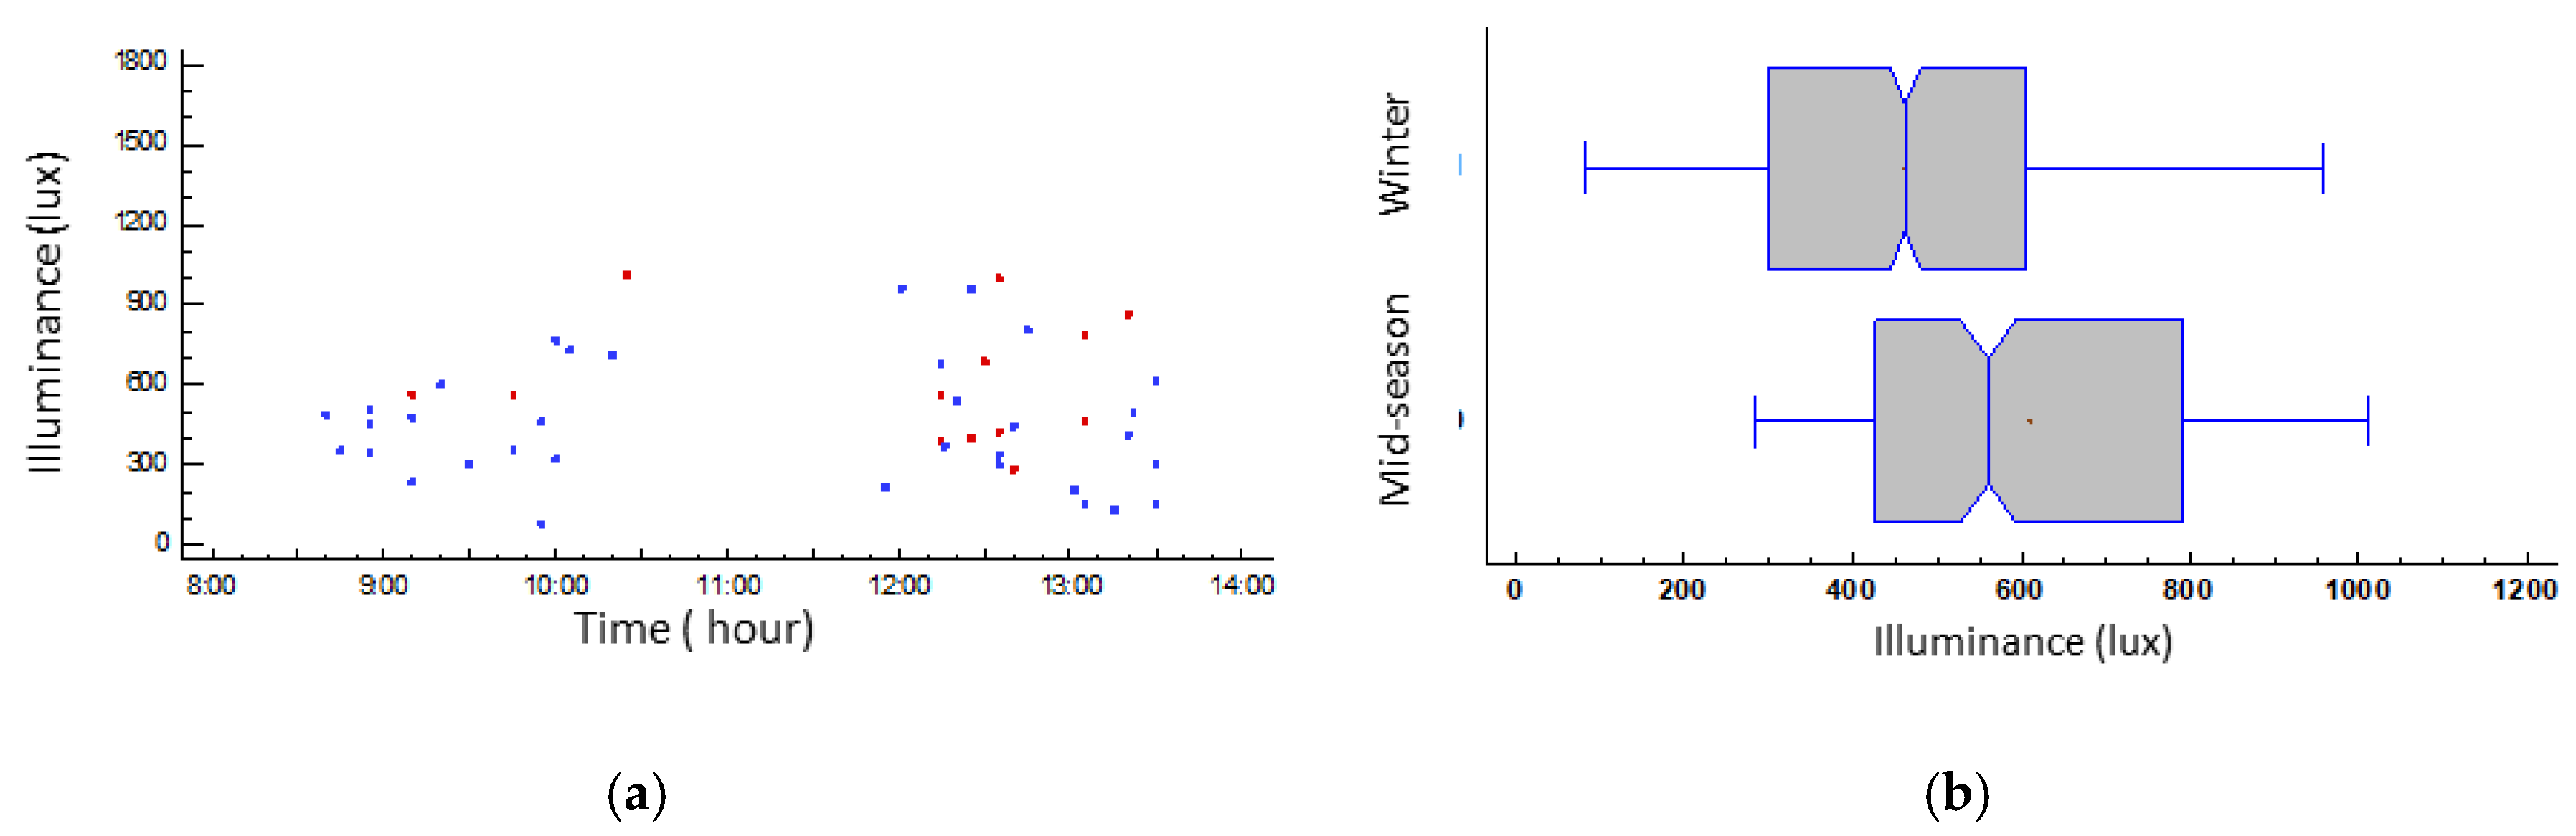
The median room mean illuminance (E) in the case studies oscillated between 461 and 560 lx (both cases with a SD of 222) according to the season, with an average lighting uniformity (Uo) of 0.48. However, although there seemed to be a greater illumination associated with the half-season period, it was not possible to rule out, without further measurements, the fact of being biased by the activities in execution during the measurements. The high SD was due both to the use of the projector and the solar protection devices (as low as 15 lx) and the lack of use of a solar protection device with direct solar radiation (figures as high as 1710 lx) (Figure 7). The homogeneity of the lighting solutions in almost all buildings generated visual fields with very similar characteristics, mainly dominated by the behavior of their electric lighting. The correlated color temperature was similar in all cases, varying from 3500 to 5500 K; hence, it can be considered that both the amount of light and hue did not affect the thermal perception of the participants, as exposed by Bellia et al. [71] and Acosta et al. [72].

3.2. Mean Values of Airtightness of the Samples

The values of airtightness of the classrooms under study with a difference of pressure between indoor and outdoor of 50 Pa (n50 range) varied from 2.6 h–1 to 10 h–1, with an average value of n50 of 6.97 h–1 and a SD of 2.06 h–1.

3.3. Mean Values of Occupants’ Votes

The mean thermal sensation vote (TSV) of the students in both seasons was “slightly warm”, with a value of +0.32 on the ASHRAE scale in winter and +0.38 in midseasons, having a SD of between 0.93 and 0.83, respectively. This can be identified as a common situation among poorly ventilated and crowded spaces. Even with open windows the actual air-removal capacity looked very limited as previously evaluated (Table 6). These thermal perceptions were higher (+0.10 points) when windows were open, highlighting an excess of heat release of the heating system due to inefficient regulation and the wish of the users of dissipation. In this case, the occupants’ thermal preference vote (TPV) expressed was softer and closer to neutrality than the TSV, not fitting at all with the perceived thermal sensations (R² = −0.47, moderate correlation), as showed by Teli et al. [14,53].
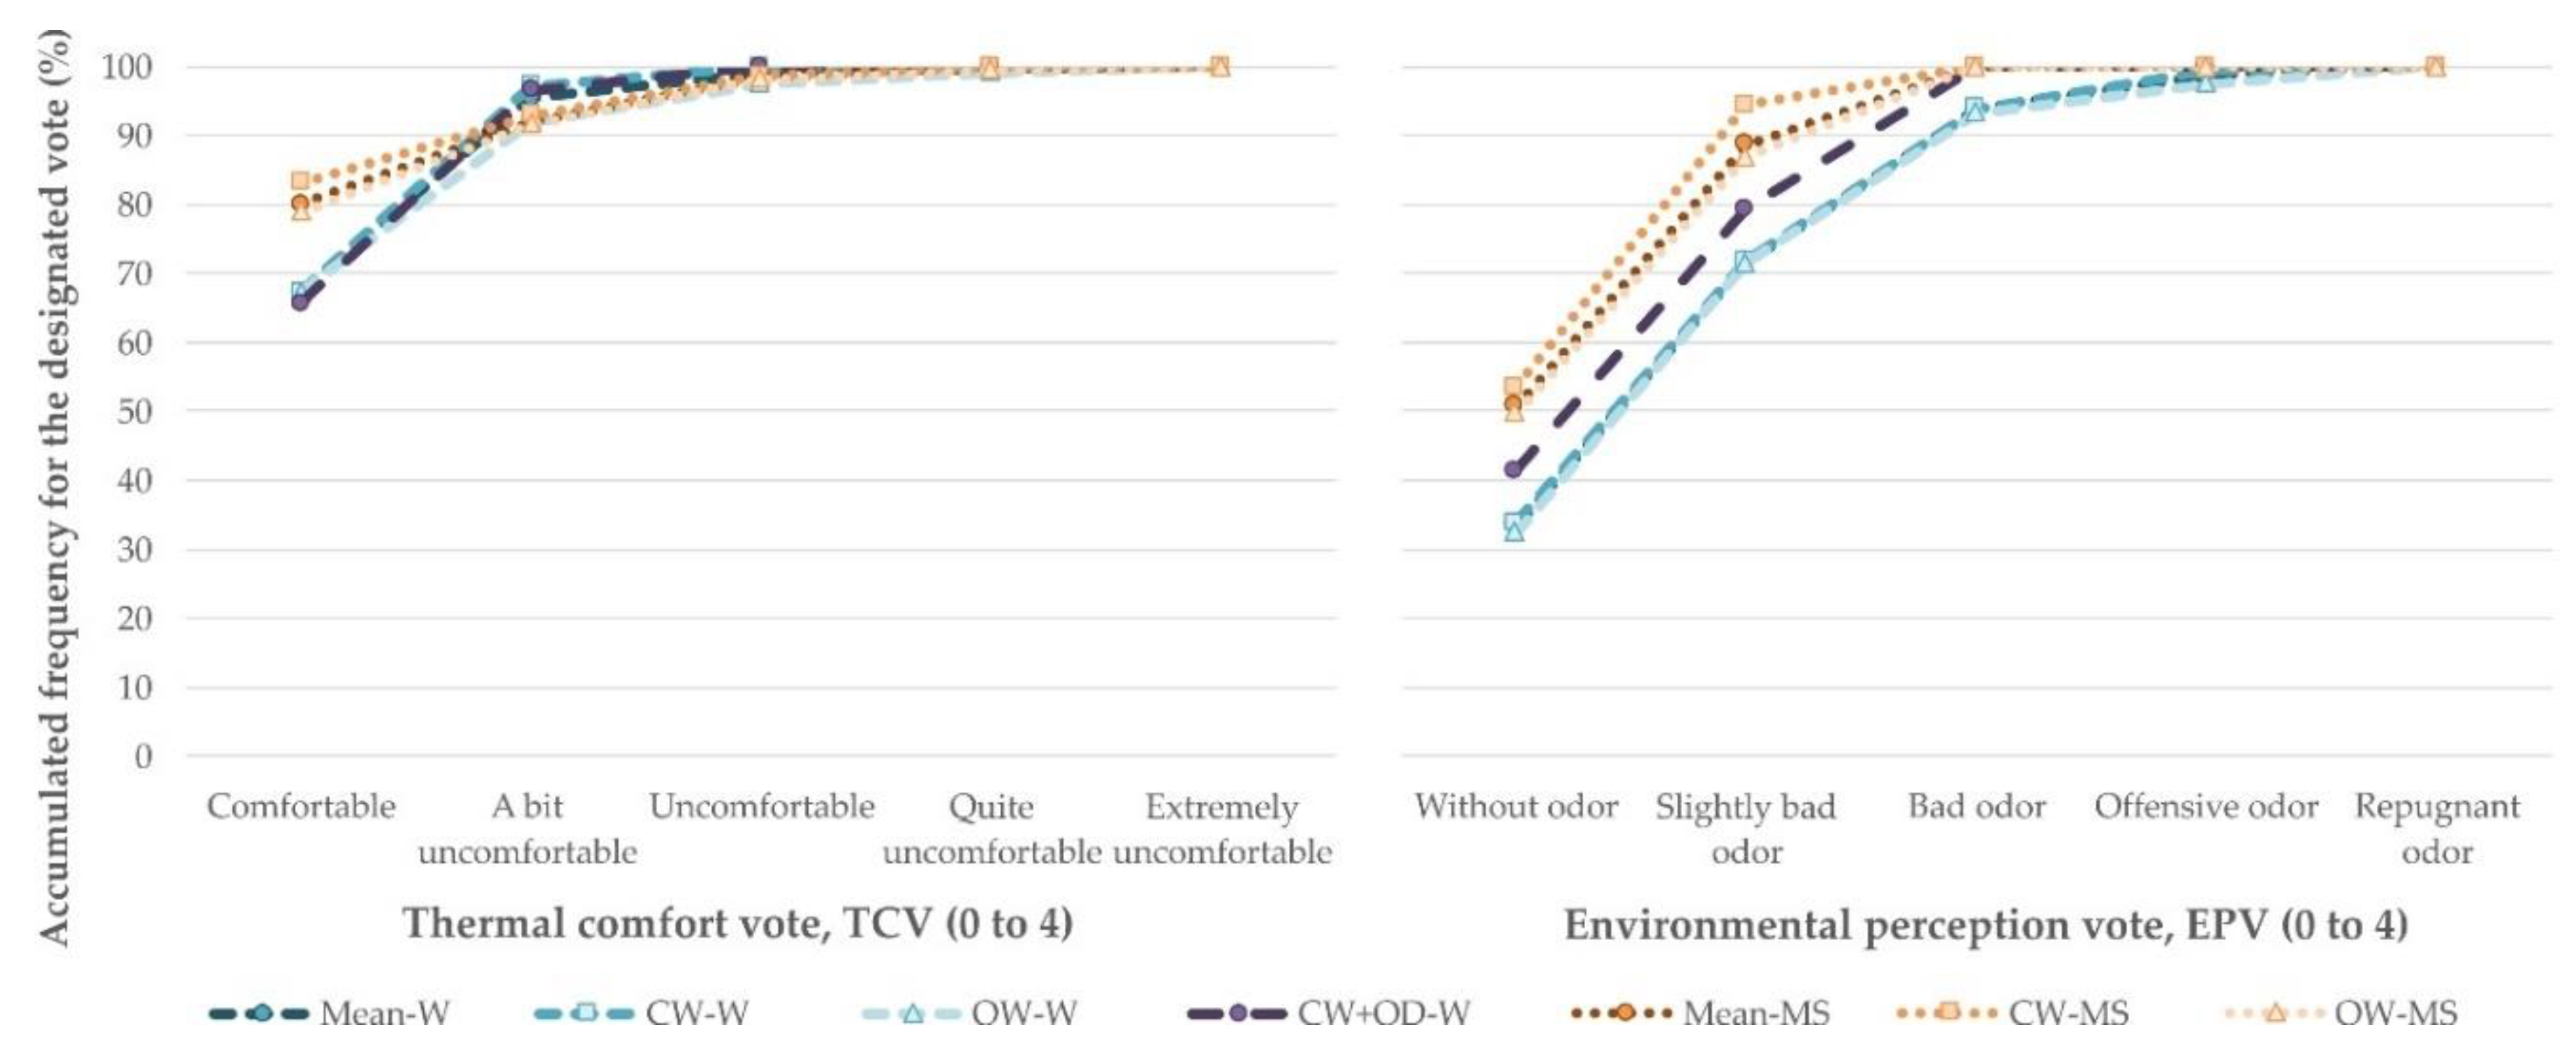
The average thermal environment rejection percentage (PDacc) expressed by students, based on a scale from 1 (acceptance) to 0 (rejection), was low and homogeneous in both seasons, with a mean value of 0.81 in winter conditions and 0.85 for midseasons. In addition, thermal acceptance was, in general, slightly better in classrooms with closed windows in both seasons, but in the case of closed windows and open doors. The thermal comfort vote (TCV) allowed us to qualify this acceptance-rejection PDacc index, given that less than 70% of students found “comfortable” the thermal environment in winter conditions compared to more than 80% in midseasons. This percentage increased to 96% for students with “comfortable” or “a bit uncomfortable” votes in winter conditions, but without reaching 92% in midseasons. By contrast, the number of users who, accepting a slight discomfort, considered the acceptable environment was superior in winter than in midseason, where the feeling of discomfort was slightly more marked, can be seen in Figure 8.
The mean environmental perception vote (EPV) showed during winter a 1.03 value (slightly bad odor), with low differences regarding windows’ operation (less than 0.03 points); in midseasons, EPV was more favorable (0.61), with more than 0.10 points of difference regarding windows’ operation. Figure 8 also shows the accumulated distribution of the EPV, in which less than 35% of students voted “without odor” in winter, while more than 50% voted it during midseasons. In addition, almost 30% of students perceived a slight odor or worse in winter in comparison to the midseasons, with 10%. Finally, around 7% of students voted “bad odor” or worse in winter, while there were no votes in this way during midseasons.
During the winter there is a more evident feeling of a poorly ventilated (not healthy) environment, in line with the measured CO2 values acting as a token of the indoor ambient renovation state. The operation of windows produced little to no effect on the improvement of the environmental quality, especially during the winter. Although it was found that the opening of windows in this period generated noticeable dilution of the interior atmosphere, it was still insufficient to guarantee pleasant environments.
During midseason, although the ventilation mechanism was less effective (by means of a lack of thermal differential), the capability of diluting the indoor environment to threshold levels was perceived by the users as somewhat better. The assessment of these user perception-thresholds was a key aspect of research, since it will allow the design of more adequate and well-accepted spaces.

3.4. Mean Values of Occupants’ Clothing Insulation

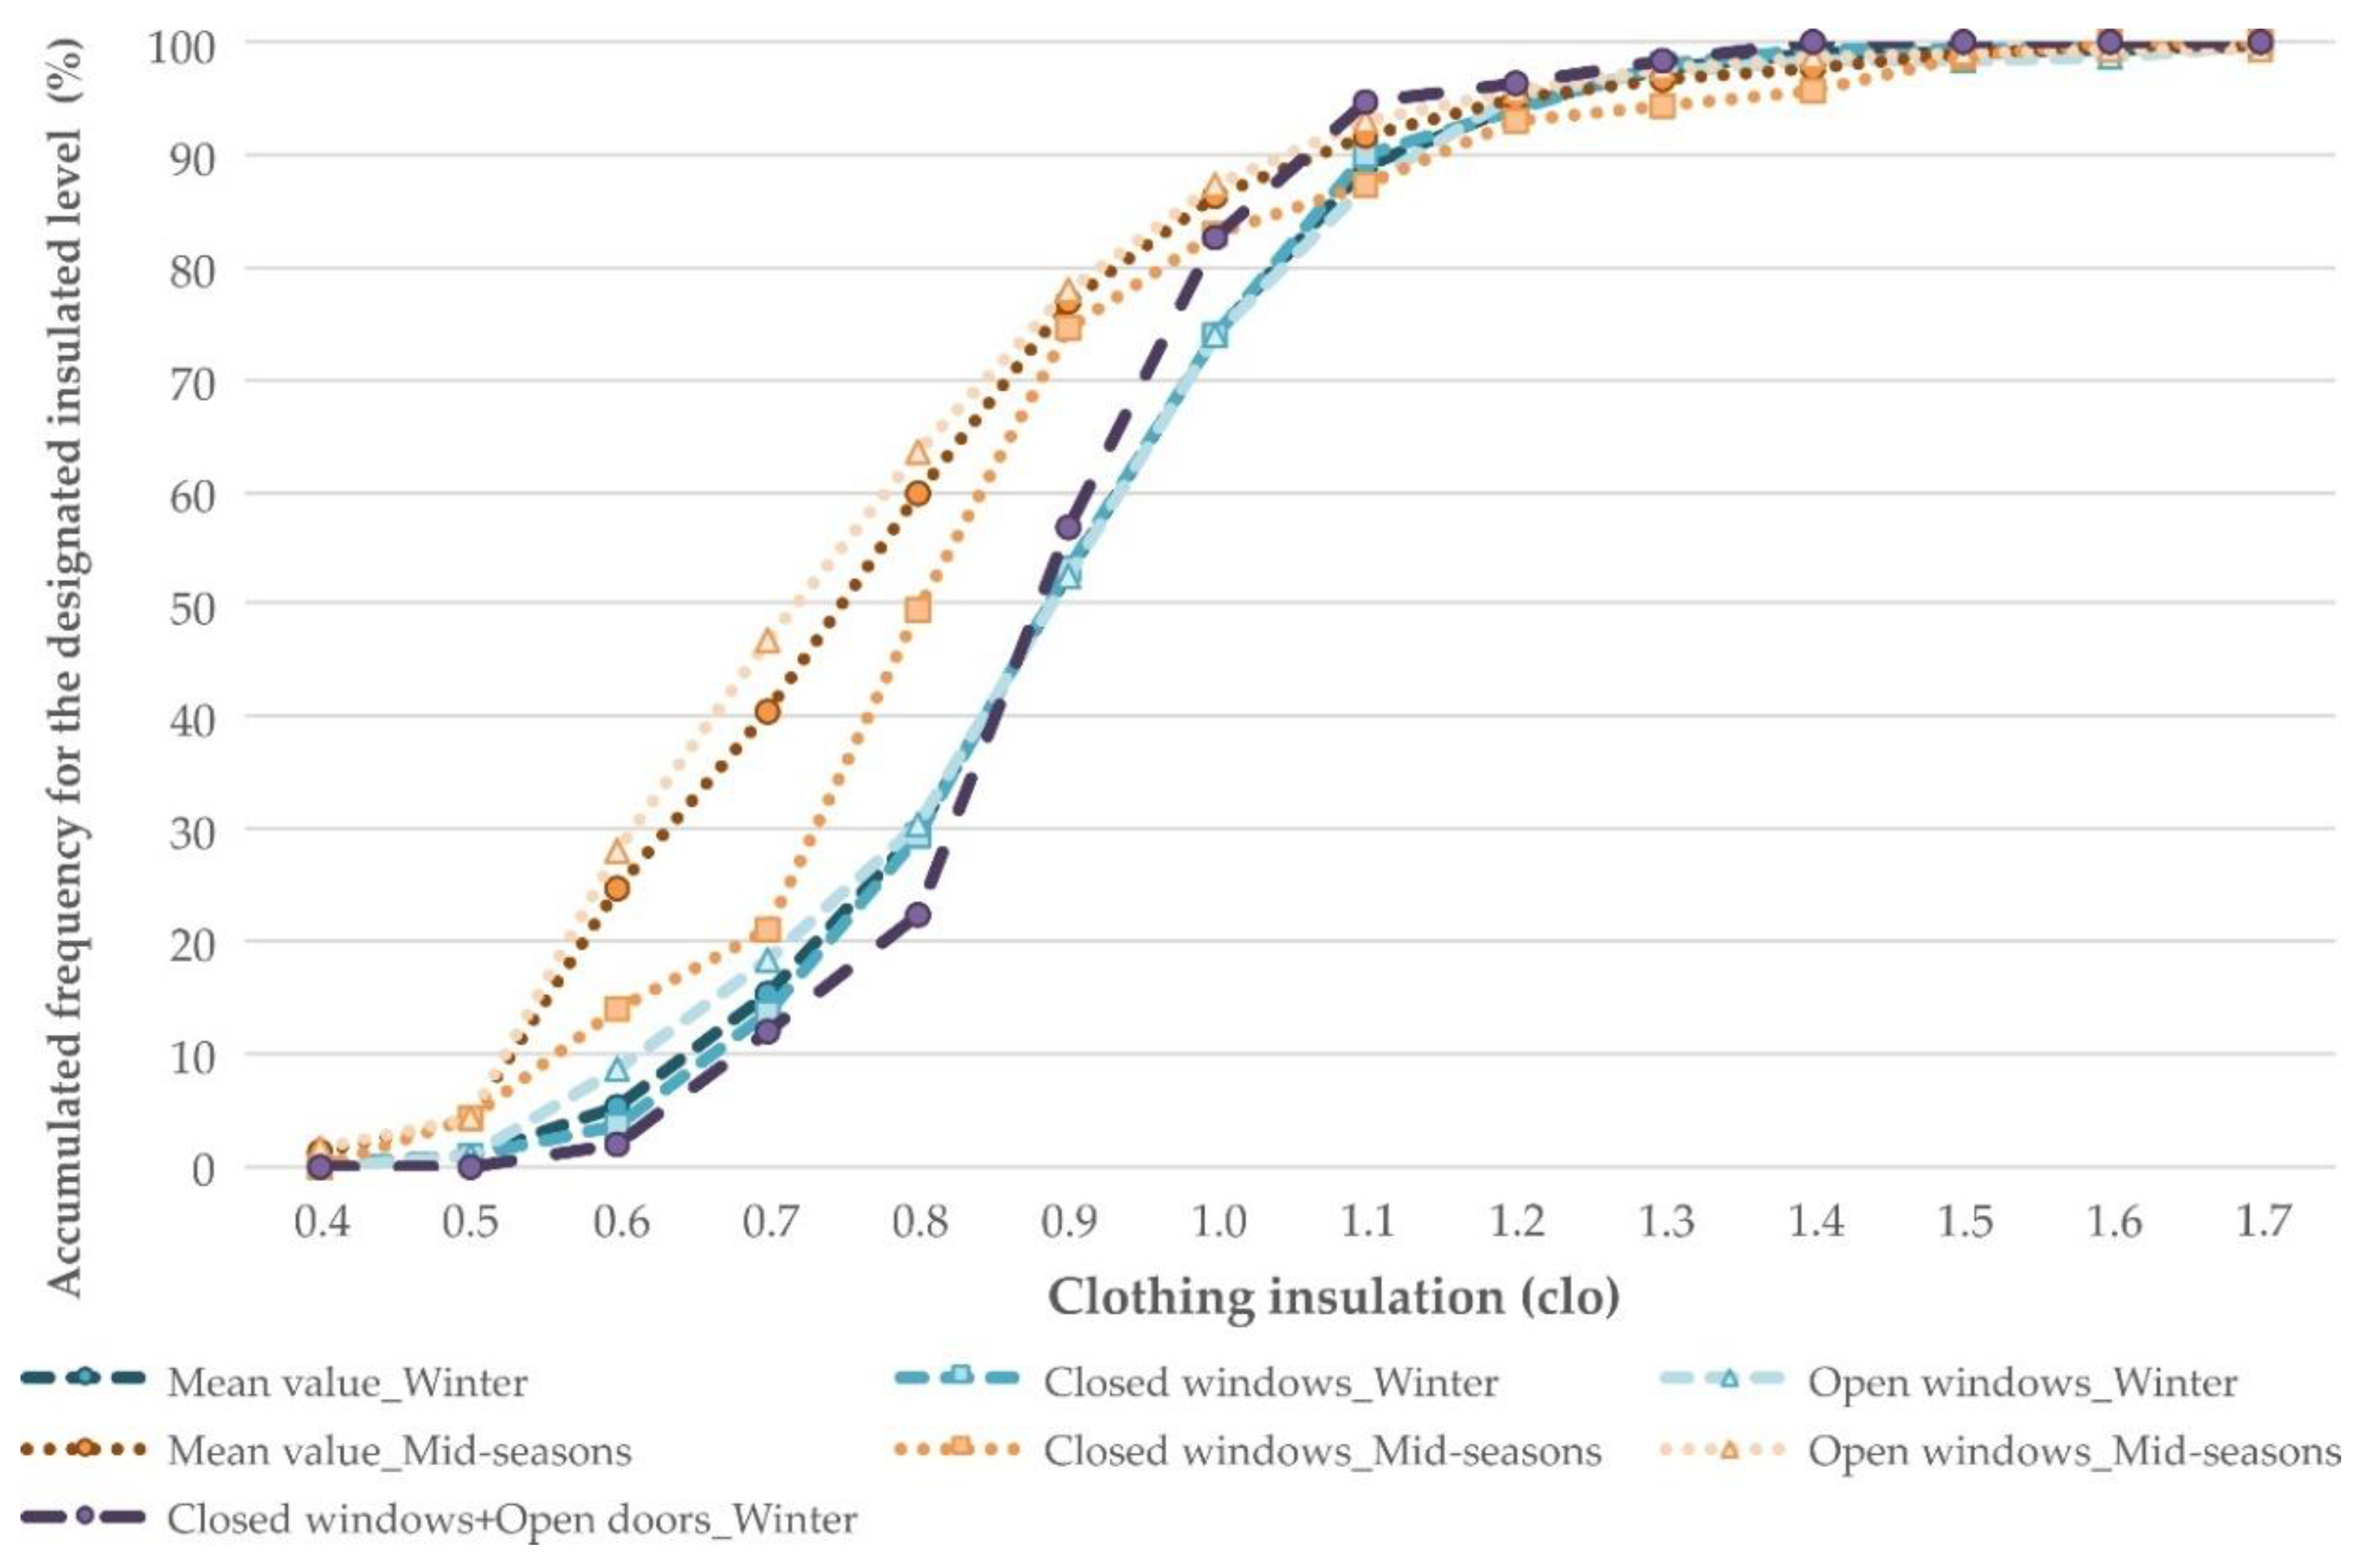
The occupants’ clothing insulation (Icl) showed two models of response linked to the season, as it can be seen in Table 7. Clothing distribution in winter was homogeneous, with a mean value of 0.90 clo and a SD of 0.19, common both for open and closed windows, and a minor divergence of 5% around 0.6–0.7 clo values related to windows’ operation, showed in Figure 9. It should also be noted that the biggest slope of the insulation distribution was during winter with closed windows and inner doors open, which highlighted the smaller variation in clothing insulation of this group of case studies.
In midseasons, the clothing insulation was lower and variable, with a SD of 0.23 and an asymmetrical distribution. There was a divergence of up to 25% in the frequency of the lowest levels of clothing insulation during midseasons regarding the windows’ operation, coinciding both frequencies around the value of 0.90 clo (75–80% of the accumulated frequency).

3.5. Symptoms and Related Health Effects

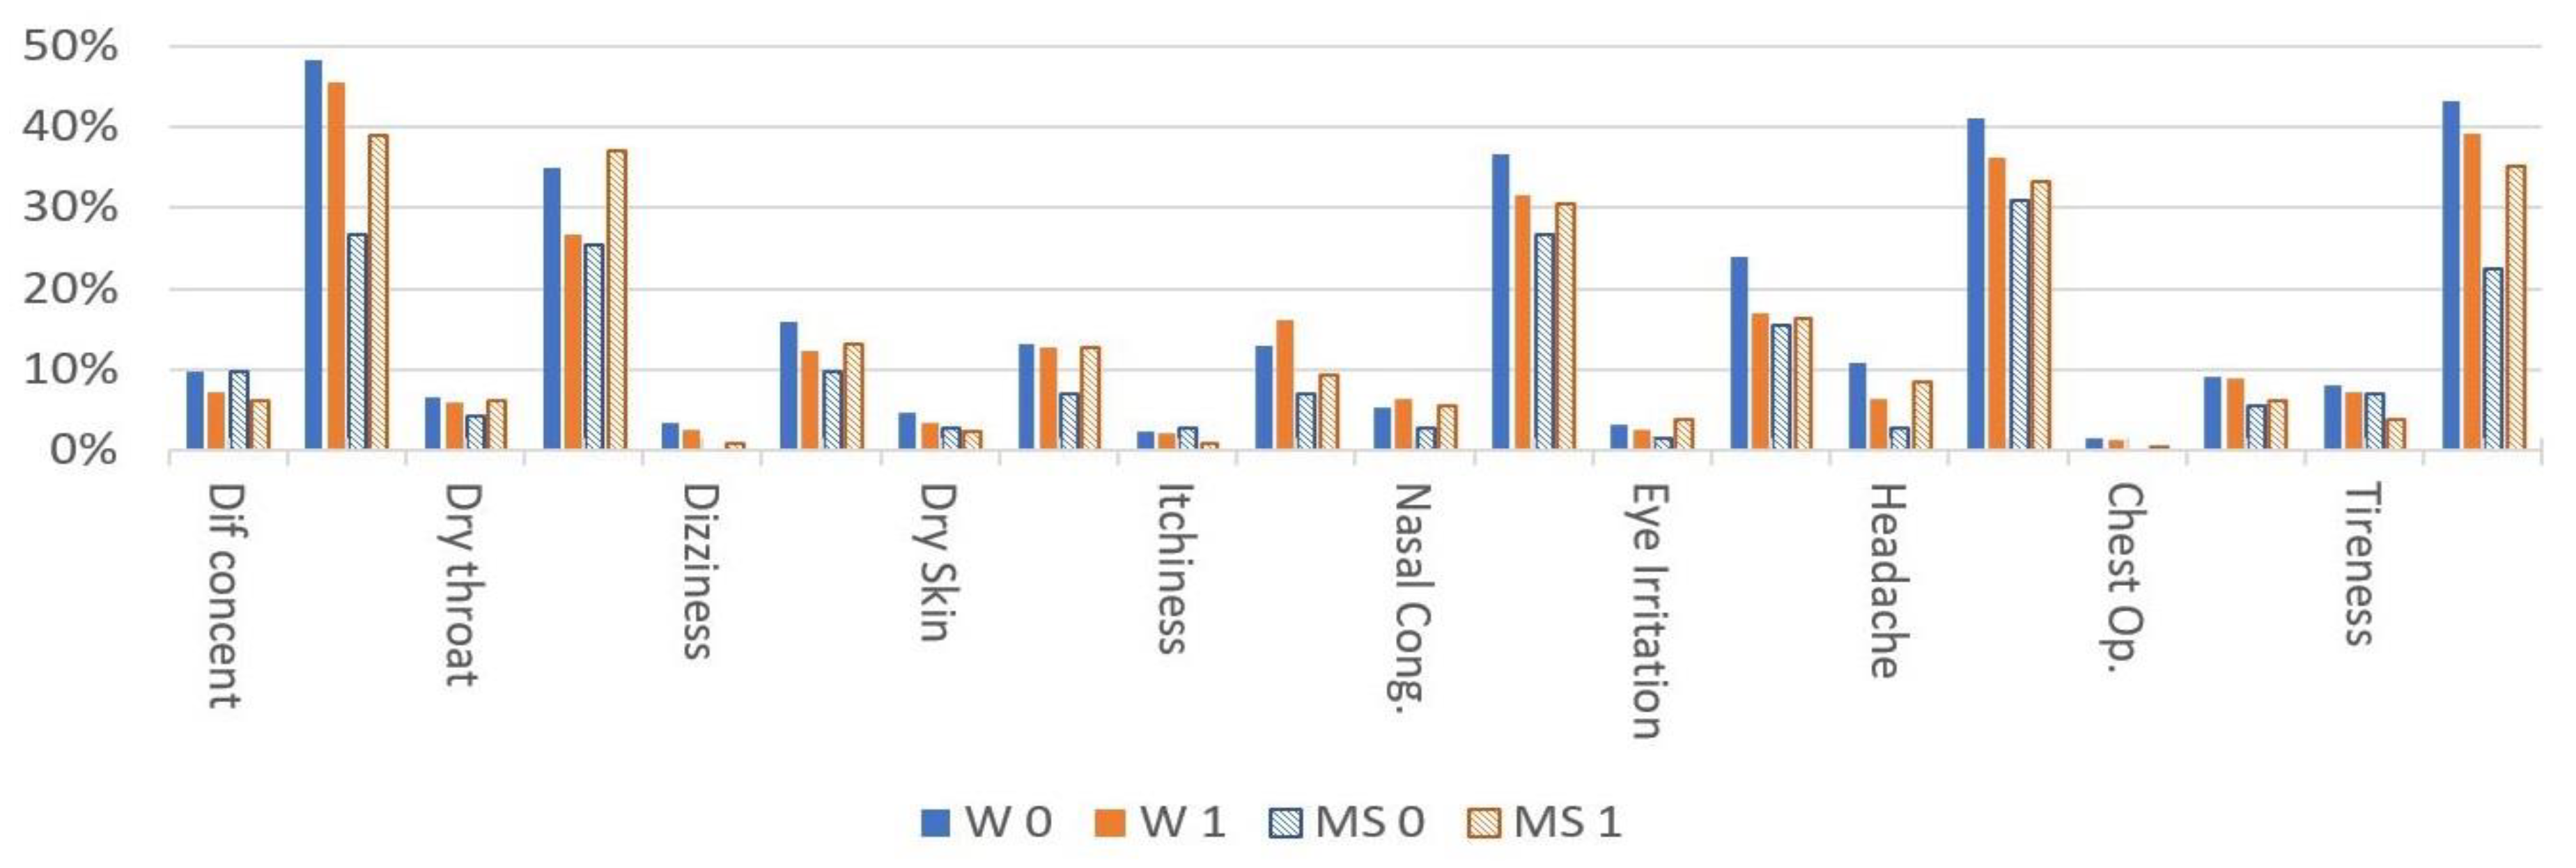
The most commonly reported severe symptoms were headache and concentration difficulty (around 10%), followed by tiredness and a dry throat (under 10%), with a greater prevalence during wintertime and closed windows’ operation. The action of the windows (Figure 10) was relatively weak, indicating the limited actual ventilation capacity of these spaces with only the opening of windows (reductions were around 25% less, in general). However, the perception of mild symptoms was very common in the classrooms, with tiredness, headache, and difficulty in concentration presenting a prevalence in the range of 40% to 50% for closed operation and slightly lower when windows were open (decreasing around 10–15 %), as shown Table 8.
This situation changed in midseason, where the symptom report was lower, even for the situation of closed windows. However, unlike winter, symptomatic perception increased when the windows were open for both perceptions, severe and mild, especially for dry throat, itchiness, nasal congestion, and headache, which are symptoms that can be linked to the penetration of external species (in many cases aerobiological such as pollen [73,74,75]).
Aiming to evaluate the overall impact of the different perceptions of symptoms, while assuming the variability component of the subjective responses and different individual sensitivity to the environments, unlike the evaluation of physical parameters, users were asked to assess the intensity of the perception of discomfort on a scale of 0 to 1 (0 none and 1 maximum intensity). Although this was not a standardized parameter (it may vary between different users) it had a great potential to represent the importance that each user assigned to the nuisance and, therefore, to assess the actual perception of the indoor conditions. Similar subjective ratings in conjunction with objective environmental measures were used in relevant studies, such as [76,77,78,79]. An overall indicator was collected through the addition of the specific scores or valuations generated by the users of each symptom or condition. This represented a global assessment of perceived impact, with a fundamentally qualitative character, since there was no univocal relationship but strong enough to highlight health discomfort ant to categorize best and worse indoor environments. The main values from the different classrooms are grouped by seasons and windows’ situation in Table 9. This table contains the statistical summary for the data samples. Of particular interest are standardized bias and standardized kurtosis since, in all the cases (except the kurtosis of MS_1) these statistics were outside the range of −2 to +2 standard deviation, thus indicating significant deviations from normal.
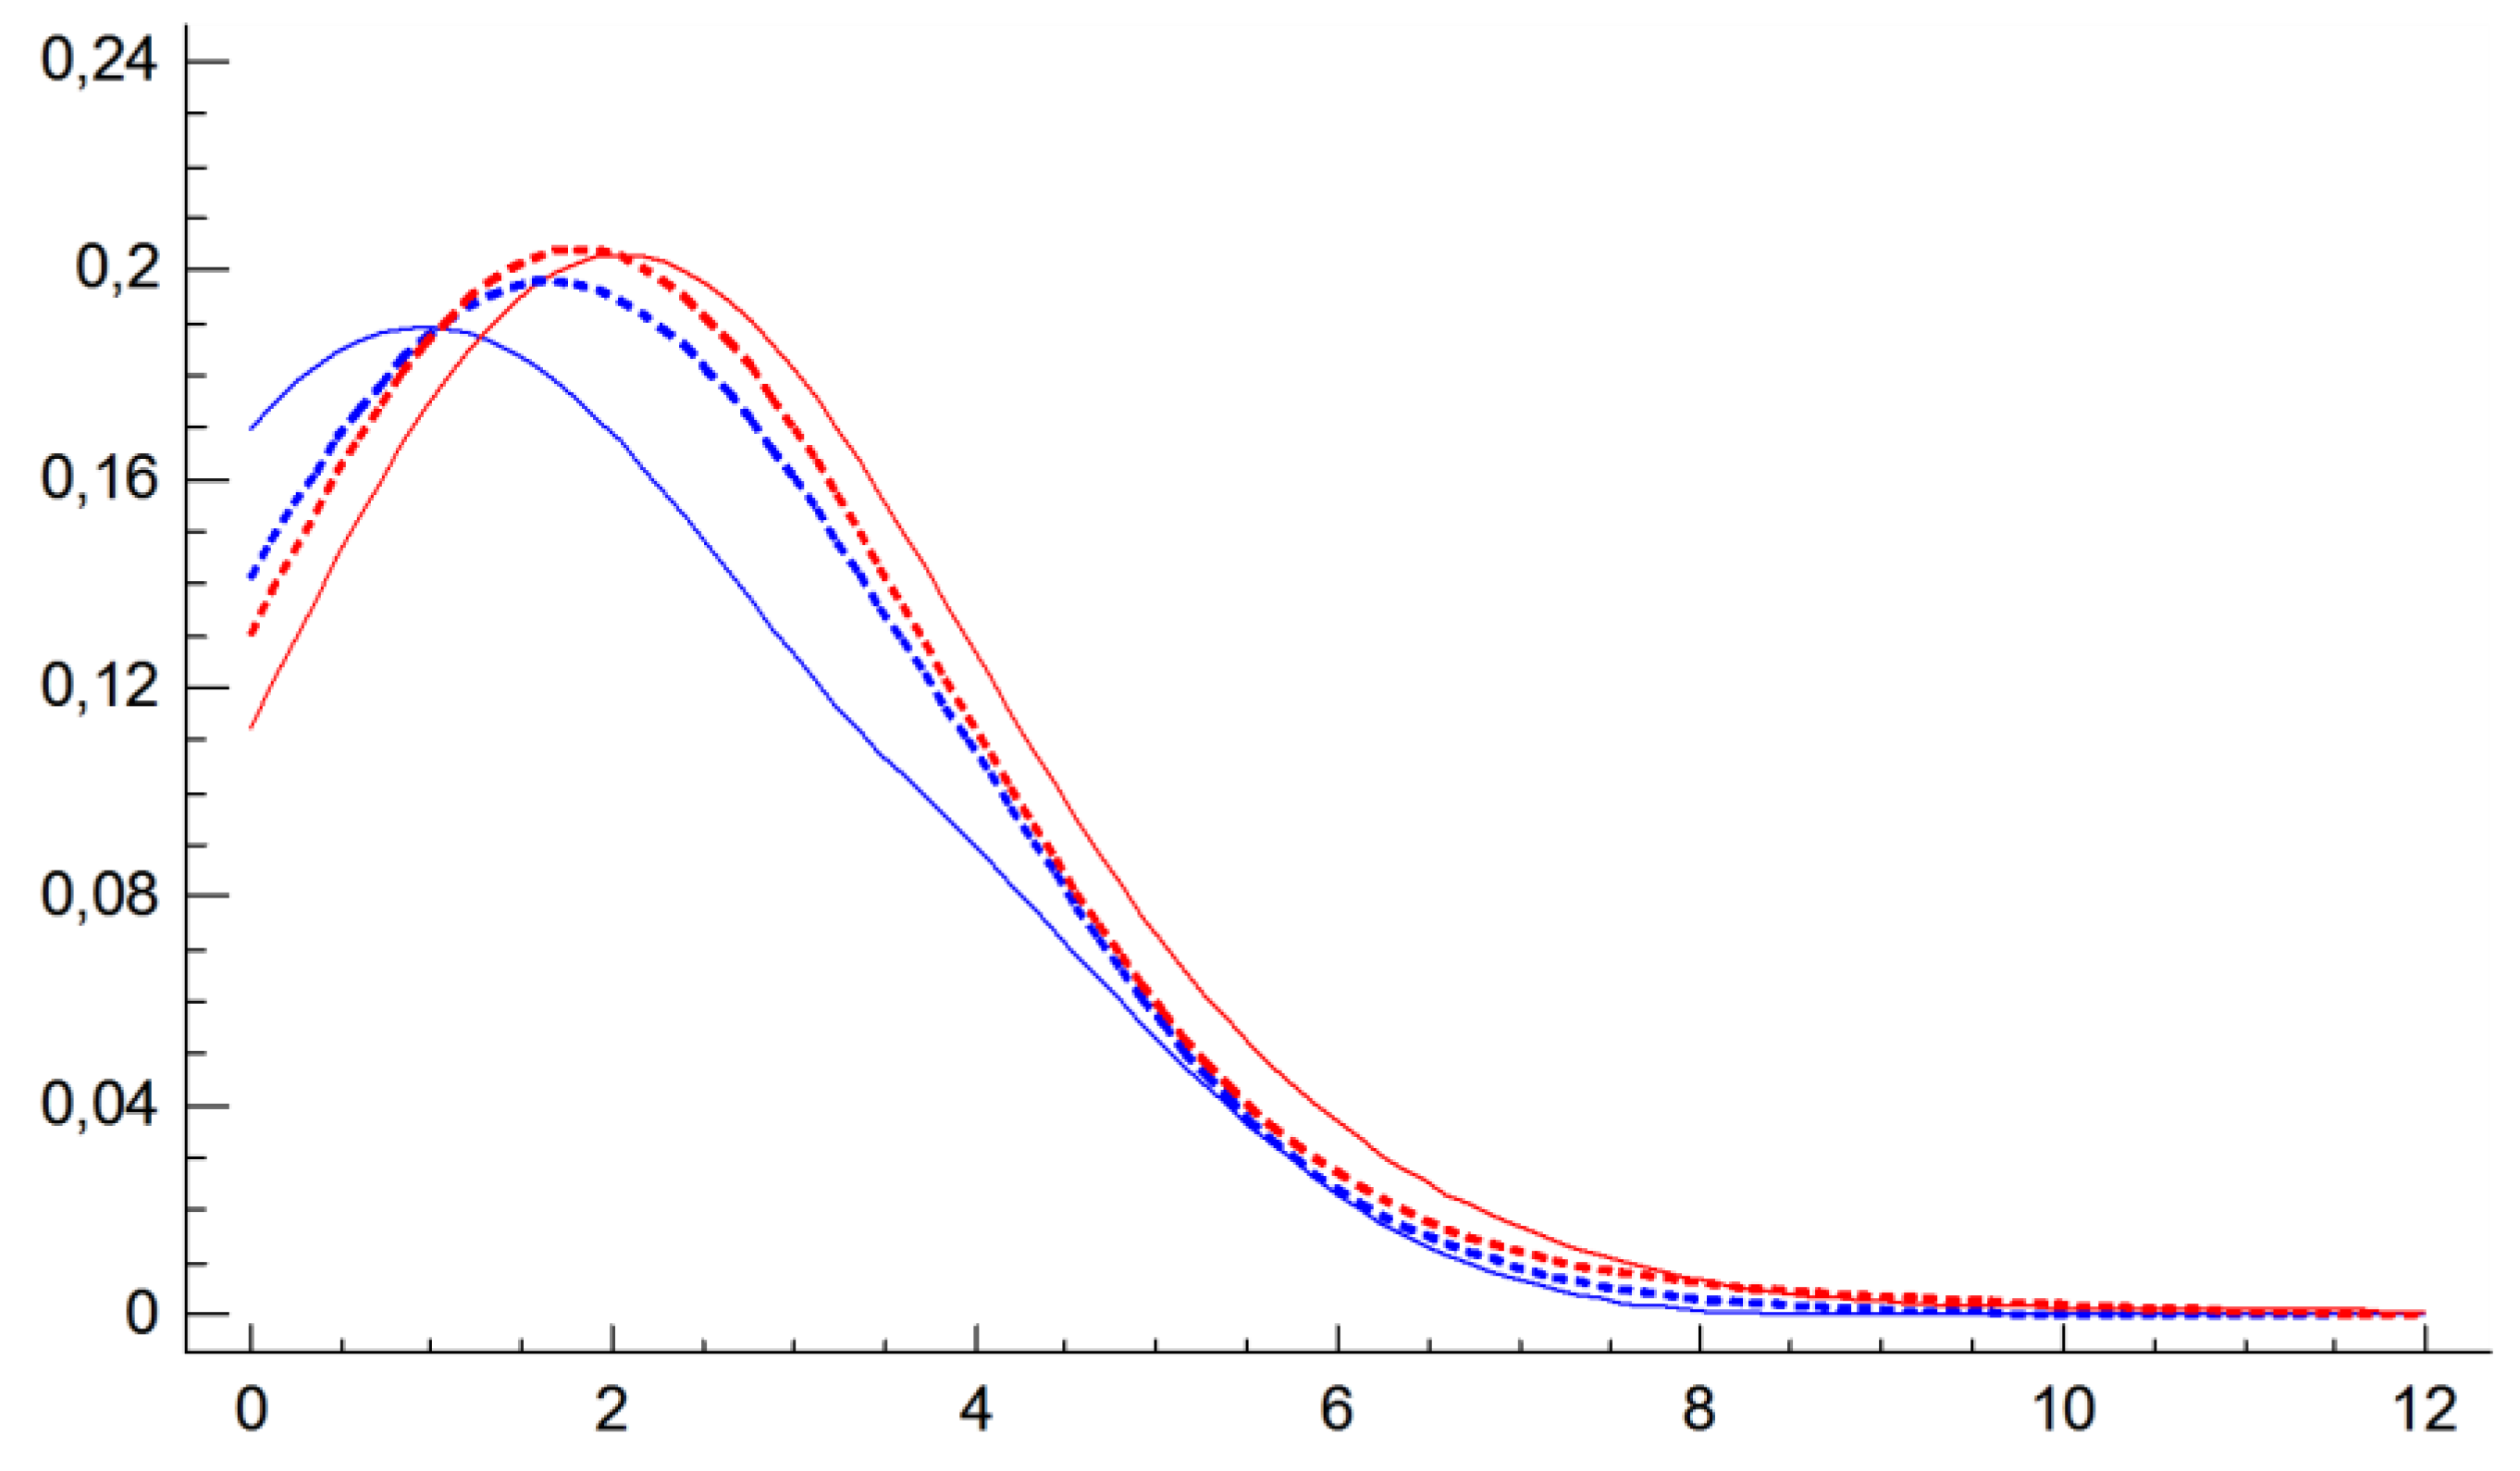
The distribution of symptoms’ samples for each scenario (Figure 11) was asymmetrical, not normal (Shapiro–Wilk test with p-value less than 0.05 in all cases, so it can be ruled out with 95% confidence) with bias. Median values located between 1.4 as the lower impact case in half a season (closed windows) up to 2.10 for winter (also with closed windows). Although values concentrated around 2.00, there was a significant dispersion, reaching values of up to 11, which meant a maximum vote in practically all the symptoms. (This specific case must be understood as outlier). This highlighted that even in the best scenario analyzed, there was a significant perception of ambient-related symptoms and problems by the users. By contrast, there was also a non-negligible presence of users that did not reflect any discomfort or effects, especially in the midseason scenario with closed windows, with percentiles that stood at 39%, compared to lower values in the other states, where this group went from 6.1% to 16.4% (W0 to MS1). In this way, the low level of difference in the distribution according to windows’ operation can also show that the ventilation airflow through windows was not enough to guarantee a noticeable reduction of the students’ symptoms, although it can modify slightly the physical parameters of the interior environment. This aspect was of singular importance, since it indicated that the mere control of the usual environmental values did not guarantee satisfaction with the interior environment, at least with regard to the absence of bothersome symptoms. In the case of midseason, symptoms described with open windows can be due to the higher level of external aerobiological particles entering into the classrooms, such as pollen. That is why the appropriate ventilation to provide a perceptive reduction of the symptomatology should be done by means of fans with filter system.
The probabilistic distributions of individual related symptoms’ scores for the different scenarios showed some similarity in the global pattern response and central values, mainly for open windows, except for the MS_0 (closed windows). A set nonparametric contrast through K–S test (Kolmogorov–Smirnov for the global parameter) was developed to evaluate the pertinence to a common distribution. In all four cases, comparisons for accumulated distances of the samples showed statistically significant differences at 95% significance between the distributions (with all the cases with a p-value < 0.05 and DN values over Dcrit.0.05), with DN around 0.122 to 0.148 for the samples with closest distribution (windows open winter vs. middle season and winter open vs. closed windows) and the greater DN value 0.380 for the furthest. So it can be established that there were different distributions for all the cases

3.6. Airtightness

The average value of the infiltration rate at 50 Pa (n50) was 6.97 h−1, with a standard deviation of 2.06 h−1. Models with the lowest n50 values were those in the C3 climate zone, where the lowest average temperature values are recorded in the winter. The values of n50 ranged from 10 h−1 (maximum) to 2.6 h−1 (minimum), both recorded in the B4 climate zone (Table 10).

4. Discussion

This section is focused on the analysis of the relationships between the symptoms described by occupants and the rest of the parameters under study (physical, building operation, and votes).

4.1. Relationship between Physical Parameters and Classroom Operation

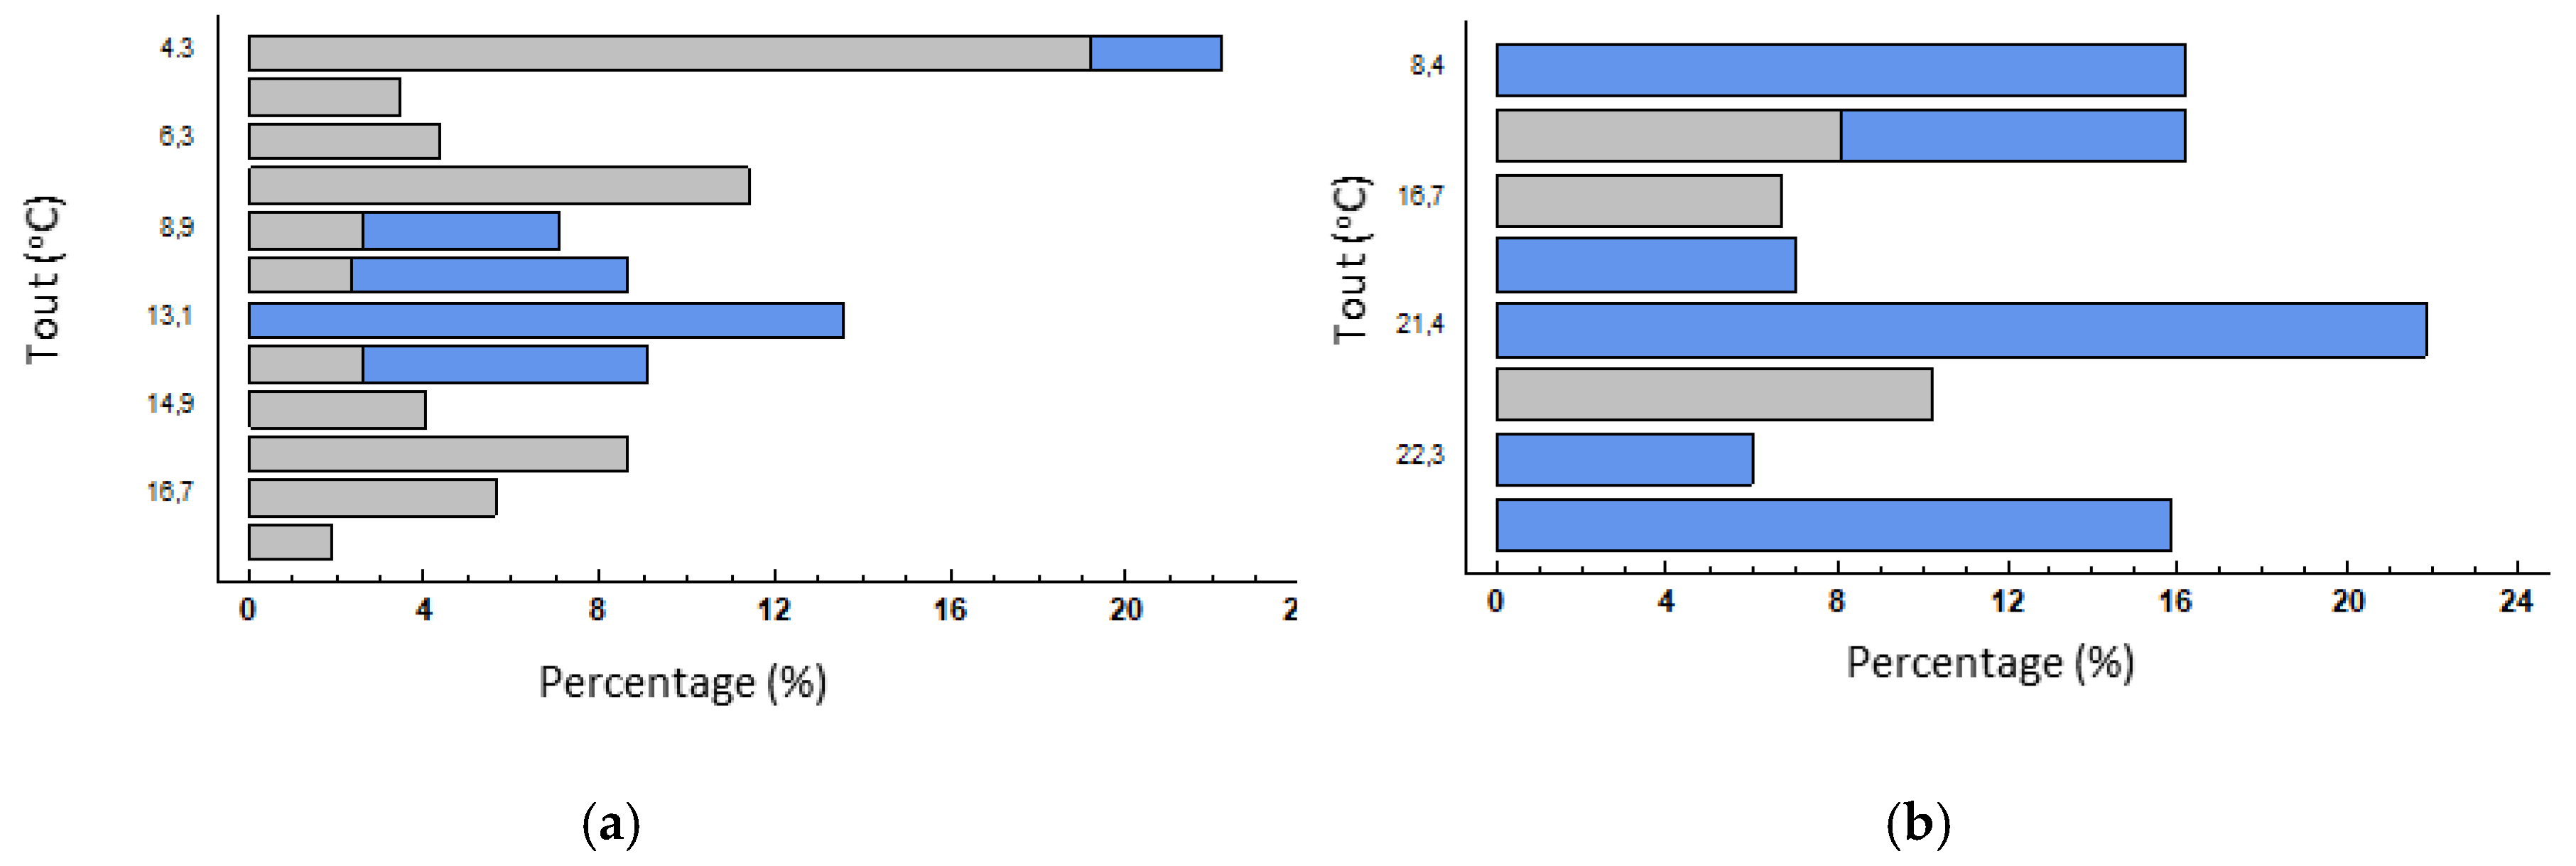
It could be assumed that manual opening of windows in naturally ventilated buildings should depend on outdoor conditions, as this is the main element of control. However, it was observed that, despite the fact that in midseason windows remain open longer than in winter, no clear linear trend can be observed. In winter, the need for ventilation or indoor air changes is considered more important than the need to control the entry of outdoor cold air. Analysis by categories of the opening of windows (Figure 12) showed this occurs mostly in mid temperatures, although it was also observed in cooler conditions when necessary. Furthermore, no progressive growth was observed with the increased temperature, as could be expected. In midseason, it is more common to open windows, although there was no clear correlation with temperature, some of which was similar to winter, where more windows are opened in comparison.
It could be deduced that users are psychologically or culturally conditioned to some extent as to how and when they open windows. Although it would be preferable for the classroom windows to remain open, the act of opening was seen as a reaction to poorer indoor air quality, which was more noticeable for the same thermal conditions in spring. It, therefore, appears that there is an adaptation process.
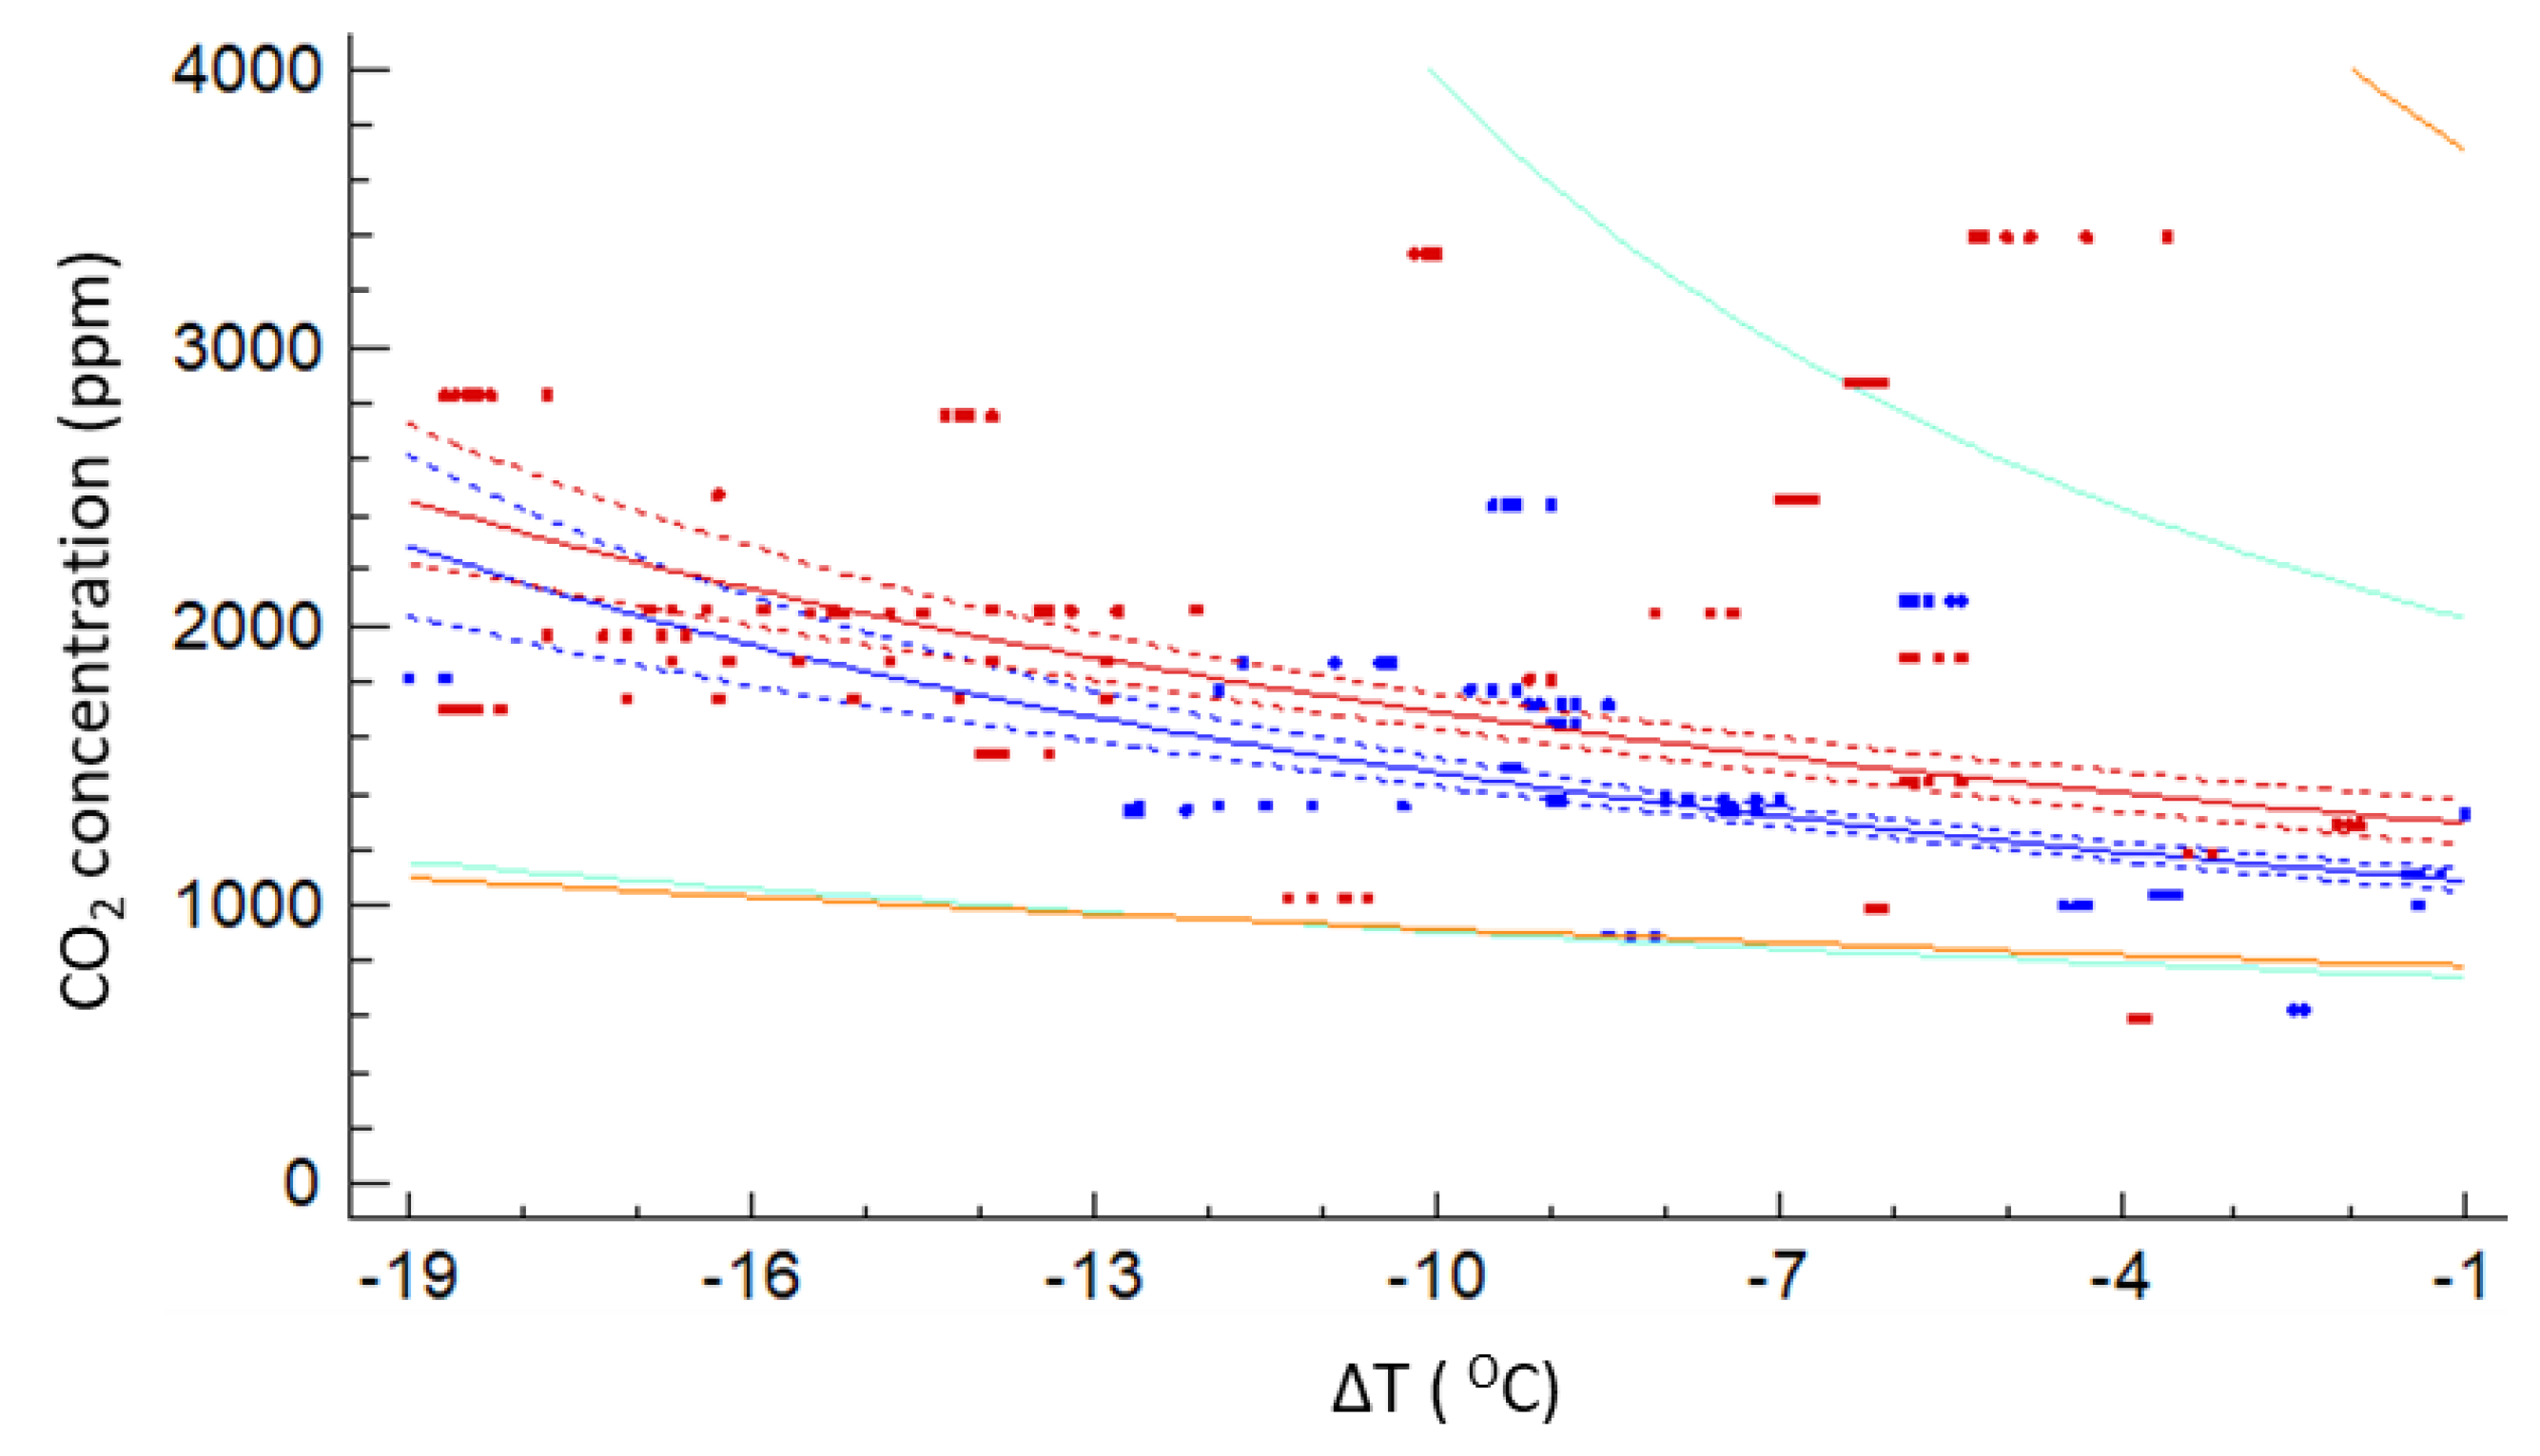
As it can be seen in Figure 13, although there was statistical significance between the CO2 concentration and the outdoor-indoor air temperature differential (p-value < 0.05), the correlation was somehow weak and more clear in winter time (R2 = 0.249) than in midseason (R2 = 0.145), with a better fit to a y-reciprocal relation. However, the predictive mathematical model lacked enough accuracy to be of utility to forecast actual situations. Besides the wide dispersion on values, there was a trend in the worsening of the indoor environment as DT increased, as can be usually expected, due to the lack of a controlled ventilation system.
Is noteworthy to highlight that moderate DT winter and midseason trends were very similar, which matched with the foreseen windows’ operation patterns, when most of the apertures occurred around cold-mild external temperatures.

4.2. Relationship between Physical Parameters and Symptoms Described

Some symptoms were more predominant when outdoor temperature was lower, although no clear linear relationship could be established. These symptoms were more frequent in winter when the thermal differential is at its highest, usually linked to a lack of ventilation at the time, as supported by the high CO2 indices as a general air quality indicator.
Although the symptoms often appeared to be more evident when the windows were open, this should be seen as a consequence, not a cause, as user perception of the symptoms was generally clearer when opening the windows. This is interesting to note, as it could be due to a situation which exceeded the perception threshold. In the winter, it is more common to observe symptoms such as difficulty concentrating, dry throat, and tiredness. These are very closely linked to poor hygrothermal control, even with windows open, where temperature and relative humidity are far more important, especially with open windows, as well as increased indoor CO2 linked to poor ventilation. In contrast, itchiness and chest tightness were barely noticeable.
The situation changed in midseason and symptoms, such as difficulty concentrating, tiredness, and nasal congestion, were less widely reported. However, symptoms less connected with the absence of hygrothermal regulation increased, while there was a greater presence of symptoms that may be linked to outdoor exposure.
When both lighting parameters, illuminance (E) and illuminance uniformity (Uo), were analyzed and referred to symptomatology, no clear correlation was obtained, as other previous studies showed for educational buildings [80]. This may be because illuminance values in the classrooms under study were generally over 350–400 lx with a uniformity of 0.40–0.50, so they were values good enough to not influence students at a symptomatic level.
The infiltration rate (n50) and the symptoms related by occupants showed a very tenuous connection, with some weak trends in the case of tiredness, as well as difficulty on concentrating, dry throat, and headache. Given that the airtightness of the classrooms was, in general, adequate or even good, with an average value of 6.97 h−1 with a maximum value of 10 h−1, its influence can be moderate due to its low impact on air renewal. It also indicates that other variables, like time spent inside the classroom or windows’ and doors’ operation, can have more importance than the airtightness of the room.
There was no clear linear correlation between the students’ clothing insulation and the symptoms described during measurements. The possibility of freely varying the level of clothing insulation by the students, according to their individual thermal needs, may be a factor that influenced this lack of relationship between clothing and symptomatology, besides psychological factors linked to clothing.
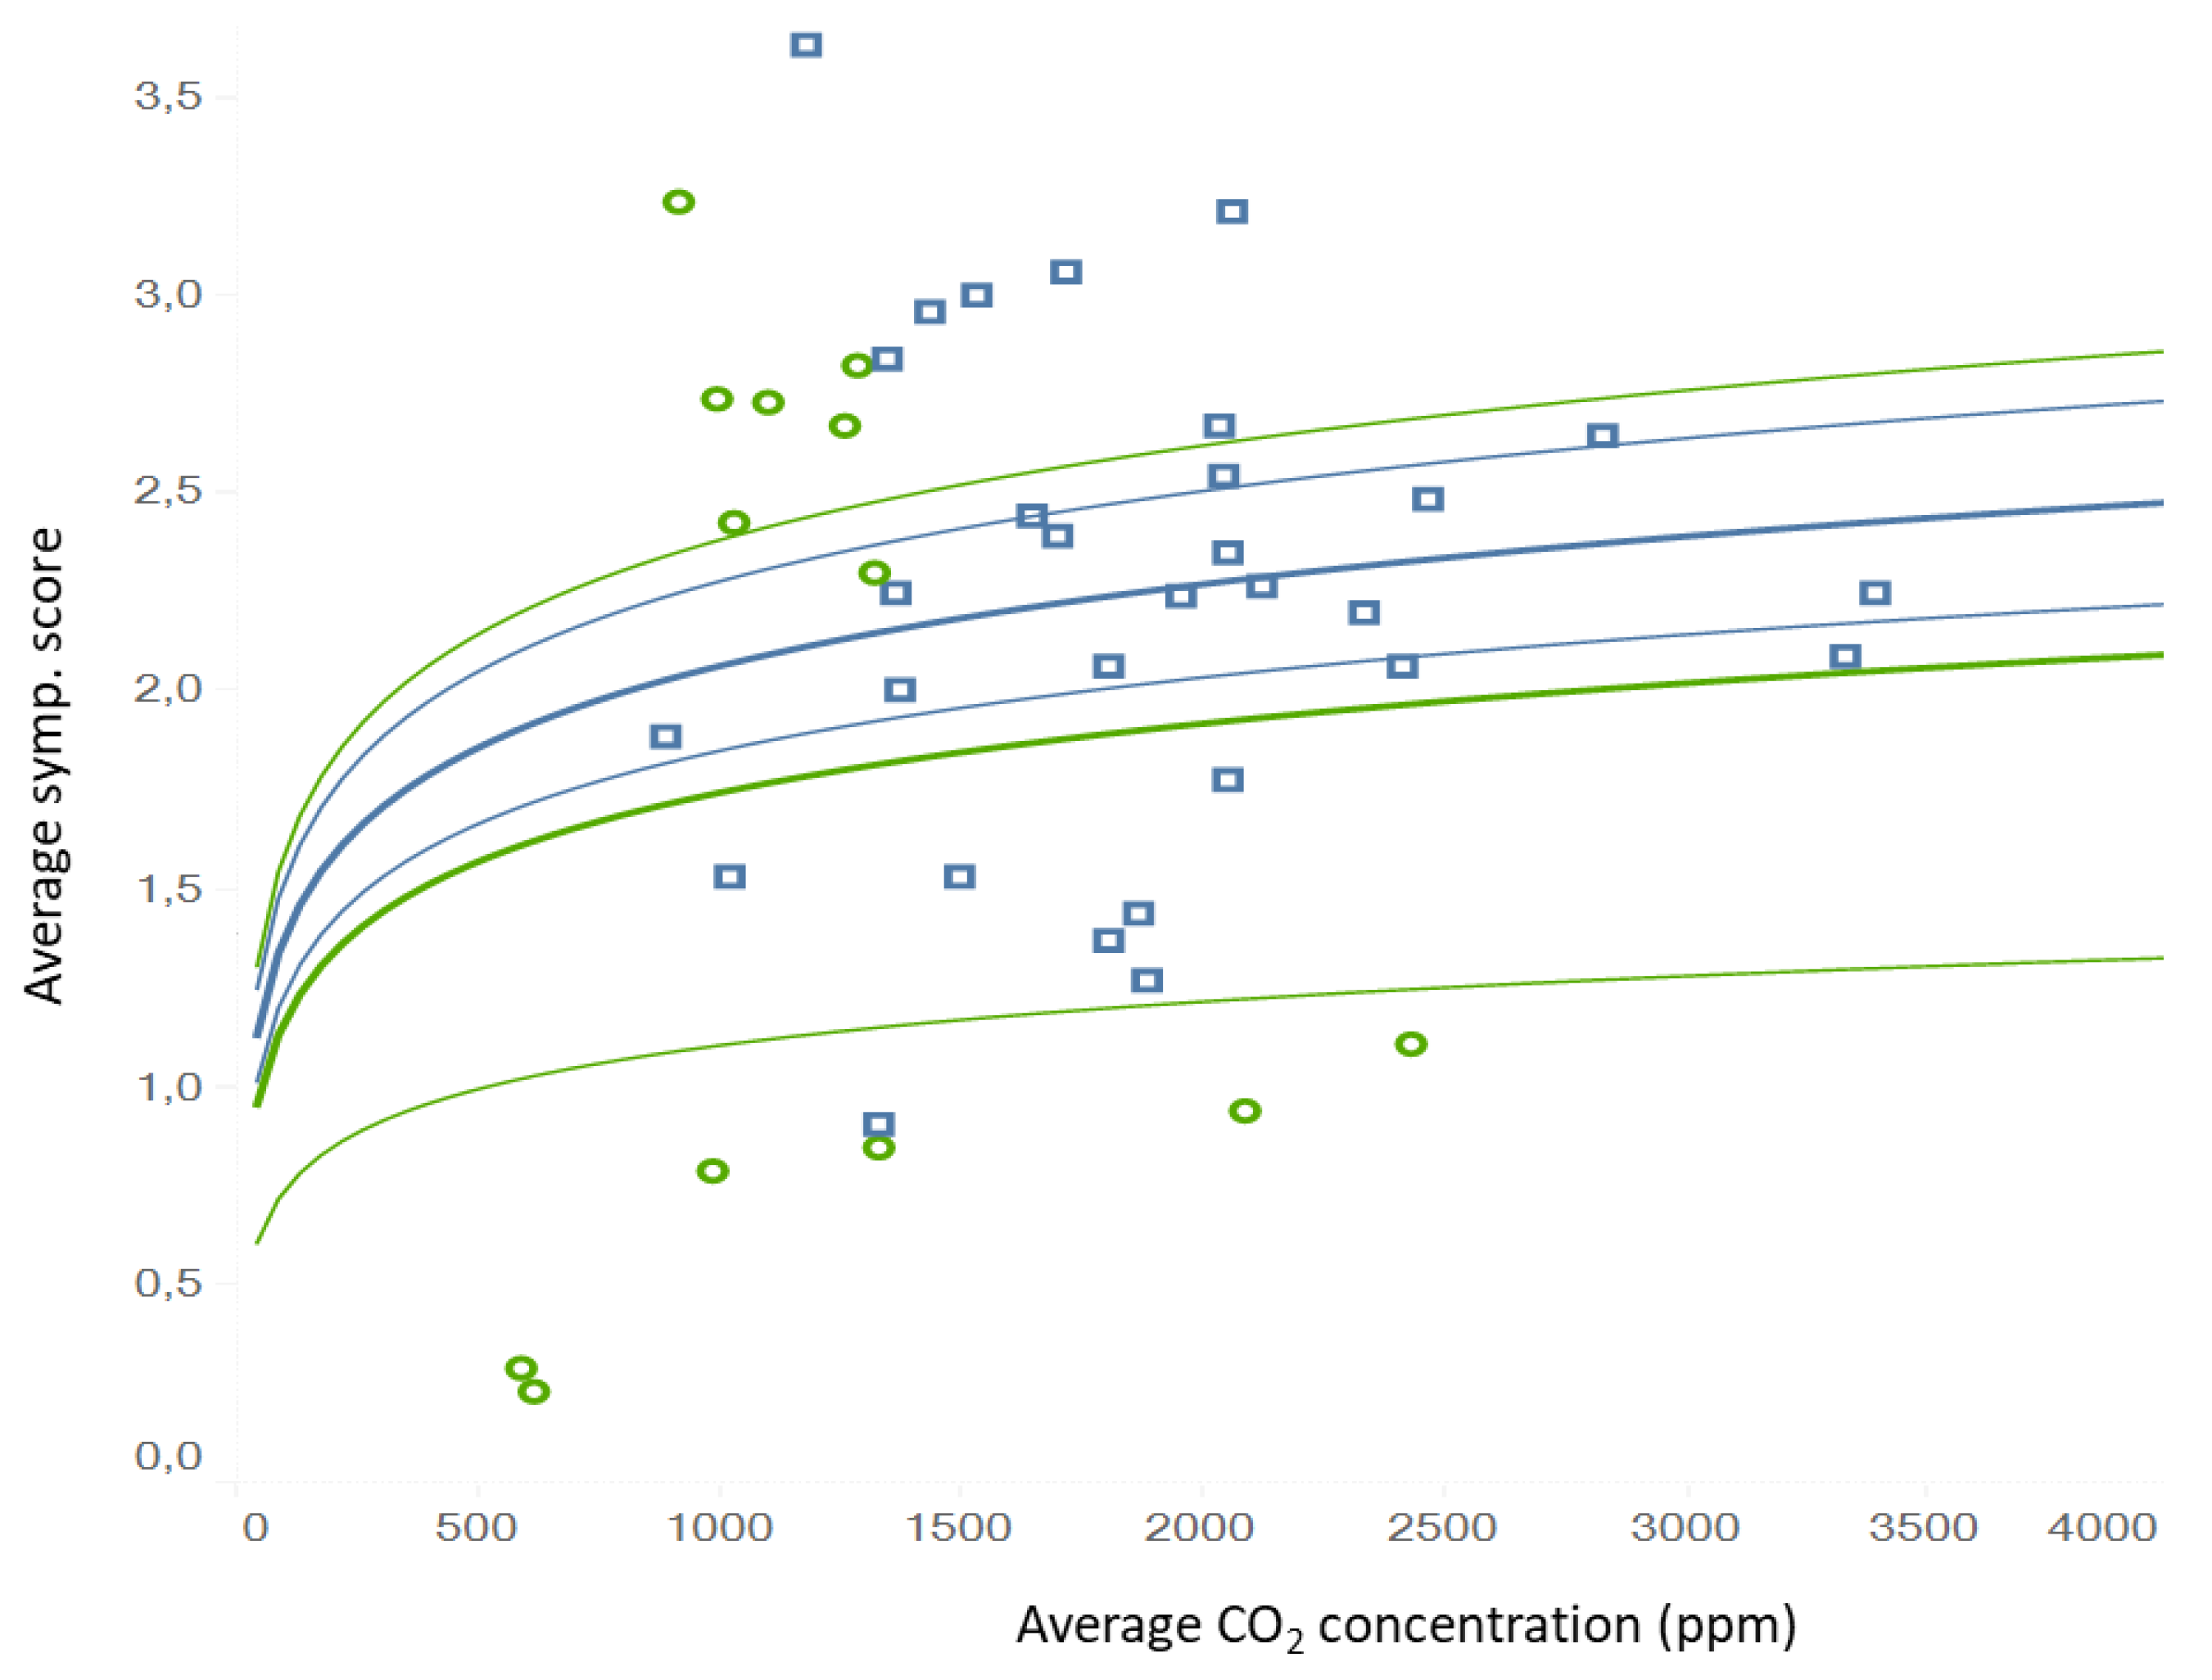
When symptomatology was assessed as global, there were some trends that could be identified. If CO2 was assumed as an overall indicator of indoor air renovation (not as a contaminant itself), the worsening of indoor environment linked with the increase of symptoms related. It can be approximated to a logarithmic regression relation (Figure 14), although a wide spread of values must be assumed. Different patterns for winter and midseason were described due to adaptation of users and the influence of outdoor species. Although this model presents some uncertainty for its use as a prediction tool, it does have the capacity to act as a qualitative indicator.
A linear trend model was calculated for the average symptom score and given a record of the average indoor CO2 (logarithmic fit). The model was statistically significant at p < 0.05, having a high correlation coefficient (R2 = 0.8833) and a mean square error (MSE) of 0.6160.
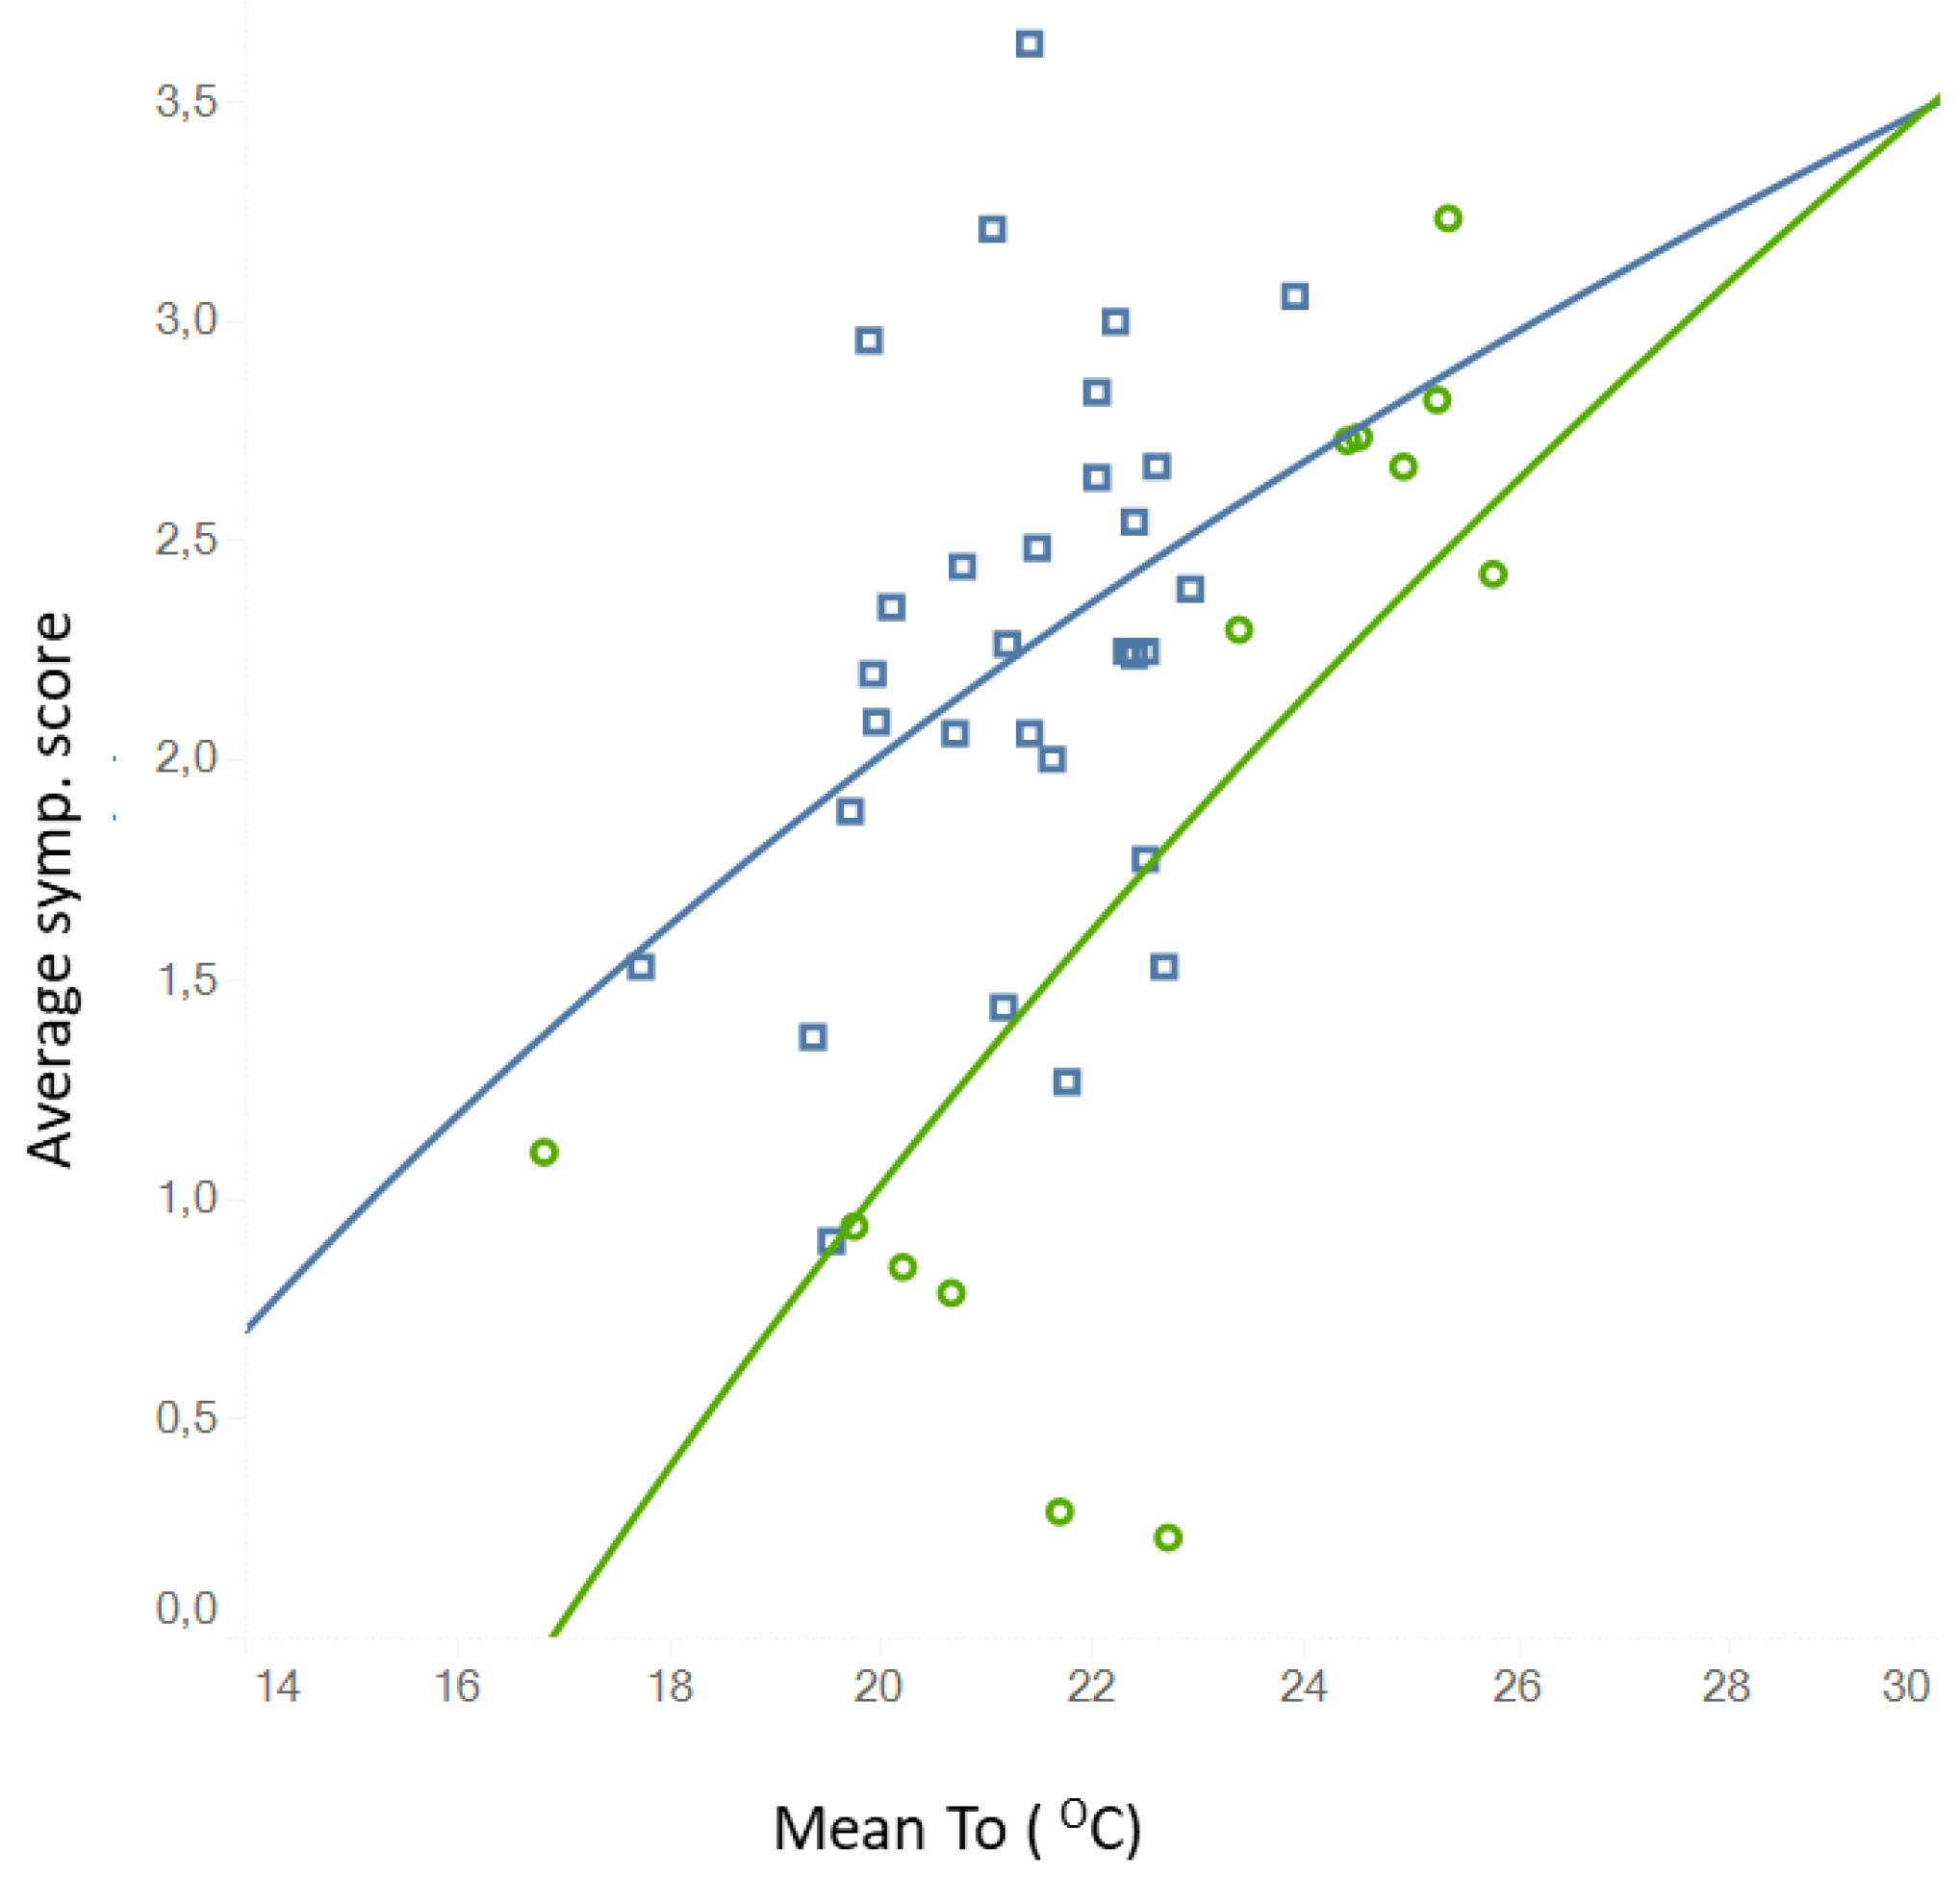
A somewhat weaker linear relationship (logarithmic fit also) was seen (R² = 0.509 for midseason and R² = 0.143 for winter) but with statistical signification (p-value < 0.05 in both cases) and an error of MSE 0.425. Although dispersion was high, it was also a useful qualitative trend indicator, and was found between the overall perception of symptoms and the indoor operative temperature (Figure 15). In this case, it can be established that the symptoms tended to be more frequent when indoor temperatures increased, also with specific patterns for winter and middle season.

5. Conclusions

A wide study sample of 47 naturally ventilated multipurpose classrooms of the most representative climate zones of southern Spain was characterized and analyzed through field measurements and surveys distributions, in order to contrast environmental sensation votes, perception, and indoor-related symptoms described by 977 students during lessons with physical and environmental parameters, as well as operational scenarios.
The main operational case to be analyzed, according to votes and symptoms, was the windows’ operation. In this sense, the 61% of the case studies during winter season had the windows open, which can be related both to a bad regulation of the heating system (the slight heat excess had to be dissipated) as well as to a poor indoor environment perception. In this way, the case studies with open windows in winter had a higher mean indoor air temperature value (21.5 °C versus 21.0 °C) and higher standard deviation of the mean radiant temperature (2.6 °C versus 1.6 °C). The mean thermal perception of students in winter season with open windows reinforced this slight heat excess, given that it was in a comfort range but 0.15 points warmer than in the case of closed windows, also expressing a thermal preference of thermal neutrality-mild cold (−0.06 on the ASHRAE scale) with open windows in contrast to the preference for a warmer environment when the windows were closed (+0.13). The thermal assessment of the environment through the thermal comfort vote (TCV) also had a poorer value with open windows (−0.44 versus −0.35 from 0 to −4), also showing a higher deviation in the votes (0.75 versus 0.54) and a somewhat higher linear correlation with CO2 concentration. Therefore, the architectural design should take into account to guarantee the air quality of the venue, as well as a comfortable heating system, in order to lead students to not open the windows uncontrollably, which produces, as explained above, a noticeable energy consumption and distorts interior comfort control.
The operation of windows during winter helps to decrease the mean value of CO2 concentration, with 1537 ppm versus 2164 ppm with windows closed; but, in most of cases, this decrease was insufficient both to be within the standard recommendations for healthy environments and to reach threshold values of perceptions of the users. Given that the mean CO2 concentration level was still high even when windows were open, the mean environmental perception of the students (EPV) was not strongly influenced by the opening of windows, with almost 30% of students expressing a certain level of annoying odor in both cases, but also having a moderate correlation between poor environment perception and CO2 concentration just when windows were closed. Therefore, it can be stated that there was not a high correlation between the CO2 value and the students’ perceptions, mainly due to the olfactory adaptation phenomenon, irrespective of the need to provide a suitable air quality for healthiness purpose. In this way, when symptoms reported were added to this analysis, they presented a not-direct relationship with EPV, with the higher complaint values when windows were open. This odor perception was also somehow related with tiredness, difficulty on concentrating, eye irritation, headache, and dry throat.
In midseasons, windows’ operation led to a greater variation of indoor thermal values, both air and radiant, also maintaining in general CO2 levels over the WHO recommendations (mean vale of 1537 ppm). In addition, students’ TSVs were higher with open windows, close to the thermal comfort limit by warmth. Furthermore, the odor perception (EPV) was also poorer (0.63 value versus 0.52) when windows were open in midseasons, reinforcing the finding that windows alone are not able to provide an adequate renewal capacity for the indoor environment.
The study of the symptoms reported during measurements showed that they were largely expressed by students, both for windows open and closed, particularly in the case of difficulty of concentrating (52%), headache and tiredness (46%), followed by dry throat and nasal congestion (39%), which also were the symptoms most frequently combined with the other symptoms. According to the studied scenario, without a mechanically controlled ventilation system, complaints were more often found during winter, especially when windows were closed. In midseason conditions, symptoms were somewhat less common, but students expressed more acute symptomatology when windows were open, especially for dry throat, itchiness, nasal congestion, and headache, which are symptoms that can be related to hypersensitivity to external agents such as allergies and other respiratory conditions. This conclusion states the clear need to provide a ventilation system with a suitable filtering.
Regarding the relationship with indoor temperature, it can also be established that the symptoms tended to be more frequent when indoor temperatures increased, also with specific patterns for winter and middle season, also related to the occupants’ thermal perceptions.
Other operation factors, like illuminance and illuminance uniformity, as well as students’ clothing insulation, were analyzed referred to this symptomatology, but no clear correlation was obtained. In the case of lighting parameters, almost all the classrooms under study were generally over 350–400 lx with a uniformity of 0.40–0.50, so they were values good enough to not influence students at a symptomatic level. The correlated color temperature was similar in all cases, varying from 3500 to 5500 K; hence, it can be considered that both the amount of light and hue did not affect the thermal perception of the participants. On the other hand, students had the possibility of freely varying the level of clothing insulation, according to their individual thermal needs, so its impact on symptomatology was diminished.
In conclusion, the findings of this study show that effectively controlled ventilation systems are needed to assure an actual indoor ambient renovation and clean air supply. The special sensibility to external species make it advisable to incorporate filtering and cleaning systems for outdoor air beyond the impact on investment costs and energy use that this may entail. In addition, the study of symptomatology suggests that CO2 indicator should be complemented by other pollutants’ measurements to assure a proper interpretation of data, given that they could not be correctly identified exclusively using this single CO2 control parameter. As explained above, CO2 levels have a fuzzy influence in the students’ symptomatology; hence, the air quality should be complementarily assessed through other parameters, such as particle or VOCs’ levels.
The following points can be established as key aspects:
The use of CO2 as a standalone indicator of environmental quality, especially for the management of ventilation systems or driving the windows’ opening, may be insufficient and can derivate in situations of increased user discomfort, alongside thermal-ambient disturbance. Although there was evidence that there is a relationship with the indoor CO2 levels growing (assumed as general index) and the increase in reported global symptoms, this was not a direct link and tended to be asymptotic from certain threshold levels (around 2000 ppm).
In most cases, natural ventilation systems are not able to solve properly the removal of pollutants, generating situations with high rates of complaints even when windows are open, although they can mitigate the situations during indoor peak situations (such as produced in winter season). In many cases, windows’ opening can be counterproductive, given that, although the classic indicators of the indoor environment valuation improve, the perception of the users was negative or, at least, worse than in situations with closed windows.
Assuming that indoor ambient is a complex and multifactor model, in the current state of the art of school buildings, the use of natural ventilation by itself (with the typical configuration of classrooms and enclosures of the buildings in the region) does not guarantee adequate control of the indoor environment, against popular assumption in the area, both by users and administrators. This aspect, although it was previously included in the text, has been emphasized.
This fact may be related to the need to review the classic indicators and parameters commonly used in the environmental management of these spaces. This research found situations of discomfort even within the ranges generally assumed as comfortable by the standards and design guides. Thus, it is necessary to develop complementary indicators based on the perception and the probability of developing symptoms that allow contributing to the correct valorization of the indoor environments from the users’ points of view.
In this way, this analysis should also be complemented with corresponding measurements and surveys distributions in classrooms with mechanical ventilation systems in order to develop a comparison of results with adequate CO2 levels, so further research on this field is required.

Author Contributions

Conceptualization, M.Á.C.-L., S.D.-A., J.F.-A., and I.A.; methodology, M.Á.C.-L., S.D.-A., J.F.-A., and I.A.; software, M.Á.C.-L., S.D.-A., J.F.-A., and I.A.; validation, M.Á.C.-L., S.D.-A., J.F.-A., and I.A.; formal analysis, M.Á.C.-L., S.D.-A., J.F.-A., and I.A.; investigation, M.Á.C.-L., S.D.-A., J.F.-A., and I.A.; resources, M.Á.C.-L., S.D.-A., J.F.-A., and I.A.; data curation, M.Á.C.-L., S.D.-A., J.F.-A., and I.A.; writing—original draft preparation, M.Á.C.-L., S.D.-A., J.F.-A., and I.A.; writing—review and editing, M.Á.C.-L., S.D.-A., J.F.-A., and I.A.; visualization, M.Á.C.-L., S.D.-A., J.F.-A., and I.A.; supervision, M.Á.C.-L., S.D.-A., J.F.-A., and I.A.; project administration, M.Á.C.-L., S.D.-A., J.F.-A., and I.A.; funding acquisition, M.Á.C.-L., S.D.-A., J.F.-A., and I.A. All authors have read and agreed to the published version of the manuscript.

Funding

This research was partially funded by the PIF Program of the Universidad de Sevilla (V Plan Propio).

Acknowledgments

The authors wish to express their gratitude to Jaime Costa-Luque for reviewing the manuscript and helping with several of the graphics, to Blas Lezo for the encouragement of this article, as well as to the students, teachers, and management team of the secondary schools which were part of this study. Finally, to the Public Entity “Agencia Pública Andaluza de Educación” from the Regional Government of Andalucía.

Conflicts of Interest

The authors declare no conflicts of interest.

Appendix A

Table A1. Excerpt from the surveys distributed to students.
What is your perception of the environment at this precise moment□
Hot □Warm □A bit warm □Neutral □A bit cool □Cool □Cold □
How do you feel at this precise moment□
Comfortable □A bit uncomfortable □Uncomfortable □Quite uncomfortable □Extremely uncomfortable □
How do you feel at this precise moment□
A lot warmer □Warmer □A bit warmer □No change □A bit colder □Colder □A lot colder □
Do you accept this thermal environment rather than reject it□Yes □No □
What does the air smell like at this precise moment□
Without odor □Slightly bad odor □Bad odor □Offensive odor □Repugnant odor □
Do you feel these symptoms at this precise moment□
Difficulty concentratingQuite □A bit □No □
Dry throatQuite □A bit □No □DizzinessQuite □A bit □No □
Dry skinQuite □A bit □No □ItchinessQuite □A bit □No □
NauseaQuite □A bit □No □Nasal congestionQuite □A bit □No □
Eye irritationQuite □A bit □No □HeadacheQuite □A bit □No □
Chest oppressionQuite □A bit □No □TirednessQuite □A bit □No □

References

  1. Lane, W.R. Education, Children and Comfort; University of Iowa: Ames, IA, USA, 1965. [Google Scholar]
  2. Pepler, R.D. The thermal comfort of students in climate-controlled and non-climate-controlled schools. Ashrae Trans. 1972, 78, 97–109. [Google Scholar]
  3. Auliciems, A. Thermal sensations of secondary school children in summer time. J. Hyg. (Lond) 1973, 71, 453–458. [Google Scholar] [CrossRef] [PubMed] [Green Version]
  4. Humphreys, M. A study of the thermal comfort of primary school children in summer. Build. Environ. 1977, 12, 231–239. [Google Scholar] [CrossRef]
  5. Zomorodian, Z.S.; Tahsildoost, M.; Hafezi, M. Thermal comfort in educational buildings: A review article. Renew. Sustain. Energy Rev. 2016, 59, 895–906. [Google Scholar] [CrossRef]
  6. Karimipanah, T.; Awbi, H.B.; Sandberg, M.; Blomqvist, C. Investigation of air quality, comfort parameters and effectiveness for two floor-level air supply systems in classrooms. Build. Environ. 2007, 42, 647–655. [Google Scholar] [CrossRef]
  7. Shendell, D.G.; Prill, R.; Fisk, W.J.; Apte, M.G.; Blake, D.; Faulkner, D. Associations between classroom CO2 concentrations and student attendance in Washington and Idaho. Indoor Air 2004, 14, 333–341. [Google Scholar] [CrossRef]
  8. Mors, S.T.; Hensen, J.L.; Loomans, M.G.; Boerstra, A.C. Adaptive thermal comfort in primary school classrooms: Creating and validating PMV-based comfort charts. Build. Environ. 2011, 46, 2454–2461. [Google Scholar] [CrossRef] [Green Version]
  9. Mainka, A.; Zajusz-Zubek, E.; Mainka, A.; Zajusz-Zubek, E. Indoor Air Quality in Urban and Rural Preschools in Upper Silesia, Poland: Particulate Matter and Carbon Dioxide. Int. J. Environ. Res. Public Health 2015, 12, 7697–7711. [Google Scholar] [CrossRef] [Green Version]
  10. Hedge, A. Ergonomic Workplace Design for Health, Wellness, and Productivity; CRC Press: Boca Raton, FL, USA, 2016. [Google Scholar]
  11. Corgnati, S.P.; Ansaldi, R.; Filippi, M. Thermal comfort in Italian classrooms under free running conditions during mid seasons: Assessment through objective and subjective approaches. Build. Environ. 2009, 44, 785–792. [Google Scholar] [CrossRef]
  12. Almeida, S.M.; Canha, N.; Silva, N.; do Carmo Freitas, M.; Pegas, P.; Alves, C.; Evtyugina, M.; Adrião Pio, C. Children exposure to atmospheric particles in indoor of Lisbon primary schools. Atmos. Environ. 2011, 45, 7594–7599. [Google Scholar] [CrossRef]
  13. de Giuli, V.; da Pos, O.; de Carli, M. Indoor environmental quality and pupil perception in Italian primary schools. Build. Environ. 2012, 56, 335–345. [Google Scholar] [CrossRef]
  14. Teli, D.; James, P.A.B.; Jentsch, M.F. Thermal comfort in naturally ventilated primary school classrooms. Build. Res. Inf. 2013, 41, 301–316. [Google Scholar] [CrossRef]
  15. de Giuli, V.; Zecchin, R.; Corain, L.; Salmaso, L. Measured and perceived environmental comfort: Field monitoring in an Italian school. Appl. Ergon. 2014, 45, 1035–1047. [Google Scholar] [CrossRef] [PubMed]
  16. Campano, M.Á.; Domínguez-Amarillo, S.; Fernández-Agüera, J.; Sendra, J.J. Thermal Perception in Mild Climate: Adaptive Thermal Models for Schools. Sustainability 2019, 11, 3948. [Google Scholar] [CrossRef] [Green Version]
  17. Fernández-Agüera, J.; Campano, M.A.; Domínguez-Amarillo, S.; Acosta, I.; Sendra, J.J. CO2 Concentration and Occupants’ Symptoms in Naturally Ventilated Schools in Mediterranean Climate. Buildings 2019, 9, 197. [Google Scholar] [CrossRef] [Green Version]
  18. Kalimeri, K.K.; Saraga, D.E.; Lazaridis, V.D.; Legkas, N.A.; Missia, D.A.; Tolis, E.I.; Bartzis, J.G. Indoor air quality investigation of the school environment and estimated health risks: Two-season measurements in primary schools in Kozani, Greece. Atmos. Pollut. Researc 2016, 7, 1128–1142. [Google Scholar] [CrossRef]
  19. Hutter, H.P.; Haluza, D.; Piegler, K.; Hohenblum, P.; Fröhlich, M.; Scharf, S.; Uhl, M.; Damberger, B.; Tappler, P.; Kundi, M.; et al. Semivolatile compounds in schools and their influence on cognitive performance of children. Int. J. Occup. Med. Environ. Health 2013. [Google Scholar] [CrossRef]
  20. Sousa, S.I.V.; Ferraz, C.; Alvim-Ferraz, M.C.M.; Vaz, L.G.; Marques, A.J.; Martins, F.G. Indoor air pollution on nurseries and primary schools: Impact on childhood asthma - Study protocol. Bmc Public Health 2012. [Google Scholar] [CrossRef] [Green Version]
  21. Fromme, H.; Diemer, J.; Dietrich, S.; Cyrys, J.; Heinrich, J.; Lang, W.; Kiranoglu, M.; Twardella, D. Chemical and morphological properties of particulate matter (PM10, PM2.5) in school classrooms and outdoor air. Atmos. Environ. 2008, 42, 6597–6605. [Google Scholar] [CrossRef]
  22. Koenig, J.Q.; Mar, T.F.; Allen, R.W.; Jansen, K.; Lumley, T.; Sullivan, J.H.; Trenga, C.A.; Larson, T.; Liu, L.J. Pulmonary effects of indoor- and outdoor-generated particles in children with asthma. Environ. Health Perspect. 2005, 113, 499–503. [Google Scholar] [CrossRef] [Green Version]
  23. ISO. ISO 7730:2005—Ergonomics of the Thermal Environment—Analytical Determination and Interpretation of Thermal Comfort Using Calculation of the PMV and PPD Indices and Local Thermal Comfort Criteria; International Organization for Standardization: Geneva, Switzerland, 2005. [Google Scholar]
  24. CEN—European Committee for Standardization. CR 1752:1998—Ventilation for Buildings. Design Criteria for the Indoor Environment; European Committee for Standardization: Brussels, Belgium, 2008. [Google Scholar]
  25. CEN—European Committee for Standardization. EN 13779:2008—Ventilation for non-Residential Buildings—Performance Requirements for Ventilation and Room-Conditioning Systems; CEN—European Committee for Standardization: Brussels, Belgium, 2008. [Google Scholar]
  26. Gobierno de España. Real Decreto 1826/2009, de 11 de diciembre, por el que se modifica el Reglamento de Instalaciones Térmicas en los Edificios, aprobado por el Real Decreto 1027/2007. Boletín Estado 2009, 298, 104924–104927. [Google Scholar]
  27. AENOR—Asociación Española de Normalización y Certificación. UNE-EN 15251:2008—Indoor Environmental Input Parameters for Design and Assessment of Energy Performance of Buildings Addressing Indoor Air Quality, Thermal Environment, Lighting and Acoustics; AENOR—Asociación Española de Normalización y Certificación: Madrid, Spain, 2008. [Google Scholar]
  28. Fisk, W.J. How home ventilation rates affect health: A literature review. Indoor Air 2018, 28, 473–487. [Google Scholar] [CrossRef] [PubMed] [Green Version]
  29. Annesi-Maesano, I.; Hulin, M.; Lavaud, F.; Raherison, C.; Kopferschmitt, C.; de Blay, F.; André Charpin, D.; Denis, C. Poor air quality in classrooms related to asthma and rhinitis in primary schoolchildren of the French 6 Cities Study. Thorax 2012, 67, 682–688. [Google Scholar] [CrossRef] [PubMed] [Green Version]
  30. Annesi-Maesano, I.; Baiz, N.; Banerjee, S.; Rudnai, P.; Rive, S. Indoor air quality and sources in schools and related health effects. J. Toxicol. Environ. Heal. Part B Crit. Rev. 2013, 16, 491–550. [Google Scholar] [CrossRef]
  31. Regional Enviornmental Center. Schools Indoor Pollution and Health Observatory Network in Europe. Eur. Union 2014. [Google Scholar]
  32. Mohai, P.; Kweon, B.S.; Lee, S.; Ard, K. Air pollution around schools is linked to poorer student health and academic performance. Health Aff. 2011, 30, 852–862. [Google Scholar] [CrossRef] [Green Version]
  33. Mendell, M.J.; Heath, G.A. Do indoor pollutants and thermal conditions in schools influence student performance? A critical review of the literature. Indoor Air 2005, 15, 27–52. [Google Scholar] [CrossRef]
  34. Mendell, M.J.; Eliseeva, E.A.; Davies, M.M.; Lobscheid, A. Do classroom ventilation rates in California elementary schools influence standardized test scores? Results from a prospective study. Indoor Air 2016, 26, 546–557. [Google Scholar] [CrossRef]
  35. Finell, E.; Tolvanen, A.; Haverinen-Shaughnessy, U.; Laaksonen, S.; Karvonen, S.; Sund, R.; Luopa, P.; Pekkanen, J.; Ståhl, T. Indoor air problems and the perceived social climate in schools: A multilevel structural equation analysis. Sci. Total Environ. 2018, 624, 1504–1512. [Google Scholar] [CrossRef] [Green Version]
  36. Chithra, S.V.; Nagendra, S.M.S. A review of scientific evidence on indoor air of school building: Pollutants, sources, health effects and management. Asian J. Atmos. Environ. 2018, 12, 87–108. [Google Scholar] [CrossRef]
  37. Pearce, N.; Douwes, J.; Beasley, R. The rise and rise of asthma: A new paradigm for the new millennium? J. Epidemiol. Biostat. 2000, 5, 5–16. [Google Scholar] [PubMed]
  38. Madureira, J.; Paciência, I.; Cavaleiro Rufo, J.; Ramos, E.; Barros, H.; Paulo Teixeira, J.; De Oliveira Fernandes, E. Indoor air quality in schools and its relationship with children’s respiratory symptoms. Atmos. Environ. 2015, 118, 145–156. [Google Scholar] [CrossRef] [Green Version]
  39. Silva, M.F.; Maas, S.; de Souza, H.A.; Gomes, A.P. Post-occupancy evaluation of residential buildings in Luxembourg with centralized and decentralized ventilation systems, focusing on indoor air quality (IAQ). Assessment by questionnaires and physical measurements. Energy Build. 2017, 148, 119–127. [Google Scholar] [CrossRef]
  40. Hernandez, R.; Bassett, S.M.; Boughton, S.W.; Schuette, S.A.; Shiu, E.W.; Moskowitz, J.T. Psychological Well-Being and Physical Health: Associations, Mechanisms, and Future Directions. Emot. Rev. 2018, 10, 18–29. [Google Scholar] [CrossRef]
  41. Sakellaris, I.A.; Saraga, D.E.; Mandin, C.; Roda, C.; Fossati, S.; de Kluizenaar, Y.; Carrer, P.; Dimitroulopoulou, S.; Mihucz, V.G.; Szigeti, T.; et al. Perceived indoor environment and occupants’ comfort in European ‘Modern’ office buildings: The OFFICAIR Study. Int. J. Environ. Res. Public Health 2016, 13, 444. [Google Scholar] [CrossRef] [Green Version]
  42. al horr, Y.; Arif, M.; Katafygiotou, M.; Mazroei, A.; Kaushik, A.; Elsarrag, E. Impact of indoor environmental quality on occupant well-being and comfort: A review of the literature. Int. J. Sustain. Built Environ. 2016, 5, 1–11. [Google Scholar] [CrossRef]
  43. Wargocki, P.; Frontczak, M.; Schiavon, S.; Goins, J.; Arens, E.; Zhang, H. Satisfaction and self-estimated performance in relation to indoor environmental parameters and building features. In Proceedings of the 10th International Conference on Healthy Buildings, Brisbane, Australia, 8–12 July 2012. [Google Scholar]
  44. Kraus, M.; Novakova, P. Gender Differences in Perception of Indoor Environmental Quality (IEQ). Iop Conf. Ser. Mater. Sci. Eng. 2019, 603. [Google Scholar] [CrossRef] [Green Version]
  45. Rupp, R.F.; Vásquez, N.G.; Lamberts, R. A review of human thermal comfort in the built environment. Energy Build. 2015. [Google Scholar] [CrossRef]
  46. Kim, J.; de Dear, R. The effects of contextual differences on office workers’ perception of indoor environment. In Proceedings of the Indoor Air 2014—13th International Conference on Indoor Air Quality and Climate, Hong Kong, China, 8–12 July 2014. [Google Scholar]
  47. Fanger, P. Thermal Comfort: Analysis and Applications in Environmental Engineering; Copenhagen Danish Technical Press: Copenhagen, Denmark, 1970. [Google Scholar]
  48. d’Ambrosio, F.R.; Olesen, B.W.; Palella, B.I.; Povl, O. Fanger’s impact ten years later. Energy Build. 2017, 152, 243–249. [Google Scholar] [CrossRef] [Green Version]
  49. McCartney, K.J.; Nicol, J.F. Developing an adaptive control algorithm for Europe. Energy Build. 2002, 34, 623–635. [Google Scholar] [CrossRef]
  50. Nicol, J.F.; Humphreys, M.A. Derivation of the adaptive equations for thermal comfort in free-running buildings in European standard EN15251. Build. Environ. 2010, 45, 11–17. [Google Scholar] [CrossRef]
  51. Guedes, M.C.; Matias, L.; Santos, C.P. Thermal comfort criteria and building design: Field work in Portugal. Renew. Energy 2009, 34, 2357–2361. [Google Scholar] [CrossRef]
  52. Matias, L. Desenvolvimento de um Modelo Adaptativo Para Definição das Condições de Conforto Térmico em Portugal; Universidade técnica de Lisboa: Lisboa, Portugal, 2010. [Google Scholar]
  53. Teli, D.; Jentsch, M.F.; James, P.A. Naturally ventilated classrooms: An assessment of existing comfort models for predicting the thermal sensation and preference of primary school children. Energy Build. 2012, 53, 166–182. [Google Scholar] [CrossRef]
  54. Fanger, P.O.; Toftum, J. Extension of the PMV model to non-air-conditioned buildings in warm climates. Energy Build. 2002, 34, 533–536. [Google Scholar] [CrossRef]
  55. Junta de Andalucía. Consejería de Innovación. Orden VIV/1744/2008 de 9 de junio, por la que se aprueba la ‘Zonificación Climática de Andalucía por Municipios para su uso en el Código Técnico de la Edificación en su sección de Ahorro de Energía apartado de Limitación de Demanda Energética (CTE-HE1). Boletín Of. la Junta Andalucía 2008, 254, 4216. [Google Scholar]
  56. Ministerio de Fomento del Gobierno de España. Código Técnico de la Edificación. 2006. Available online: http://www.codigotecnico.org (accessed on 20 April 2019).
  57. de la Flor, F.J.S.; Domínguez, S.Á.; Félix, J.L.M.; Falcón, R.G. Climatic zoning and its application to Spanish building energy performance regulations. Energy Build. 2008, 40, 1984–1990. [Google Scholar] [CrossRef]
  58. Kottek, M.; Grieser, J.; Beck, C.; Rudolf, B.; Rubel, F. World Map of the Köppen-Geiger climate classification updated. Meteorol. Z. 2006, 15, 259–263. [Google Scholar] [CrossRef]
  59. Junta de Andalucía. Orden de 24 de enero de 2003 de la Consejería de Educación y Ciencia de la Junta de Andalucía por la que se aprueban las ‘Normas de diseño y constructivas para los edificios de uso docente. Boletín Of. La Junta Andal. 2003, 43, 4669. [Google Scholar]
  60. Campano, M.A.; Pinto, A.; Acosta, I.; Muñoz-González, C. Analysis of the Perceived Thermal Comfort in a Portuguese Secondary School: Methodology and Results. Int. J. Eng. Technol. 2017, 9, 448–455. [Google Scholar] [CrossRef] [Green Version]
  61. Campano, M.A.; Sendra, J.J.; Domínguez, S. Analysis of thermal emissions from radiators in classrooms in Mediterranean climates. Procedia Eng. 2011, 21, 106–113. [Google Scholar] [CrossRef] [Green Version]
  62. AENOR. UNE-EN ISO 7726 - Ergonomics of the Thermal Environment. Instruments for Measuring Physical Quantities; AENOR - Asociación Española de Normalización y Certificación: Madrid, Spain, 2003. [Google Scholar]
  63. American Society of Heating Refrigerating and Air Conditioning Engineers. ASHRAE Handbook-Fundamentals; ASHRAE Handbook Committee: Atlanta, GA, USA, 2017. [Google Scholar]
  64. Winslow, C.E.A.; Herrington, L.P.; Gagge, A.P. Physiological reactions to environmental temperature. Am. J. Physiol. 1937, 120, 1–22. [Google Scholar] [CrossRef] [Green Version]
  65. Campano, M.A.; Pinto, A.; Acosta, I.; Sendra, J.J. Validation of a dynamic simulation of a classroom HVAC system by comparison with a real model. Sustain. Dev. Renov. Archit. Urban. Eng. 2017, 381–392. [Google Scholar]
  66. International Organization for Standardization. ISO 10551:1995—Ergonomics of the Physical Environment—Subjective Judgement Scales for Assessing Physical Environments; International Organization for Standardization: Geneva, Switzerland, 1995. [Google Scholar]
  67. International Organization for Standardization. ISO 9920:2007—Ergonomics of the Thermal Environment e Estimation of the Thermal Insulation and Evaporative Resistance of a Clothing Ensemble; International Organization for Standardization: Geneva, Switzerland, 2007. [Google Scholar]
  68. Havenith, G.; Holmér, I.; Parsons, K. Personal factors in thermal comfort assessment: Clothing properties and metabolic heat production. Energy Build. 2002, 34, 581–591. [Google Scholar] [CrossRef]
  69. Campano, M.A. Confort Térmico y Eficiencia Energética en Espacios con Alta Carga Interna Climatizados: Aplicación a Espacios Docentes no Universitarios en Andalucía. Ph.D. Thesis, Universidad de Sevilla, Seville, Spain, 2015. [Google Scholar]
  70. Penney, D.; Adamkiewicz, D.; Ross, H.; Kenichi, A.; Vernon, A.; Benignus, P.; Hyunok, C.; Cohen, A.; Däumling, C.; Delgado, J.M.; et al. WHO Guidelines for Indoor Air Quality: Selected Pollutants; World Health Organization Regional Office for Europe: Copenhagen, Denmark, 2010; Volume 9. [Google Scholar]
  71. Bellia, L.; Bisegna, F.; Spada, G. Lighting in indoor environments: Visual and non-visual effects of light sources with different spectral power distributions. Build. Environ. 2011, 46, 1984–1992. [Google Scholar] [CrossRef]
  72. Acosta, I.; Campano, M.A.; Leslie, R.; Radetski, L. Daylighting design for healthy environments: Analysis of educational spaces for optimal circadian stimulus. Sol. Energy 2019, 193, 584–596. [Google Scholar] [CrossRef]
  73. Cariñanos, P.; Galan, C.; Alcázar, P.; Domínguez, E. Airborne pollen records response to climatic conditions in arid areas of the Iberian Peninsula. Environ. Exp. Bot. 2004. [Google Scholar] [CrossRef]
  74. Galán, C.; García-Mozo, H.; Cariñanos, P.; Alcázar, P.; Domínguez-Vilches, E. The role of temperature in the onset of the Olea europaea L. pollen season in southwestern Spain. Int. J. Biometeorol. 2001. [Google Scholar] [CrossRef]
  75. Annesi-Maesano, I.; Moreau, D.; Caillaud, D.; Lavaud, F.; Le Moullec, Y.; Taytard, A.; Pauli, G.; Charpin, D. Residential proximity fine particles related to allergic sensitisation and asthma in primary school children. Respir. Med. 2007, 101, 1721–1729. [Google Scholar] [CrossRef]
  76. Knasko, S.C. Ambient odor’s effect on creativity, mood, and perceived health. Chem. Senses 1992. [Google Scholar] [CrossRef]
  77. Hoehner, C.M.; Ramirez, L.K.B.; Elliott, M.B.; Handy, S.L.; Brownson, R.C. Perceived and objective environmental measures and physical activity among urban adults. Am. J. Prev. Med. 2005. [Google Scholar] [CrossRef]
  78. Zhang, X.; Wargocki, P.; Lian, Z.; Thyregod, C. Effects of exposure to carbon dioxide and bioeffluents on perceived air quality, self-assessed acute health symptoms, and cognitive performance. Indoor Air 2017. [Google Scholar] [CrossRef] [PubMed] [Green Version]
  79. Fan, X.; Liu, W.; Wargocki, P. Physiological and psychological reactions of sub-tropically acclimatized subjects exposed to different indoor temperatures at a relative humidity of 70%. Indoor Air 2019. [Google Scholar] [CrossRef] [PubMed]
  80. Pastore, L.; Andersen, M. Building energy certification versus user satisfaction with the indoor environment: Findings from a multi-site post-occupancy evaluation (POE) in Switzerland. Build. Environ. 2019, 150, 60–74. [Google Scholar] [CrossRef]
Figure 1. Multipurpose classroom according to Andalusian design standards: (a) Plant with windows, doors, and furniture standard distribution. (b) A-A’ vertical section.
Atmosphere 11 00357 g001
Figure 2. Protocols developed for the characterization of the airtightness of the classrooms.
Atmosphere 11 00357 g002
Figure 3. The 3-D array of measurement points superimposed in a multipurpose classroom. Red dots show values at 0.6 m, dark red dots at 1.7 m, orange dots represent measures in the room’s envelope, and blue dot is the window.
Atmosphere 11 00357 g003
Figure 4. Quartile distribution for indoor air temperature and operative temperature. (a) Quartile distribution for indoor air temperature; (To) winter (top) and mid-season (down) with windows closed (0) and open (1). (b) Quartile distribution for operative temperature (To); winter (top) and mid-season (down) with windows closed (0) and open (1).
Atmosphere 11 00357 g004
Figure 5. CO2 concentration distribution. (a) General CO2 concentration density trace for winter (blue) and mid-season (red). (b) Detailed CO2 concentration density trace for winter (blue) and mid-season (red) with closed windows (continuous line) and windows open (dot line).
Atmosphere 11 00357 g005
Figure 6. Indoor and outdoor air temperature values (Ta), mean radiant temperature values ( t r ¯ ), relative humidity (HR) values and indoor and outdoor CO2 concentration values related to seasons and windows’ and doors’ operation.
Atmosphere 11 00357 g006
Figure 7. Room illuminance. (a) Hourly distribution for mean-room illuminance by season: winter (blue) and middle-season (red). (b) Quartile distribution of mean-room-illuminance by season (top) winter (down) mid-season.
Atmosphere 11 00357 g007
Figure 8. Accumulated frequency for the environmental perception and thermal comfort votes, related to seasons and windows’ and doors’ operation.
Atmosphere 11 00357 g008
Figure 9. Accumulated frequency for the designed insulated level related to seasons and windows’ and doors’ operation.
Atmosphere 11 00357 g009
Figure 10. Average probability of reported symptoms by seasons (W is winter, MS is midseasons) and windows’ operation (0 is closed, 1 is open) (severe, left group; light perception, right group for each symptom).
Atmosphere 11 00357 g010
Figure 11. Probabilistic density trace distribution for individual symptoms’ scores (winter, red; middle season, blue; windows closed, solid line; windows open, dashed line).
Atmosphere 11 00357 g011
Figure 12. Cross-tabulation for windows’ opening and outdoor air temperature. (a) Cross-tabulation for windows opening and outdoor air temperature in winter: windows closed (gray) and open (blue). (b) Cross-tabulation for windows opening and outdoor air temperature in mid-season: windows closed (gray) and open (blue).
Atmosphere 11 00357 g012
Figure 13. Fitted regression model plot for CO2 indoor concentration related to indoor-outdoor air temperature differential, closed windows (red), and windows open (blue).
Atmosphere 11 00357 g013
Figure 14. General average related symptoms’ scores relation with indoor CO2 grouped by measured classrooms (green for middle season and blue for winter).
Atmosphere 11 00357 g014
Figure 15. General average related symptoms’ scores relation with indoor operative temperature grouped by measured classrooms (green for middle season and blue for winter).
Atmosphere 11 00357 g015
Table 1. Study samples by location and climate zone.
Climate ZoneEducational InstitutionClassroomsOccupants
Köppen Climate Zone [58]Spanish Energy Performance Zone
BSkA4E1492
CSaB4E2354
CSaB4E38192
CSaB4E411186
CSaC3E5245
CSaC3E612270
CSaC3E7360
CSaC4E8478
Table 2. Acquisition points per physical parameters measured.
ParameterIndoor PointsOutdoor Measurement
Air temperature (Ta)All “A” points (0.60 and 1.70 m)Yes
Surface temperature (ts)All “B” points (0.60 and 1.70 m), S1, T1, C1No
Globe temperature (tg)A2-1, A6-1 (0.60 m)No
Relative humidity (RH)All “A” points (0.60 and 1.70 m)Yes
Air velocity (Va)All “A” points (0.60 and 1.70 m)Yes
CO2 concentration (CO2)All “A” points (0.60 and 1.70 m)Yes
Illuminance (E)All “Ax-1” points (0.60 m)No
Table 3. Characteristics and uncertainty of the sensors used for on-site measurements.
ParameterSensor 1UnitsUncertainty
Air temperature (Ta)Testo 0635.1535 (PT100)°C±0.3 °C
Surface temperature (ts)Testo 0602.0393 (Thermocouple type K)°C±0.3 °C
Mean radiant temperature (tr)Testo 0602.0743 (Globe probe, Thermocouple type K)°C±1.5 °C
Globe temperature (tg)Testo 0602 0743°C ±1.5 °C
Relative humidity (RH)Testo 0635.1535 (Capacitive)%±2%
Air velocity (Va)Testo 0635.1535 (Hot wire)m/s±0.03 m/s
CO2 concentration (CO2)Testo 0632.1535ppm±50 ppm
Data acquisition systemData Logger Testo 435-2--
Illuminance (E)PCE-134 lux-meterlux±5%
1 The instruments for hygrothermal measurements listed comply with the requirements of ISO 7726 standard [62] for class C (comfort).
Table 4. Students participating in the survey campaign according to season and sex.
StudentsAverage Value of Students per ClassroomMale StudentsFemale Students
All seasons97720.8504473
Winter season69320.4364329
Mid-seasons28421.9140144
Table 5. Mean values of environmental parameters obtained during the field measurements related to seasons and windows’ and doors’ operation.
WOW-WCW-WCW OD-WMSCW-MSOW-MS
Ta,outdoorMean9.911.49.18.318.518.518.4
(°C)SD4.42.84.95.15.33.15.9
TaMean21.121.521.020.022.422.322.5
(°C)SD1.41.31.50.82.11.62.3
t r ¯ Mean21.821.422.022.522.923.322.8
(°C)SD2.12.61.71.33.52.93.7
RHMean51495155454446
(%)SD656610910
VaMean0.030.040.030.030.010.010.01
(m/s)SD0.030.040.020.010.010.010.01
CO2 indoorMean1951153721641973126710061354
(ppm)SD552234548460499284525
CO2 outdoorMean426421429475395399394
(ppm)SD4147385181519
W are measurements during winter, MS are measurements during midseasons, OW-W are measurements during winter with open windows, OW-MS are measurements during midseasons with open windows, CW-W are measurements during winter with closed windows, CW-MS are measurements during midseasons with closed windows, CW OD-W are measurements during winter with closed windows and open doors, SD are standard deviation.
Table 6. Mean values of occupants’ votes obtained during the field measurements related to seasons and windows’ and doors’ operation.
WMSOW-WOW-MSCW-WCW-MSCW OD-W
TSVMean0.320.380.420.480.270.08-0.22
(−3 to 3)STD0.930.830.910.800.930.840.88
TPVMean0.06−0.20−0.06−0.260.130.000.55
(−3 to 3)STD1.030.960.920.981.070.861.14
PDaccMean0.810.850.800.840.810.860.76
(0 to 1)STD0.390.360.400.370.390.350.43
TCVMean0.390.300.440.320.360.250.38
(0 to 4)STD0.620.680.750.700.540.630.56
EPVMean1.030.611.060.631.010.520.79
(0 to 4)STD0.930.680.970.710.920.610.77
TSV is the thermal sensation vote, TPV is the thermal preference vote, PDacc is the thermal environment rejection percentage, TCV is the thermal comfort vote, and EPV is the environmental perception vote.
Table 7. Mean values of occupants’ clothing insulation obtained during the field measurements related to seasons and windows’ and doors’ operation.
WMSOW-WOW-MSCW-WCW-MSCW OD-W
IclMean0.900.780.900.760.900.840.89
(clo)STD0.190.230.210.230.180.230.14
Icl is the clothing insulation level of the occupants.
Table 8. Relative probability of occupants’ relating symptoms and health effects, from N (not perceived), to L (lightly perceived), and H (severe perception), with closed windows (0) and open (1).
SeasonWinterMid-Season
Windows0101
DCH9.83%7.23%9.86%6.10%
L48.25%45.53%26.76%38.97%
N41.92%47.23%63.38%54.93%
DTH6.55%5.96%4.23%6.10%
L34.93%26.81%25.35%37.09%
N58.52%67.23%70.42%56.81%
DH3.49%2.55% 0.94%
L15.94%12.34%9.86%13.15%
N80.57%85.11%90.14%85.92%
DSH4.59%3.40%2.82%2.35%
L13.10%12.77%7.04%12.68%
N82.31%83.83%90.14%84.98%
ITH2.40%2.13%2.82%0.94%
L12.88%16.17%7.04%9.39%
N84.72%81.70%90.14%89.67%
NCH5.24%6.38%2.82%5.63%
L36.68%31.49%26.76%30.52%
N58.08%62.13%70.42%63.85%
EIH3.28%2.55%1.41%3.76%
L24.02%17.02%15.49%16.43%
N72.71%80.43%83.10%79.81%
HH10.92%6.38%2.82%8.45%
L41.05%36.17%30.99%33.33%
N48.03%57.45%66.20%58.22%
COH1.53%1.28% 0.47%
L9.17%8.94%5.63%6.10%
N89.30%89.79%94.37%93.43%
TH8.08%7.23%7.04%3.76%
L43.23%39.15%22.54%35.21%
N48.69%53.62%70.42%61.03%
DC is difficulty concentrating, DT is dry throat, D is dizziness, DS is dry skin, IT is itchiness, N is nausea, NC is nasal congestion, EI is eye irritation, H is headache, CO is chest oppression, and T is tiredness.
Table 9. Statistics from symptoms’ scores for individuals’ response by season and windows’ situation (MS, middle season; W, winter; 0, windows closed; and 1, open).
MS_0W_0MS_1W_1
Average1.482.371.872.09
Median1.402.101.802.00
STD1.581.571.491.55
Min. Value0.000.000.000.00
Max. Value5.4011.006.808.80
Stand. Bias2.3354310.26113.680237.34186
Stand. Kurt.−1.3201112.19360.3428117.47186
Table 10. Average values and standard deviation of n50.
Climatic ZoneMean n50Standard Deviation
A46.530.94
C3 6.121.67
B47.892.45
C4 7.60.56
Mean 6.972.06

