Article

Extreme Drought Events over Brazil from 2011 to 2019

by
Ana Paula M. A. Cunha
1,*,
Marcelo Zeri
1,
Karinne Deusdará Leal
1,
Lidiane Costa
1,
Luz Adriana Cuartas
1,
José Antônio Marengo
1,
Javier Tomasella
1,
Rita Marcia Vieira
2,
Alexandre Augusto Barbosa
2,
Christopher Cunningham
1,
João Victor Cal Garcia
1,
Elisangela Broedel
1,
Regina Alvalá
1 and
Germano Ribeiro-Neto
1
1
National Center for Monitoring and Early Warning of Natural Disasters (CEMADEN), São José dos Campos 12247-016, Brazil
2
Earth System Science Center–CCST/National Institute for Space Research, São José dos Campos 12227-010, Brazil
*
Author to whom correspondence should be addressed.
Atmosphere 2019, 10(11), 642; https://doi.org/10.3390/atmos10110642
Submission received: 31 August 2019 / Revised: 4 October 2019 / Accepted: 11 October 2019 / Published: 24 October 2019
(This article belongs to the Special Issue Meteorological and Hydrological Droughts)

Abstract

:
Drought-related disasters are among the natural disasters that are able to cause large economic and social losses. In recent years, droughts have affected different regions of Brazil, impacting water, food, and energy security. In this study, we used the Integrated Drought Index (IDI), which combines a meteorological-based drought index and remote sensing-based index, to assess the drought events from 2011 to 2019 over Brazil. During this period, drought events were observed throughout the country, being most severe and widespread between the years 2011 and 2017. In most of the country, the 2014/15 hydrological year stands out due to the higher occurrence of severe and moderate droughts. However, drought intensity and observed impacts were different for each region, which is shown by the different case studies, assessing different types of impacts caused by drought in Brazil. Thus, it is fundamental to evaluate the impacts of droughts in a continental country such as Brazil, where a variety of vegetation, soil, land use, and especially different climate regimes predominate.

1. Introduction

The frequency of extreme weather and climate events has increased in recent years, with events showing greater intensity and duration. This favors the occurrence of natural disasters, particularly those associated with flood and severe drought [1,2,3,4,5].
Drought events have increased in frequency and intensity in several regions of the planet in recent decades [1,2,3,4,5,6,7,8,9,10,11]. According to [12], while droughts represented only 4% of total economic losses (US$124 billion) in the period of 1998–2017, research conducted by Centre for Research on the Epidemiology of Disasters (CRED) in 2011 [13] related to 2481 disasters where information was available, when considering the impact of disasters according to their type, found that droughts cause significantly greater losses on national economies than other types of disasters, with almost 40% of droughts studied provoking damage equal to or greater than 0.5% of the gross domestic product (GDP) of the country where they occurred. As highlighted by [12], the level of 0.5% of GDP losses is the International Monetary Fund’s threshold for a major economic disaster. Thus, as a natural disaster, drought is associated with the most serious global economic and social losses [14], affecting more people than any other natural disasters [15].
As highlighted in the World Bank’s “4 degree report”, drought severity is likely to increase in Southern Africa, the United States, Southern Europe, Brazil, and Southeast Asia, among other areas, due to increasing evapotranspiration and decreasing precipitation [16]. Changes in these variables result in greater food, water, and energy insecurity [16,17,18]. In addition, a warmer climate can lead to heat waves and wildfires being more common, increasing the health hazards [19,20,21].
Drought is defined as an extended period (months or years) in which precipitation is less than the average, resulting in water scarcity. Drought is a slow-onset phenomenon, and making an accurate prediction of either its onset or end is a difficult task. Precipitation deficit may take months before the deficiency begins to appear in reduced stream flows and reservoir levels. Precipitation deficits generally appear initially as a deficiency in soil moisture; therefore, agriculture is often the first economic sector to be affected. It is often difficult to know when a drought begins. In the same way, it is also difficult to determine when a drought is over and the impacts, especially regarding hydrological drought, may persist for years, even after rainfall conditions normalize [22,23,24]. Furthermore, the impact of a drought depends largely on society’s vulnerability to drought at that particular moment. Subsequent droughts in the same region will probably have different effects, even if identical in intensity, duration, and spatial characteristics.
Particularly in Brazil, droughts are widespread and recurrent in the northeast region (NE), which has the highest proportion of people living in poverty in the country. Rainfed agriculture in this region accounts for 95% of farmed land [24]. El Niño has also been linked to droughts in some parts of Brazil, as in 1983, 1998, and as early as in 1897–1898 [25,26,27,28]. In 2015–2016, El Niño aggravated the drought situation that started in 2012 in NE, but the onset on this drought was not due to El Niño [29]. Furthermore, other regions in Brazil have also been affected by droughts in recent years, and the impacts have been reported, especially those that are affecting major agricultural producers, as in West Central Brazil [30]. The drought of 2014–2015 in São Paulo was not due to El Niño [31], but was related to water restrictions across the metropolitan region of São Paulo. The Amazon region has been affected by extreme droughts in 1998, 2005, 2010, and 2015–2016, some of them as a consequence of El Niño, with anomalous subsidence in large parts of Amazonia due to the warm Sea Surface Temperature anomalies in the equatorial Pacific as in El Niño years 1998, 2010, and 2015–2016, or due to warm surface waters in the tropical North Atlantic with El Niño absent, as in 2005 [32,33].
According to the IPCC AR5 WG2 [33], the Northeast Brazil and Amazon regions (Figure 1) appear as the most vulnerable regions to droughts [32,34], affecting agriculture and increasing the risk of fires in those regions. Therefore, an accurate monitoring of the temporal and spatial distribution and severity of drought is essential to guide mitigation actions and reduce associated impacts in population and regional economy. Future climate projections show temperature increases and rainfall reductions, suggesting the intensification of droughts events and water deficit, particularly in Central and Eastern Amazonia and Northeast Brazil [32,35,36].
Drought intensity is related to the spatial–temporal distribution of rainfall (i.e., season occurrence, shifts of start of the rainy season, rainfall concentration, etc.). Furthermore, drought severity is dependent not only on the duration, intensity, and geographical extent of a specific drought episode but also on the demands made by human activities and vegetation on a region’s water supplies [20].
Therefore, operational definitions attempt to identify the onset, severity, and termination of drought episodes. Estimations of potential impacts are included in some operational definitions-based indicators. An operational definition, for example, would be one that compares daily precipitation values to evapotranspiration (ET) rates to determine the rate of soil moisture depletion and expresses these relationships in terms of drought effects on plant behavior, while rainfall anomalies are used to identify rainfall deficiency that could evolve to drought. However, considering the low density of weather stations and the territorial expansion of Brazil, the isolated use of these indicators becomes insufficient for operational drought monitoring. Then, it is necessary to develop appropriate methods for large-scale drought assessment.
Different methodologies and drought indices have been developed to monitor and quantify drought intensity and impacts. Most of them are based on climatic and hydrological variables, such as precipitation, soil moisture, evapotranspiration, and vegetation conditions, the most used being the PDSI (Palmer Drought Severity Index) and the SPI (Standardized Precipitation Index) [36,37,38,39,40,41]. Once drought indices are developed from different sources of information and methodologies, the drought analysis may vary depending on the used indices. On the other hand, it must be highlighted that any single index is not enough to precisely depict rainfall deficit or main drought characteristics [6]. In this way, the combination of different indicators that integrate various sources of information may help to better achieve consistent drought monitoring and impacts assessments.
The combination of remote sensing and ground-based precipitation measurements in a drought indicator enables joint assessment of the precipitation component (precipitation deficit as a driver of drought) and the surface response to water deficit (vegetation index and land temperature surface). This work explored the applicability of the new Integrated Drought Index (IDI), a drought index that combines a meteorological-based drought index and remote sensing-based index, for drought assessment over Brazil.
Therefore, the main motivation of this paper is to present an assessment of drought events in Brazil from 2011 to 2019. As seen in the upcoming sections, this period included the biggest droughts in decades, which have affected various regions of Brazil, generating water crises that affected diverse economic sectors and, consequently, the population, as well as increasing the number of fire events due to increased risk of fire under dry–warm surface conditions. The assessment was then performed by means of the IDI, which is an especially important indicator for characterizing water deficit, as well as monitoring the drought impacts on natural vegetation and crops robustness [34].

2. Materials and Methods

2.1. Drought Indices

2.1.1. Remote Sensing Component: Vegetation Health Index—VHI

Remote sensing has proven to be a powerful tool for assessing the temporal and spatial aspects of drought events [43,44]. The combination of satellite visible (VIS) and infrared (IR) images has been widely used to monitor plant changes and water stress [45].
The Vegetation Health Index (VHI) is based on the Normalized Difference Vegetation Index and Land Surface Temperature (NDVI–LST), which has been related to moisture availability and canopy resistance, indicating vegetation stress and/or soil water stress [46,47,48,49,50,51,52].
The VHI has been applied in a range of applications, such as drought detection, assessment of drought severity and duration, and early drought warning [53]. VHI is a combination of vegetation condition (termed VCI) and thermal condition of vegetation (TCI). VCI is obtained by normalizing the Normalized Difference Vegetation Index (NDVI) values by their multiyear absolute minimum and maximum values in the analyzed period. The TCI algorithm is similar to the VCI one, but relates to brightness temperature T estimated from the thermal infrared band of AVHRR (channel 4). The absolute minimum and maximum values are related to weekly VCI–TCI time series from 1981 to 2019 and are normalized for each pixel.
VHI maps are available in the National Environmental Satellite, Data and Information Service—NESDIS (http://www.star.nesdis.noaa.gov) of the National Oceanic and Atmospheric Administration (NOAA).

2.1.2. Standardized Precipitation Index—SPI

The Standardized Precipitation Index (SPI) is a drought index proposed by Mckee [38], to quantify the probability of occurrence of a precipitation deficit at a specific monthly time scale. To calculate the SPI, precipitation data are fitted to a gamma probability distribution function and then the inverse normal distribution function is used to rescale the probability values, resulting in SPI values with a mean of zero and a standard deviation of one. More information about the SPI calculation can be found in several previous studies, including McKee [38,54,55] and Dos Santos [56,57]. As SPI is a normalized index, it allows the comparison of the index between different locations and climates [57], which is important for drought monitoring in a large country such as Brazil.
SPI is calculated from monthly accumulated rainfall provided by the Center for Weather Forecasting and Climate Studies/National Institute for Space Research (CPTEC/INPE). The dataset consists of measurements from approximately 1500 weather stations from different sources, such as the National Institute of Meteorology (INMET) and regional meteorological centers for the period 1981–2019 [58]. The data are interpolated in a regular grid of 25 km of spatial resolution, using the ordinary kriging technique [59].

2.2. Integrated Drought Index (IDI)

The Integrated Drought Index (IDI) consists of combining the SPI with the VHI. SPI is recommended for drought monitoring due to its simplicity and multiscale characteristic in quantifying abnormal wetness and dryness. However, climatic data collected by weather stations often possess poor spatial resolution, which can limit their application in high-resolution drought assessment. On the other hand, VHI is capable of capturing spatial details and is suitable for the monitoring and detection of droughts [26,60]. Furthermore, drought being a natural hazard refers to the adverse impacts on natural spheres and not to the causes for the impacts. Since precipitation is the primary cause for drought development, negative SPI anomalies do not always correspond to drought in reality, as it takes no account of impact. Therefore, VHI presents a general picture and perceptions of drought [61].
In this context, SPI and VHI were selected to jointly represent the precipitation deficit (drought trigger) and the surface response to water deficit. These two indices are therefore complementary information for identifying areas affected by drought.
Like SPI, VHI is based on multiyear historical observations of vegetation health and surface temperature; thus, they are compatible with respect to timescale. In the present study, the weekly VHI-based time series at 4 km resolution for the period 2011–2019 were used.
Since this study focuses on the annual drought assessment, the IDI was calculated based on 12 months (IDI-12) of integrated values of VHI and SPI for the hydrological year (October to September). Firstly, both SPI and VHI were rescaled to the same spatial resolution (25 km); in the second step, both indices were labeled to reflect equivalent drought intensity as explained in Table 1. It is worth mentioning that the SPI classification matches that proposed by the United States Drought Monitor (https://droughtmonitor.unl.edu/About/AbouttheData/DroughtClassification.aspx), while VHI classes are the same as those used by [62]. Finally, categorical maps of SPI and VHI were combined to generate the final drought category. For this, each category was associated with a meaningful value (from 1—exceptional to 6—normal condition) so that the average would also be meaningful.
The final IDI maps present the drought conditions classified into drought categories as in Table 1.

2.3. Soil Moisture Data

A network of soil moisture sensors was established by the National Center for Monitoring and Early Warning of Natural Disasters (Cemaden) in 2015 to monitor soil water over Brazilian semiarid land. Measurements are taken hourly with soil probes in depths ranging from 10 to 40 cm (model EC-5, Decagon Devices, Pullman, WA, USA). Probes were configured to use the factory calibration, resulting in a precision of ± 0.03 m3/m3. In addition, stations are equipped with rain gauges. Typical agrometeorological monitoring was carried out in selected locations with measurements of air temperature, relative humidity, wind speed, soil temperature, and solar radiation. Monitoring of water deficit considers the Soil Moisture Index (SMI), in a normalized form of soil moisture [63] that uses field capacity and wilting point as references for maximum and minimum water content in soils, respectively. The index makes it possible to compare the status of water deficit over different regions and soil classes. The index can be updated daily as new information is retrieved from the stations on the field and is also being used to compute the monthly average [64].

2.4. Reservoir Data

Stream flow, outflow, and reservoir levels were obtained from the Brazilian National Electrical System Operator (ONS) and the Reservoir Monitoring System—SAR, a tool developed and used by the National Water Agency (ANA), which provides information on the operation and levels of the main reservoirs in the country, for Brazil hydropower generation and northeastern water supply. These data help to monitor drought impacts in Northeast Brazil.

2.5. Fire Data

Fire information was obtained from NASA’s website, which is available at https://earthdata.nasa.gov/firms. The data are distributed in near real time (NRT), within 3 h of satellite overpass, from NASA’s Moderate Resolution Imaging Spectroradiometer (MODIS) and NASA’s Visible Infrared Imaging Radiometer Suite (VIIRS) [65].

3. Results and Discussion

3.1. Drought Assessment

Firstly, we identified the main drought events in the last 6 decades over the Brazilian regions using the SPI-12. In this assessment, severity was defined as the absolute value of the integral area between the SPI line and the horizontal axis (SPI = 0) from the start to the end month of the drought and intensity as the lowest SPI value of the drought event. In addition, it was assumed that the drought starts in the month in which the SPI falls below −1, and it ends when SPI returns to positive values for at least two consecutive months in this analysis [66,67].
Figure 2 illustrates the variability of the SPI-12 by Brazilian Region from 1962 to 2019. Drought events have been recorded since 1962 in the different regions of Brazil; however, only between 2012 and 2014 did drought events occur concurrently in the five regions of Brazil. Furthermore, the SPI stratified by region showed that droughts events from 2011 were the most severe and intense of the last almost 60 years, except in the South region. From 2011 to 2019, the most severe drought event (−102.9) occurred in the northeast region (Figure 2c) and the most intense (−2.3, recorded in January 2015) in the southeast region (Figure 2d). In terms of severity, the central west (−91, from 2012 to 2018) and the southeast (−86) were in second and third position, respectively. On the other hand, in terms of intensity, the northeast (−2.2, recorded in February and March 2013) and the north region (−2.0, recorded in December 2015) were in second and third position, respectively.
The exposure and affected areas by drought can be assessed by the Integrated Drought Index (IDI), which combines the lack of precipitation and the surface response to water stress. Figure 3 shows IDI calculated to hydrological years from 2011 to 2019 over Brazil. The hydrologic cycle, for most parts of Brazil, is from 1 October to 30 September.
Especially from 2011 to 2017, droughts affected most parts of Brazil. The 2011/2012 hydrological year exhibited the most severe drought condition, and most of the NE was classified as extreme drought and, in some parts of the central semiarid region, as exceptional drought. As shown in previous studies, the recurrent drought events recorded from ending 2011 to 2017 at NE were considered more intense in terms of duration, severity, and recurrence for at least the last 30 years [68,69,70]. This severe drought was associated with an unusual combination of factors. First, an abnormal upward motion, apparently induced by the active La Niña during November–December 2011, counter-induced a severe subsidence over Northeastern Brazil [69]. This mechanism was so intense that it was related to the unprecedented flood of the Amazon River in 2012 [71]. Later, during March–May 2012, cold surface waters in the South Atlantic configured the so-called negative Atlantic Dipole, which is known to be associated with dry conditions over Northern Northeast Brazil [72]. In 2015/2016, a strong El Niño event increased and prolonged the effect of the drought over NE [36,69]. The 2015/2016 El Niño was one of the strongest on record, comparable to the 1982/1983 and 1997/1998 [73]. Although the large majority of severe drought events in the NEB is associated with the occurrence of El Niño, this is not always the case [70,74], as in the beginning of the multiyear drought in the NE.
A peculiar characteristic of this multi-year event is that drought conditions were also observed beyond the limits of the semiarid region, which indicates that even the western extremity of the region, where the climate is equatorial and the precipitation ranges from 1000 to 1200 mm per year was also affected.
In the Amazon region, although most severe drought conditions were not observed in most of the evaluated period, as occurred in the NE, intense and widespread drought conditions were observed mainly for the hydrological year of 2014/2015 and 2015/2016 (Figure 3). The 2015/2016 drought was a consequence of the extreme hot and dry conditions caused by the El Niño event. El Niño events are also associated with droughts’ occurrence in the Amazon due to a suppression of the convection and, thus, rainfall in Northern, Eastern and Western Amazonia [33]. The severity and extensiveness mainly of the 2015/2016 drought in the Amazonian region surpassed the severity of the 2005 and 2010 droughts, both considered 100-year events [32,75,76]. As highlighted by Anderson [76], the ecohydrological consequences were also more severe and extensive, once substantial decreases in vegetation greenness were observed over Northeastern Amazon. Furthermore, the northwestern region, which normally has no dry season, showed moderate to severe drought conditions during 2015/2016.
Figure 3 also shows that in 2011/2012, most of the south region of Brazil presented drought conditions over an extensive area, with the highest intensity recorded in August 2012 (−1.80). As estimated by Getirana [77], most of the southern region experienced a substantial depletion of surface and groundwater in 2012. The water deficit in this region ranged from −10 to −5 cm (estimated from by Gravity Recovery and Climate Experiment—GRACE). This intense drought affected the water supply in the rural properties and the agricultural and livestock production. Because of this, according to the Integrated Disaster Information System [78], the Federal Government recognized the emergency situation in 70% of municipalities (378 in total) in the Rio Grande do Sul State. Such recognition allows the municipalities to request the support of the Federal Government for emergency measures to face the water scarcity period [68].
The data previously presented in Figure 3 were used to calculate the distribution by drought class, and the sum of heights of all classes per year represent the total pixels of IDI map in each region (Figure 4). By evaluating the frequency of drought occurrence over Brazilian territory, the 2014/2015 hydrologic year stands out due to the higher occurrence of severe and moderate droughts, decreasing in the following years (Figure 4a). Despite that, Southern Brazil was the only region not affected in this period, with severe and moderate drought mainly registered in 2011/2012 (Figure 4e).
In 2011/2012, drought in the NE was recorded at almost 60% of the IDI between extreme (25%) and severe (32%), with few areas of abnormal or normal conditions (Figure 4d). The drought condition remained intense in 2012/2013 (22.3% of the northeast in severe drought) and persisted over the following years, but less intensely so (Figure 4d).
In the central west region (Figure 4b), the frequency of severe and moderate droughts has increased gradually since 2011/2012, with oscillation between 2014/2015 and 2017/2018, reaching its peak in 2014/2015 (37.4% of severe drought and 26% of moderate drought). According to the Survey of Grain Harvest from the National Supply Company [79], bean productivity decreased in the central west region in 2015/2016 and 2017/2018, but mainly in the states of Mato Grosso and Mato Grosso do Sul. Productivity and production of beans fell by approximately 40% and 45%, respectively, compared to previous harvests. Among other reasons, drought conditions corroborated the decrease in productivity and production in this period. The production of other crops such as corn and sorghum was also impacted by drought in the region in these years.
In the southeast region, the driest period occurred from 2013/2014 to 2014/2015, when the frequency of droughts was from extreme to moderate. In 2013/2014, a peak of 42.6% was recorded of severe drought and 23.4 of moderate drought. After 2017/2018, there were predominantly abnormal and normal conditions (Figure 4f). These events in the southeast are challenging to human activities, leading to serious water crisis [80]. The Cantareira Water Supply System, for example, which is located in this region, and is the most important water supply system of the metropolitan region of São Paulo, faced its worst water scarcity in this period [54,60]. During this event, the reservoir dead volume was used from 12 July 2014 to 30 December 2015 (537 days) affecting more than 8.8 million people [81].
Although the north region is known for its highest rainfall levels among Brazilian regions, it recorded a high frequency of severe droughts in 2014/2015 (43.5% of the region) and 2015/2016 (Figure 4c).
To validate the applicability of the IDI method for monitoring droughts, three case studies were conducted with respect to the impacts on the water storage in a reservoir (1), in the soil moisture (2), and in the forest fires (3).

3.2. Case Study 1: Hydrological Drought Impact Assessment in the São Francisco River Basin

Considering the drought conditions of the northeast and southeast, the impact of drought on the water availability of the São Francisco river during the period 2011–2019 was evaluated, due to the relevance of the multipurpose of waters: hydropower generation, irrigated agriculture, water supply, and navigation. The São Francisco river basin has its headwater in the state of Minas Gerais, Southeastern Brazil, flowing through the states of Bahia and Pernambuco, Northeastern Brazil, until reaching the river mouth between the Alagoas and Sergipe states, draining approximately 639,000 km2. In the upper stream, in the state of Minas Gerais, is located the Três Marias reservoir, with a drainage basin of approximately 51,000 km2 and a storage capacity of 15,278 hm3. The Sobradinho Reservoir is located in the middle of the São Francisco river basin, on the border between the states of Pernambuco and Bahia. It is the largest reservoir in this basin, with a storage capacity of 28,669 hm3 and a drainage area of approximately 500,000 km2, a significant part of the São Francisco watershed located in Northeastern and Northern Minas Gerais, regions subject to prolonged droughts [16]. The Três Marias and Sobradinho reservoirs are used for the regularization of the region water reserves.
The regional climate presents a variability associated with the transition from wetter conditions, in the upper stream, to a semiarid condition, downstream of the basin. There are distinct rainfall regimes in these two regions. In the headwaters and southern portions of the middle of São Francisco, the rainfall regime is modulated by the South American Monsoon System, which determines a rainy season from November to March, with the peak between December and February [33]. In addition to local convection, it is the most important system favoring rainfall in the South Atlantic convergence zone (ZCAS) [82]. It is episodic, but whenever it occurs, it conveys large amounts of moisture from Amazonia to this region. In the middle and lower parts of the São Francisco basin, rainfall occurs mainly due to large areas of instability causing local and regional convection. These unstable areas may be enhanced by frontal systems reaching northern latitudes or by episodes of the Madden–Julian oscillation (MJO) [83]. In the lower São Francisco basin, the intertropical convergence zone (ITCZ) may also favor rain episodes from March to May, determining the rainy season in the northern semiarid region [84].
As shown in Figure 3, the São Francisco river basin has faced moderate to extreme drought from 2011/2012 to 2016/2017 and has been abnormally dry in recent years. The middle of the São Francisco basin faced extreme drought from 2011 to 2013 and in 2016/2017, while the upper part experienced severe drought from 2013 to 2015 [36]. This led to inflows to the reservoirs at levels below the long mean term (LMT) and even below the minimum values already recorded in the historical series, with severe consequences for water conflicts throughout the basin. For the critical period, 2011 to 2019, Três Marias inflow was 64% of the historical values (355 m3 s−1 for the period 2011–2019 and 555 m3 s−1 for the period 1993–2011), and the reservoir reached a minimum of 2.6% in November 2014. For the Sobradinho reservoir, the inflow was 44% less than the historical period (1138 m3 s−1 for the period 2011–2019 and 2044 m3 s−1 for the period 1991–2011) and reached its lowest levels in December 2015 (1.0%) and November 2017 (2.0%) since the beginning of its operation (Figure 5).

3.3. Case Study 2: Drought Impact Assessment on Smallholder Agriculture Production

Considering the drought event for the northeast, the Soil Moisture Index (SMI) was calculated for the southernmost portion of the Brazilian semiarid region, which covers the Northern Minas Gerais state (Figure 6). The data are relevant to the period of December 2015 to March 2016, the typical rainy season in this region and also the recommended planting period. The average SMI was lower than 0.4 in most of the stations shown in the top figure. This value is associated with water stress, and long exposure to it can lead to damages in plant development and crop failure [85,86]. Rainfall during the transition in 2015/2016 was atypical in the region when compared with the expected climatology. The same irregularity in rainfall distribution was also observed in the other drought years in the region, especially during growing season (not shown). December and February had below-average monthly totals, while January had twice the expected value [64]. As a result, only a few days presented values of SMI higher than the critical threshold, denoted by shades of green in the bottom figure.
In the 2015–2016 harvest, 106 municipalities of Northern Minas Gerais joined the “Garantia- Safra Program” (crop failure insurance), which is one of the policies of the federal government used to mitigate risk by increasing the capacity of producers to deal with the drought situation. As a result of the soil moisture deficit during the growing season, 98 of the municipalities (92% of total) recorded crop losses of at least 50% of production. In consequence, about 30,000 smallholder farmers were assisted by the “Crop-Guarantee Program”, and about R$30 million was spent on insurance payments in the 2015–2016 harvest [87] in Northern Minas Gerais municipalities.
Overall, due to the pluriannual drought over the northeast region, regarding the 2012–2017 harvests, about 6 million smallholder farmers experienced loss of their harvest. Approximately R$5.5 billion (or about US$1.6 billion) was spent on GS insurance payment [88].
Real-time monitoring of soil water has the potential to support activities such as planting date, harvest date or future planning regarding losses. Although planting date is established by official calendars and agriclimatic zoning, year to year variability causes delays or anticipation of rainfall and, consequently, soil water. Monitoring of rainfall totals and soil moisture can be used to support the decision regarding planting date for the current year. The information on water deficit can also be used to monitor soil conditions before harvesting, to avoid further damage by drought. Finally, the monitoring of water stress during the critical plant development stages can help to predict future losses in yields. The occurrence of water deficit in plant stages such as flowering and fruit formation is known to be associated with yield losses. The knowledge in advance of future losses can support farmers in financial planning months in advance.

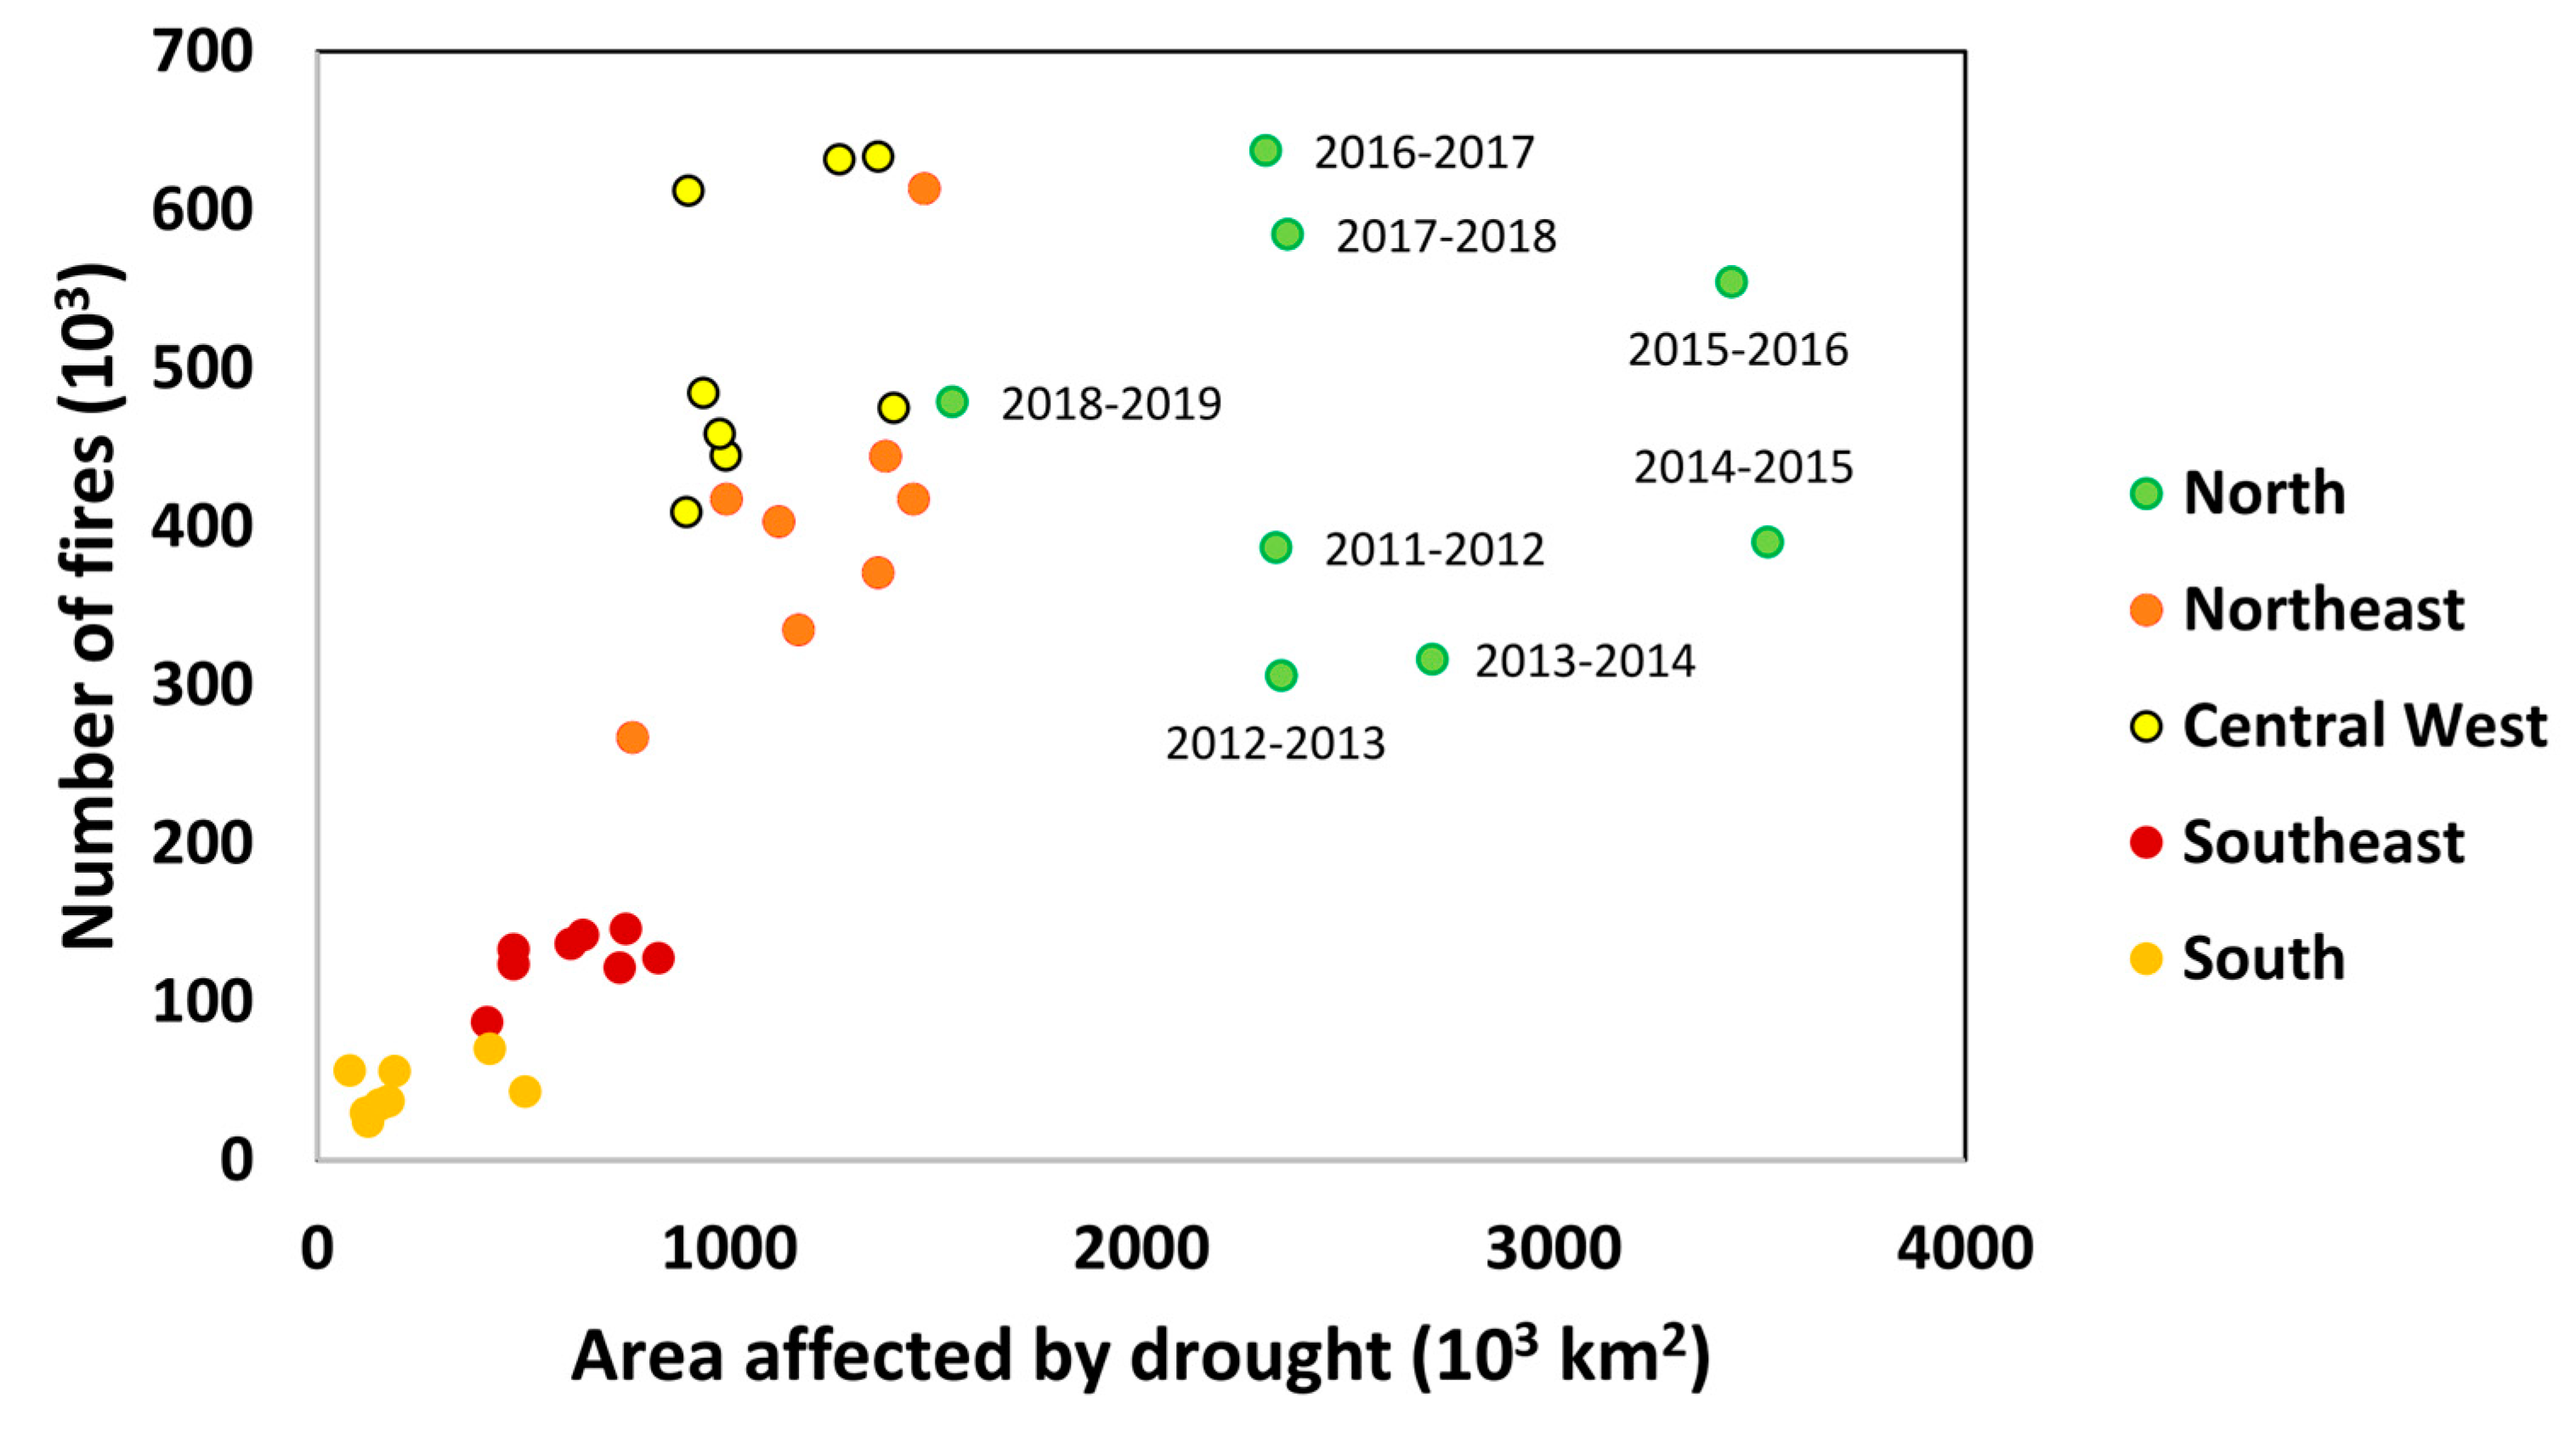
3.4. Case Study 3: Drought Impacts on Forest Fire

Severe drought events, particularly in the Amazon, have been associated with intensification of forest fires: For instance, the one in a century drought of Amazonia in 2005 [32] has been associated with severe fires in Southwestern Amazonia [89].
In the case of the other regions of Brazil, such as the semiarid northeast (dominated by caatinga vegetation), scientific interest is generally focused on the impacts of severe drought in the local population. However, recent studies have shown that fire intensification is linked to soil degradation and desertification not only in the semiarid northeast [90] but also in the Brazilian cerrado [91]. It is clear that fire intensification is becoming a crucial piece of information to understand the resilience of Brazilian ecosystems. In addition, in the case of the Amazon basin, drought intensification plays a fundamental role in terms of carbon emissions [89]. Although drought events lead to an increase in fires, it is well known that the impacts of droughts have also increased in recent years due to the expansion of anthropogenic land-use changes, which are generally associated with the traditional use of fires for land management [90].
Fire practices in tropical regions for agricultural purposes [92] have caused accelerated processes such as forest fragmentation [91] and decreased forest cover. Decreasing vegetation cover and biomass favors canopy opening and solar radiation infiltration by increasing the temperature inside the canopy and making the environment more susceptible to fire due to accumulation of dry organic matter on the ground [93].
For this reason, the modeling of forest fires is complex, because fire behavior is determined by a set of coupled processes that occur at different spatial and temporal scales [94,95]. There are several human-related factors that can influence the number and size of the areas affected by fire, such as distance from roads and urban areas, topography, incentive policies to adequate management practices, and firefighting, in addition to climatic factors [96].
Figure 7 shows the number of fire spots for the same period in Figure 3, allowing a preliminary assessment of the effects of drought in fire occurrence. In general, fires in the Amazon are located close to roads and population centers and along the arc of deforestation, indicating that fires in the region are generally human-caused. In the case of 2011/2012, where the drought affected the northeast of Brazil, there is a clear intensification of fires in Eastern Amazonia and in the cerrado, close to the epicenter of the drought. Although Figure 3 indicates that the drought of Amazonia was more intense during 2014/2015 and 2015/2016, there is no clear intensification of forest fires, despite the fact that the 2015 drought had the largest ratio of active fire counts associated with deforestation, over an area of almost 800 thousand km2 [93].
Figure 8 shows the relationship between fire density and the area affected by drought extracted from Figure 3 (considering the sum of all classes) for the different regions of Brazil. Figure 8 suggests that there is a direct relationship between the area affected by the droughts and fire density in case of the southeast and south regions, which is not evident in the case of the other regions of Brazil, particularly in the north. The incidence of fires in the case of the central west is as high as in the north. Contrary to what was expected, we verified that the drought intensity was not related to the number of fires. This preliminary analysis suggested that in areas dominated by the Amazon forest (such as the north) and cerrado (both the central east and the northeast) and the Caatinga (northeast), the occurrence of fires was related to climate seasonality (such regions show a well-defined dry season), in combination with land management practices, such as clearance by slash and burning.
Results suggest that there has been an increase of forest fire density since 2015. It should be noted that the increase in the number of fires observed during the drought in 2015 [93] remained high in the following years regardless of the area affected by drought in the Amazon. We hypothesize that this increase is associated with higher rates of deforestation. Since the fire period in the Amazon is not over for the 2018/2019 hydrological year, it is not possible to confirm whether this trend persists in the Amazon, although preliminary assessment from real-time monitoring systems (http://sigma.cptec.inpe.br/queimadas/index_old.php) suggests a surge in fires.

4. Conclusions

Drought is a normal feature of climate and is a complex process to characterize and predict. Drought monitoring is challenging because it is not clear when it begins both in spatial and temporal scale. The same deficit in precipitation may not induce similar impacts, depending on the soil vegetation types as well as the water uses, including infrastructures for agricultural and water supply purposes. Because of the territorial expansion of Brazil and its regional heterogeneity, it is necessary to develop accurate methods for large-scale drought assessment. To guide the emergency actions to mitigate the effects of drought, it is crucial to consider an appropriate and user-friendly index that reflects the direct impact of drought on different sectors over Brazil.
The main goal of this study is to present a drought assessment over Brazil from 2011 to 2019 using the Integrated Drought Index (IDI), which combines meteorological drought information and remote sensing data that reflect the surface response to drought. The IDI is a comprehensive drought-monitoring indicator and has been proved to be useful to identify affected areas and to assess the drought impacts.
Previously to the drought assessment by the IDI, we detected the main drought events in different Brazilian regions between 1962 to 2019 using the SPI-12. It was pointed out that throughout the last 8 years (2011–2019), drought events were recorded in all Brazilian territories. The SPI-12 time series showed that from 2011 to 2019, excluding the south region, the other Brazilian regions have been exposed to the most severe and intense drought events almost the last 60 years. In this period, the most severe drought event occurred in the northeast region and the most intense in the southeast region. As highlighted in previous studies, the unprecedented drought of 2014–2015 in the southeast region generated a severe water crisis with a high impact on water supply and hydropower generation. In addition to that, the 2015/2016 drought in the Amazon was considered the most severe and widespread in the last 100 years. Similarly, the multiyear drought of (2011–2017) in the northeast was the most extreme in decades.
The exposure and affected areas by drought from 2011 to 2019 were then assessed by the IDI. Especially from 2011 to 2017, droughts were widespread over Brazil. By evaluating the frequency of drought occurrence over Brazilian territory, the 2014/2015 hydrological year stands out due to the higher occurrence of extreme and severe droughts, which corresponds to an area of approximately 3 million km2 (34% of Brazilian territory) and 60% of this area corresponds to drought in the north region.
In the case studies about drought impact assessment, we showed how different sectors can be affected by droughts in Brazil. Depending on the region, the drought impacts can be more intense in the environmental, economic or social sector. It is very clear, for example, that drought in the northeastern region causes very deep socioeconomics impacts, since it has the highest proportion of people living in poverty. Even though in recent years, many policies have been implemented to mitigate the effects of drought, the prolonged effects of the 2011–2017 multiyear droughts showed that further progress is needed on drought preparedness across the country, which involves clarifying and better understanding the regional vulnerabilities to the drought effects.
Although droughts are not novel in Brazil and are recurrent in some regions, the recent drought events, in special the multiyear drought in the northeast region and the reported drought impacts on southeast region (water crisis), again raised questions related to the current drought policies and the preparation for droughts in Brazil. It is still necessary to advance in the management of drought risk in Brazil, understanding that drought risk is a product of the interaction between exposure to natural hazard (water deficit) and socioeconomic and environmental vulnerabilities associated with the event.
Given that the frequency and severity of droughts may continue to intensify, mitigation and preparedness actions should be subsidized by drought monitoring and impact assessment. In a large country such as Brazil, assessment of drought in terms of impacts is crucial considering the wide variety of vegetation, soil, land use, and especially contrasting climate regimes. Drought risk management is also essential for identifying population vulnerability as recommended by UNISDR (2009). In this context, since 2014, the National Center for Monitoring and Early Warning of Natural Disasters (Cemaden) has been monitoring drought conditions in key regions of Brazil (such as the Brazilian Semiarid), and recently, the monitoring has been performed using the IDI.
Enhancing the understanding of drought concepts should help the population and decision makers to understand this phenomenon and its impacts. An improved understanding and awareness of the concept and characteristics of drought and its differences from other natural hazards is urgently needed. Scientists and policy makers will be better equipped to propose and promote much needed policies and plans to reduce the vulnerability for future generations.

Author Contributions

All authors contributed this paper: Conceptualization, A.P.M.A.C.; methodology, A.P.M.A.C., M.Z., K.D.L. and J.V.C.G.; software, J.V.C.G. ; validation, A.P.M.A.C., M.Z., K.D.L. and L.A.C.; formal analysis, A.P.M.A.C., M.Z., K.D.L., L.A.C., L.C., J.A.M., J.T., R.M.V. and A.A.B.; investigation, A.P.M.A.C., M.Z., K.D.L., L.A.C., L.C., J.A.M., J.T. and C.C.; resources, A.P.M.A.C.; data curation, R.M.V., A.A.B., J.V.C.G. and G.R.-N.; writing—original draft preparation, A.P.M.A.C., M.Z., K.D.L., L.A.C., L.C., J.A.M., J.T., C.C., E.B. and R.A.; writing—review and editing, A.P.M.A.C., M.Z., K.D.L., L.A.C., L.C., J.A.M., J.T., R.M.V., C.C., E.B. and R.A.; visualization, A.P.M.A.C., M.Z., K.D.L., L.A.C., L.C., J.T., R.M.V. and A.A.B.; supervision, A.P.M.A.C.; project administration, A.P.M.A.C.; M.Z. and J.A.M.; funding acquisition, A.P.M.A.C.; M.Z. and J.A.M.

Funding

This research received funding from Financiadora de Inovação e Pesquisa (Finep), contract number 01.16.0068.00. This work also was supported by the National Institute of Science and Technology for Climate Change Phase 2 under CNPq Grant 465501/2014-1, FAPESP Grants 2014/50848-9, the National Coordination for High Level Education and Training (CAPES) Grant 88887.136402/2017-00 and CNPq Grant 406420/2016-5.

Acknowledgments

The authors wish to thank the FINEP, CNPq, CAPES and FAPESP for funding the research that supported this work.

Conflicts of Interest

The authors declare no conflict of interest.

References

  1. EM-DAT: The OFDA/CRED International Disaster Database. Available online: https://www.emdat.be (accessed on 27 August 2019).
  2. UNISDR. Drought Risk Reduction Framework and Practices: Contributing to the Implementation of the Hyogo Framework for Action; United Nations Secretariat of the International Strategy for Disaster Reduction (UNISDR): Geneva, Switzerland, 2012; p. 213. [Google Scholar]
  3. IPCC. Managing the Risks of Extreme Events and Disasters to Advance Climate Change Adaptation. A Special Report of Working Groups I and II of the Intergovernmental Panel on Climate Change (IPCC); Field, C.B., Barros, V., Stocker, T.F., Qin, D., Dokken, D.J., Ebi, K.L., Mastrandrea, M.D., Mach, K.J., Plattner, G.K., Allen, S.K., et al., Eds.; Cambridge University Press: Cambridge, UK; New York, NY, USA, 2012; p. 582. [Google Scholar]
  4. Hartmann, D.L.; Klein Tank, A.M.G.; Rusticucci, M.; Alexander, L.V.; Brönnimann, S.; Charabi, Y.; Dentener, F.J.; Dlugokencky, E.J.; Easterling, D.R.; Kaplan, A.; et al. Observations: Atmosphere and Surface. In Climate Change 2013 the Physical Science Basis: Working Group I Contribution to the Fifth Assessment Report of the Intergovernmental Panel on Climate Change; Cambridge University Press: Cambridge, UK, 2013; pp. 159–254. [Google Scholar]
  5. Ning, L.; Riddle, E.E.; Bradley, R.S. Projected changes in climate extremes over the northeastern United States. J. Clim. 2015, 28, 3289–3310. [Google Scholar] [CrossRef]
  6. Dai, A.; Trenberth, K.E.; Qian, T. A global dataset of Palmer drought severity index for 1870–2002: Relationship with soil moisture and effects of surface warming. J. Hydrometeorol. 2004, 5, 1117–1130. [Google Scholar] [CrossRef]
  7. IPCC. Climate Change 2014: Impacts, Adaptation, and Vulnerability. Part B: Regional Aspects; Cambridge University Press: New York, USA, 2014. [Google Scholar]
  8. Zhou, L.; Zhang, J.; Wu, J.; Zhao, L.; Liu, M.; Lü, A.; Wu, Z. Comparison of remote sensed and meteorological data derived drought indices in Mid-Eastern China. Int. J. Remote Sens. 2012, 33, 1755–1779. [Google Scholar] [CrossRef]
  9. IPCC. 2018: Global warming of 1.5°C. In An IPCC Special Report on the Impacts of Global Warming of 1.5°C above Pre-Industrial Levels and Related Global Greenhouse Gas Emission Pathways, in the Context of Strengthening the Global Response to the Threat of Climate Change, Sustainable Development, and Efforts to Eradicate Poverty; Masson-Delmotte, P., Zhai, H.O., Pörtner, D., Roberts, J., Skea, P.R., Shukla, A., Pirani, W., Moufouma-Okia, C., Péan, R., Pidcock, S., et al., Eds.; World Meteorological Organization: Geneva, Switzerland, 2018. [Google Scholar]
  10. Herweijer, C.; Seager, R. The global footprint of persistent extra-tropical drought in the instrumental era. Int. J. Clim. 2008, 28, 1761–1774. [Google Scholar] [CrossRef]
  11. Ning, L.; Liu, J.; Wang, B.; Chen, K.; Yan, M.; Jin, C.; Wang, Q. Variability and mechanisms of megadroughts over eastern China during the last millennium: A model study. Atmosphere 2019, 10, 7. [Google Scholar] [CrossRef]
  12. Economic Losses, Poverty & Disasters 1998–2017. CRED-UNISDR: 2018. Available online: http:// https://www.unisdr.org/we/inform/publications/61119 (accessed on 15 May 2019).
  13. Guha-Sapir, D.; D’Aoust, O.; Vos, F.; Hoyois, P. The Frequency and Impact of Natural Disasters, in: The Economic Impact of Natural Disasters; Guha-Sapir, D., Santos, I., Eds.; Oxford University Press: Oxford, UK, 2013; pp. 1–27. [Google Scholar]
  14. Carolwicz, M. Natural hazards need not lead to natural disasters. Eos Trans. Am. Geophys. Union 1996, 77, 149–153. [Google Scholar] [CrossRef]
  15. Keyantash, J.; Dracup, J.A. The Quantification of Drought: An Evaluation of Drought Indices. Bull. Am. Meteorol. Soc. 2002, 83, 1167–1180. [Google Scholar] [CrossRef]
  16. Tortajada, C. São Francisco Water Transfer. Human Development Report, Human Development Report Office, Ocassional Paper, UNDP, 2006. Available online: http://hdr.undp.org/sites/default/files/tortajada_cecilia.pdf (accessed on 15 August 2019).
  17. Schellnhuber, H.; Hare, B.; Serdeczny, O.; Adams, S.; Coumou, D.; Frieler, K.; Rocha, M.; Martin, M.; Otto, I.; Perrette, M.; et al. Turn Down the Heat: Why a 4°C Warmer World Must be Avoided; World Bank: Washington, DC, USA, 2012; pp. 1–85. [Google Scholar]
  18. Ringler, T.D.; Ju, L.; Gunzburger, M. A multiresolution method for climate system modeling: Application of spherical centroidal Voronoi tessellations. Ocean Dyn. 2008, 58, 475–498. [Google Scholar] [CrossRef]
  19. Trenberth, K.E. Changes in precipitation with climate change. Clim. Res. 2011, 47, 123–138. [Google Scholar] [CrossRef] [Green Version]
  20. Dai, A. Drought under global warming: A review. WIRES Clim. Change 2011, 2, 45–65. [Google Scholar] [CrossRef]
  21. Rossiello, M.R.; Szema, A. Health Effects of Climate Change-induced Wildfires and Heatwaves. Cureus 2019, 11, 4771. [Google Scholar] [CrossRef] [PubMed]
  22. Wilhite, D.A. Drought as a natural hazard: Concepts and definitions. In Drought: A global Assessment; Routledge: London, UK, 2000; pp. 3–18. [Google Scholar]
  23. Van Loon, A.F. Hydrological drought explained. WIREs Water 2015, 2, 359–392. [Google Scholar] [CrossRef]
  24. IBGE-Instituto Brasileiro de Geografia e Estatística, Censo Agropecuário 2006. Available online: http://www.ibge.gov.br (accessed on 1 July 2018).
  25. Uvo, B. Influence of Sea Surface Temperature on Rainfall and Runnoff in Northeastern South America: Analysis and Modeling. Ph.D. Thesis, Department of Water Resources Engineering, Lund Institute of Technology, Lund, Sweden, 1998. [Google Scholar]
  26. Kane, R.P. Some characteristics and precipitation effects of the El Nino of 1997–1998. J. Atmos. Sol. Terr. Phys. 1999, 61, 1325–1346. [Google Scholar] [CrossRef]
  27. Hastenrath, S. Circulation and teleconnection mechanisms of Northeast Brazil droughts. Prog. Oceanogr. 2006, 70, 407–415. [Google Scholar] [CrossRef]
  28. Shimizu, M.H.; Ambrizzi, T.; Liebmann, B. Extreme precipitation events and their relationship with ENSO and MJO phases over northern South America. Int. J. Climatol. 2017, 37, 2977–2989. [Google Scholar] [CrossRef]
  29. Marengo, J.A.; Alves, L.M.; Alvalá, R.C.; Cunha, A.P.; Brito, S.; Moraes, O.L. Climatic characteristics of the 2010–2016 drought in the semiarid Northeast Brazil region. An. Acad. Bras. Cienc. 2017, 90, 1973–1985. [Google Scholar] [CrossRef]
  30. Cunha, A.P.M.A.; Brito, S.S.B.; Ribeiro-Neto, G.G.; Alvalá, R.C.S. As secas de 1963 e 2017 no Distrito Federal, Brasil. Anuário Inst. Geociências 2018, 41, 487–498. [Google Scholar] [CrossRef]
  31. Nobre, C.A.; Marengo, J.A.; Seluchi, M.E.; Cuartas, A.; Alves, L.M. Some Characteristics and Impacts of the Drought and Water Crisis in Southeastern Brazil during 2014 and 2015. J. Water Resour. Prot. 2016, 8, 252–262. [Google Scholar] [CrossRef] [Green Version]
  32. Marengo, J.A.; Souza, C.M.; Thonicke, K.; Burton, C.; Halladay, K.; Betts, R.A.; Alves, L.M.; Soares, W.R. Changes in Climate and Land Use Over the Amazon Region: Current and Future Variability and Trends. Front. Earth Sci. 2018, 6, 1. [Google Scholar] [CrossRef]
  33. Jiménez-Muñoz, J.C.; Mattar, C.; Barichivich, J.; Santamería-Artigas, A.; Takahashi, K.; Malhi, Y.; Sobrino, J.; Schrier, G. Record-breaking warming and extreme drought in the Amazon rainforest during the course of El Niño 2015–2016. Sci. Rep. 2016, 6, 33130. [Google Scholar] [CrossRef]
  34. PBMC Base científica das mudanças climáticas. Contribuição do Grupo de Trabalho 1 do Painel Brasileiro de Mudanças Climáticas ao Primeiro Relatório da Avaliação Nacional sobre Mundanças Climáticas; Ambrizzi, T., Araujo, M., Eds.; COPPE; Universidade Federal do Rio de Janeiro: Rio de Janeiro, Brazil, 2013; p. 464. [Google Scholar]
  35. Magrin, G.O.; Marengo, J.A.; Boulanger, J.-P.; Buckeridge, M.S.; Castellanos, E.; Poveda, G.; Scarano, F.R.; Vicuna, S. Central and South America. In Climate Change 2014: Impacts, Adaptation, and Vulnerability. Part B: Regional Aspects. Contribution of Working Group II to the Fifth Assessment Report of the Intergovernmental Panel on Climate Change; Cambridge University Press: Cambridge, UK, 2014. [Google Scholar]
  36. Marengo, J.A.; Torres, R.R.; Alves, L.M. Drought in Northeast Brazil—past, present, and future. Theor. Appl. Climatol. 2017, 129, 1189–1200. [Google Scholar] [CrossRef]
  37. Palmer, W.C. Meteorological Drought. In Weather Bureau. Research Paper No. 45, U.S.; Department of Commerce Weather Bureau: Washington, DC, USA, 1965; p. 58. [Google Scholar]
  38. McKee, T.B.; Doesken, N.J.; Kleist, J. The relationship of drought frequency and duration to time scales. In Proceedings of the Eighth Conference on Applied Climatology, Anaheim, CA, USA, 17–22 January 1993. [Google Scholar]
  39. Kogan, F.N.; Yang, B.; Zhiyuan, P.; Xianfeng, J. Modelling corn production in China using AVHRR-based vegetation health indices. Int. J. Remote Sens. 2005, 26, 2325–2336. [Google Scholar] [CrossRef]
  40. Abbas, S.; Nichol, J.E.; Qamer, F.M.; Xu, J. Characterization of drought development through remote sensing: A case study in Central Yunnan, China. Remote Sens. 2014, 6, 4998–5018. [Google Scholar] [CrossRef]
  41. Hao, Z.; Singh, V.P.; Xia, Y. Seasonal drought prediction: Advances, challenges, and future prospects. Rev. Geophys. 2018, 56, 108–141. [Google Scholar] [CrossRef]
  42. Sudene, 2007. Superintendência do Desenvolvimento do Nordeste. Delimitação do Semiárido. Available online: http://sudene.gov.br/planejamento-regional/delimitacao-do-semiarido (accessed on 14 May 2019).
  43. Johnson, G.E.; Achutuni, V.R.; Thiruvengadachari, S.; Kogan, F.N. The role of NOAA satellite data in drought early warning and monitoring: Selected case studies. In Drought Assessment, Management and Planning: Theory and Case Studies, D.A.; Springer: Boston, MA, USA, 1993; pp. 31–47. [Google Scholar] [CrossRef]
  44. Peters, A.J.; Walter-Shea, L.J.; Viña, A.; Hayes, M.; Svoboda, M.D. Drought monitoring with NDVI-based standardized vegetation index. Photogramm. Eng. Remote. Sens. 2002, 68, 71–75. [Google Scholar]
  45. Tucker, C.J.; Choudhury, B.J. Satellite remote sensing of drought conditions. Remote Sens. Environ. 1987, 23, 243–251. [Google Scholar] [CrossRef]
  46. Nemani, R.R.; Running, S.W. Testing a theoretical climate-soil-leaf area hydrologic equilibrium of forests using satellite data and ecosystem simulation. Agric. For. Meteorol. 1989, 44, 245–260. [Google Scholar] [CrossRef]
  47. Carlson, T.N.; Gillies, R.R.; Perry, E.M. A method to make use of thermal infrared temperature and NDVI measurements to infer surface soil water content and fractional vegetation cover. Remote Sens. 1994, 9, 161–173. [Google Scholar] [CrossRef]
  48. Carlson, T.N.; Gillies, R.R.; Schmugge, T.J. An Interpretation of Methodologies for Indirect Measurement of Soil-Water Content. Agric. For. Meteorol. 1995, 77, 191–205. [Google Scholar] [CrossRef]
  49. Gillies, R.R.; Carlson, T.N.; Cui, J.; Kustas, W.P.; Humes, K.S. A verification of the ‘triangle’ method for obtaining surface soil water content and energy fluxes from remote measurements of the Normalized Difference Vegetation Index (NDVI) and surface radiant temperature. Int. J. Remote Sens. 1997, 18, 3145–3166. [Google Scholar] [CrossRef]
  50. Goetz, S.J. Multi-sensor analysis of NDVI, surface temperature, and biophysical variables at a mixed grassland site. Int. J. Remote Sens. 1997, 18, 71–94. [Google Scholar] [CrossRef]
  51. Karnieli, A.; Agam, N.; Pinker, R.T.; Anderson, M.; Imhoff, M.L.; Gutman, G.G.; Panov, N.; Goldberg, A. Use of NDVI and land surface temperature for drought assessment: Merits and limitations. J. Clim. 2010, 23, 618–633. [Google Scholar] [CrossRef]
  52. Cunha, A.P.M.A.; Alvalá, R.C.; Nobre, C.A.; Carvalho, M.A. Monitoring vegetative drought dynamics in the Brazilian Semiarid Region. Agric. For. Meteorol. 2015, 214, 494–505. [Google Scholar] [CrossRef]
  53. Seiler, R.A.; Kogan, F.; Sullivan, J. AVHRR-Based vegetation and temperature condition indices for drought detection in Argentina. Adv. Space Res. 1998, 21, 481–484. [Google Scholar] [CrossRef]
  54. Guttman, G.B. Comparing the Palmer Drought Index and the Standardized Precipitation Index. J. Am. Water Resour. 1998, 34, 113–121. [Google Scholar] [CrossRef]
  55. Hosseini-Moghari, S.M.; Shahab, A. Monthly and seasonal drought forecasting using statistical neural networks. Environ. Earth Sci. 2015, 74, 397–412. [Google Scholar] [CrossRef]
  56. Santos, S.R.Q.; Braga, C.C.; Sansigolo, C.A.; Santos, A.P.P. Determinação de Regiões Homogêneas do Índice de Precipitação Normalizada (SPI) na Amazônia Oriental. Rev. Bras. Meteorol. 2017, 32, 111–122. [Google Scholar] [CrossRef]
  57. Santos, S.R.Q.; Cunha, A.P.M.A.; Ribeiro Neto, G.G. Avaliação de dados de precipitação para o monitoramento do padrão espaço-temporal da seca no nordeste do Brasil. Rev. Bras. Clim. 2019, 25, 90–100. [Google Scholar]
  58. Rozante, J.R.; Moreira, D.S.; Gonçalves, L.G.G.; Vila, D.A. Combining TRMM and Surface Observations of Precipitation: Technique and Validation Over South America. Weather Forecast. 2010, 25, 885–894. [Google Scholar] [CrossRef]
  59. Matheron, G. Le krigeage universel. In Cahiers du Centre de Morphologie Mathematique; Ecole des Mines de Paris: Paris, France, 1969; Volume 1, p. 83. [Google Scholar]
  60. Wang, H.; Lin, H.; Liu, D. Remotely sensed drought index and its responses to meteorological drought in Southwest China. Remote Sens. Lett. 2014, 5, 413–422. [Google Scholar] [CrossRef]
  61. Bhuiyan, C.; Singh, R.P.; Kogan, F.N. Monitoring drought dynamics in the Aravalli region (India) using different indices based on ground and remote sensing data. Int. J. Appl. Earth Obs. Geoinf. 2006, 8, 289–302. [Google Scholar] [CrossRef]
  62. Kogan, F.N. World droughts in the new millennium from AVHRR-based Vegetation Health Indices. Eos Trans. Am. Geophys. Union 2002, 83, 557–563. [Google Scholar] [CrossRef]
  63. Sridhar, V.; Hubbard, K.G.; You, J.; Hunt, E.D. Development of the Soil Moisture Index to Quantify Agricultural Drought and Its “User Friendliness” in Severity-Area-Duration Assessment. J. Hydrol. 2008, 9, 660–676. [Google Scholar] [CrossRef]
  64. Zeri, M.; Alvalá, R.C.S.; Carneiro, R.; Cunha-Zeri, G.; Costa, J.M.; Spatafora, L.R.; Urbano, D.; Vall-Llossera, M.; Marengo, J. Tools for communicating agricultural drought over the Brazilian Semiarid using the soil moisture index. Water 2018, 10, 1421. [Google Scholar] [CrossRef]
  65. MODIS Collection 6 NRT Hotspot/Active Fire Detections MCD14DL. Available online: https://earthdata.nasa.gov/firms (accessed on 29 August 2019).
  66. Brito, S.S.B.; Cunha, A.P.M.A.; Cunningham, C.C.; Alvalá, R.C.; Marengo, J.A.; Araujo, M. Frequency, duration and severity of drought in the Brazilian Semiarid. Int. J. Climatol. 2018, 38, 517–529. [Google Scholar] [CrossRef]
  67. Spinoni, J.; Naumann, G.; Carrão, H.; Barbosa, P.; Vogt, J. World drought frequency, duration, and severity for 1951–2010. Int. J. Climatol. 2014, 34, 2792–2804. [Google Scholar] [CrossRef]
  68. Alvalá, R.C.; Cunha, A.P.M.A.; Brito, S.B.; Seluchi, M.E.; Marengo, J.A.; Moraes, O.L.L.; Carvalho, M.A. Drought Monitoring in the Brazilian Semiarid Region. Annais Acad. Bras. Cienc. Bras. 2017. [Google Scholar] [CrossRef]
  69. Marengo, J.A.; Alves, L.M.; Soares, W.R.; Rodriguez, D.A. Two contrasting severe seasonal extremes in tropical South America in 2012: Flood in Amazonia and drought in Northeast Brazil. J. Clim. 2013, 26, 9137–9154. [Google Scholar] [CrossRef]
  70. Cunha, A.P.M.; Tomasella, J.; Ribeiro-Neto, G.; Brown, M.; Garcia, S.; Brito, S.B.; Carvalho, M.A. Changes in the spatial–temporal patterns of droughts in the Brazilian Northeast. Atmos. Sci. Lett. 2018, 19, 855. [Google Scholar] [CrossRef]
  71. Espinoza, J.C.; Ronchail, J.; Frappart, F.; Lavado-Casimiro, W.; Santini, W.; Guyot, J.L. The major floods in the Amazonas river and tributaries (Western Amazon basin) during the 1970–2012 period: A focus on the 2012 flood. J. Hydrometeorol. 2013, 14, 1000–1008. [Google Scholar] [CrossRef]
  72. Moura, A.D.; Shukla, J. On the dynamics of droughts in northeast Brazil: Observations, theory, and numerical experiments with a general circulation model. J. Atmos. Sci. 1981, 38, 2653–2675. [Google Scholar] [CrossRef]
  73. Carvalho, L.M.V.; Cavalcanti, I.F.A. The South American Monsoon System (SAMS). In The Monsoons and Climate Change: Observations and Modeling, 1st ed.; Carvalho, L.M.V., Jones, C., Eds.; Springer: Menai, Australia, 2016; Volume 1, pp. 121–148. [Google Scholar] [CrossRef]
  74. Kane, R.P. Prediction of droughts in Northeast Brazil: Role of ENSO and use of periodicities. Int. J. Clim. 1997, 17, 655–665. [Google Scholar] [CrossRef]
  75. Erfanian, A.; Wang, G.; Fomenko, L. Unprecedented drought over tropical South America in 2016: Significantly under-predicted by tropical SST. Sci. Rep. 2017, 7, 5811. [Google Scholar] [CrossRef] [PubMed]
  76. Anderson, L.O.; Ribeiro Neto, G.; Cunha, A.P.M.A.; Fonseca, M.G.; Mendes De Moura, Y.; Dalagnol, R.; Wagner, F.H.; Aragão, L.E.O. Vulnerability of Amazonian forests to repeated droughts. Philos. Trans. R. Soc. B: Boil. Sci. 2018, 373, 20170411. [Google Scholar] [CrossRef]
  77. Getirana, A. Extreme Water Deficit in Brazil Detected from Space. J. Hydrometeorol. 2016, 17, 591–599. [Google Scholar] [CrossRef]
  78. S2ID; Brasil, Ministério da Integração Nacional, Secretaria Nacional de Proteção e Defesa Civil. Relatório de Gestão, Exercício 2016. Brasília, 2017. Available online: http://www.mi.gov.br (accessed on 18 June 2018).
  79. CONAB. Companhia Nacional de Abastecimento. Boletim da Safra de Grãos. Available online: https://www.conab.gov.br/info-agro/safras/graos/boletim-da-safra-de-graos?start=10 (accessed on 24 August 2019).
  80. Nys, E.D.; Engle, N.L.; Magalhães, A.R. Drought in Brazil: Proactive Management and Policy; CRC Press: Boca Raton, FL, USA, 2016; p. 230. [Google Scholar] [CrossRef]
  81. Deusdará-Leal, K.R.; Cuartas, L.A.; Zhang, R.; Mohor, G.S.; Carvalho, L.V.C.; Nobre, C.; Mendiondo, E.M.; Broedel, E.; Seluchi, M.; Alvalá, R. Implication of the new operation rules for Cantareira System: Re-reading of the 2014/2015 water crisis. Water Resour. Res. 2019, in press. [Google Scholar]
  82. Carvalho, L.M.V.; Jones, C.; Liebmann, B. The South Atlantic convergence zone: Intensity, form, persistence, and relationships with intraseasonal to interannual activity and extreme rainfall. J. Clim. 2004, 17, 88–108. [Google Scholar] [CrossRef]
  83. Souza, E.B.; Ambrizzi, T. Modulation of the intraseasonal rainfall over tropical Brazil by the Madden-Julian Oscillation. Int. J. Climatol. 2006, 26, 1759–1776. [Google Scholar] [CrossRef]
  84. Melo, A.B.C.; Cavalcanti, I.F.A.; Souza, P.P. Zona De Convergência Intertropical Do Atlântico. In Tempo e Clima no Brasil; Cavalcanti, I.F.A., Ferreira, N.J., Justi Da Silva, M.G.A., Silva Dias, M.A.F., Eds.; Oficina de Textos: São Paulo, Brazil, 2009; pp. 25–41. [Google Scholar]
  85. Hunt, E.D.; Svoboda, M.; Wardlow, B.; Hubbard, K.; Hayes, M.; Arkebauer, T. Monitoring the effects of rapid onset of drought on non-irrigated maize with agronomic data and climate-based drought indices. Agric. For. Meteorol. 2014, 191, 1–11. [Google Scholar] [CrossRef]
  86. Akuraju, V.R.; Ryu, D.; George, B.; Ryu, Y.; Dassanayake, K. Seasonal and inter-annual variability of soil moisture stress function in dryland wheat field, Australia. Agric. For. Meteorol. 2017, 232, 489–499. [Google Scholar] [CrossRef]
  87. SAF/MDA. Secretaria Especial de Agricultura Familiar e do Desenvolvimento Agrário. 2018. Available online: http://www.mda.gov.br (accessed on 19 August 2018).
  88. Cunha, A.P.M.A.; Alvalá, R.C.S.; Cuartas, L.A.; Marengo, J.A.; Saito, S.M.; Munos, V.; Leal, K.R.D.; Ribeiro-Neto, G.; Seluchi, M.E.; Zeri, L.M.M.; et al. Brazilian Experience on the Development of Drought Monitoring and Impact Assessment Systems. Contributing Paper to GAR 2019. Available online: https://www.preventionweb.net/publications/view/66570 (accessed on 27 July 2019).
  89. Aragão, L.E.O.C.; Shimabukuro, Y.E.; Cardoso, M.; Anderson, L.O.; Lima, A.; Poulter, B. Frequência de queimadas durante as secas recentes. Secas na Amazônia: Causas e consequências; Borma, L.D.S., Nobre, C.A., Eds.; Oficina de Textos: São Paulo, Brazil, 2013. [Google Scholar]
  90. Tomasella, J.; Vieira, R.M.S.P.; Barbosa, A.A.; Rodríguez, D.A.; Santana, M.D.O.; Sestini, M.F. Desertification trends in the Northeast of Brazil over the period 2000–2016. Int. J. Appl. Earth Obs. Geoinform. 2018, 73, 197–206. [Google Scholar] [CrossRef]
  91. Junior, C.H.L.S.; Aragao, L.E.O.C.; Fonseca, M.G.; Almeida, C.T.; Vedovato, L.B.; Anderson, L.O.; Junior, C.S. Deforestation-induced fragmentation increases forest fire occurrence in Central Brazilian Amazonia. Forests 2018, 9, 305. [Google Scholar] [CrossRef]
  92. Kpienbaareh, D.L. Assessing the relationship between climate and patterns of wildfires in Ghana. Int. J. Hum. Soc. Sci. Res. 2016, 8, 3. [Google Scholar]
  93. Aragao, L.E.O.C.; Anderson, L.O.; Fonseca, M.G.; Rosan, T.M.; Vedovato, L.B.; Wagner, F.H.; Silva, C.V.J.; Junior, C.H.L.S.; Arai, E.; Aguiar, A.P.; et al. 21st Century drought-related fires counteract the decline of Amazon deforestation carbon emissions. Nat. Commun. 2018, 9, 536. [Google Scholar] [CrossRef]
  94. Hoffman, C.M.; Canfield, J.; Linn, R.R.; Mell, W.; Sieg, C.H.; Pimont, F.; Ziegler, J. Evaluating crown fire rate of spread predictions from physics-based models. Fire Technol. 2016, 52, 221–237. [Google Scholar] [CrossRef]
  95. Linn, R.R.; Cunningham, P. Numerical simulations of grass fires using a coupled atmosphere–fire model: Basic fire behavior and dependence on wind speed. J. Geophys. Res. 2005, 110, D13107. [Google Scholar] [CrossRef]
  96. Flannigan, M.; Harrington, J.B. A study of the relation of meteorological variables to monthly provincial area burned by wildfire in Canada (1953-80). J. Appl. Meteorol. 1988, 247, 441–452. [Google Scholar] [CrossRef]
Figure 1. Geographical location of Brazilian regions, Brazilian legal Amazon, semiarid area (defined by [42]) and São Francisco river basin.
Atmosphere 10 00642 g001
Figure 2. Temporal pattern of the SPI-12, calculated based on the months’ time scale, per Brazilian region from 1962 to 2019. (a) N: North; (b) CO: Central west; (c) NE: Northeast; (d) SE: Southeast, and (e) S: South.
Atmosphere 10 00642 g002
Figure 3. Integrated Drought Index (IDI) calculated to the 2011–2019 hydrological years (from October to September) over Brazil. (a) 2011/12; (b) 2012/13; (c) 2013/14; (d) 2014/15; (e) 2015/16; (f) 2016/17; (g) 2017/18; (h) 2018/19. Blue line indicates the geographic delimitation of the São Francisco river basin.
Atmosphere 10 00642 g003
Figure 4. Annual frequency distribution of IDI for Brazil and its regions: (a) Brazil; (b) Central West; (c) North; (d) Northeast; (e) South and (f) Southeast.
Atmosphere 10 00642 g004
Figure 5. Storage level, inflow, and outflow time series for (a,b) Três Marias (1993–2019) and (c,d) Sobradinho reservoirs (1991–2019). (e) Localization of reservoirs (triangles) and sub-basins (highlights) in the São Francisco river (blue polygon).
Atmosphere 10 00642 g005
Figure 6. (a) Average Soil Moisture Index (SMI) for the period December 2015 to March 31st 2016 for stations over the North Minas Gerais state; (b) time series of average daily SMI (left axis) and rainfall (right axis) for the stations in the top figure. The purple contour encloses the official delimitation of the Brazilian semiarid.
Atmosphere 10 00642 g006
Figure 7. Fire density (number of fires) for the 2011–2019 hydrological years (from October to September) over Brazil.
Atmosphere 10 00642 g007
Figure 8. Relationship between the number of fires and the area affected by droughts for the different regions of Brazil.
Atmosphere 10 00642 g008
Table 1. Drought classification for the Standardized Precipitation Index (SPI) and Vegetation Health Index (VHI).
SPIVHIDrought Classification
>−0.5>40Normal
−0.5 to −0.830 to 40Abnormally Dry
−0.8 to −1.320 to 30Moderate Drought
−1.3 to −1.612 to 20Severe Drought
−1.6 to −2.06 to 12Extreme Drought
<−2.0<6Exceptional Drought

