

QTL Mapping and Candidate Gene Identifying for N, P, and K Use Efficiency at the Maturity Stages in Wheat
Abstract
:1. Introduction
2. Materials and Methods
2.1. Plant Materials
2.2. Experimental Design
2.3. Trait Measurement
2.4. Data Analysis
2.5. QTL Detection and Candidate Gene Identification
3. Results
3.1. Phenotypic Variation and Heritability
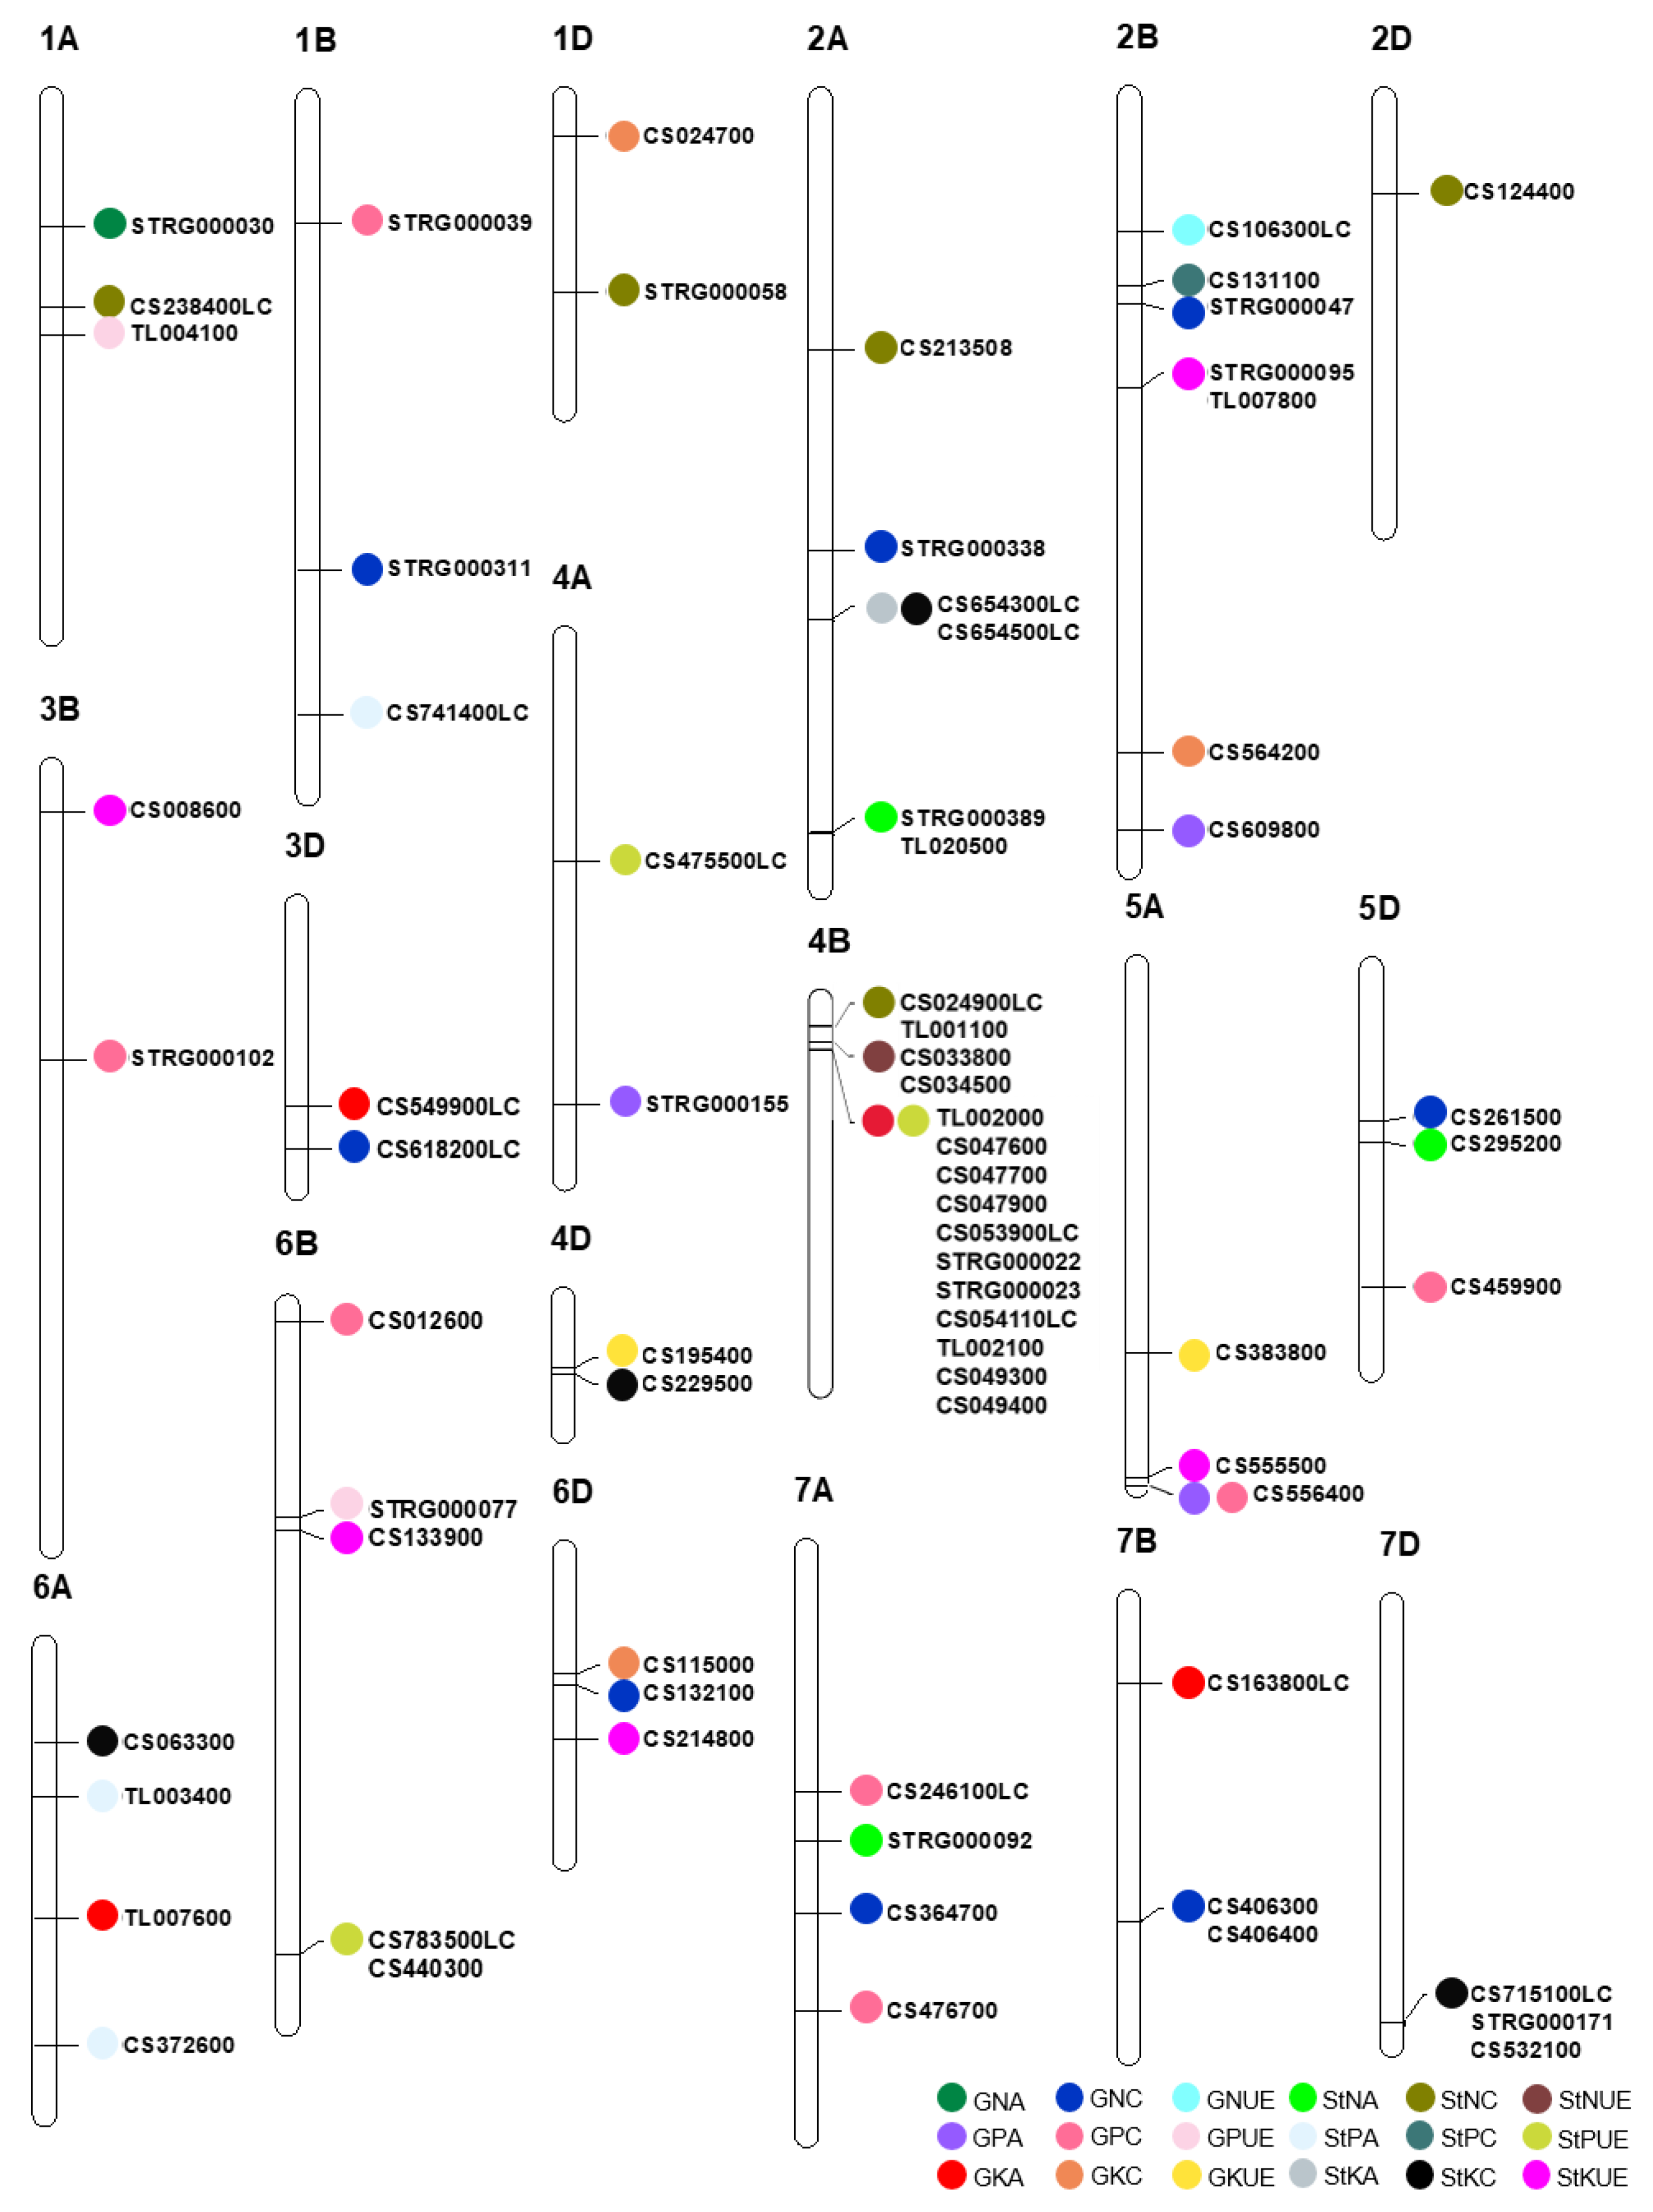
3.2. Major Characteristics of the Stable QTLs
3.3. Candidate Genes for Stable QTLs
4. Discussion
Supplementary Materials
Author Contributions
Funding
Institutional Review Board Statement
Informed Consent Statement
Data Availability Statement
Conflicts of Interest
References
- Rasheed, A.; Ogbonnaya, F.; Lagudah, E.; Appels, R.; He, Z. The goat grass genome’s role in wheat improvement. Nat. Plants 2018, 4, 56–58. [Google Scholar] [CrossRef]
- IWGSC. Shifting the limits in wheat research and breeding using a fully annotated reference genome. Science 2018, 361, eaar7191. [Google Scholar] [CrossRef]
- Wang, Y.; Chen, Y.; Wu, W. Potassium and phosphorus transport and signaling in plants. J. Integr. Plant Biol. 2021, 63, 34–52. [Google Scholar] [CrossRef]
- Griffiths, M.; Atkinson, J.; Gardiner, L.; Swarup, R.; Pound, M.; Wilson, M.; Bennett, M.; Wells, D. Identification of QTL and underlying genes for root system architecture associated with nitrate nutrition in hexaploid wheat. J. Integr. Agric. 2021, 21, 917–932. [Google Scholar] [CrossRef]
- HHasanuzzaman, M.; Bhuyan, M.H.M.B.; Nahar, K.; Hossain, M.S.; Mahmud, J.A.; Hossen, M.S.; Masud, A.A.C.; Moumita; Fujita, M. Potassium: Avital regulator of plant responses and tolerance to abiotic stresses. Agronomy 2018, 8, 31. [Google Scholar] [CrossRef]
- FAO (Food and Agriculture Organization of the United Nations). Online Statistical Database: Fertilizers by Nutrient. FAOSTAT. Available online: https://www.fao.org/faostat/en/#home (accessed on 25 August 2022).
- Huang, J.; Hu, R.; Cao, J.; Rozelle, S. Training programs and in-the-field guidance to reduce China’s over use of fertilizer without hurting profitability. J. Soil Water Conserv. 2008, 63, 165A. [Google Scholar] [CrossRef]
- Kong, F.; Guo, Y.; Liang, X.; Wu, C.; Wang, Y.; Zhao, Y.; Li, S. Potassium (K) effects and QTL mapping for K efficiency traits at seedling and adult stages in wheat. Plant Soil 2013, 373, 877–892. [Google Scholar] [CrossRef]
- Sharma, P.; Parmar, D. The effect of phosphorus and mulching on the efficiency of phosphorus use and productivity of wheat grown on a mountain alfisol in the western himalayas. Soil Use Manag. 2010, 14, 25–29. [Google Scholar] [CrossRef]
- Frels, K.; Guttieri, M.; Joyce, B.; Leavitt, B.; Baenziger, P. Evaluating canopy spectral reflectance vegetation indices to estimate nitrogen use traits in hard winter wheat. Field Crop. Res. 2018, 217, 82–92. [Google Scholar] [CrossRef]
- Ravier, C.; Meynard, J.; Cohan, J. Early nitrogen deficiencies favor high yield, grain protein content and N use efficiency in wheat. Eur. J. Agrono. 2017, 89, 16–24. [Google Scholar] [CrossRef]
- Duncan, E.; O’Sullivan, C.; Roper, M.; Palta, J.; Peoples, M. Yield and nitrogen use efficiency of wheat increased with root length and biomass due to nitrogen, phosphorus, and potassium interactions. J. Plant Nutr. Soil Sci. 2018, 181, 364–373. [Google Scholar] [CrossRef]
- Xu, H.; Dai, X.; Chu, J.; Wang, Y.; Yin, L.; Ma, X.; Dong, S.; He, M. Integrated management strategy for improving the grain yield and nitrogen-use efficiency of winter wheat. J. Integr. Agr. 2018, 17, 315–327. [Google Scholar] [CrossRef]
- Yuan, Y.; Gao, M.; Zhang, M.; Zheng, H.; Zhou, X.; Guo, Y.; Zhao, Y.; Kong, F.; Li, S. QTL mapping for phosphorus efficiency and morphological traits at seedling and maturity stages in wheat. Front. Plant Sci. 2017, 8, 614. [Google Scholar] [CrossRef]
- Arif, M.; Ilyas, M.; Riaz, M.; Ali, K.; Shah, K.; Haq, I.; Fahad, S. Biochar improves phosphorus use efficiency of organic-inorganic fertilizers, maize-wheat productivity and soil quality in a low fertility alkaline soil. Field Crop. Res. 2017, 214, 25–37. [Google Scholar] [CrossRef]
- Rawal, N.; Pande, K.; Shrestha, R.; Vista, S. Nutrient use efficiency (NUE) of wheat (Triticum aestivum L.) as affected by NPK fertilization. PLoS ONE 2022, 17, e0262771. [Google Scholar] [CrossRef] [PubMed]
- Ma, Q.; Rengel, Z.; Siddique, K. Wheat and white lupin differ in root proliferation and phosphorus use efficiency under heterogeneous soil P supply. Crop Pasture Sci. 2011, 62, 467–473. [Google Scholar] [CrossRef]
- Hartmann, T.; Yue, S.; Schulz, R.; He, X.; Chen, X.; Zhang, F.; Müller, T. Yield and N use efficiency of a maize–wheat cropping system as affected by different fertilizer management strategies in a farmer’s field of the North China Plain. Field Crop. Res. 2015, 174, 30–39. [Google Scholar] [CrossRef]
- Meena, A.; Singh, D.; Pandey, P.; Nanda, G. Growth, yield, economics, and nitrogen use efficiency of transplanted rice (Oryza sativa L.) as influenced by different nitrogen management practices through neem (Azadirachta indica) coated urea. Int. J. Chem. Stud. 2018, 6, 1388–1395. [Google Scholar]
- Aula, L.; Omara, P.; Oyebiyi, F.; Eickhoff, E.; Raun, W. Improving winter wheat grain yield and nitrogen use efficiency using nitrogen application time and rate. Agros. Geosci. Envi. 2021, 4, e20148. [Google Scholar] [CrossRef]
- Doerge, R. Mapping and analysis of quantitative trait loci in experimental populations. Nat. Rev. Genet. 2002, 3, 43–52. [Google Scholar] [CrossRef] [PubMed]
- Guarda, A.; Rosell, C.; Benedito, C.; Galotto, M. Different hydrocolloids as bread improvers and antistaling agents. Food Hydrocoll. 2004, 18, 241–247. [Google Scholar] [CrossRef]
- Quarrie, S.; Steed, A.; Calestani, C.; Semikhodskii, A.; Lebreton, C.; Chinoy, C.; Steele, N.; Pljevljakusić, D.; Waterman, E.; Weyen, J.; et al. A high-density genetic map of hexaploid wheat (Triticum aestivum L.) from the cross Chinese Spring × SQ1 and its use to compare QTLs for grain yield across a range of environments. Theor. Appl. Genet. 2005, 110, 865–880. [Google Scholar] [CrossRef]
- Quarrie, S.; Quarrie, S.; Radosevic, R.; Rancic, D.; Kaminska, A.; Barnes, J.; Leverington, M.; Ceoloni, C.; Dodig, D. Dissecting a wheat QTL for yield present in a range of environments: From the QTL to candidate genes. J. Exp. Bot. 2006, 57, 2627–2637. [Google Scholar] [CrossRef]
- Laperche, A.; Devienne-Barret, F.; Maury, O.; Gouis, J.; Ney, B. A simplified conceptual model of carbon/nitrogen functioning for QTL analysis of winter wheat adaptation to nitrogen deficiency. Theor. Appl. Genet. 2006, 113, 1131–1146. [Google Scholar] [CrossRef]
- Laperche, A.; Brancourt-Hulmel, M.; Heumez, E.; Gardet, O.; Hanocq, E.; Devienne-Barret, F.; Gouis, J. Using genotype × nitrogen interaction variables to evaluate the QTL involved in wheat tolerance to nitrogen constraints. Theor. Appl. Genet. 2007, 115, 399–415. [Google Scholar] [CrossRef]
- Fontaine, J.; Ravel, C.; Pageau, K.; Heumez, E.; Dubois, F.; Hirel, B.; Gouis, J. A quantitative genetic study for elucidating the contribution of glutamine synthetase, glutamate dehydrogenase and other nitrogen-related physiological traits to the agronomic performance of common wheat. Theor. Appl. Genet. 2009, 119, 645–662. [Google Scholar] [CrossRef]
- Fan, X.; Cui, F.; Ji, J.; Zhang, W.; Li, J.; Zhang, W.; Zhao, X.; Liu, J.; Meng, D.; Tong, Y.; et al. Dissection of pleiotropic QTL regions controlling wheat spike characteristics under different nitrogen treatments using traditional and conditional QTL mapping. Front. Plant Sci. 2019, 2, 187–200. [Google Scholar] [CrossRef]
- Zhang, M.; Gao, M.; Zheng, H.; Yuan, Y.; Zhou, X.; Guo, Y.; Zhang, G.; Zhao, Y.; Kong, F.; An, Y.; et al. QTL mapping for nitrogen use efficiency and agronomic traits at the seedling and maturity stages in wheat. Mol. Breed. 2019, 39, 71. [Google Scholar] [CrossRef]
- Yang, M.; Wang, C.; Mah, A.; Wu, Y.; Xia, X.; Shi, S.; Xiao, Y.; He, Z. QTL mapping of seedling biomass and root traits under different nitrogen conditions in bread wheat (Triticum aestivum L.). J. Integr. Agr. 2021, 20, 1180–1192. [Google Scholar] [CrossRef]
- Su, J.; Zheng, Q.; Li, H.; Li, B.; Jing, R.; Tong, Y.; Li, Z. Detection of QTLs for phosphorus use efficiency in relation to agronomic performance of wheat grown under phosphorus sufficient and limited conditions. Plant Sci. 2009, 176, 824–836. [Google Scholar] [CrossRef]
- Gong, X.; Liang, X.; Guo, Y.; Wu, C.; Zhao, Y.; Li, X.; Li, S.; Kong, F. Quantitative Trait Locus Mapping for Potassium Use Efficiency Traits at the Seedling Stage in Wheat under Different Nitrogen and Phosphorus Treatments. Crop Sci. 2015, 55, 2690–2700. [Google Scholar] [CrossRef]
- Safdar, L.; Umer, M.; Almas, F.; Uddin, S.; Safdar, Q.; Blighe, K.; Quraishi, U. Identification of genetic factors controlling phosphorus utilization efficiency in wheat by genome-wide association study with principal component analysis. Gene 2021, 768, 145301. [Google Scholar] [CrossRef] [PubMed]
- Zhang, M. Construction of Genetic Map for Unigenes and QTL Mapping for Nitrogen Use Efficiency Related Traits in Wheat. Ph.D. Dissertation, Shandong Agriculture University, Tai’an, China, 2019. (In Chinese with English abstract). [Google Scholar]
- Ooijen, J.V. MapQTL 6.0, Software for the Mapping of Quantitative Trait Loci in Experimental Populations of Dihaploid Species; Kyazma BV: Wageningen, The Netherlands, 2009. [Google Scholar]
- Choulet, F.; Alberti, A.; Theil, S.; Glover, N.; Barbe, V.; Daron, J.; Pingault, L.; Sourdille, P. Structural and functional partitioning of bread wheat chromosome 3B. Science 2014, 345, 1249721. [Google Scholar] [CrossRef] [PubMed]
- Léran, S.; Varala, K.; Boyer, J.; Chiurazzi, M.; Crawford, N.; Daniel-Vedele, F.; David, L.; Dickstein, R.; Fernandez, E.; Forde, B.; et al. A unified nomenclature of NITRATE TRANSPORTER 1/PEPTIDE TRANSPORTER family members in plants. Trends Plant Sci. 2014, 19, 5–9. [Google Scholar] [CrossRef] [PubMed]
- Van Veen, H. Phosphate transport in prokaryotes: Molecules, mediators and mechanisms. Antonie Van Leeuwenhoek 1997, 72, 299–315. [Google Scholar] [CrossRef]
- Chen, Z.; Jenkins, G.; Nimmo, H. Identification of an F-box protein that negatively regulates P(i) starvation responses. Plant Cell Physiol. 2008, 49, 1902–1906. [Google Scholar] [CrossRef]
- Sun, Z.; Zhang, M.; An, Y.; Han, X.; Guo, B.; Lv, G.; Zhao, Y.; Guo, Y.; Li, S. CRISPR/Cas9-mediated disruption of Xylanase inhibitor protein (XIP) gene improved the dough quality of common wheat. Front. Plant. Sci. 2023, 13, 811668. [Google Scholar] [CrossRef]
- Guo, B.; Jin, X.; Chen, J.; Xu, H.; Zhang, M.; Lu, X.; Wu, R.; Zhao, Y.; Guo, Y.; An, Y.; et al. ATP-dependent DNA helicase (TaDHL), a Novel Reduced-Height (Rht) Gene in Wheat. Genes 2022, 13, 979. [Google Scholar] [CrossRef]


| Abbreviation | Name | Unit | Measurement Method |
|---|---|---|---|
| GNC | Grain N concentration | mg·g−1 | Using an NC analyzer (KDY-9820, Tongrunyuan Ltd., Beijing, China) |
| GPC | Grain P concentration | mg·g−1 | Using a sequential plasma spectrometer (ICPS-7500; Shimadzu Corp., Kyoto, Japan) |
| GKC | Grain K concentration | mg·g−1 | Using a sequential plasma spectrometer (ICPS-7500; Shimadzu Corp., Kyoto, Japan) |
| StNC | Straw N concentration | mg·g−1 | Using an NC analyzer (KDY-9820, Tongrunyuan Ltd., Beijing, China) |
| StPC | Straw P concentration | mg·g−1 | Using a sequential plasma spectrometer (ICPS-7500; Shimadzu Corp., Kyoto, Japan) |
| StKC | Straw K concentration | mg·g−1 | Using a sequential plasma spectrometer (ICPS-7500; Shimadzu Corp., Kyoto, Japan) |
| GNA | Grain N accumulation | g·(m2)−1 | GNC × GW |
| GPA | Grain P accumulation | g·(m2)−1 | GPC × GW |
| GKA | Grain K accumulation | g·(m2)−1 | GKC × GW |
| StNA | Straw N accumulation | g·(m2)−1 | StNC × StW |
| StPA | Straw P accumulation | g·(m2)−1 | StPC × StW |
| StKA | Straw K accumulation | g·(m2)−1 | StKC × StW |
| GNUE | Grain N use efficiency | kg2 GW·g−1 GNA | GW2/GNA |
| GPUE | Grain P use efficiency | kg2 GW·g−1 GPA | GW2/GPA |
| GKUE | Grain K use efficiency | kg2 GW·g−1 GKA | GW2/GKA |
| StNUE | Straw N use efficiency | kg2 StW·g−1 StNA | StW2/StNA |
| StPUE | Straw P use efficiency | kg2 StW·g−1 StPA | StW2/StPA |
| StKUE | Straw K use efficiency | kg2 StW·g−1 StKA | StW2/StKA |
| Trait | Chrom | QTL | Gene | Annotation in RefSeq v1.1 |
|---|---|---|---|---|
| GNC | 1B | QGnc-1B-11704 | STRG_1B.000311 | - |
| GNC | 2A | QGnc-2A-11241 | STRG_2A.000338 | - |
| GNC | 2B | QGnc-2B-5134 | STRG_2B.000047 | - |
| GNC | 3D | QGnc-3D-6047 | TraesCS3D02G618200LC | Glutathione S-transferase T3 |
| GNC | 5D | QGnc-5D-3809 | TraesCS5D02G261500 | F-box protein |
| GNC | 6D | QGnc-6D-3306 | TraesCS6D02G132100 | Peptide transporter |
| GNC | 7A | QGnc-7A-9048 | TraesCS7A02G364700 | Histone-lysine N-methyltransferase |
| GNC | 7B | QGnc-7B-7984 | TraesCS7B02G406300 | Protein transport protein Sec61 subunit γ |
| TraesCS7B02G406400 | B3 domain-containing protein | |||
| GPC | 1B | QGpc-1B-3068 | STRG_1B.000039 | - |
| GPC | 3B | QGpc-3B-7236 | STRG_3B.000102 | - |
| GPC | 5D | QGpc-5D-7948 | TraesCS5D02G459900 | Vesicle-associated membrane protein, putative |
| GPC | 6B | QGpc-6B-361 | TraesCS6B02G012600 | F-box family protein |
| GPC | 7A | QGpc-7A-11455 | TraesCS7A02G476700 | Receptor-kinase, putative |
| GPC | 7A | QGpc-7A-6017 | TraesCS7A02G246100LC | Glycine-rich family protein |
| GKC | 1D | QGkc-1D-950 | TraesCS1D02G024700 | Dehydration-induced 19-like protein |
| GKC | 2B | QGkc-2B-16317 | TraesCS2B02G564200 | Heme oxygenase 1 |
| GKC | 6D | QGkc-6D-3045 | TraesCS6D02G115000 | Receptor kinase |
| StNC | 1A | QStnc-1A-5191 | TraesCS1A02G238400LC | E3 ubiquitin-protein ligase ORTHRUS 2 |
| StNC | 1D | QStnc-1D-4837 | STRG_1D.000058 | - |
| StNC | 2A | QStnc-2A-6246 | TraesCS2A02G213508 | Pentatricopeptide repeat-containing protein, putative |
| StNC | 2D | QStnc-2D-2351 | TraesCS2D02G124400 | F-box family protein |
| StNC | 4B | QStnc-4B-629 | TraesCS4B02G024900LC | P-loop containing nucleoside triphosphate hydrolases superfamily protein |
| TraesTL4B02G001100 | - | |||
| StPC | 1B | QStpc-1B-15303 | TraesCS1B02G741400LC | hAT transposon superfamily |
| StPC | 2B | QStpc-2B-4694 | TraesCS2B02G131100 | Aspartic proteinase nepenthesin-1 |
| StKC | 4D | QStkc-4D-1882 | TraesCS4D02G229500 | Transposon Ty3-I Gag-Pol polyprotein |
| StKC | 6A | QStkc-6A-2415 | TraesCS6A02G063300 | Kinase family protein |
| StKC | 7D | QStkc-7D-10397 | TraesCS7D02G715100LC | F-box protein |
| STRG_7D.000171 | - | |||
| TraesCS7D02G532100 | Cytochrome P450 family protein, expressed | |||
| GNA | 1A | QGna-1A-3190 | STRG_1A.000030 | - |
| GPA | 4A | QGpa-4A-11638 | STRG_4A.000155 | - |
| GKA | 3D | QGka-3D-4973 | TraesCS3D02G549900LC | Signal recognition particle protein |
| GKA | 6A | QGka-6A-6838 | TraesTL6A02G007600 | - |
| GKA | 7B | QGka-7B-2040 | TraesCS7B02G163800LC | Spindle assembly checkpoint component |
| StNA | 2A | QStna-2A-18271 | STRG_2A.000389 | - |
| TraesTL2A02G020500 | - | |||
| StNA | 5D | QStna-5D-4323 | TraesCS5D02G295200 | F-box protein |
| StNA | 7A | QStna-7A-7244 | STRG_7A.000092 | - |
| StPA | 6A | QStpa-6A-10015 | TraesCS6A02G372600 | Phosphate regulon sensor protein PhoR |
| StPA | 6A | QStpa-6A-3769 | TraesTL6A02G003400 | - |
| GNUE | 2B | QGnue-2B-3336 | TraesCS2B02G106300LC | Tetratricopeptide repeat (TPR)-like superfamily protein |
| GPUE | 1A | QGpue-1A-5873 | TraesTL1A02G004100 | - |
| GPUE | QGpue-6B-5100 | STRG_6B.000077 | - | |
| GKUE | 4D | QGkue-4D-1722 | TraesCS4D02G195400 | Phosphoinositide phosphatase family protein |
| GKUE | 5A | Gkue-5A-9619 | TraesCS5A02G383800 | Heat shock transcription factor |
| StNUE | 4B | QStnue-4B-1036 | TraesCS4B02G033800 | Lysine--tRNA ligase |
| TraesCS4B02G034500 | Lysine--tRNA ligase | |||
| StPUE | 4A | QStpue-4A-5558 | TraesCS4A02G475500LC | Ypt/Rab-GAP domain of gyp1p superfamily protein |
| StPUE | 6B | QStpue-6B-15642 | TraesCS6B02G783500LC | B3 domain-containing protein |
| TraesCS6B02G440300 | Protein DETOXIFICATION | |||
| StKUE | 2B | QStkue-2B-7220 | STRG_2B.000095 | - |
| TraesTL2B02G007800 | - | |||
| StKUE | 3B | QStkue-3B-1051 | TraesCS3B02G008600 | Receptor-like kinase |
| StKUE | 5A | QStkue-5A-12724 | TraesCS5A02G555500 | Autophagy protein 5 |
| StKUE | 6B | QStkue-6B-5408 | TraesCS6B02G133900 | Calmodulin-binding family protein, putative, expressed |
| StKUE | 6D | QStkue-6D-4669 | TraesCS6D02G214800 | Bifunctional uridylyltransferase/uridylyl-removing enzyme |
| GPA/GPC | 5A | QGpa/Gpc-5A-12924 | TraesCS5A02G556400 | Protein kinase family protein |
| GPA/StPUE | 2B | QGpa/Stpue-2B-18259 | TraesCS2B02G609800 | 3-isopropylmalate dehydrogenase |
| GKA/StPUE | 4B | QGka/Stpue-4B-1222 | TraesTL4B02G002000 | - |
| TraesCS4B02G047600 | Threonine dehydratase | |||
| TraesCS4B02G047700 | Dynamin | |||
| TraesCS4B02G047900 | NADH-ubiquinone oxidoreductase subunit | |||
| TraesCS4B02G053900LC | DNA mismatch repair protein MutS, type 2 | |||
| STRG_4B.000022 | - | |||
| STRG_4B.000023 | - | |||
| TraesCS4B02G054110LC | Zinc finger CCCH domain protein | |||
| TraesTL4B02G002100 | - | |||
| TraesCS4B02G049300 | GPN-loop GTPase-like protein | |||
| TraesCS4B02G049400 | Protein POLLEN DEFECTIVE IN GUIDANCE 1 | |||
| StKA/StKC | 2A | QStka/Stkc-2A-12963 | TraesCS2A02G654300LC | histone deacetylase 2 |
| TraesCS2A02G654500LC | phosphatidyl inositol monophosphate 5 kinase |
Disclaimer/Publisher’s Note: The statements, opinions and data contained in all publications are solely those of the individual author(s) and contributor(s) and not of MDPI and/or the editor(s). MDPI and/or the editor(s) disclaim responsibility for any injury to people or property resulting from any ideas, methods, instructions or products referred to in the content. |
© 2023 by the authors. Licensee MDPI, Basel, Switzerland. This article is an open access article distributed under the terms and conditions of the Creative Commons Attribution (CC BY) license (https://creativecommons.org/licenses/by/4.0/).
Share and Cite
Han, X.; Zhang, M.; Gao, M.; Yuan, Y.; Yuan, Y.; Zhang, G.; An, Y.; Guo, Y.; Kong, F.; Li, S. QTL Mapping and Candidate Gene Identifying for N, P, and K Use Efficiency at the Maturity Stages in Wheat. Genes 2023, 14, 1168. https://doi.org/10.3390/genes14061168
Han X, Zhang M, Gao M, Yuan Y, Yuan Y, Zhang G, An Y, Guo Y, Kong F, Li S. QTL Mapping and Candidate Gene Identifying for N, P, and K Use Efficiency at the Maturity Stages in Wheat. Genes. 2023; 14(6):1168. https://doi.org/10.3390/genes14061168
Chicago/Turabian StyleHan, Xu, Mingxia Zhang, Minggang Gao, Yuanyuan Yuan, Yapei Yuan, Guizhi Zhang, Yanrong An, Ying Guo, Fanmei Kong, and Sishen Li. 2023. "QTL Mapping and Candidate Gene Identifying for N, P, and K Use Efficiency at the Maturity Stages in Wheat" Genes 14, no. 6: 1168. https://doi.org/10.3390/genes14061168