
Gene Losses and Homology of the Chloroplast Genomes of Taxillus and Phacellaria Species
by

Liwei Wu
1,†,
Panhui Fan
1,†,
Jianguo Zhou
1,
Yonghua Li
2,
Zhichao Xu
3,
Yulin Lin
1,
Yu Wang
1,
Jingyuan Song
1 and
Hui Yao
1,* 1
Key Lab of Chinese Medicine Resources Conservation, State Administration of Traditional Chinese Medicine of the People’s Republic of China, Institute of Medicinal Plant Development, Chinese Academy of Medical Sciences & Peking Union Medical College, Beijing 100193, China
2
Faculty of Pharmacy, Guangxi University of Chinese Medicine, Nanning 530004, China
3
College of Life Science, Northeast Forestry University, Harbin 150040, China
*
Author to whom correspondence should be addressed.
†
These authors contributed equally to this work.
Genes 2023, 14(4), 943; https://doi.org/10.3390/genes14040943
Submission received: 28 March 2023
/
Revised: 17 April 2023
/
Accepted: 18 April 2023
/
Published: 19 April 2023
(This article belongs to the Special Issue Advances in Evolution of Plant Organelle Genome)
Abstract
:Research on the chloroplast genome of parasitic plants is limited. In particular, the homology between the chloroplast genomes of parasitic and hyperparasitic plants has not been reported yet. In this study, three chloroplast genomes of Taxillus (Taxillus chinensis, Taxillus delavayi, and Taxillus thibetensis) and one chloroplast genome of Phacellaria (Phacellaria rigidula) were sequenced and analyzed, among which T. chinensis is the host of P. rigidula. The chloroplast genomes of the four species were 119,941–138,492 bp in length. Compared with the chloroplast genome of the autotrophic plant Nicotiana tabacum, all of the ndh genes, three ribosomal protein genes, three tRNA genes and the infA gene were lost in the three Taxillus species. Meanwhile, in P. rigidula, the trnV-UAC gene and the ycf15 gene were lost, and only one ndh gene (ndhB) existed. The results of homology analysis showed that the homology between P. rigidula and its host T. chinensis was low, indicating that P. rigidula grows on its host T. chinensis but they do not share the chloroplast genome. In addition, horizontal gene transfer was not found between P. rigidula and its host T. chinensis. Several candidate highly variable regions in the chloroplast genomes of Taxillus and Phacellaria species were selected for species identification study. Phylogenetic analysis revealed that the species of Taxillus and Scurrula were closely related and supported that Scurrula and Taxillus should be treated as congeneric, while species in Phacellaria had a close relationship with that in Viscum.
1. Introduction
Chloroplasts originated from ancient invasions by eubacteria through symbiosis [1] and are important organelles with autonomic genetic information in plant cells, and they play a crucial role in photosynthesis, amino acid synthesis, and carbon sequestration. With the advancement of sequencing technology, an increasing number of chloroplast genomes have been further resolved [2,3]. In recent years, the chloroplast genomes have been increasingly used as super-barcodes and molecular markers in species identification [4,5,6], and chloroplast sequences have frequently been utilized for constructing plant phylogenies [6,7,8,9]. The typical chloroplast genome of land plants generally consists of two inverted repeats (IR), one large single-copy (LSC), and one small single-copy (SSC) regions, forming a single circular molecule structure [3]. The gene sequence and content of chloroplast genomes are highly conserved [10].
Parasitic plants partially or completely lose the photosynthetic capacity and sustain themselves by acquiring various nutrients and water from their hosts [11]. These characteristics are represented by gene loss [12,13], pseudogenicity [12], and gene transfer [14] at the level of chloroplast genome. Parasitic plants are intermediates of the transition from autotrophic to heterotrophic, whose chloroplast genome analyses help understand the degradation patterns and mechanisms of the chloroplast genomes in angiosperms. Parasitic plants that have retained photosynthesis are called hemiparasite [15]. Taxillus plants are hemiparasitic shrubs that belong to the family Loranthaceae, with 18 species in China and 9 endemic species [16]. Many plants in this genus, such as T. chinensis, Taxillus sutchuenensis, T. delavayi, and T. thibetensis have medicinal value. T. chinensis and T. sutchuenensis are the source of the Chinese medicine “Taxillus herba”, and T. delavayi has been used as an anti-abortifacient herb in Sichuan Province for a long time, and T. thibetensis is used as traditional Chinese herbal medicine for clearing lung heat and inducing diuresis [15,17,18].
Many plants serve as hosts, including some parasitic plants. A plant obligated to parasitize on parasitic plants is termed as hyperparasite [19,20]. Hyperparasitic plants are extremely rare, with few species found in Santalales [21]. In the genus Phacellaria (Santalaceae), all species are obligate parasites, mainly on Loranthaceae and preferred on genus Taxillus [22]. Thirteen chloroplast genomes of Taxillus plants have been analyzed [23,24] but only two chloroplast genomes of Phacellaria have been determined [25]. Limited knowledge about the chloroplast genomes of Phacellaria plants, especially the relationship with their host Taxillus plants, is known.
In this study, three chloroplast genomes of Taxillus (T. chinensis, T. delavayi, and T. thibetensis) and one chloroplast genome of Phacellaria (P. rigidula) were sequenced, among which T. chinensis is the host of P. rigidula. Then, the homology of the chloroplast genomes of T. chinensis and P. rigidula was analyzed. Finally, comparative and phylogenetic analyses were conducted. This research was the first to investigate the homology between the chloroplast genomes of hyperparasitic plant and their host parasitic plant. The findings could provide a basis for phylogenetic and plant resource research on parasitic and hyperparasitic plants.
2. Materials and Methods
2.1. Plant Materials
Fresh leaves of T. delavayi and T. thibetensis were collected from Lijiang City and Dali City in Yunnan Province, respectively, and T. chinensis and P. rigidula were collected from Fangchenggang City in Guangxi Province. All samples were identified by Professor Yulin Lin. Voucher specimens were deposited in the herbarium at Institute of Medicinal Plant Development. The fresh leaves were stored at −80 °C.
2.2. Total DNA Extraction and Sequencing
Total DNA was extracted using the DNease Plant Mini Kit (Qiagen, Hilden, Germany) method. The concentration of total DNA was detected by a micro spectrophotometer (Nanodrop 2000, USA), and its quality was detected by 1% agarose gel electrophoresis. The DNA of four species was used to generate libraries with an average insert size of 500 bp and sequenced using Illumina Hiseq X following the standard protocol. Approximately 5.8 Gb of raw data from T. chinensis, 6.9 Gb of raw data from T. delavayi, 6.6 Gb from T. thibetensis, and 6.9 Gb of raw data from P. rigidula were generated with 150 bp paired-end read lengths.
2.3. Assembly and Annotation of Chloroplast Genomes
Low-quality reads of all samples were trimmed by Trimmomatic version 0.39 software [26]. GetOrganelle version 1.7.7.0 [27] and NOVOPlasty version 4.3.1 [28] were used to assemble the chloroplast genomes, and GapCloser version 1.12 software [29] was used to fill gaps. GeSeq [30] and CPGAVAS2 software [31] were used to annotate the sequences initially and correct them manually. tRNAscan-SE version 2.0.11 software [32] was used to annotate the tRNA. The annotation results were checked by CPGView [33]. The NCBI accession numbers of complete chloroplast genome sequences of the four species were OQ509063 (P. rigidula), OQ509064 (T. chinensis), MH161426 (T. delavayi), and MH161427 (T. thibetensis).
2.4. Structural Analysis
Chloroplast genome maps were drawn using Organellar Genome DRAW [34] and manually edited for accuracy. MEGA version 6.0 [35] was used for GC content calculation. CodonW version 1.4.4 software [36] was adopted to analyze the usage of codon. REPuter software [37] was used to identify the long repetitive sequence of chloroplast genome. The type and number of SSR sites were determined using MISA software [38], and the parameter setting was consistent with that in Wu et al. [39]. In this present study, complete repetitive SSR loci were mainly searched, and cycled or reverse complementary SSRs were considered as the same type.
2.5. Genome Comparison and Phylogenetic Analysis
Homology analysis was performed using Sibelia version 3.0.7 [40] and Circos version 0.69.9 [41]. Horizontal gene transfer (HGT) analysis was conducted on the basis of sequence similarity through BLAST and phylogenetic trees in accordance with Li et al. [42]. mVISTA [43], an online tool, was utilized to compare the chloroplast genome sequences of Phacellaria species. DnaSP version 6.12.03 [44] was used to calculate the nucleotide diversity values (Pi). MAFFT version 5 software [45] was used to compare the sequences. Maximum likelihood (ML) phylogenetic trees were constructed using the program IQTREE version 2.2.2.3 [46].
3. Results and Discussion
3.1. Basic Characteristics of the Complete Chloroplast Genomes of Three Taxillus Species and P. rigidula
The chloroplast genomes of the three Taxillus species and P. rigidula all contained an LSC, an SSC, and a pair of IRs, being classical tetrad structures (Figure 1). The chloroplast genomes were 121,363 (T. chinensis), 119,941 (T. delavayi), 122,286 (T. thibetensis), and 138,492 bp (P. rigidula) in length. The GC contents in the chloroplast genome of T. chinensis, T. delavayi, T. thibetensis, and P. rigidula were 37.3%, 37.1%, 37.2%, and 37.9%, respectively. The GC content was not uniform in the four regions. The IR regions had the highest content (43.0%, 42.4%, 42.7%, and 43.6%), followed by LSC regions (34.7%, 34.7%, 34.5%, and 35.5%) and SSC regions (26.2%, 26.8%, 26.0%, and 29.3%). There were 108 genes annotated in T. chinensis, including 67 protein-coding genes, 33 tRNA genes, and 8 rRNA genes. The number of annotated genes in T. delavayi was the same as T. chinensis, but included 70 protein-coding genes, 30 tRNA genes, and 8 rRNA genes. A total of 112 genes were annotated in T. thibetensis, including 70 protein-encoding genes, 34 tRNA genes, and 8 rRNA genes. Meanwhile, in P. rigidula, there were 115 genes annotated, including 71 protein-coding genes, 36 tRNA genes, and 8 rRNA genes.
Introns have a significant impact on regulating gene expression, and they can improve the expression of exogenous genes at specific locations in plants, leading to the development of desirable agronomic traits [47]. There were 15 and 12 genes containing introns found in the chloroplast genomes of P. rigidula and T. thibetensis and 11 genes containing introns found in the chloroplast genomes of T. chinensis and T. delavayi. The rps12 gene, a special trans-splicing gene, was similar to some other species [42,48,49].
3.2. Gene Losses in the Chloroplast Genomes of Taxillus and Phacellaria Species
The chloroplast genomes of the three Taxillus species and P. rigidula were compared with an autotrophic plant N. tabacum (Z00044), semi-parasitic plant Viscum minimum (KJ512176), and total parasitic plant Epifagus virginiana (M81884) to investigate the effects of the parasitic lifestyle on the structure and genetic composition of chloroplast genomes.
The chloroplast genome length of parasitic plants was generally shorter, among which E. virginiana was the shortest (70,028 bp). The total length of the chloroplast genomes of the three Taxillus species was 33,558–35,903 bp shorter than that of N. tabacum, and that of P. rigidula was 17,352 bp shorter than that of N. tabacum. The length of the IR regions of the seven species was relatively similar but the length of the LSC and SSC regions was quite different relatively. Compared with V. minimum, which was also a semi-parasitic plant, the LSC regions of the chloroplast genomes of the three Taxillus plants were about 5 kb shorter, and the SSC regions were about 3 kb shorter. Meanwhile, the LSC and SSC regions of P. rigidula were similar to that of V. minimum in length (Supplementary Table S1).
Compared with the chloroplast genome of the autotrophic plant N. tabacum, all the ndh genes, three ribosomal protein genes (rps15, rps16 and rpl32), three tRNA genes (trnG-UCC, trnK-UUU, and trnV-UAC), and the infA gene were lost in the chloroplast genomes of T. chinensis, T. delavayi, and T. thibetensis, among which ndh, ribosomal protein, and infA were genes involved in photosynthesis [50]. In addition, two tRNA genes (trnA-UGC and trnI-GAU) were lost in T. delavayi, and trnH-GUG was lost in T. chinensis. The ycf15 gene only appeared in T. chinensis. Similar to the chloroplast genomes of Taxillus species; P. rigidula showed gene losses. Compared with the chloroplast genome of N. tabacum, trnV-UAC, and ycf15 were lost in P. rigidula, and only one ndh gene (ndhB) existed in P. rigidula. Other studies have also found gene losses in the chloroplast genomes of Taxillus and Phacellaria species [23,25] (Supplementary Table S2).
3.3. Homology Analysis of Chloroplast Genomes of P. rigidula and T. chinensis
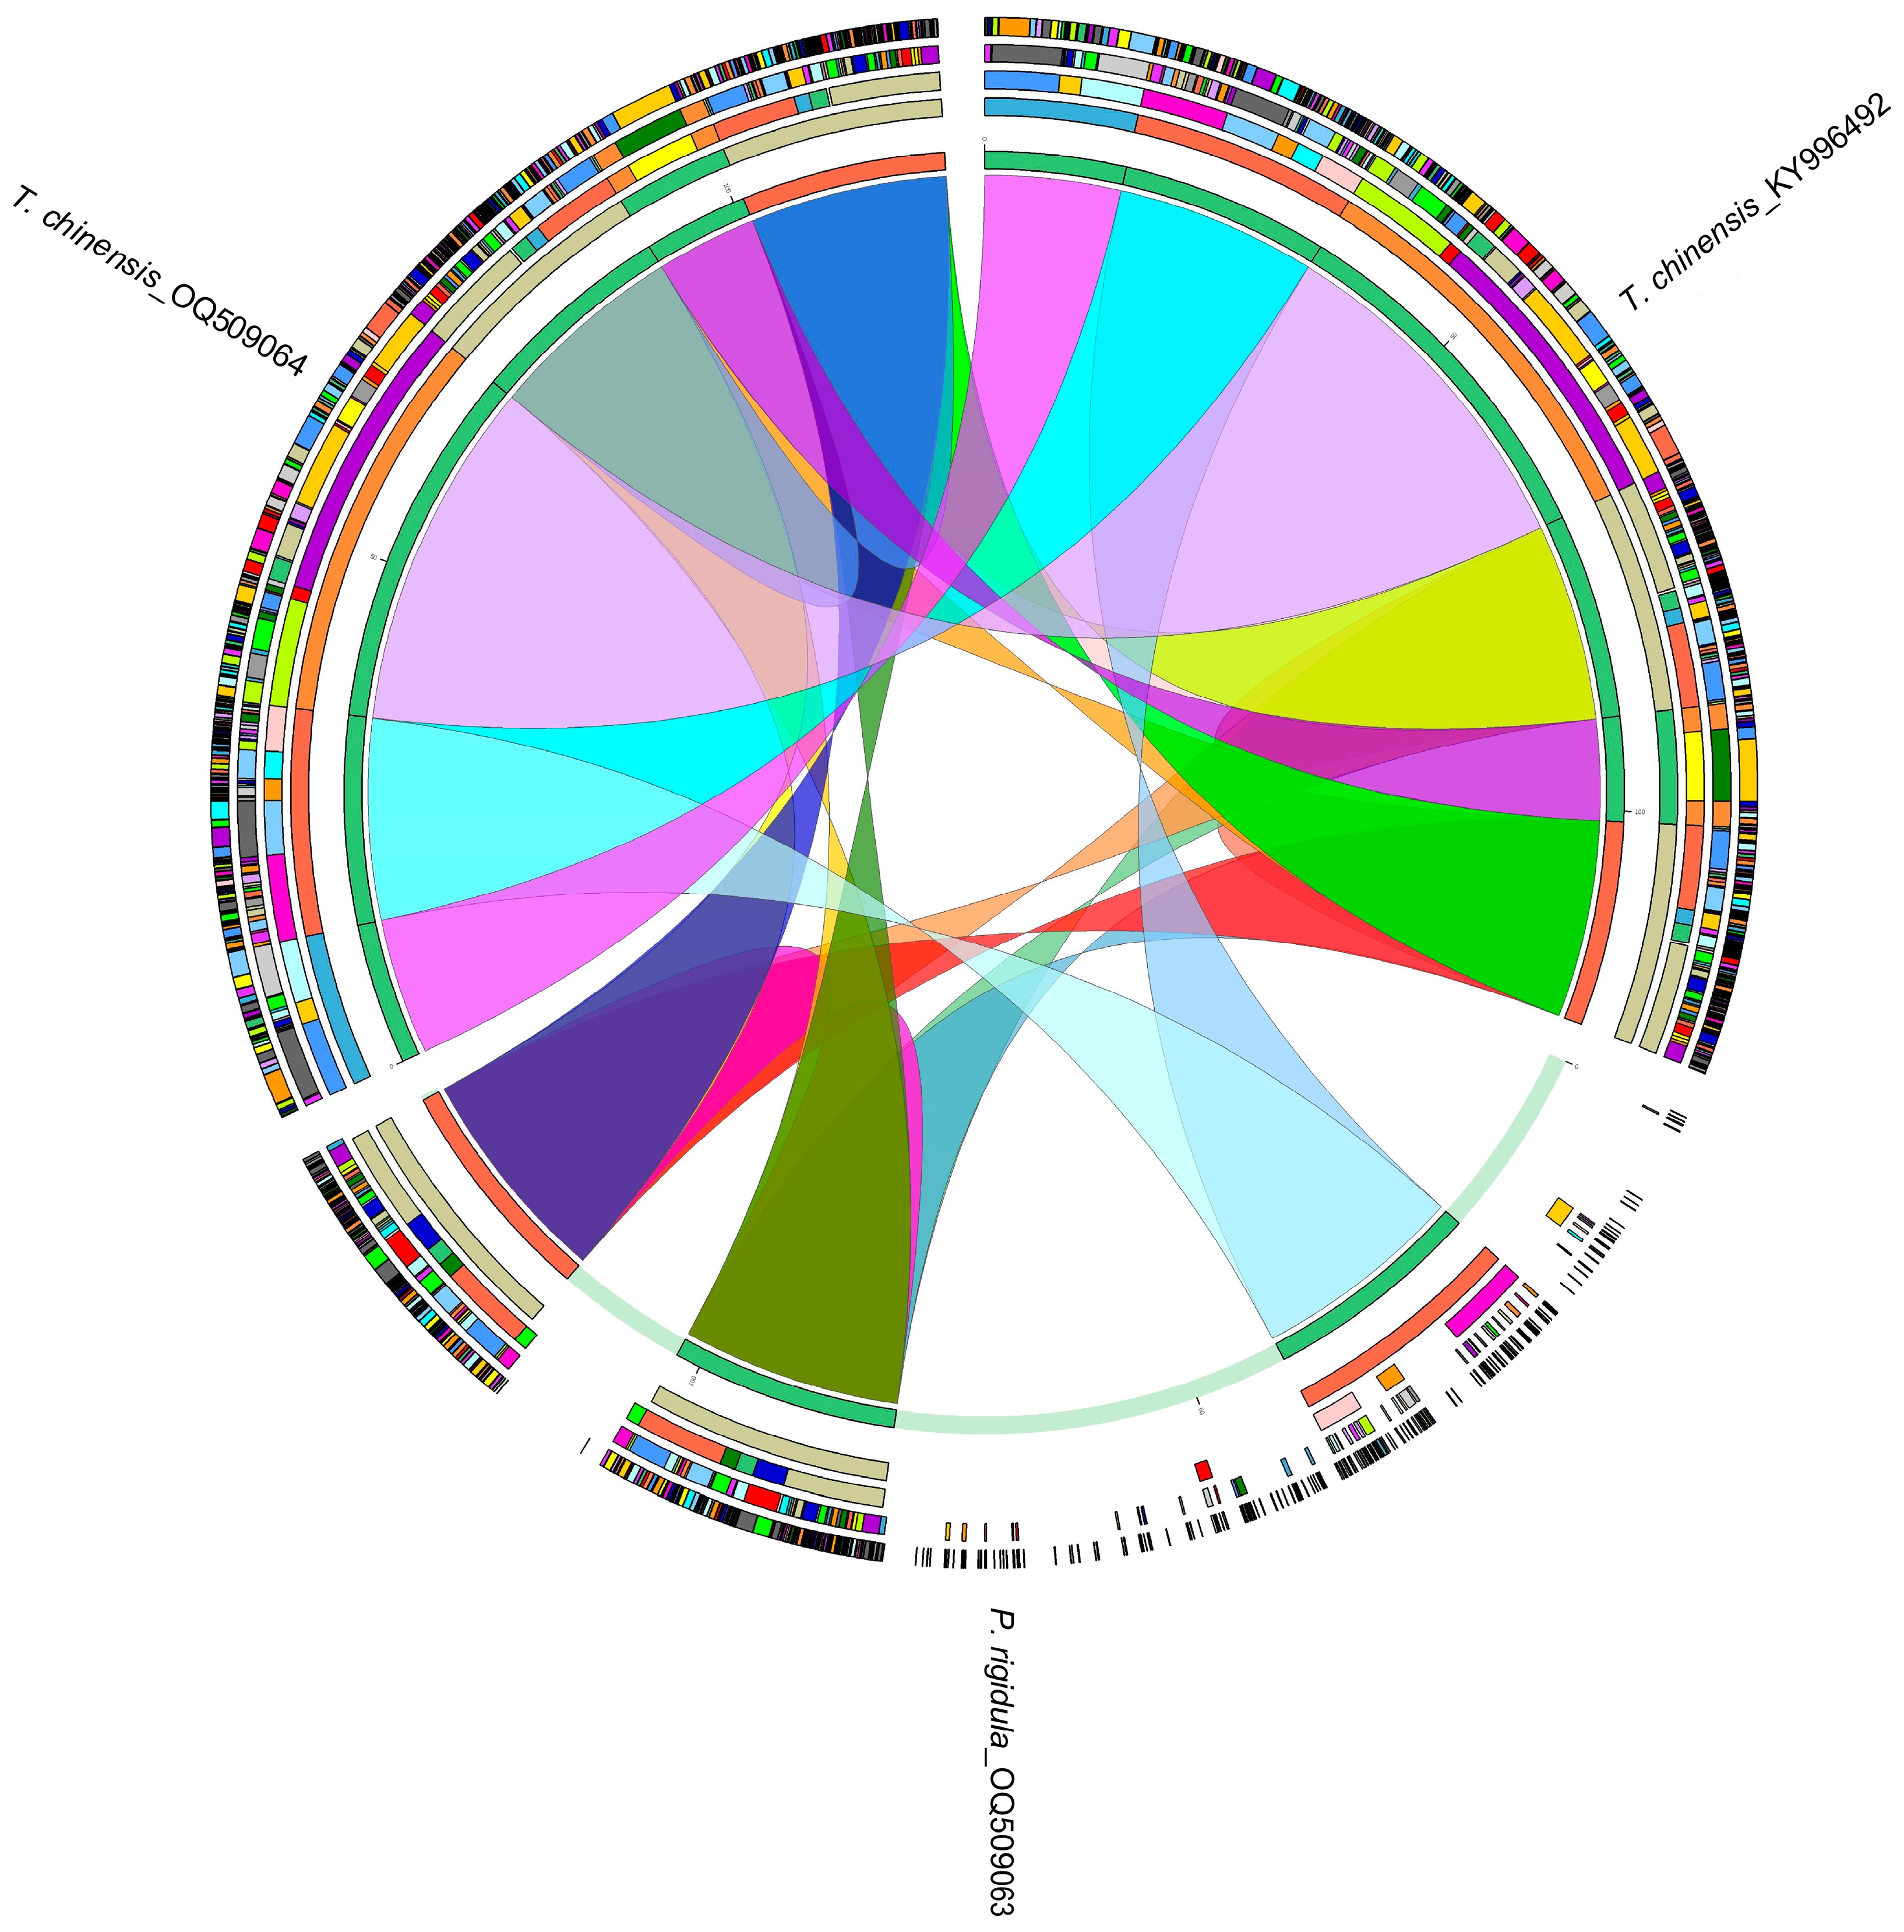
Then, the homology of the chloroplast genomes of P. rigidula, host T. chinensis (OQ509064), and non-host T. chinensis (KY996492) were analyzed (Figure 2). The results showed that the homology between the two chloroplast genomes of T. chinensis was higher than between P. rigidula and its host T. chinensis (OQ509064), indicating that P. rigidula grows on its host T. chinensis (OQ509064), but they do not share the chloroplast genome. trnA-UGC, trnI-GAU, trnL-UAA, and ycf1 were present in the chloroplast genomes of P. rigidula and host T. chinensis (OQ509064) but not in non-host T. chinensis (KY996492).
HGT, which is the exchange of genes across interspecific barriers, is considered to be a major driver of bacterial evolution [51]. In the present study, all genes in the chloroplast genomes of P. rigidula resembled the genes of Phacellaria species, and trnA-UGC, trnI-GAU, trnL-UAA, and ycf1 genes in host T. chinensis (OQ509064) resembled the genes of Tallixus species, on the basis of sequence similarity through BLAST and phylogenetic trees, indicating HGT was not found between P. rigidula and its host T. chinensis. HGT is a characteristic of parasitic plants, and it provides strong evidence for direct gene exchange between parasitic plants and host plants [52,53,54]. By using sequence alignment and phylogenetic trees, Li et al. [42] demonstrated that the rpoC2 gene of Cistanche deserticola was transferred from its host plant Haloxylon ammodendron. Park et al. [55] also reported HGT events in the rps2, rbcL, and trnL-F genes of Orobanchaceae species.
3.4. Codon Usage Analysis of the Chloroplast Genomes of Taxillus and Phacellaria Species
Codon usage bias is the non-uniform usage of synonymous codons in the transcripts of proteins, excluding methionine and tryptophan, to encode specific amino acids in the protein [56]. Variation in compositional constraints between genomes is a significant factor in the formation of codon usage bias, as it is influenced by differences in selection pressure and degree of variation [36,57,58]. Furthermore, codon usage bias can be utilized to examine an organism’s evolutionary history, predict expression, and gain insight into the molecular-level evolutionary processes affecting genomes [56,59].
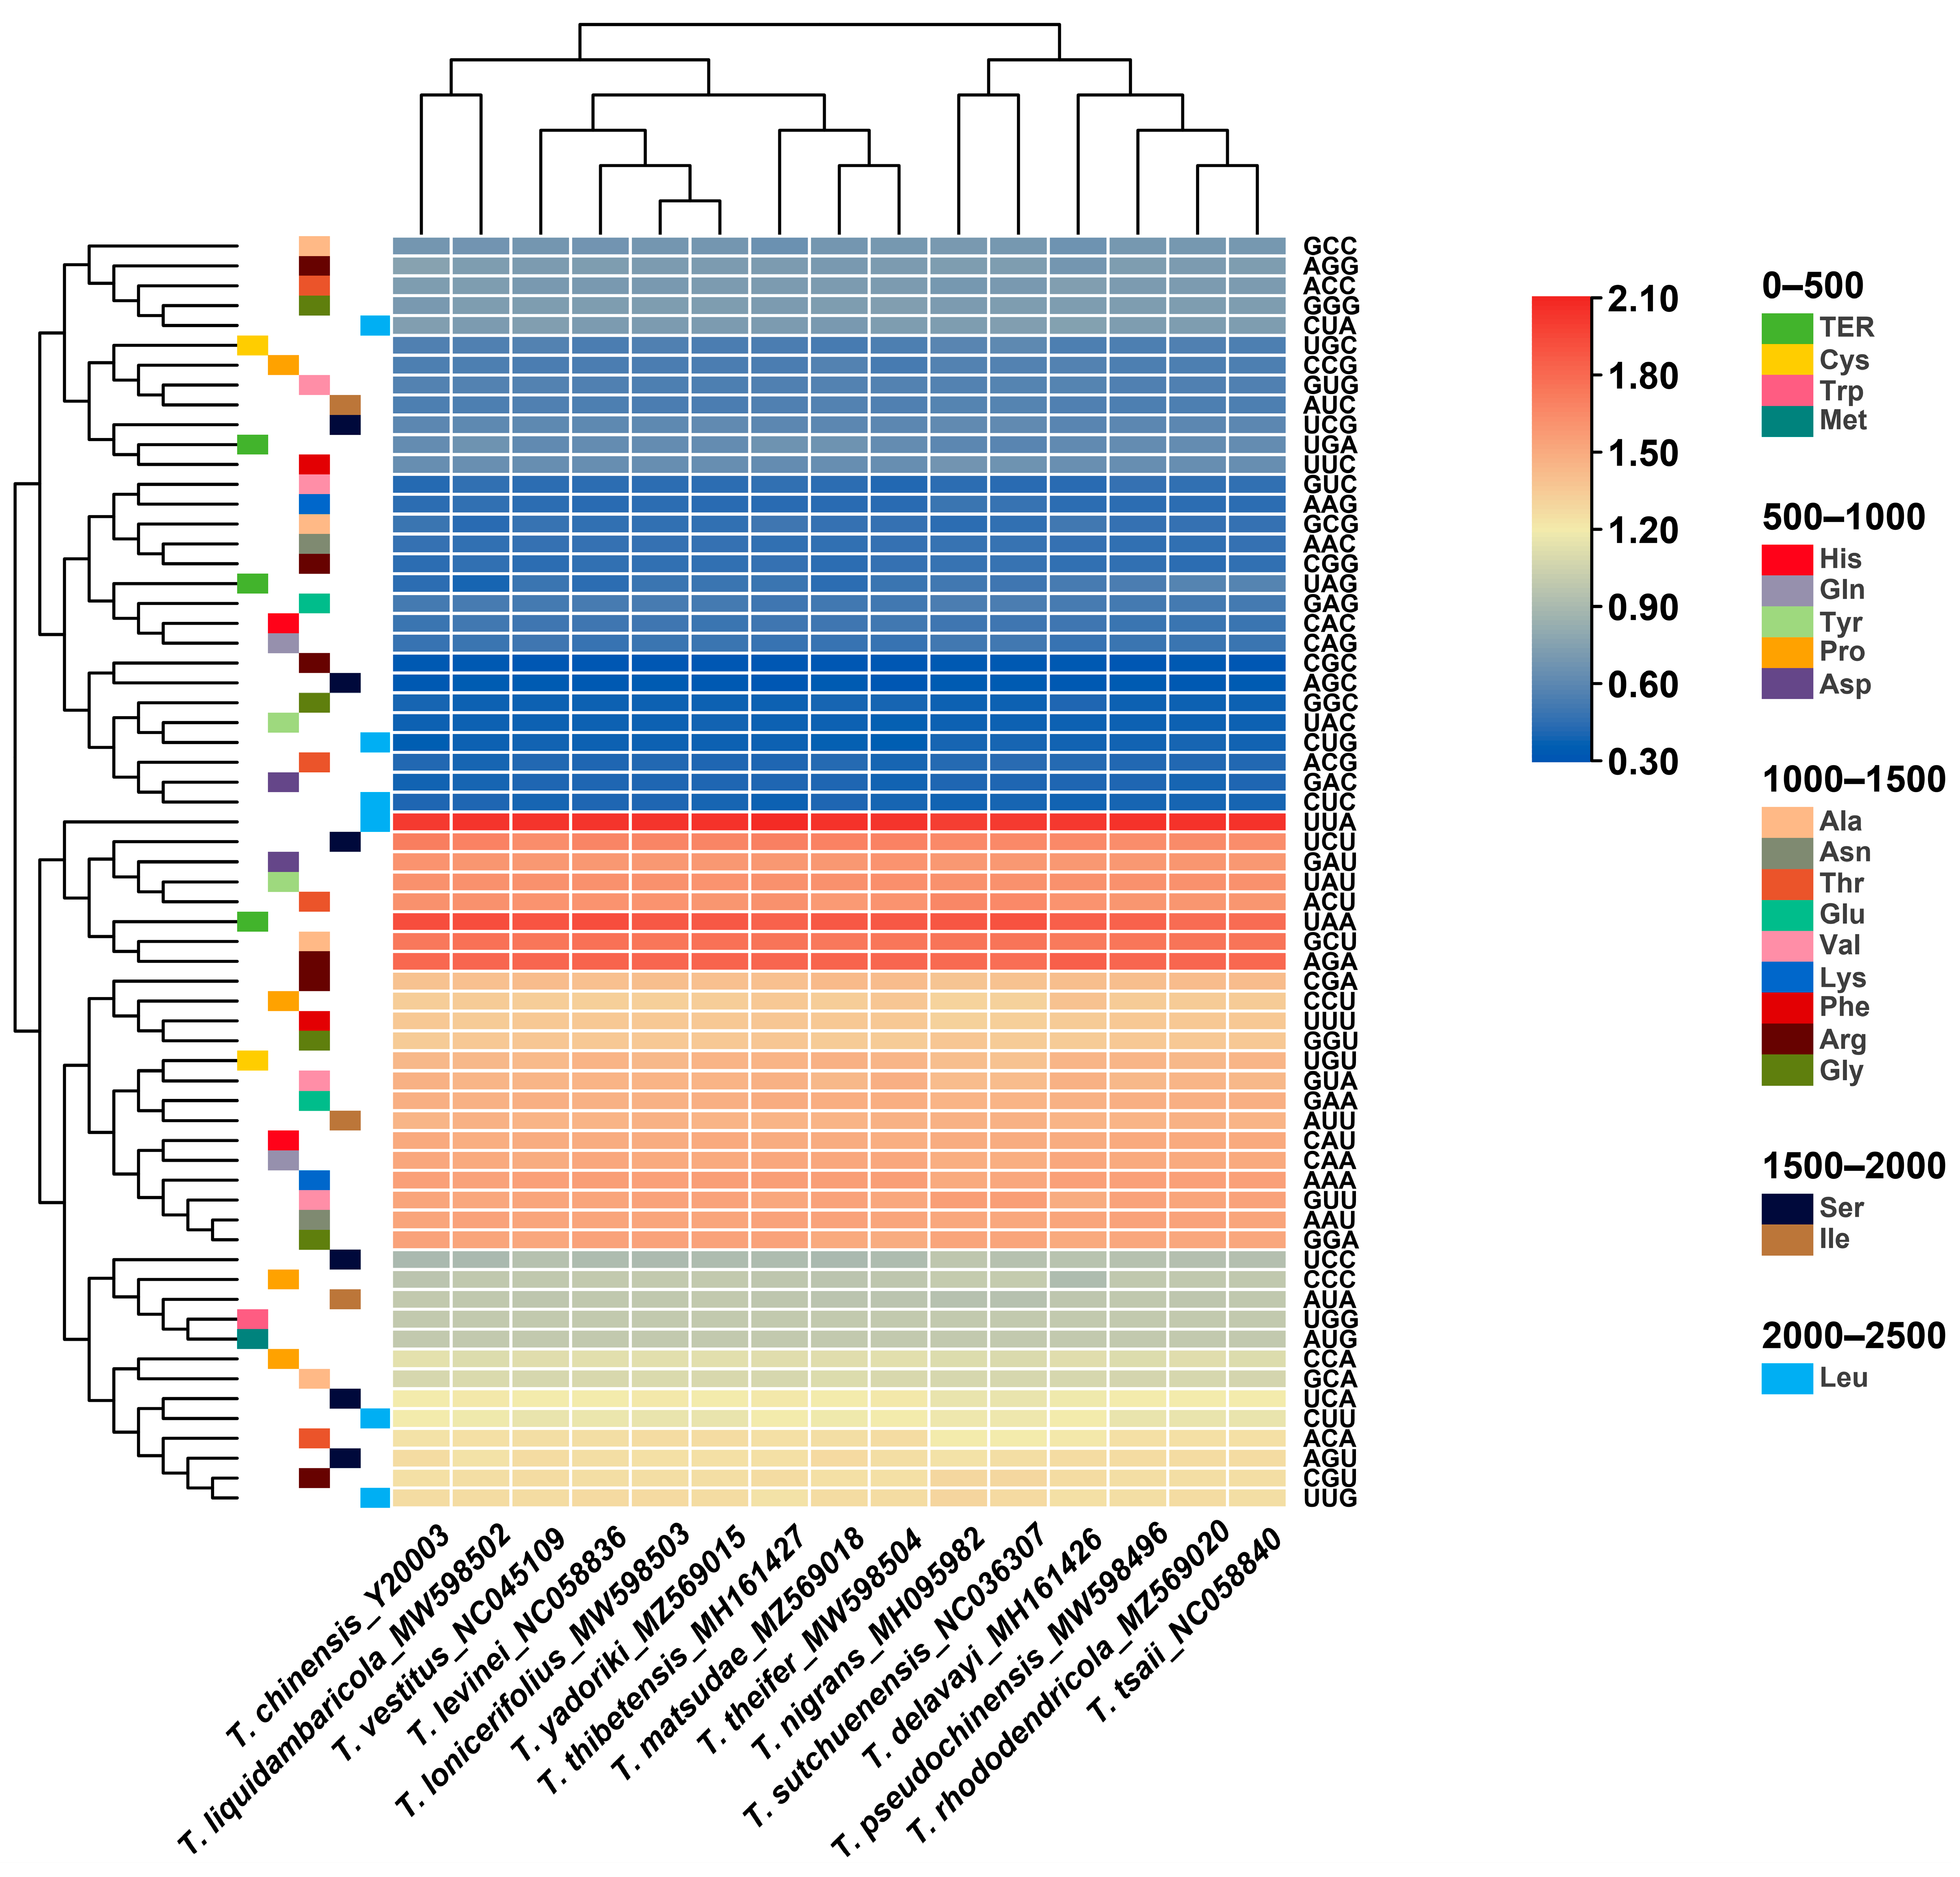
The relative synonymous codon usage (RSCU) of the chloroplast genome of all published Taxillus and Phacellaria species was calculated on the basis of all protein-coding genes. RSCU measures the frequency of usage of a specific codon relative to the expected frequency and is utilized to identify non-uniform usage of synonymous codons in the coding sequence. Codons with no preference value are assigned a value of 1.00. Codons with an RSCU value > 1.00 are used more frequently than expected, while codons with an RSCU value < 1.00 are used less frequently than expected. The codon usage information of protein-coding genes in the chloroplast genomes of all published Taxillus and Phacellaria species is shown in Figure 3. A similar codon usage was observed in the chloroplast genomes of Taxillus and Phacellaria species. These species had 64 codons that code for 20 different amino acids in their chloroplast genomes. In addition, 19,432 (T. nigrans)–21,646 (P. glomerata) codons were found to encode these amino acids. Among these amino acids, leucine (Leu) was the most widely distributed, whereas cysteine (Cys) was the least distributed. In addition, the codon usage of other amino acids, except for methionine (Met) and tryptophan (Trp), had a preference. Most codons with an RSCU value > 1 were A/U-ending codons, and most codons with an RSCU value ≤ 1 were G/C-ending codons. The chloroplast genome exhibited a greater bias towards the A/U-ending codons than the G/C-ending codons. High codon usage preference, especially high A/U base usage preference, was similar in many plants, such as Aquilaria sinensis [60] and Ulmus species [61].
GC (the total GC content) reflects the strength of directional mutation pressure, and GC3s (GC content at synonymous third codon position) is closely associated with codon bias and serves as a crucial factor in analyzing codon usage patterns [62,63]. The GC and GC3s values in the codons of the 18 chloroplast genomes examined were less than 0.5, indicating a preference for A/U bases and A/U-ending codons in Taxillus and Phacellaria species. Analysis of codon adaptation index (CAI) and effective number of codon values (ENc) suggested a minor bias in codon usage among these species, with a relatively low frequency of optimal codons (Fop). Hydrophobicity (Gravy) and aromaticity (Aromo) slightly impacted codon usage bias (Table 1).
3.5. Long Repeat Sequences and SSRs
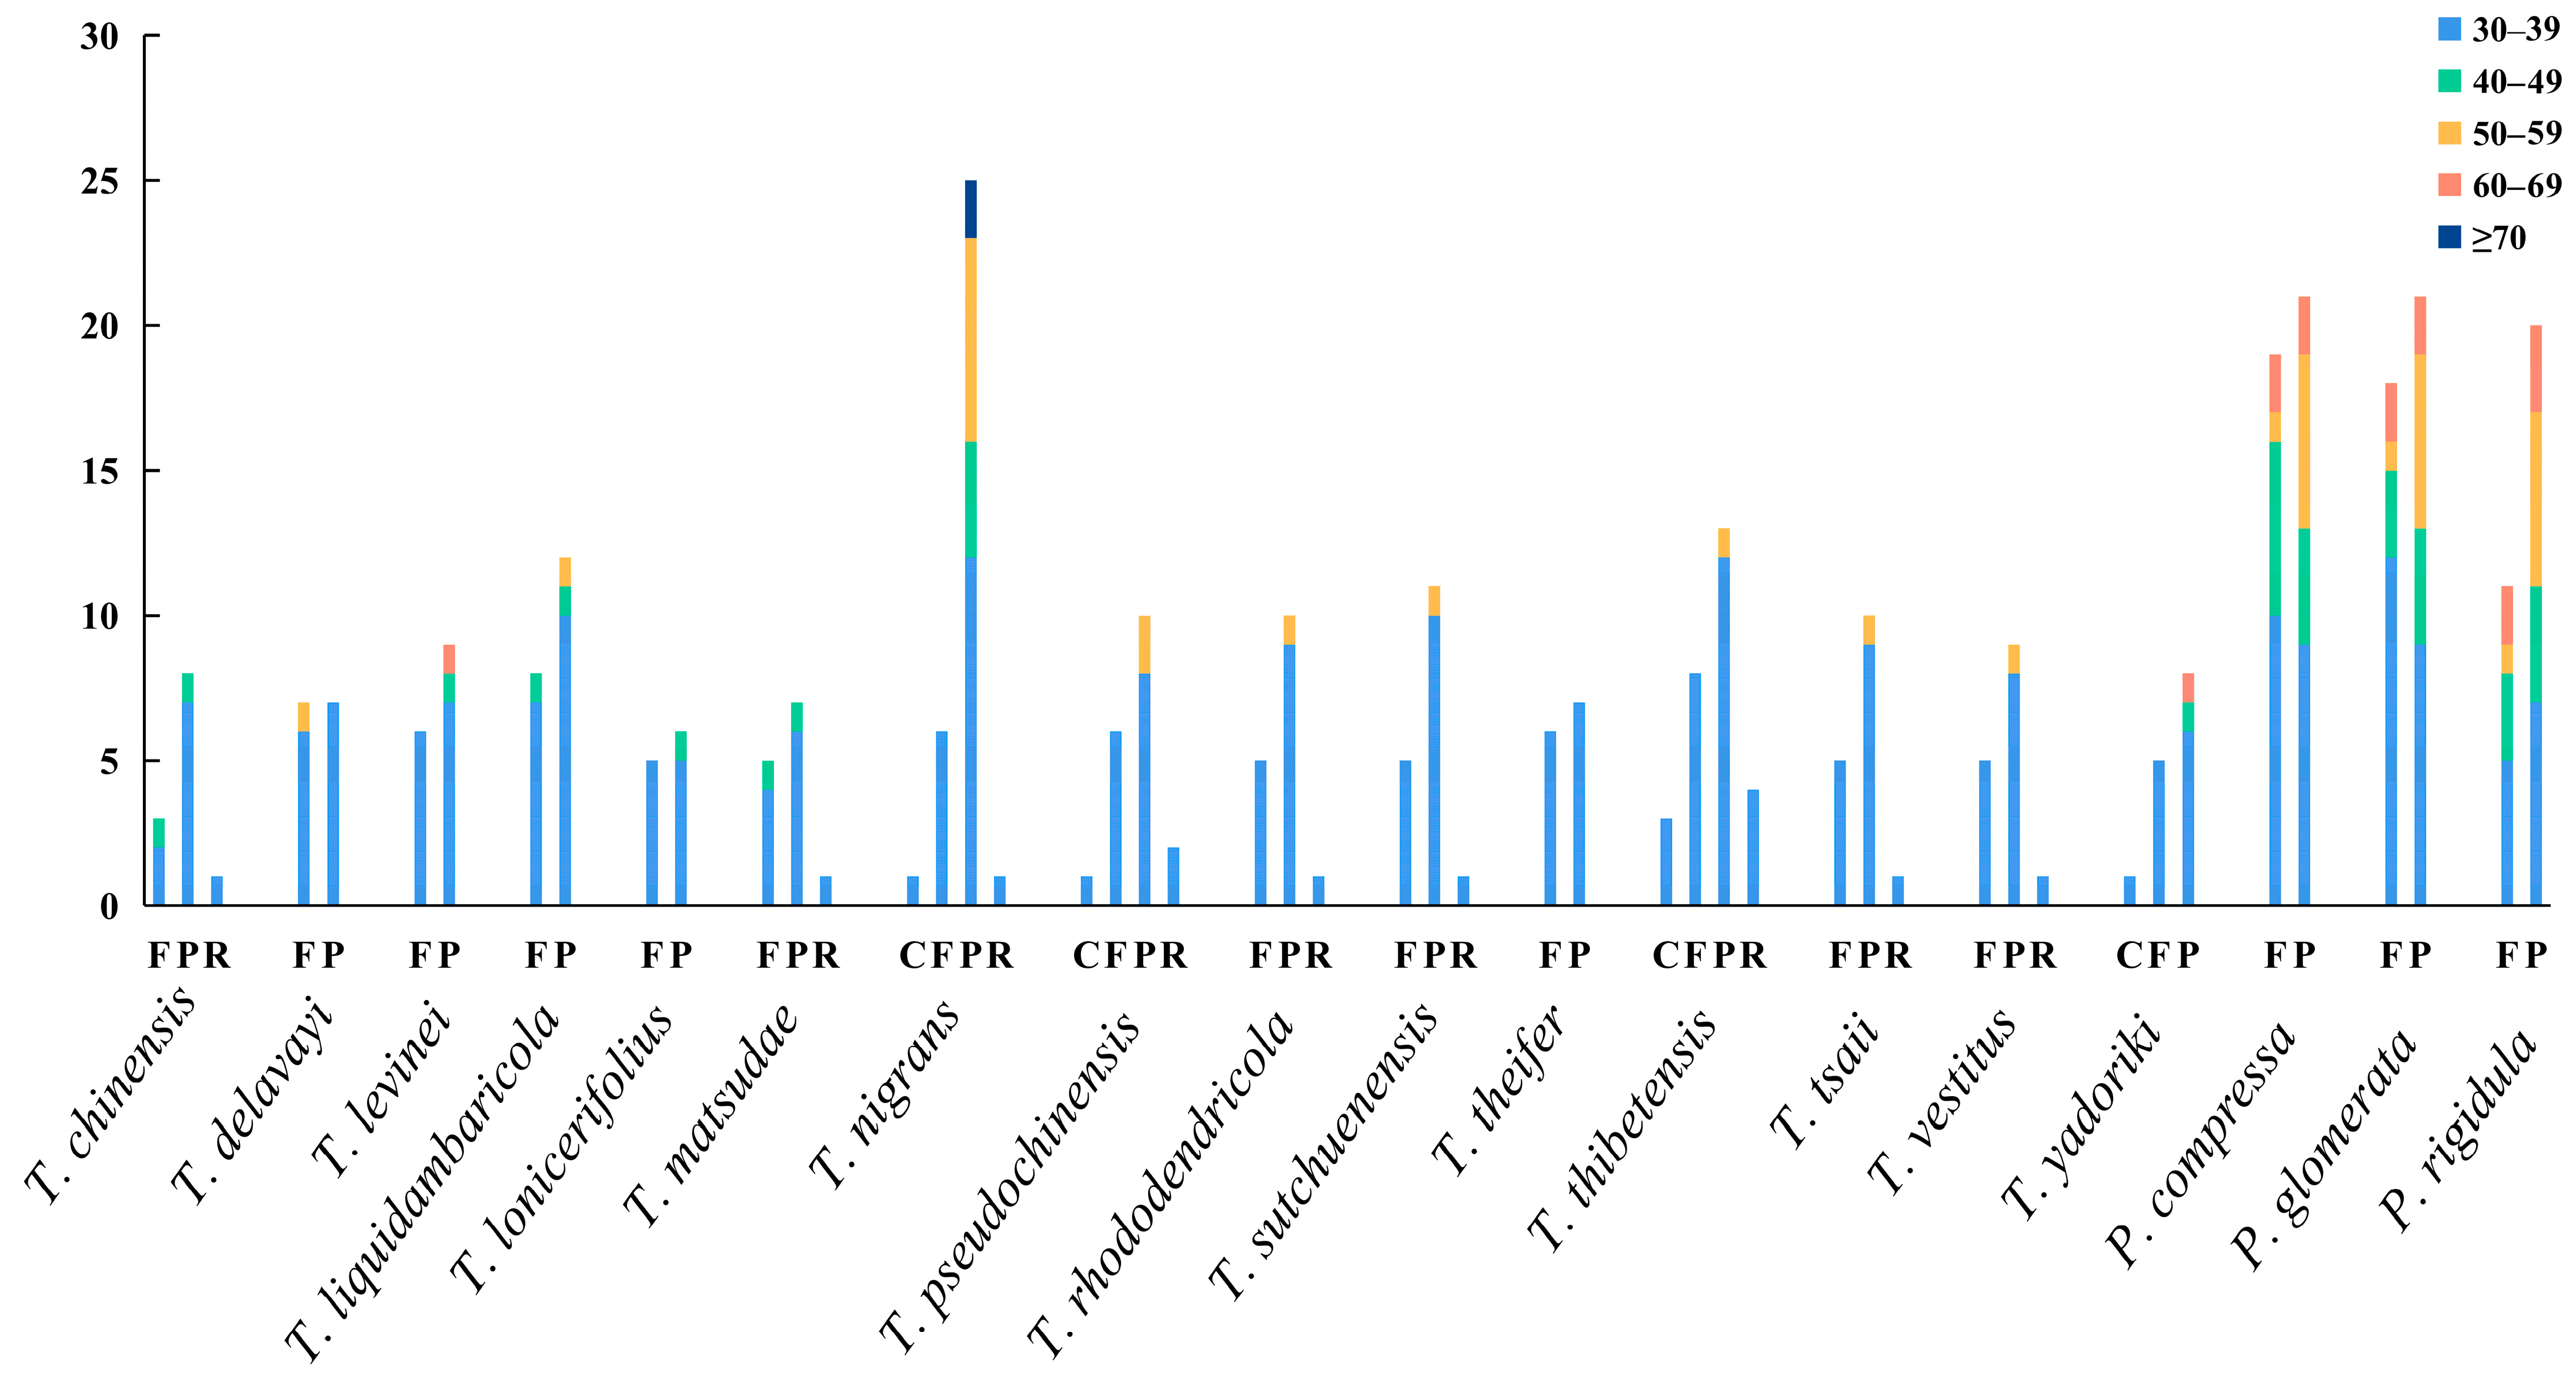
Long repeats have significant implications in genome rearrangement and are frequently employed to examine phylogenetic relationships among species. Additionally, long repeats can stimulate intermolecular recombination in chloroplast genomes, thereby enhancing diversity [64]. These long repeats are mainly distributed in the intergene region and intron sequence, including forward (F), palindrome (P), reverse (R), and complement (C). All repeats analyzed in this study were 30 bp or longer and had a sequence similarity of at least 90%. In Taxillus species, 11 (T. lonicerifolius)–33 (T. nigrans) long repeats were identified, most of which were F and P repeats. The length of C and R repeats was mainly within the range of 30–39 bp. Repeats with a length of 60–69 and ≥70 bp only existed in T. levinei, T. nigrans, and T. yadoriki. In Phacellaria species, 31 (P. rigidula)–40 (P. compressa) long repeats were identified, all of which were F and P repeats (Figure 4).
Simple sequence repeats (SSRs), which are also referred to as microsatellite sequences, can be found extensively throughout chloroplast genomes [65]. Due to its high polymorphism, it is increasingly used as molecular markers, species identification, population genetics, and phylogeny [66,67,68]. A total of 45 (T. levinei)–87 (T. thibetensis) SSRs were detected in the chloroplast genomes of Taxillus species, and 40 (P. compressa)–43 (P. rigidula) SSRs were detected in Phacellaria species (Supplementary Tables S3 and S4). The most common mononucleotide repeats were A/T and most dinucleotide repeats were AT/AT. Most SSRs were rich in A/T, which was greatly related to the high A/T content in the chloroplast genome. Moreover, polyA and polyT occupies a relatively high proportion in the SSRs of many plants, compared with polyC and polyG [69].
3.6. Comparative Analysis of Chloroplast Genomes
The plant bodies of parasitic plants tend to be simplified; they are morphologically difficult to distinguish [70]. The chloroplast genome has highly variable regions, and these highly variable gene fragments could be used to effectively distinguish congenous species [71]. Here, the highly variable regions in the chloroplast genomes of Taxillus and Phacellaria species were screened.
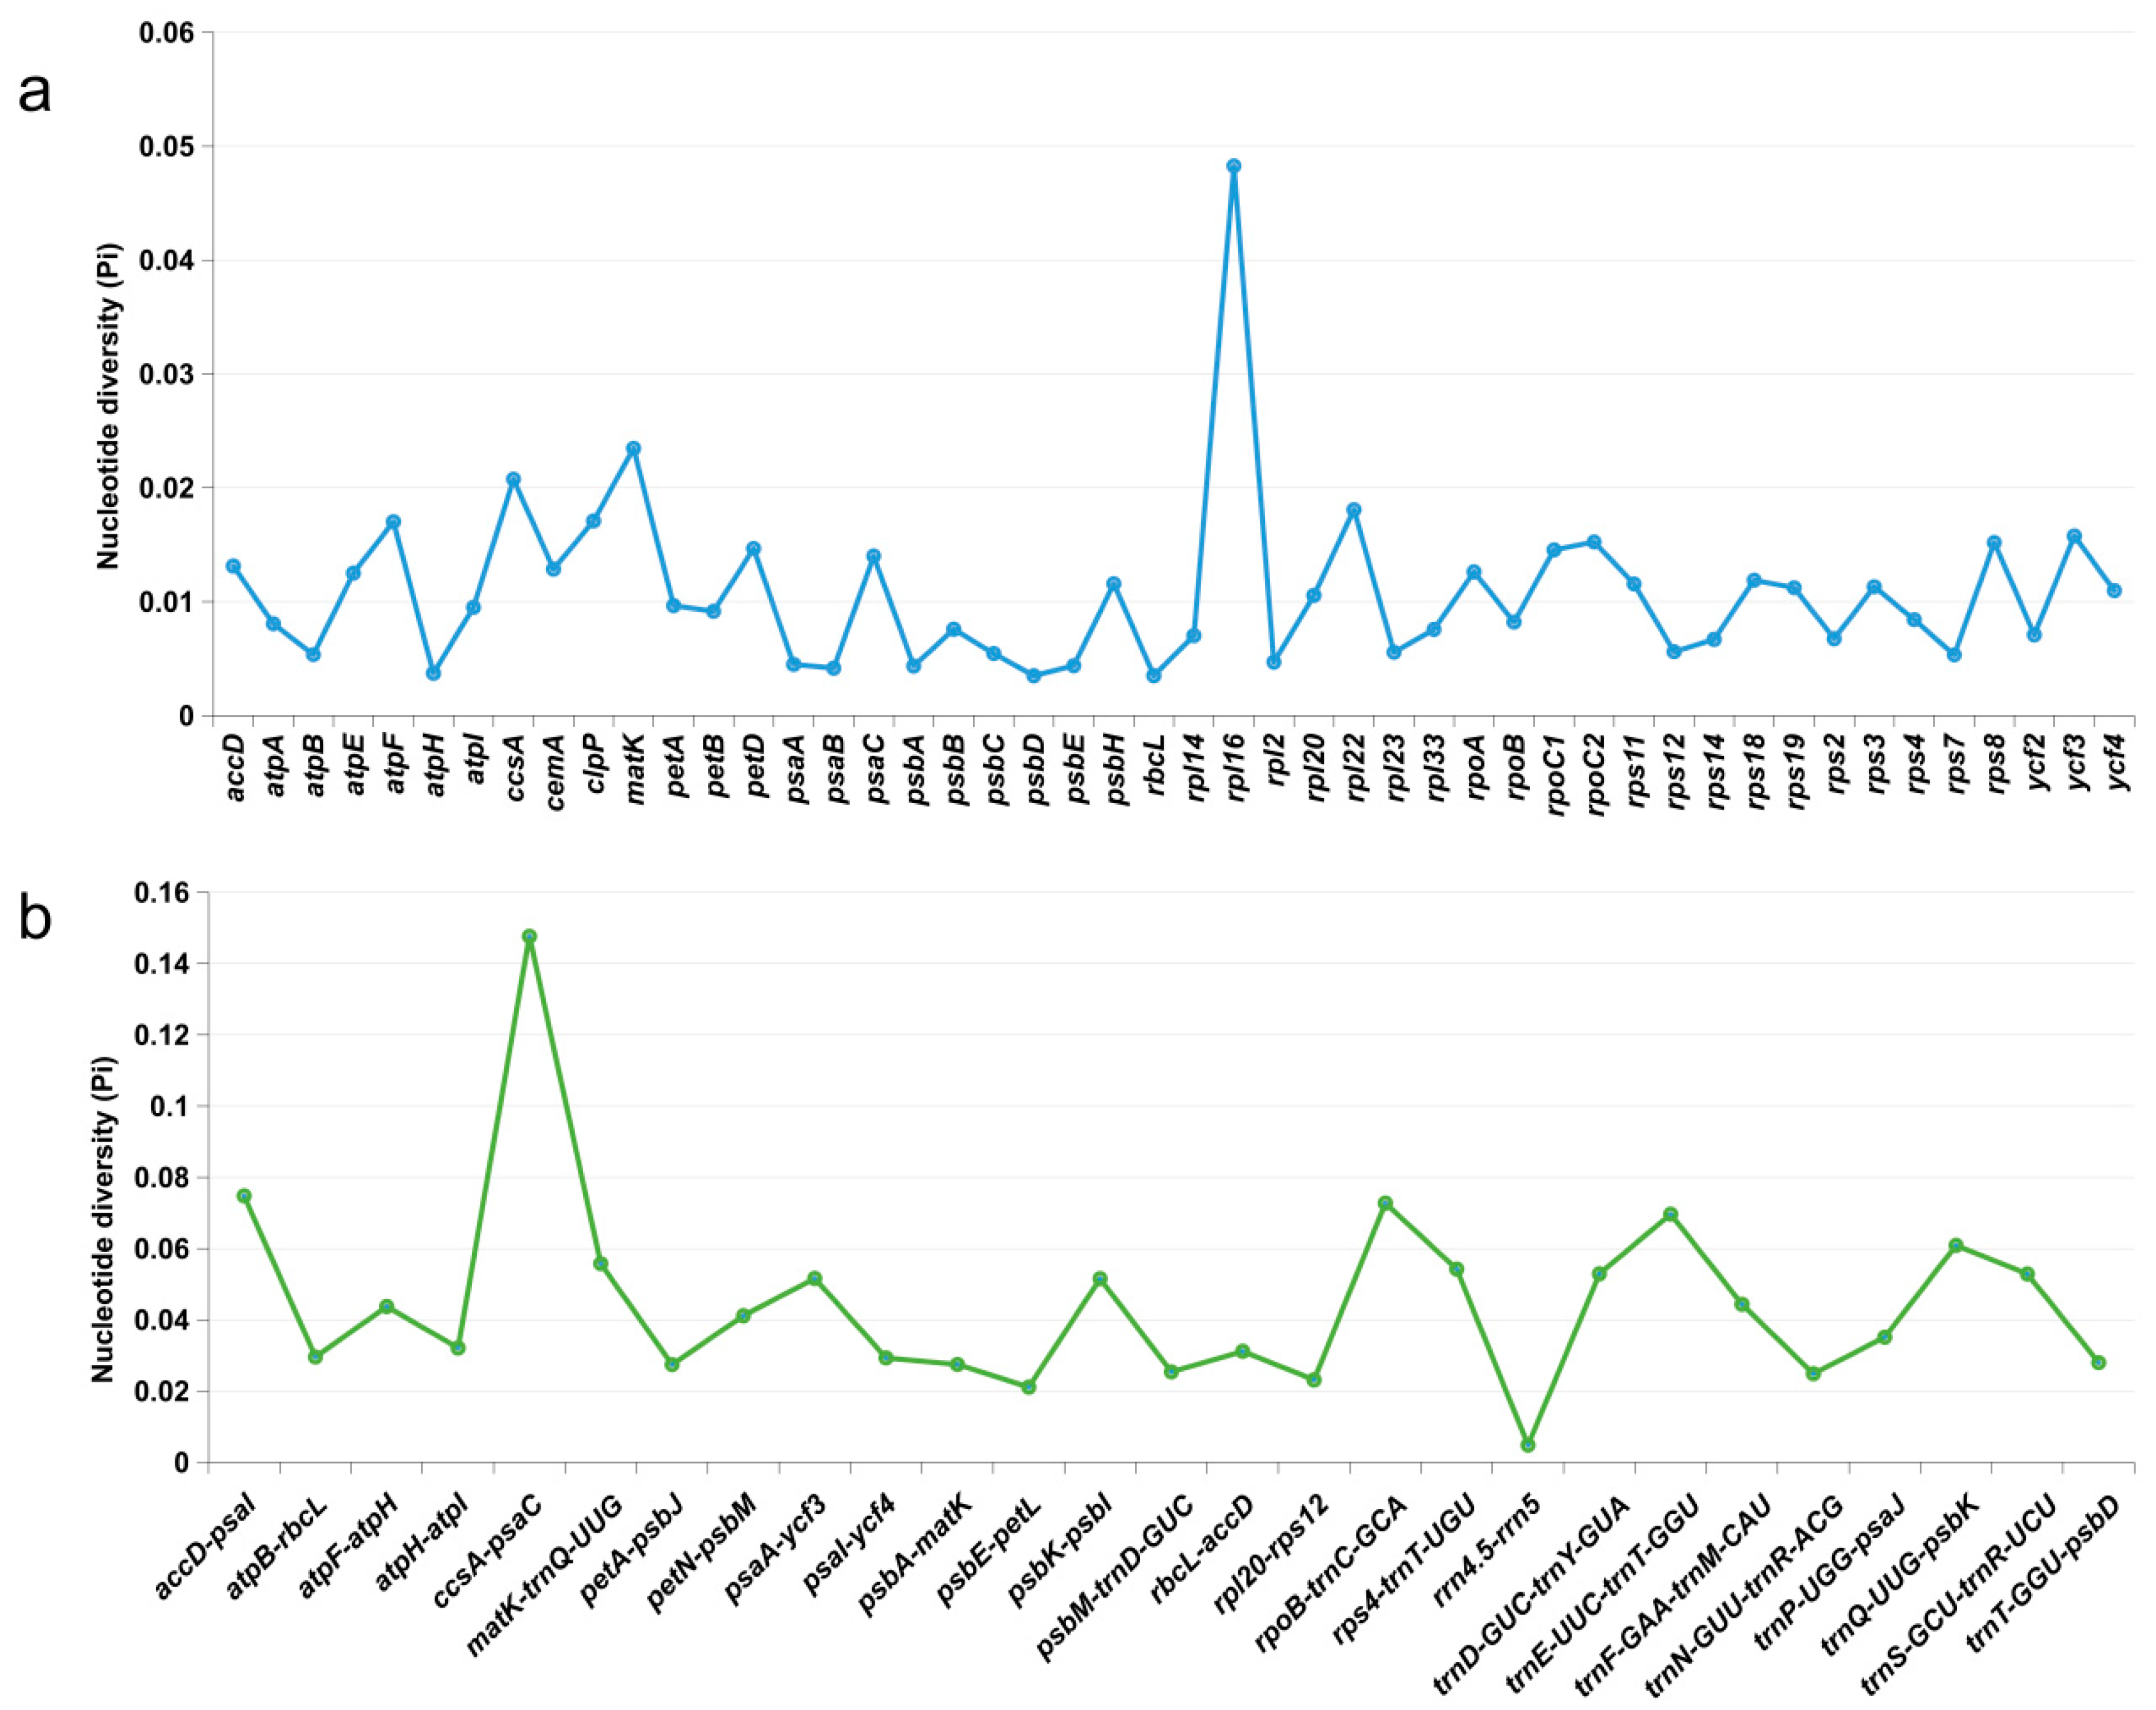
The nucleotide diversity (Pi) of shared genes and intergenic spacers of the chloroplast genomes of the 15 Taxillus species were calculated. In Figure 5, intergenic spacers and genes longer than 200 bp with Pi values greater than 0 are displayed. Polymorphisms were observed to be more frequent in the intergenic spacers (average Pi = 0.0449) compared to the gene regions (average Pi = 0.0108). In accordance with Pi, five candidate highly variable regions were screened out, namely, ccsA-psaC, accD-psaI, rpoB-trnC-GCA, trnE-UUC-trnT-GGU, and rpl16, for species identification and relationship study.
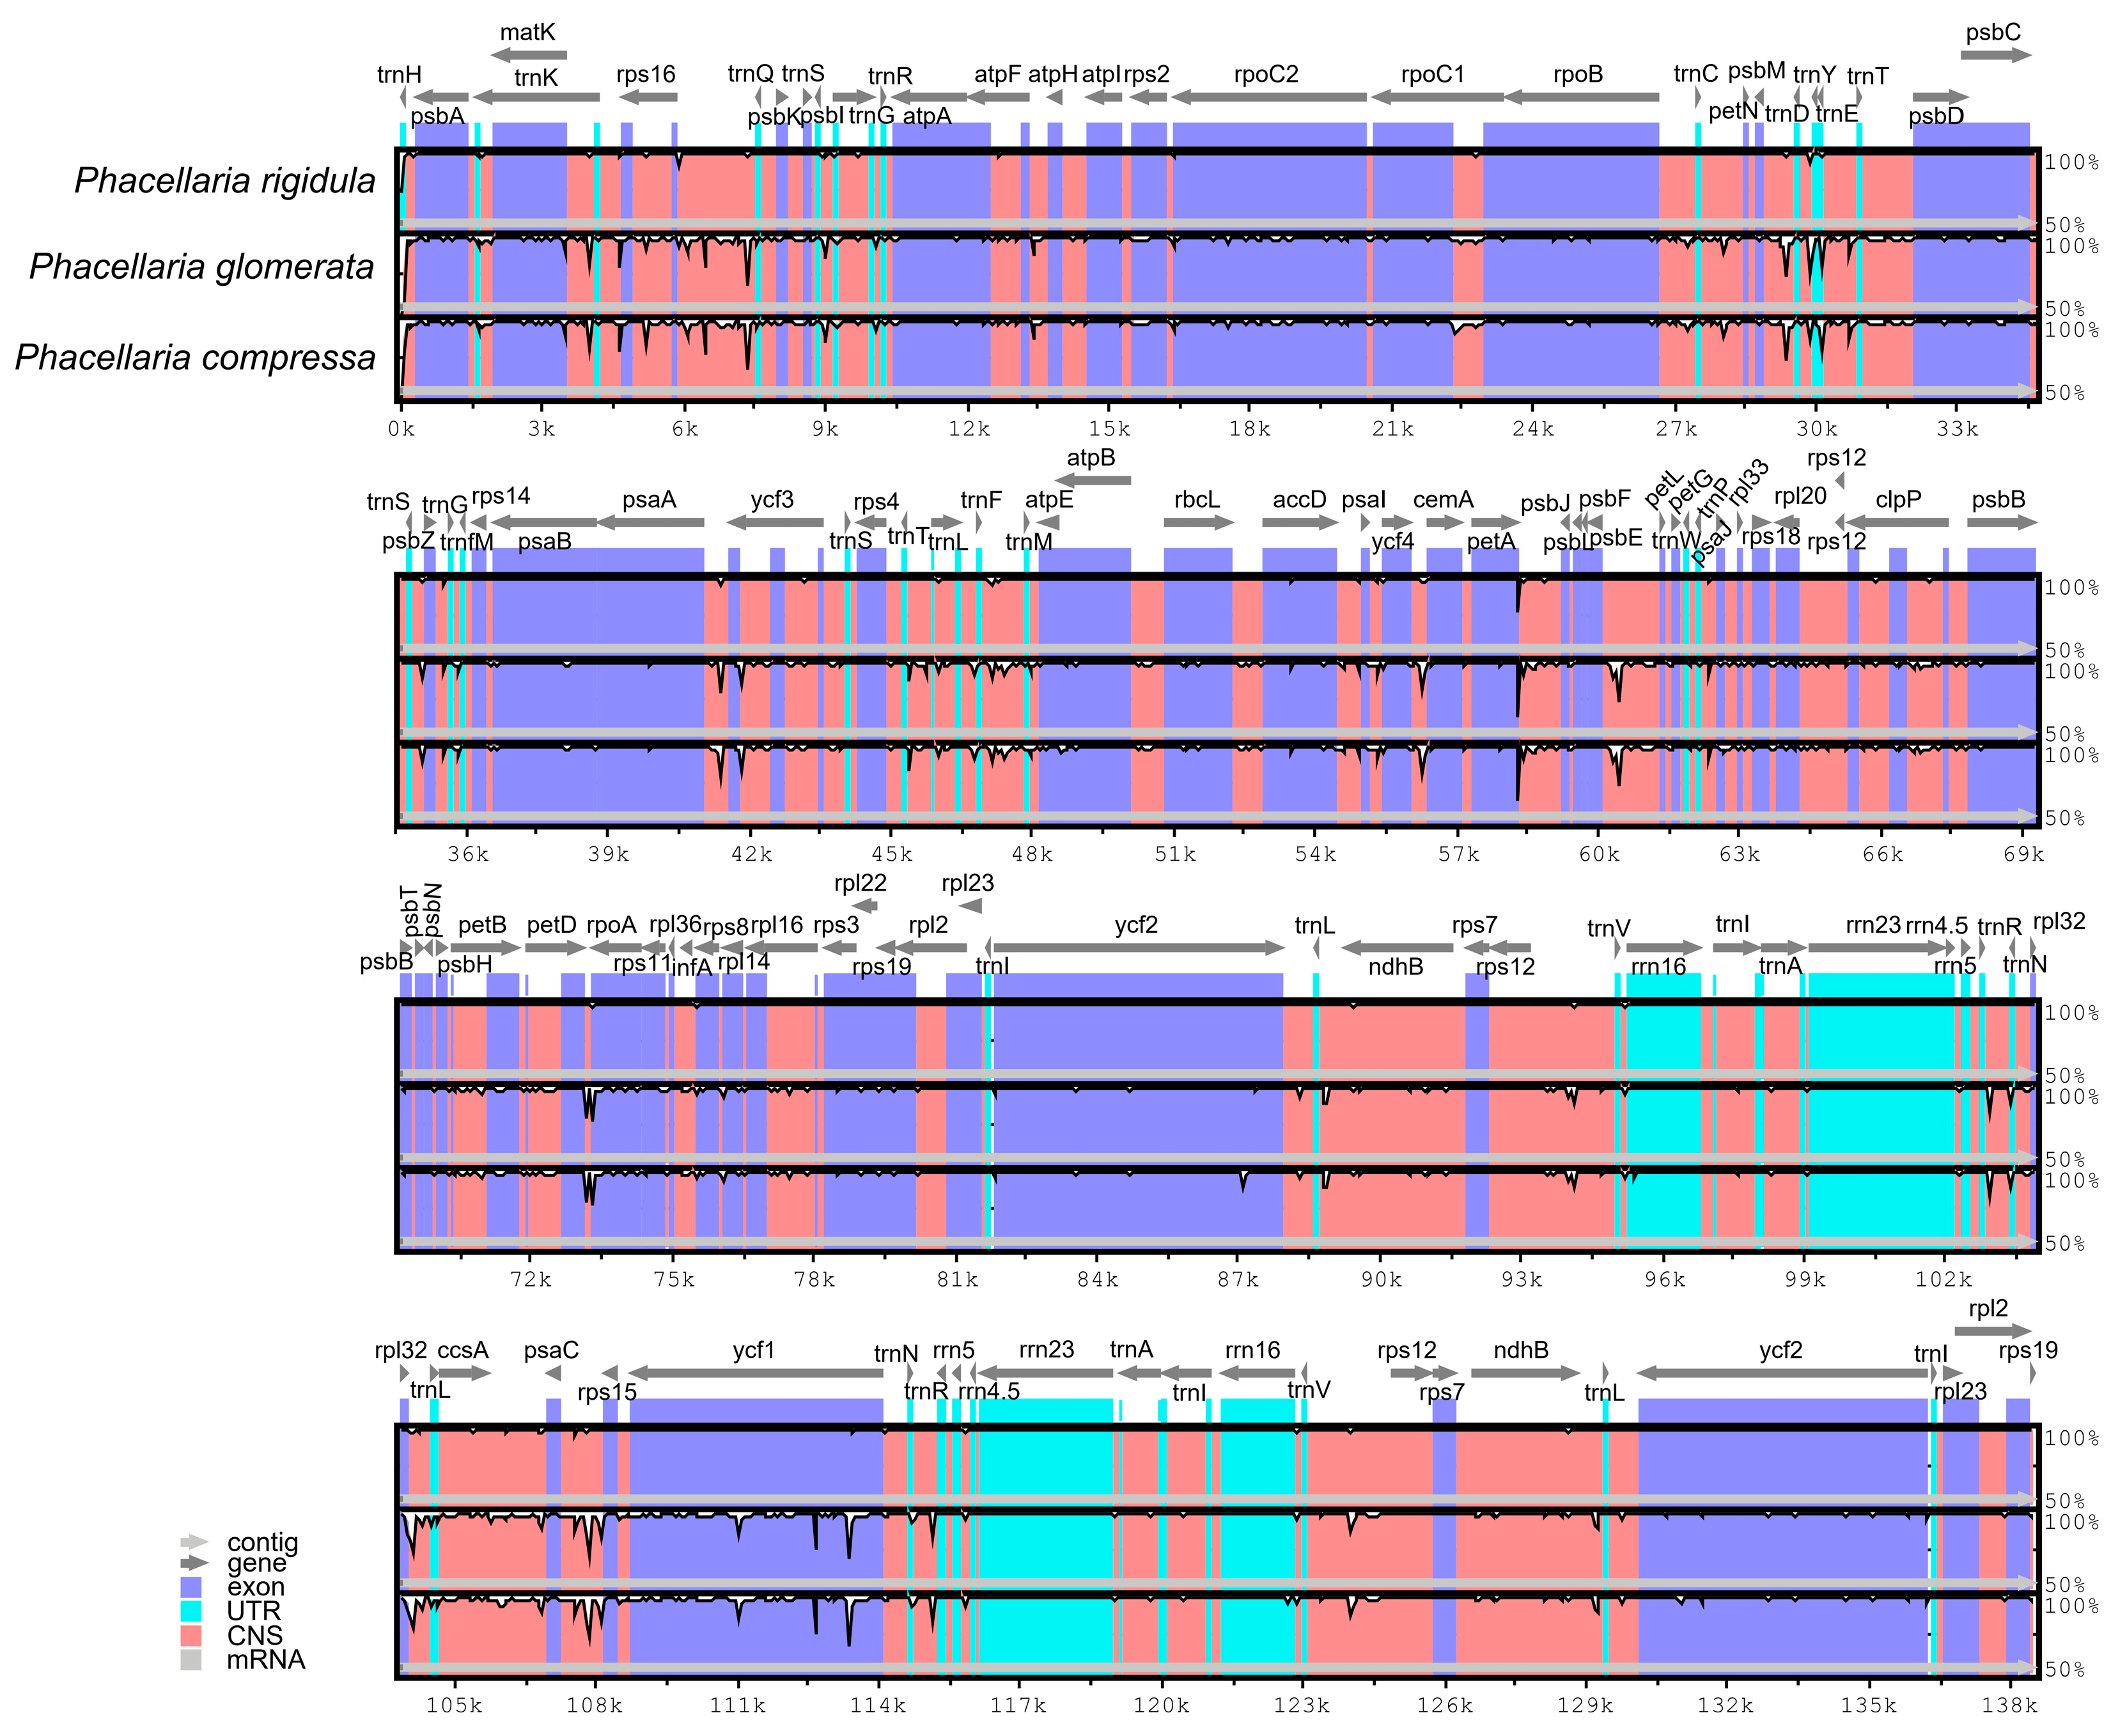
In addition, with the P. rigidula genome as the reference genome, the complete chloroplast genomes of three Phacellaria species were compared (Figure 6). The LSC and SSC regions exhibited significantly higher variations compared to the IR regions, while the rRNA genes remained highly conserved with minimal variations. The genes had a very high degree of conservation (most had >90% similarity), and the most varied gene was ycf1. Variations in intergenic regions were significantly greater than those in protein-coding regions; these intergenic regions included rps16-trnQ-UUG, psbE-petL, rpl32-trnL-UAG, and psaC-rps15.
3.7. Phylogenetic Analysis
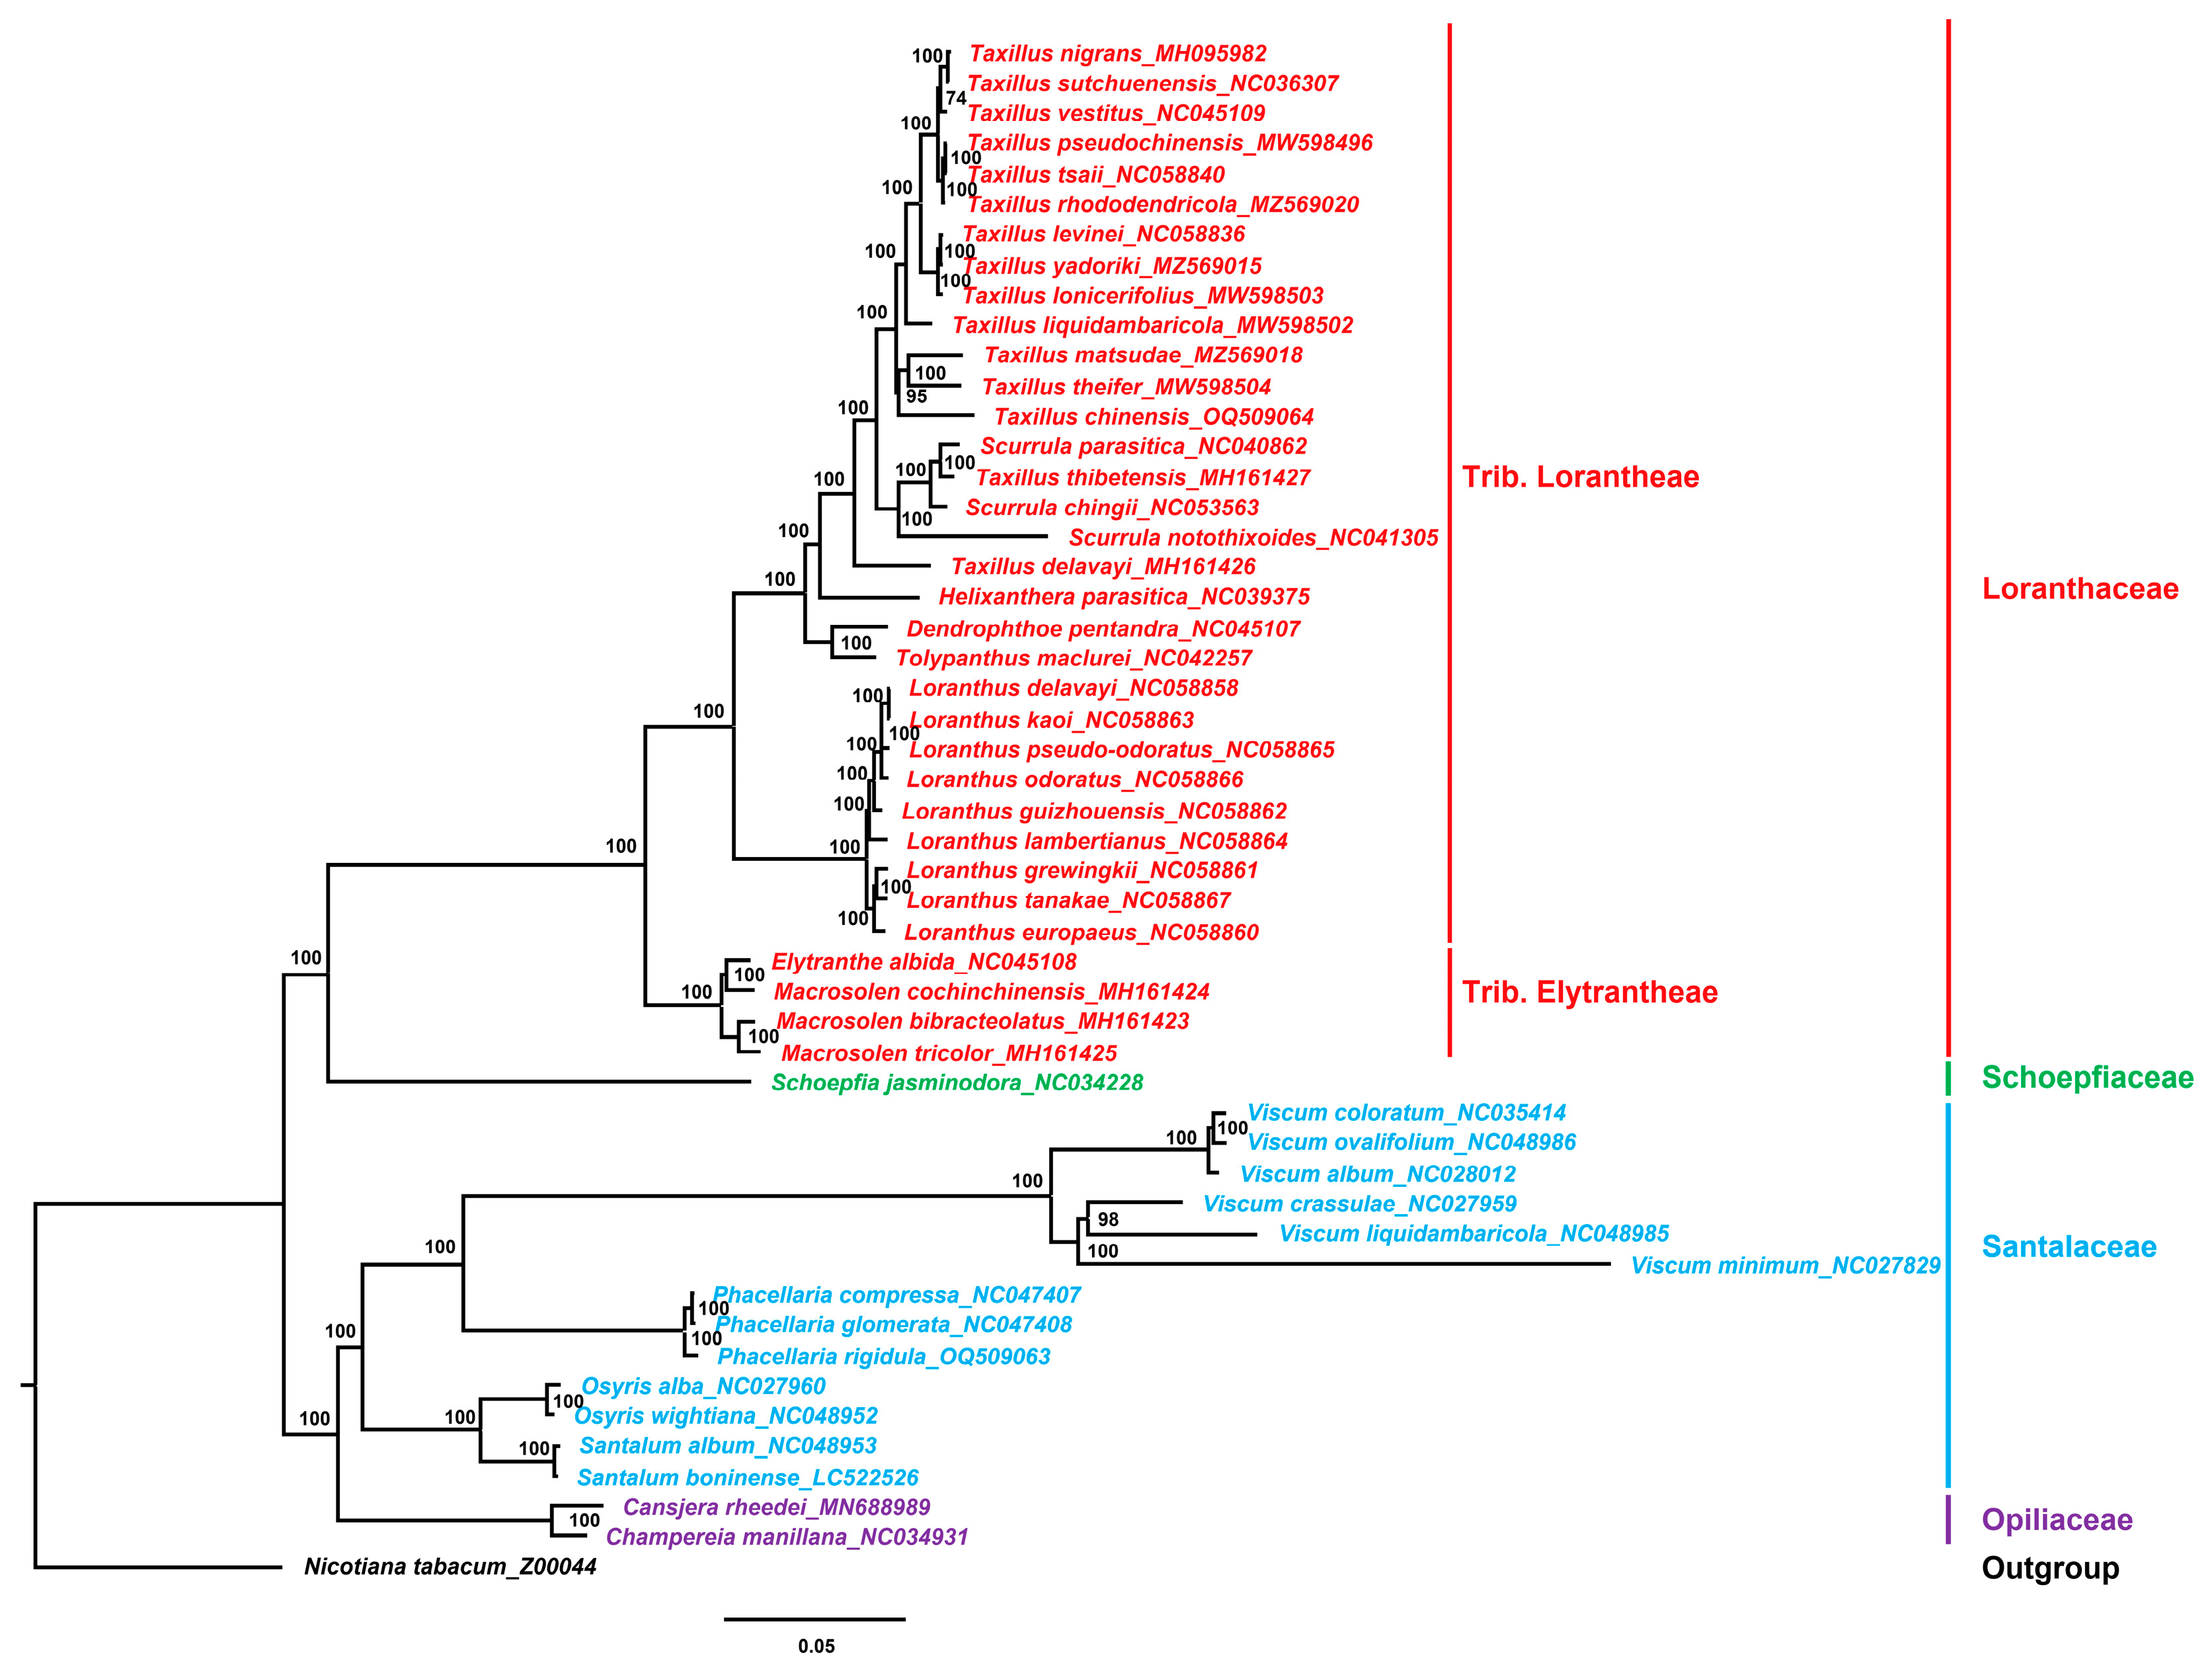
The relatively conservative chloroplast genome contains a large amount of nucleotide and amino acid sequence information and is of great value in plant evolution, taxonomy, and phylogenetic studies [72]. A phylogenetic tree was constructed using the chloroplast genomes of 50 Santalales species, with N. tabacum (Z00044) as the outgroup, to explore the phylogenetic relationship and phylogenetic position of the species in Taxillus and Phacellaria.
The results demonstrated that the bootstrap values were all high (Figure 7). The tree showed that the species of Loranthaceae, Schoepfiaceae, Santalaceae, and Opiliaceae clustered in different branches. In Loranthaceae, the species of Trib. Lorantheae and Trib. Elytrantheae were completely separate. In Trib. Lorantheae, Taxillus, Scurrula, Helixanthera, Tolypanthus, and Dendrophthoe clustered together, and the species of Loranthus clustered in one branch. However, the species of Taxillus and Scurrula did not form separate branches. In addition, the phylogenetic trees based on common protein-coding genes and chloroplast genes commonly used for phylogenetic analysis (matK and rbcL) showed that the species in Taxillus and Scurrula had a close relationship and clustered in one branch (Supplementary Figures S1–S3). Some researchers have suggested that Scurrula and Taxillus should be treated as congeneric [16]. Pollen morphology studies showed that the pollen of species in Taxillus and Scurrula was difficult to distinguish, and that species in Taxillus and Scurrula were closely related [73].
The phylogenetic tree showed that species in Viscum and Phacellaria clustered together. The classification of Viscum plants was always controversial. Loranthaceae used to be divided into Subfam. Loranthoideae and Subfam. Viscoideae, suggesting that Viscum belongs to Loranthaceae [74]. However, in the present study, the relationship of the species in Loranthaceae and Viscum was far. Previous studies have shown significant differences between species in Loranthaceae and Viscum in terms of pollen morphology, chemical composition, and DNA molecular-level; supporting the independent division of Loranthaceae and Viscum [73,75]. The results of the present study also supported to divide Loranthaceae and Viscum into different families. Some studies divided Viscum into Viscaceae family, which is derived from Santalaceae, and they showed that the relationship of species in Viscum and Santalaceae was closely related [76]. Meanwhile, in the Angiosperm Phylogeny Group IV system, Viscum belongs to Santalaceae. The present study showed that classifying Viscum under Santalaceae is more appropriate.
4. Conclusions
In this study, three chloroplast genomes of Taxillus (T. chinensis, T. delavayi, and T. thibetensis) and one chloroplast genome of Phacellaria (P. rigidula) were sequenced and analyzed, among which T. chinensis is the host of P. rigidula. Compared with the chloroplast genome of the autotrophic plant N. tabacum, those of Taxillus and Phacellaria species all showed gene losses, especially the genes involved in photosynthesis. The homology between P. rigidula and its host T. chinensis was low, indicating that P. rigidula grows on its host T. chinensis but they do not share the chloroplast genome. In addition, HGT was not found between P. rigidula and its host T. chinensis. The phylogenetic analysis revealed that the species of Taxillus and Scurrula were closely related, and supported that Scurrula and Taxillus should be treated as congeneric. Meanwhile, the species in Phacellaria had a close relationship with that in Viscum.
Supplementary Materials
The following supporting information can be downloaded at: https://www.mdpi.com/article/10.3390/genes14040943/s1, Supplementary Table S1: Comparison of the basic information of chloroplast genomes. Supplementary Table S2: Comparison of the gene composition in chloroplast genomes. Supplementary Table S3: Types and amounts of SSRs in the chloroplast genomes of Taxillus species. Supplementary Table S4: Types and amounts of SSRs in the chloroplast genomes of Phacellaria species. Supplementary Figure S1: Phylogenetic tree constructed using Maximum Likelihood (ML) method based on common protein-coding genes of Taxillus and Scurrula species. Numbers at nodes are values for bootstrap support. Supplementary Figure S2: Phylogenetic tree constructed using ML method based on matK genes of Taxillus and Scurrula species. Numbers at nodes are values for bootstrap support. Supplementary Figure S3: Phylogenetic tree constructed using ML method based on rbcL genes of Taxillus and Scurrula species. Numbers at nodes are values for bootstrap support.
Author Contributions
Conceptualization, H.Y.; data curation, L.W.; formal analysis, L.W. and P.F.; funding acquisition, H.Y. and Y.L. (Yonghua Li); investigation, L.W., P.F., and J.Z.; methodology, L.W., P.F., and J.Z.; project administration, H.Y.; resources, Y.L. (Yonghua Li), Y.L. (Yulin Lin), Y.W. and J.S.; software, L.W. and Z.X.; supervision, H.Y.; validation, H.Y.; visualization, L.W. and P.F.; writing—original draft, L.W. and P.F.; writing—review and editing, H.Y. All authors have read and agreed to the published version of the manuscript.
Funding
This research was funded by the Chinese Academy of Medical Sciences (CAMS) Innovation Fund for Medical Sciences (CIFMS) (No. 2021-I2M-1-071), and Guangxi Natural Science Foundation (No. 2013GXNSFAA019120).
Institutional Review Board Statement
Not applicable.
Informed Consent Statement
Not applicable.
Data Availability Statement
The assembled chloroplast genomes of P. rigidula, T. chinensis, T. delavayi and T. thibetensis were deposited in GenBank with the accession numbers OQ509063, OQ509064, MH161426, and MH161427.
Conflicts of Interest
The authors declare no conflict of interest.
References
- Dyall, S.D.; Brown, M.T.; Johnson, P.J. Ancient invasions: From endosymbionts to organelles. Science 2004, 304, 253–257. [Google Scholar] [CrossRef] [PubMed]
- Clegg, M.T.; Gaut, B.S.; Learn, G.H.; Morton, B.R. Rates and patterns of chloroplast DNA evolution. Proc. Natl. Acad. Sci. USA 1994, 91, 6795–6801. [Google Scholar] [CrossRef] [PubMed]
- Daniell, H.; Lin, C.S.; Yu, M.; Chang, W.J. Chloroplast genomes: Diversity, evolution, and applications in genetic engineering. Genome Biol. 2016, 17, 134. [Google Scholar] [CrossRef]
- Li, X.; Yang, Y.; Henry, R.J.; Rossetto, M.; Wang, Y.; Chen, S. Plant DNA barcoding: From gene to genome. Biol. Rev. Camb. Philos. Soc. 2015, 90, 157–166. [Google Scholar] [CrossRef] [PubMed]
- Song, Y.; Zhao, W.; Xu, J.; Li, M.; Zhang, Y. Chloroplast genome evolution and species identification of Styrax (Styracaceae). BioMed Res. Int. 2022, 2022, 5364094. [Google Scholar] [CrossRef] [PubMed]
- Tonti-Filippini, J.; Nevill, P.G.; Dixon, K.; Small, I. What can we do with 1000 plastid genomes? Plant J. 2017, 90, 808–818. [Google Scholar] [CrossRef] [PubMed]
- Lu, G.; Qiao, J.; Wang, L.; Liu, H.; Wu, G.; Zhu, Y.; Zhao, Y.; Xie, G.; Qin, M. An integrated study of Violae Herba (Viola philippica) and five adulterants by morphology, chemical compositions and chloroplast genomes: Insights into its certified plant origin. Chin. Med. 2022, 17, 32. [Google Scholar] [CrossRef] [PubMed]
- Feng, J.L.; Wu, L.W.; Wang, Q.; Pan, Y.J.; Li, B.L.; Lin, Y.L.; Yao, H. Comparison analysis based on complete chloroplast genomes and insights into plastid phylogenomic of four Iris species. BioMed Res. Int. 2022, 2022, 2194021. [Google Scholar] [CrossRef]
- Du, Y.P.; Bi, Y.; Yang, F.P.; Zhang, M.F.; Chen, X.Q.; Xue, J.; Zhang, X.H. Complete chloroplast genome sequences of Lilium: Insights into evolutionary dynamics and phylogenetic analyses. Sci. Rep. 2017, 7, 5751. [Google Scholar] [CrossRef] [PubMed]
- Neuhaus, H.E.; Emes, M.J. Nonphotosynthetic metabolism in plastids. Annu. Rev. Plant Physiol. Plant Mol. Biol. 2000, 51, 111–140. [Google Scholar] [CrossRef]
- Heide-Jørgensen, H.S. Parasitic Flowering Plants; Brill: Leiden, The Netherlands, 2008; pp. 1–438. [Google Scholar]
- Petersen, G.; Cuenca, A.; Seberg, O. Plastome evolution in hemiparasitic mistletoes. Genome Biol. Evol. 2015, 7, 2520–2532. [Google Scholar] [CrossRef]
- Nie, L.; Cui, Y.; Wu, L.; Zhou, J.; Xu, Z.; Li, Y.; Li, X.; Wang, Y.; Yao, H. Gene losses and variations in chloroplast genome of parasitic plant macrosolen and phylogenetic relationships within Santalales. Int. J. Mol. Sci. 2019, 20, 5812. [Google Scholar] [CrossRef]
- Cai, L.; Arnold, B.J.; Xi, Z.; Khost, D.E.; Patel, N.; Hartmann, C.B.; Manickam, S.; Sasirat, S.; Nikolov, L.A.; Mathews, S.; et al. Deeply altered genome architecture in the endoparasitic flowering plant Sapria himalayana Griff. (Rafflesiaceae). Curr. Biol. 2021, 31, 1002–1011. [Google Scholar] [CrossRef] [PubMed]
- Li, Y.H.; Ruan, J.L.; Chen, S.L.; Lv, D.; Zhu, K.X.; Zhao, M.H.; Pei, H.H. Study on Medicinal Plants of Loranthaceae Resources in China. Mod. Tradit. Chin. Med. Mater. Med. World Sci. Technol. 2009, 11, 665–669. [Google Scholar]
- The Editorial Committee of Flora of China. Flora of China; Science Press: Beijing, China; Missouri Botanical Garden Press: St. Louis, MO, USA, 2003; Volume 5. [Google Scholar]
- Shi, X. Research on Chinese Herbs which Have Diuresis Effect in Chinese Materia Medic. Master’s Thesis, Shandong University of Traditional Chinese Medicine, Jinan, China, 2013. [Google Scholar]
- Li, X.M. The Research on Cognition and Development of the Efficacy of Water-Disinhibiting Damp-Percolating Medicine on the Basis of Ancient and Modern Literature. Master’s Thesis, Nanjing University of Traditional Chinese Medicine, Nanjing, China, 2020. [Google Scholar]
- Mathiasen, R.L.; Nickrent, D.L.; Shaw, D.C.; Watson, D.M. Mistletoes: Pathology, systematics, ecology, and management. Plant Dis. 2008, 92, 988–1006. [Google Scholar] [CrossRef]
- Krasylenko, Y.; Tesitel, J.; Ceccantini, G.; Oliveira-da-Silva, M.; Dvorak, V.; Steele, D.; Sosnovsky, Y.; Piwowarczyk, R.; Watson, D.M.; Teixeira-Costa, L. Parasites on parasites: Hyper-, epi-, and autoparasitism among flowering plants. Am. J. Bot. 2021, 108, 8–21. [Google Scholar] [CrossRef]
- Wilson, C.A.; Calvin, C.L. Metadata provide insights on patterns of epiparasitism in mistletoes (Santalales), an overlooked topic in forest biology. Botany 2017, 95, 259–269. [Google Scholar] [CrossRef]
- Li, D.; Ding, Y. Geographical distribution of Phacellaria Benth. (Santalaceae) and its hosts. Front. Biol. China 2006, 1, 5–8. [Google Scholar] [CrossRef]
- Li, Y.; Zhou, J.G.; Chen, X.L.; Cui, Y.X.; Xu, Z.C.; Li, Y.H.; Song, J.Y.; Duan, B.Z.; Yao, H. Gene losses and partial deletion of small single-copy regions of the chloroplast genomes of two hemiparasitic Taxillus species. Sci. Rep. 2017, 7, 12834. [Google Scholar] [CrossRef] [PubMed]
- Su, H.J.; Liang, S.L.; Nickrent, D.L. Plastome variation and phylogeny of Taxillus (Loranthaceae). PLoS ONE 2021, 16, e0256345. [Google Scholar] [CrossRef] [PubMed]
- Guo, X.; Liu, C.; Wang, H.; Zhang, G.; Yan, H.; Jin, L.; Su, W.; Ji, Y. The complete plastomes of two flowering epiparasites (Phacellaria glomerata and P. compressa): Gene content, organization, and plastome degradation. Genomics 2021, 113, 447–455. [Google Scholar] [CrossRef] [PubMed]
- Bolger, A.M.; Lohse, M.; Usadel, B. Trimmomatic: A flexible trimmer for Illumina sequence data. Bioinformatics 2014, 30, 2114–2120. [Google Scholar] [CrossRef]
- Jin, J.J.; Yu, W.B.; Yang, J.B.; Song, Y.; de Pamphilis, C.W.; Yi, T.S.; Li, D.Z. GetOrganelle: A fast and versatile toolkit for accurate de novo assembly of organelle genomes. Genome Biol. 2020, 21, 241. [Google Scholar] [CrossRef] [PubMed]
- Dierckxsens, N.; Mardulyn, P.; Smits, G. NOVOPlasty: De novo assembly of organelle genomes from whole genome data. Nucleic Acids Res. 2017, 45, e18. [Google Scholar] [PubMed]
- Luo, R.; Liu, B.; Xie, Y.; Li, Z.; Huang, W.; Yuan, J.; He, G.; Chen, Y.; Pan, Q.; Liu, Y.; et al. SOAPdenovo2: An empirically improved memory-efficient short-read de novo assembler. Gigascience 2012, 1, 18. [Google Scholar] [CrossRef] [PubMed]
- Tillich, M.; Lehwark, P.; Pellizzer, T.; Ulbricht-Jones, E.S.; Fischer, A.; Bock, R.; Greiner, S. GeSeq—Versatile and accurate annotation of organelle genomes. Nucleic Acids Res. 2017, 45, W6–W11. [Google Scholar] [CrossRef] [PubMed]
- Shi, L.; Chen, H.; Jiang, M.; Wang, L.; Wu, X.; Huang, L.; Liu, C. CPGAVAS2, an integrated plastome sequence annotator and analyzer. Nucleic Acids Res. 2019, 47, W65–W73. [Google Scholar] [CrossRef] [PubMed]
- Schattner, P.; Brooks, A.N.; Lowe, T.M. The tRNAscan-SE, snoscan and snoGPS web servers for the detection of tRNAs and snoRNAs. Nucleic Acids Res. 2005, 33, W686–W689. [Google Scholar] [CrossRef]
- Liu, S.; Ni, Y.; Li, J.; Zhang, X.; Yang, H.; Chen, H.; Liu, C. CPGView: A package for visualizing detailed chloroplast genome structures. Mol. Ecol. Resour. 2023, 23, 694–704. [Google Scholar] [CrossRef]
- Lohse, M.; Drechsel, O.; Bock, R. OrganellarGenomeDRAW (OGDRAW): A tool for the easy generation of high-quality custom graphical maps of plastid and mitochondrial genomes. Curr. Genet. 2007, 52, 267–274. [Google Scholar] [CrossRef]
- Tamura, K.; Stecher, G.; Peterson, D.; Filipski, A.; Kumar, S. MEGA6: Molecular evolutionary genetics analysis version 6.0. Mol. Biol. Evol. 2013, 30, 2725–2729. [Google Scholar] [CrossRef]
- Sharp, P.M.; Li, W.H. The codon Adaptation Index—A measure of directional synonymous codon usage bias, and its potential applications. Nucleic Acids Res. 1987, 15, 1281–1295. [Google Scholar] [CrossRef]
- Kurtz, S.; Choudhuri, J.V.; Ohlebusch, E.; Schleiermacher, C.; Stoye, J.; Giegerich, R. REPuter: The manifold applications of repeat analysis on a genomic scale. Nucleic Acids Res. 2001, 29, 4633–4642. [Google Scholar] [CrossRef]
- Beier, S.; Thiel, T.; Münch, T.; Scholz, U.; Mascher, M. MISA-web: A web server for microsatellite prediction. Bioinformatics 2017, 33, 2583–2585. [Google Scholar] [CrossRef]
- Wu, L.; Cui, Y.; Wang, Q.; Xu, Z.; Wang, Y.; Lin, Y.; Song, J.; Yao, H. Identification and phylogenetic analysis of five Crataegus species (Rosaceae) based on complete chloroplast genomes. Planta 2021, 254, 14. [Google Scholar] [CrossRef]
- Minkin, I.; Patel, A.; Kolmogorov, M.; Vyahhi, N.; Pham, S. Sibelia: A Scalable and Comprehensive Synteny Block Generation Tool for Closely Related Microbial Genomes; Springer: Berlin/Heidelberg, Germany, 2013; pp. 215–229. [Google Scholar]
- Krzywinski, M.; Schein, J.; Birol, I.; Connors, J.; Gascoyne, R.; Horsman, D.; Jones, S.J.; Marra, M.A. Circos: An information aesthetic for comparative genomics. Genome Res. 2009, 19, 1639–1645. [Google Scholar] [CrossRef] [PubMed]
- Li, X.; Zhang, T.C.; Qiao, Q.; Ren, Z.; Zhao, J.; Yonezawa, T.; Hasegawa, M.; Crabbe, M.J.; Li, J.; Zhong, Y. Complete chloroplast genome sequence of holoparasite Cistanche deserticola (Orobanchaceae) reveals gene loss and horizontal gene transfer from its host Haloxylon ammodendron (Chenopodiaceae). PLoS ONE 2013, 8, e58747. [Google Scholar] [CrossRef] [PubMed]
- Frazer, K.A.; Pachter, L.; Poliakov, A.; Rubin, E.M.; Dubchak, I. VISTA: Computational tools for comparative genomics. Nucleic Acids Res. 2004, 32, W273–W279. [Google Scholar] [CrossRef] [PubMed]
- Librado, P.; Rozas, J. DnaSP v5: A software for comprehensive analysis of DNA polymorphism data. Bioinformatics 2009, 25, 1451–1452. [Google Scholar] [CrossRef] [PubMed]
- Katoh, K.; Standley, D.M. MAFFT multiple sequence alignment software version 7: Improvements in performance and usability. Mol. Biol. Evol. 2013, 30, 772–780. [Google Scholar] [CrossRef] [PubMed]
- Nguyen, L.T.; Schmidt, H.A.; von Haeseler, A.; Minh, B.Q. IQ-TREE: A fast and effective stochastic algorithm for estimating maximum-likelihood phylogenies. Mol. Biol. Evol. 2015, 32, 268–274. [Google Scholar] [CrossRef]
- Xu, J.; Feng, D.; Song, G.; Wei, X.; Chen, L.; Wu, X.; Li, X.; Zhu, Z. The first intron of rice EPSP synthase enhances expression of foreign gene. Sci. China. Ser. C Life Sci. 2003, 46, 561–569. [Google Scholar] [CrossRef] [PubMed]
- Kim, K.J.; Lee, H.L. Complete chloroplast genome sequences from Korean ginseng (Panax schinseng Nees) and comparative analysis of sequence evolution among 17 vascular plants. DNA Res. 2004, 11, 247–261. [Google Scholar] [CrossRef]
- Samigullin, T.H.; Logacheva, M.D.; Penin, A.A.; Vallejo-Roman, C.M. Complete plastid genome of the recent holoparasite Lathraea squamaria reveals earliest stages of plastome reduction in Orobanchaceae. PLoS ONE 2016, 11, e0150718. [Google Scholar] [CrossRef] [PubMed]
- Li, X.; Hu, Z.; Lin, X.; Li, Q.; Gao, H.; Luo, G.; Chen, S. High-throughput pyrosequencing of the complete chloroplast genome of Magnolia officinalis and its application in species identification. Acta Pharm. Sin. 2012, 47, 124–130. [Google Scholar]
- Bergthorsson, U.; Adams, K.L.; Thomason, B.; Palmer, J.D. Widespread horizontal transfer of mitochondrial genes in flowering plants. Nature 2003, 424, 197–201. [Google Scholar] [CrossRef]
- Davis, C.C.; Wurdack, K.J. Host-to-parasite gene transfer in flowering plants: Phylogenetic evidence from Malpighiales. Science 2004, 305, 676–678. [Google Scholar] [CrossRef] [PubMed]
- Davis, C.C.; Anderson, W.R.; Wurdack, K.J. Gene transfer from a parasitic flowering plant to a fern. Proc. Biol. Sci. 2005, 272, 2237–2242. [Google Scholar] [CrossRef] [PubMed]
- Mower, J.P.; Stefanović, S.; Young, G.J.; Palmer, J.D. Plant genetics: Gene transfer from parasitic to host plants. Nature 2004, 432, 165–166. [Google Scholar] [CrossRef]
- Park, J.M.; Manen, J.F.; Schneeweiss, G.M. Horizontal gene transfer of a plastid gene in the non-photosynthetic flowering plants Orobanche and Phelipanche (Orobanchaceae). Mol. Phylogenetics Evol. 2007, 43, 974–985. [Google Scholar] [CrossRef]
- Jia, J.; Xue, Q. Codon usage biases of transposable elements and host nuclear genes in Arabidopsis thaliana and Oryza sativa. Genom. Proteom. Bioinform. 2009, 7, 175–184. [Google Scholar] [CrossRef]
- Paul, P.; Malakar, A.K.; Chakraborty, S. Codon usage and amino acid usage influence genes expression level. Genetica 2018, 146, 53–63. [Google Scholar] [CrossRef]
- Hershberg, R.; Petrov, D.A. Selection on codon bias. Annu. Rev. Genet. 2008, 42, 287–299. [Google Scholar] [CrossRef] [PubMed]
- Leffler, E.M.; Bullaughey, K.; Matute, D.R.; Meyer, W.K.; Ségurel, L.; Venkat, A.; Andolfatto, P.; Przeworski, M. Revisiting an old riddle: What determines genetic diversity levels within species? PLoS Biol. 2012, 10, e1001388. [Google Scholar] [CrossRef]
- Wang, Y.; Zhan, D.F.; Jia, X.; Mei, W.L.; Dai, H.F.; Chen, X.T.; Peng, S.Q. Complete chloroplast genome sequence of Aquilaria sinensis (Lour.) gilg and evolution analysis within the Malvales order. Front. Plant Sci. 2016, 7, 280. [Google Scholar] [CrossRef]
- Zuo, L.H.; Shang, A.Q.; Zhang, S.; Yu, X.Y.; Ren, Y.C.; Yang, M.S.; Wang, J.M. The first complete chloroplast genome sequences of Ulmus species by de novo sequencing: Genome comparative and taxonomic position analysis. PLoS ONE 2017, 12, e0171264. [Google Scholar] [CrossRef]
- Zhao, Y.; Liu, Z.; Yang, P.; Cheng, Y.; Yang, Y. Codon bias analysis method and research progress on codon bias in Camellia sinensis. J. Tea Commun. 2016, 43, 3–7. [Google Scholar]
- Shang, M.; Liu, F.; Hua, J.; Wang, K. Analysis on codon usage of chloroplast genome of Gossypium hirsutum. Sci. Agric. Sin. 2011, 44, 245–253. [Google Scholar]
- Park, I.; Yang, S.; Choi, G.; Kim, W.J.; Moon, B.C. The complete chloroplast genome sequences of Aconitum pseudolaeve and Aconitum longecassidatum, and development of molecular markers for distinguishing species in the Aconitum Subgenus Lycoctonum. Molecules 2017, 22, 2012. [Google Scholar] [CrossRef] [PubMed]
- Powell, W.; Morgante, M.; McDevitt, R.; Vendramin, G.G.; Rafalski, J.A. Polymorphic simple sequence repeat regions in chloroplast genomes: Applications to the population genetics of pines. Proc. Natl. Acad. Sci. USA 1995, 92, 7759–7763. [Google Scholar] [CrossRef]
- Yang, A.H.; Zhang, J.J.; Yao, X.H.; Huang, H.W. Chloroplast microsatellite markers in Liriodendron tulipifera (Magnoliaceae) and cross-species amplification in L. chinense. Am. J. Bot. 2011, 98, e123–e126. [Google Scholar] [CrossRef] [PubMed]
- Jiao, Y.; Jia, H.M.; Li, X.W.; Chai, M.L.; Jia, H.J.; Chen, Z.; Wang, G.Y.; Chai, C.Y.; van de Weg, E.; Gao, Z.S. Development of simple sequence repeat (SSR) markers from a genome survey of Chinese bayberry (Myrica rubra). BMC Genom. 2012, 13, 201. [Google Scholar] [CrossRef]
- Xue, J.; Wang, S.; Zhou, S.L. Polymorphic chloroplast microsatellite loci in Nelumbo (Nelumbonaceae). Am. J. Bot. 2012, 99, e240–e244. [Google Scholar] [CrossRef]
- Kuang, D.Y.; Wu, H.; Wang, Y.L.; Gao, L.M.; Zhang, S.Z.; Lu, L. Complete chloroplast genome sequence of Magnolia kwangsiensis (Magnoliaceae): Implication for DNA barcoding and population genetics. Genome 2011, 54, 663–673. [Google Scholar] [CrossRef]
- Clarke, C.R.; Timko, M.P.; Yoder, J.I.; Axtell, M.J.; Westwood, J.H. Molecular Dialog Between Parasitic Plants and Their Hosts. Annu. Rev. Phytopathol. 2019, 57, 279–299. [Google Scholar] [CrossRef]
- Dong, W.; Liu, J.; Yu, J.; Wang, L.; Zhou, S. Highly variable chloroplast markers for evaluating plant phylogeny at low taxonomic levels and for DNA barcoding. PLoS ONE 2012, 7, e35071. [Google Scholar] [CrossRef] [PubMed]
- Zhang, Y.; Li, D. Advances in phylogenomics based on complete chloroplast genomes. Plant Divers. Resour. 2011, 33, 365–375. [Google Scholar]
- Liu, L.; Qiu, H. Pollen morphology of Loranthaceae in China. Guihaia 1993, 133, 235–245. [Google Scholar]
- The Editorial Committee of Flora Reipublicae Popularis Sinicae. Flora Reipublicae Popularis Sinicae; Science Press: Beijing, China, 1988; Volume 24. [Google Scholar]
- Gong, Z.; Wang, Y.; Liang, Q.; Wang, Z.; Xu, L.; Xu, G. A chemotaxonomic study of 27 species of the Loranthaceae plant from China. Guihaia 2004, 24, 493–496. [Google Scholar]
- Han, R.; Hao, G.; Zhang, D. Interfamilial relationships of Santalales as revealed by chloroplast trnL intron sequences. J. Trop. Subtrop. Bot. 2004, 12, 393–398. [Google Scholar]
Figure 1.
(A) Chloroplast genome map of Taxillus species, using T. chinensis as the template. (B) Chloroplast genome map of P. rigidula. The grey arrows indicate the direction of transcription of genes. Genes in the inner circle are transcribed in a clockwise direction, while those in the outer circle are transcribed counter-clockwise. The varying shades of gray in the inner circle indicate the distribution of GC and AT content, with darker shades corresponding to GC content and lighter shades corresponding to AT content.

Figure 2.
Homology analysis of the chloroplast genomes of P. rigidula and T. chinensis. The colored blocks and bands represent homologous regions.
Figure 2.
Homology analysis of the chloroplast genomes of P. rigidula and T. chinensis. The colored blocks and bands represent homologous regions.

Figure 3.
Heat map of RSCU values among Taxillus and Phacellaria species.

Figure 4.
Long repeats of the chloroplast genomes of Taxillus and Phacellaria species.

Figure 5.
Nucleotide diversity of shared various regions with Pi > 0 and length > 200 bp in 15 chloroplast genomes of Taxillus species. (a) Pi values in the genes regions. (b) Pi values in the intergenic spacers regions.
Figure 5.
Nucleotide diversity of shared various regions with Pi > 0 and length > 200 bp in 15 chloroplast genomes of Taxillus species. (a) Pi values in the genes regions. (b) Pi values in the intergenic spacers regions.

Figure 6.
Comparation of chloroplast genomes of 3 Phacellaria species. The x-axis denotes the positions in the chloroplast genome, while the y-axis indicates the average percentage of sequence similarity within the aligned regions, ranging from 50% to 100%.
Figure 6.
Comparation of chloroplast genomes of 3 Phacellaria species. The x-axis denotes the positions in the chloroplast genome, while the y-axis indicates the average percentage of sequence similarity within the aligned regions, ranging from 50% to 100%.

Figure 7.
ML phylogenetic tree of 50 Santalales species. Numbers at nodes are bootstrap support values.
Figure 7.
ML phylogenetic tree of 50 Santalales species. Numbers at nodes are bootstrap support values.


Table 1.
Codon usage of Taxillus and Phacellaria species.
| Species | GC3s | GC | CAI | ENc | Fop | Gravy | Aromo |
|---|---|---|---|---|---|---|---|
| T. chinensis | 0.268 | 0.37 | 0.165 | 49.75 | 0.351 | −0.152821 | 0.116124 |
| T. delavayi | 0.27 | 0.372 | 0.166 | 49.89 | 0.354 | −0.155567 | 0.114421 |
| T. levinei | 0.268 | 0.371 | 0.165 | 49.7 | 0.351 | −0.151184 | 0.114695 |
| T. liquidambaricola | 0.269 | 0.37 | 0.165 | 49.75 | 0.351 | −0.152355 | 0.114921 |
| T. lonicerifolius | 0.268 | 0.371 | 0.165 | 49.72 | 0.351 | −0.151446 | 0.114566 |
| T. matsudae | 0.268 | 0.37 | 0.165 | 49.72 | 0.352 | −0.153982 | 0.114106 |
| T. nigrans | 0.276 | 0.379 | 0.166 | 50.10 | 0.354 | −0.133505 | 0.113285 |
| T. pseudochinensis | 0.269 | 0.37 | 0.165 | 49.80 | 0.351 | −0.151886 | 0.115412 |
| T. rhododendricola | 0.269 | 0.37 | 0.166 | 49.78 | 0.351 | −0.15293 | 0.115557 |
| T. sutchuenensis | 0.275 | 0.379 | 0.166 | 50.13 | 0.354 | −0.128203 | 0.113377 |
| T. theifer | 0.267 | 0.37 | 0.166 | 49.65 | 0.351 | −0.161496 | 0.115448 |
| T. thibetensis | 0.266 | 0.368 | 0.166 | 49.57 | 0.352 | −0.153661 | 0.115179 |
| T. tsaii | 0.269 | 0.37 | 0.165 | 49.79 | 0.351 | −0.150685 | 0.115575 |
| T. vestitus | 0.269 | 0.371 | 0.166 | 49.84 | 0.352 | −0.158731 | 0.114805 |
| T. yadoriki | 0.268 | 0.37 | 0.165 | 49.66 | 0.351 | −0.151572 | 0.114484 |
| P. compressa | 0.272 | 0.381 | 0.169 | 50.00 | 0.356 | −0.190492 | 0.109123 |
| P. glomerata | 0.273 | 0.381 | 0.169 | 50.02 | 0.356 | −0.192315 | 0.108927 |
| P. rigidula | 0.272 | 0.381 | 0.169 | 50.01 | 0.356 | −0.202924 | 0.108829 |
Disclaimer/Publisher’s Note: The statements, opinions and data contained in all publications are solely those of the individual author(s) and contributor(s) and not of MDPI and/or the editor(s). MDPI and/or the editor(s) disclaim responsibility for any injury to people or property resulting from any ideas, methods, instructions or products referred to in the content. |
© 2023 by the authors. Licensee MDPI, Basel, Switzerland. This article is an open access article distributed under the terms and conditions of the Creative Commons Attribution (CC BY) license (https://creativecommons.org/licenses/by/4.0/).
Share and Cite
MDPI and ACS Style
Wu, L.; Fan, P.; Zhou, J.; Li, Y.; Xu, Z.; Lin, Y.; Wang, Y.; Song, J.; Yao, H. Gene Losses and Homology of the Chloroplast Genomes of Taxillus and Phacellaria Species. Genes 2023, 14, 943. https://doi.org/10.3390/genes14040943
AMA Style
Wu L, Fan P, Zhou J, Li Y, Xu Z, Lin Y, Wang Y, Song J, Yao H. Gene Losses and Homology of the Chloroplast Genomes of Taxillus and Phacellaria Species. Genes. 2023; 14(4):943. https://doi.org/10.3390/genes14040943
Chicago/Turabian StyleWu, Liwei, Panhui Fan, Jianguo Zhou, Yonghua Li, Zhichao Xu, Yulin Lin, Yu Wang, Jingyuan Song, and Hui Yao. 2023. "Gene Losses and Homology of the Chloroplast Genomes of Taxillus and Phacellaria Species" Genes 14, no. 4: 943. https://doi.org/10.3390/genes14040943
Note that from the first issue of 2016, this journal uses article numbers instead of page numbers. See further details here.