Article

Genome-Wide Identification and Gene Expression Analysis of Sweet Cherry Aquaporins (Prunus avium L.) under Abiotic Stresses

Centro de Estudios Avanzados en Fruticultura (CEAF), Camino Las Parcelas 882, km 105 Ruta 5 Sur, Sector Los Choapinos, Rengo 2940000, Chile
*
Author to whom correspondence should be addressed.
These authors contributed equally to this work.
Genes 2023, 14(4), 940; https://doi.org/10.3390/genes14040940
Submission received: 1 April 2023 / Revised: 13 April 2023 / Accepted: 14 April 2023 / Published: 19 April 2023
(This article belongs to the Special Issue Genome-Wide Identifications: Recent Trends in Genomic Studies)

Abstract

:
Aquaporins (AQPs) are integral transmembrane proteins well known as channels involved in the mobilization of water, small uncharged molecules and gases. In this work, the main objective was to carry out a comprehensive study of AQP encoding genes in Prunus avium (cv. Mazzard F12/1) on a genome-wide scale and describe their transcriptional behaviors in organs and in response to different abiotic stresses. A total of 28 non-redundant AQP genes were identified in Prunus spp. Genomes, which were phylogenetically grouped into five subfamilies (seven PIPs, eight NIPs, eight TIPs, three SIPs and two XIPs). Bioinformatic analyses revealed a high synteny and remarkable conservation of structural features among orthologs of different Prunus genomes. Several cis-acting regulatory elements (CREs) related to stress regulation were detected (ARE, WRE3, WUN, STRE, LTR, MBS, DRE, AT-rich and TC-rich). The above could be accounting for the expression variations associated with plant organs and, especially, each abiotic stress analyzed. Gene expressions of different PruavAQPs were shown to be preferentially associated with different stresses. PruavXIP2;1 and PruavXIP1;1 were up-regulated in roots at 6 h and 72 h of hypoxia, and in PruavXIP2;1 a slight induction of expression was also detected in leaves. Drought treatment strongly down-regulated PruavTIP4;1 but only in roots. Salt stress exhibited little or no variation in roots, except for PruavNIP4;1 and PruavNIP7;1, which showed remarkable gene repression and induction, respectively. Interestingly, PruavNIP4;1, the AQP most expressed in cherry roots subjected to cold temperatures, also showed this pattern in roots under high salinity. Similarly, PruavNIP4;2 consistently was up-regulated at 72 h of heat and drought treatments. From our evidence is possible to propose candidate genes for the development of molecular markers for selection processes in breeding programs for rootstocks and/or varieties of cherry.

1. Introduction

Aquaporins (AQPs) are integral transmembrane proteins that belong to the major intrinsic protein (MIP) superfamily. The first AQP was discovered in 1992 in humans, and called CHIP [1], and, since then, many members of this superfamily have been found in almost all living organisms. They are involved in transmembrane transport, facilitating the movement of water, small uncharged solutes and gases [2,3,4,5]. To date, five subfamilies had been identified in higher plants: plasma membrane intrinsic protein (PIP), tonoplast intrinsic protein (TIP), nodulin 26-like intrinsic protein (NIP), small basic intrinsic protein (SIP) and uncategorized X intrinsic protein (XIP) [3]. They assemble in tetramers, with each monomer acting as an independent channel [6].
Despite the large number of AQPs in nature, they all present a highly conserved “hourglass” shape and share some structural features such as six transmembrane helices, which are connected by five loops, named loop A, B, C, D and E. The NPA motif, named by asparagine, proline and alanine residues that are present in loop B and E inside the channel, assembles two half-helices, which constitute a seventh “pseudo-helix” transmembrane domain, creating an electrostatic repulsion of protons and a size barrier [7]. Another important conserved motif, called aromatic/arginine (ar/R), is a substrate selectivity filter, constituted of four residues and forming a narrow region inside the channel. Using statistical analysis of amino acid sequences of AQPs that transport glycerol, also called aquaglyceroporins (GLPs), five highly conserved residues were identified and determined as Froger’s positions (P1–P5) [8]. In addition, through a deep and comprehensive analysis of functionally characterized AQPs, nine amino acids called specificity-determining positions (SDPs) were identified for non-aqua substrates [9].
It has been shown that aquaporins can transport water and other uncharged solutes such as glycerol, urea, boric acid, silicic acid, hydrogen peroxide, ammonia, lactic acid and carbon dioxide [2,3,4,10]. Due to these important characteristics, aquaporins have been identified as key players in many processes in plants, among them cell elongation, pollen and seed germination, osmoregulation, stomatal and leaf movement, cytoplasmic homeostasis, and stress response [11,12,13,14,15]. Therefore, aquaporins are highly regulated during their development in a cell-specific manner by hormones and environmental signals [2]. Due to their relevance at the cellular and whole plant level, it is relevant to know the effect of different biotic stresses such as root hypoxia, salinity, high and lower temperatures expositions and drought on the aquaporin gene expression profiles to go ahead in the knowledge of how plants can adapt to adverse environmental conditions.
Climate change has affected agricultural production worldwide, with detrimental impacts on a huge number of crops. In the Prunus genus there are fruit species of commercial interest such cherry, peach, almond, plum and apricot. In commercial orchards of cherries, peaches and other stone fruits, scions of commercial varieties are grafted onto rootstocks, which can be obtained from the same or other Prunus species [16]. Rootstocks can confer tolerance to different abiotic stresses, improving the performance and yield of the scion [17,18].
Sweet cherry (P. avium L.) is an economically important crop that includes cherry trees cultivated for human consumption and wild cherry trees used for their wood, also called mazzards [19,20]. Its first available genome was published in 2017 by Shirasawa et al. [21], covering 77% of the total genome size, and generating new information for data mining, the construction of high-density linkage maps between sweet cherry and peach [22], genomic comparisons among Rosaceae species [23] and fruit ripening gene identification [24]. Recently, a high-quality genome assembly of P. avium L. was published [25], providing a good resource for further genetic and genomic studies. In this context, through a deep genome-wide analysis of P. avium L.; we present an approach that includes analyses of gene structure, sequence, amino acidic and conserved motifs, and gene expression profiles in different tissues and under several abiotic stresses on the cherry rootstock ‘Mazzard F12/1’, to deepen the understanding about the aquaporin gene family and its stress adaptive response in a woody fruit tree species, such as cherry.

2. Materials and Methods

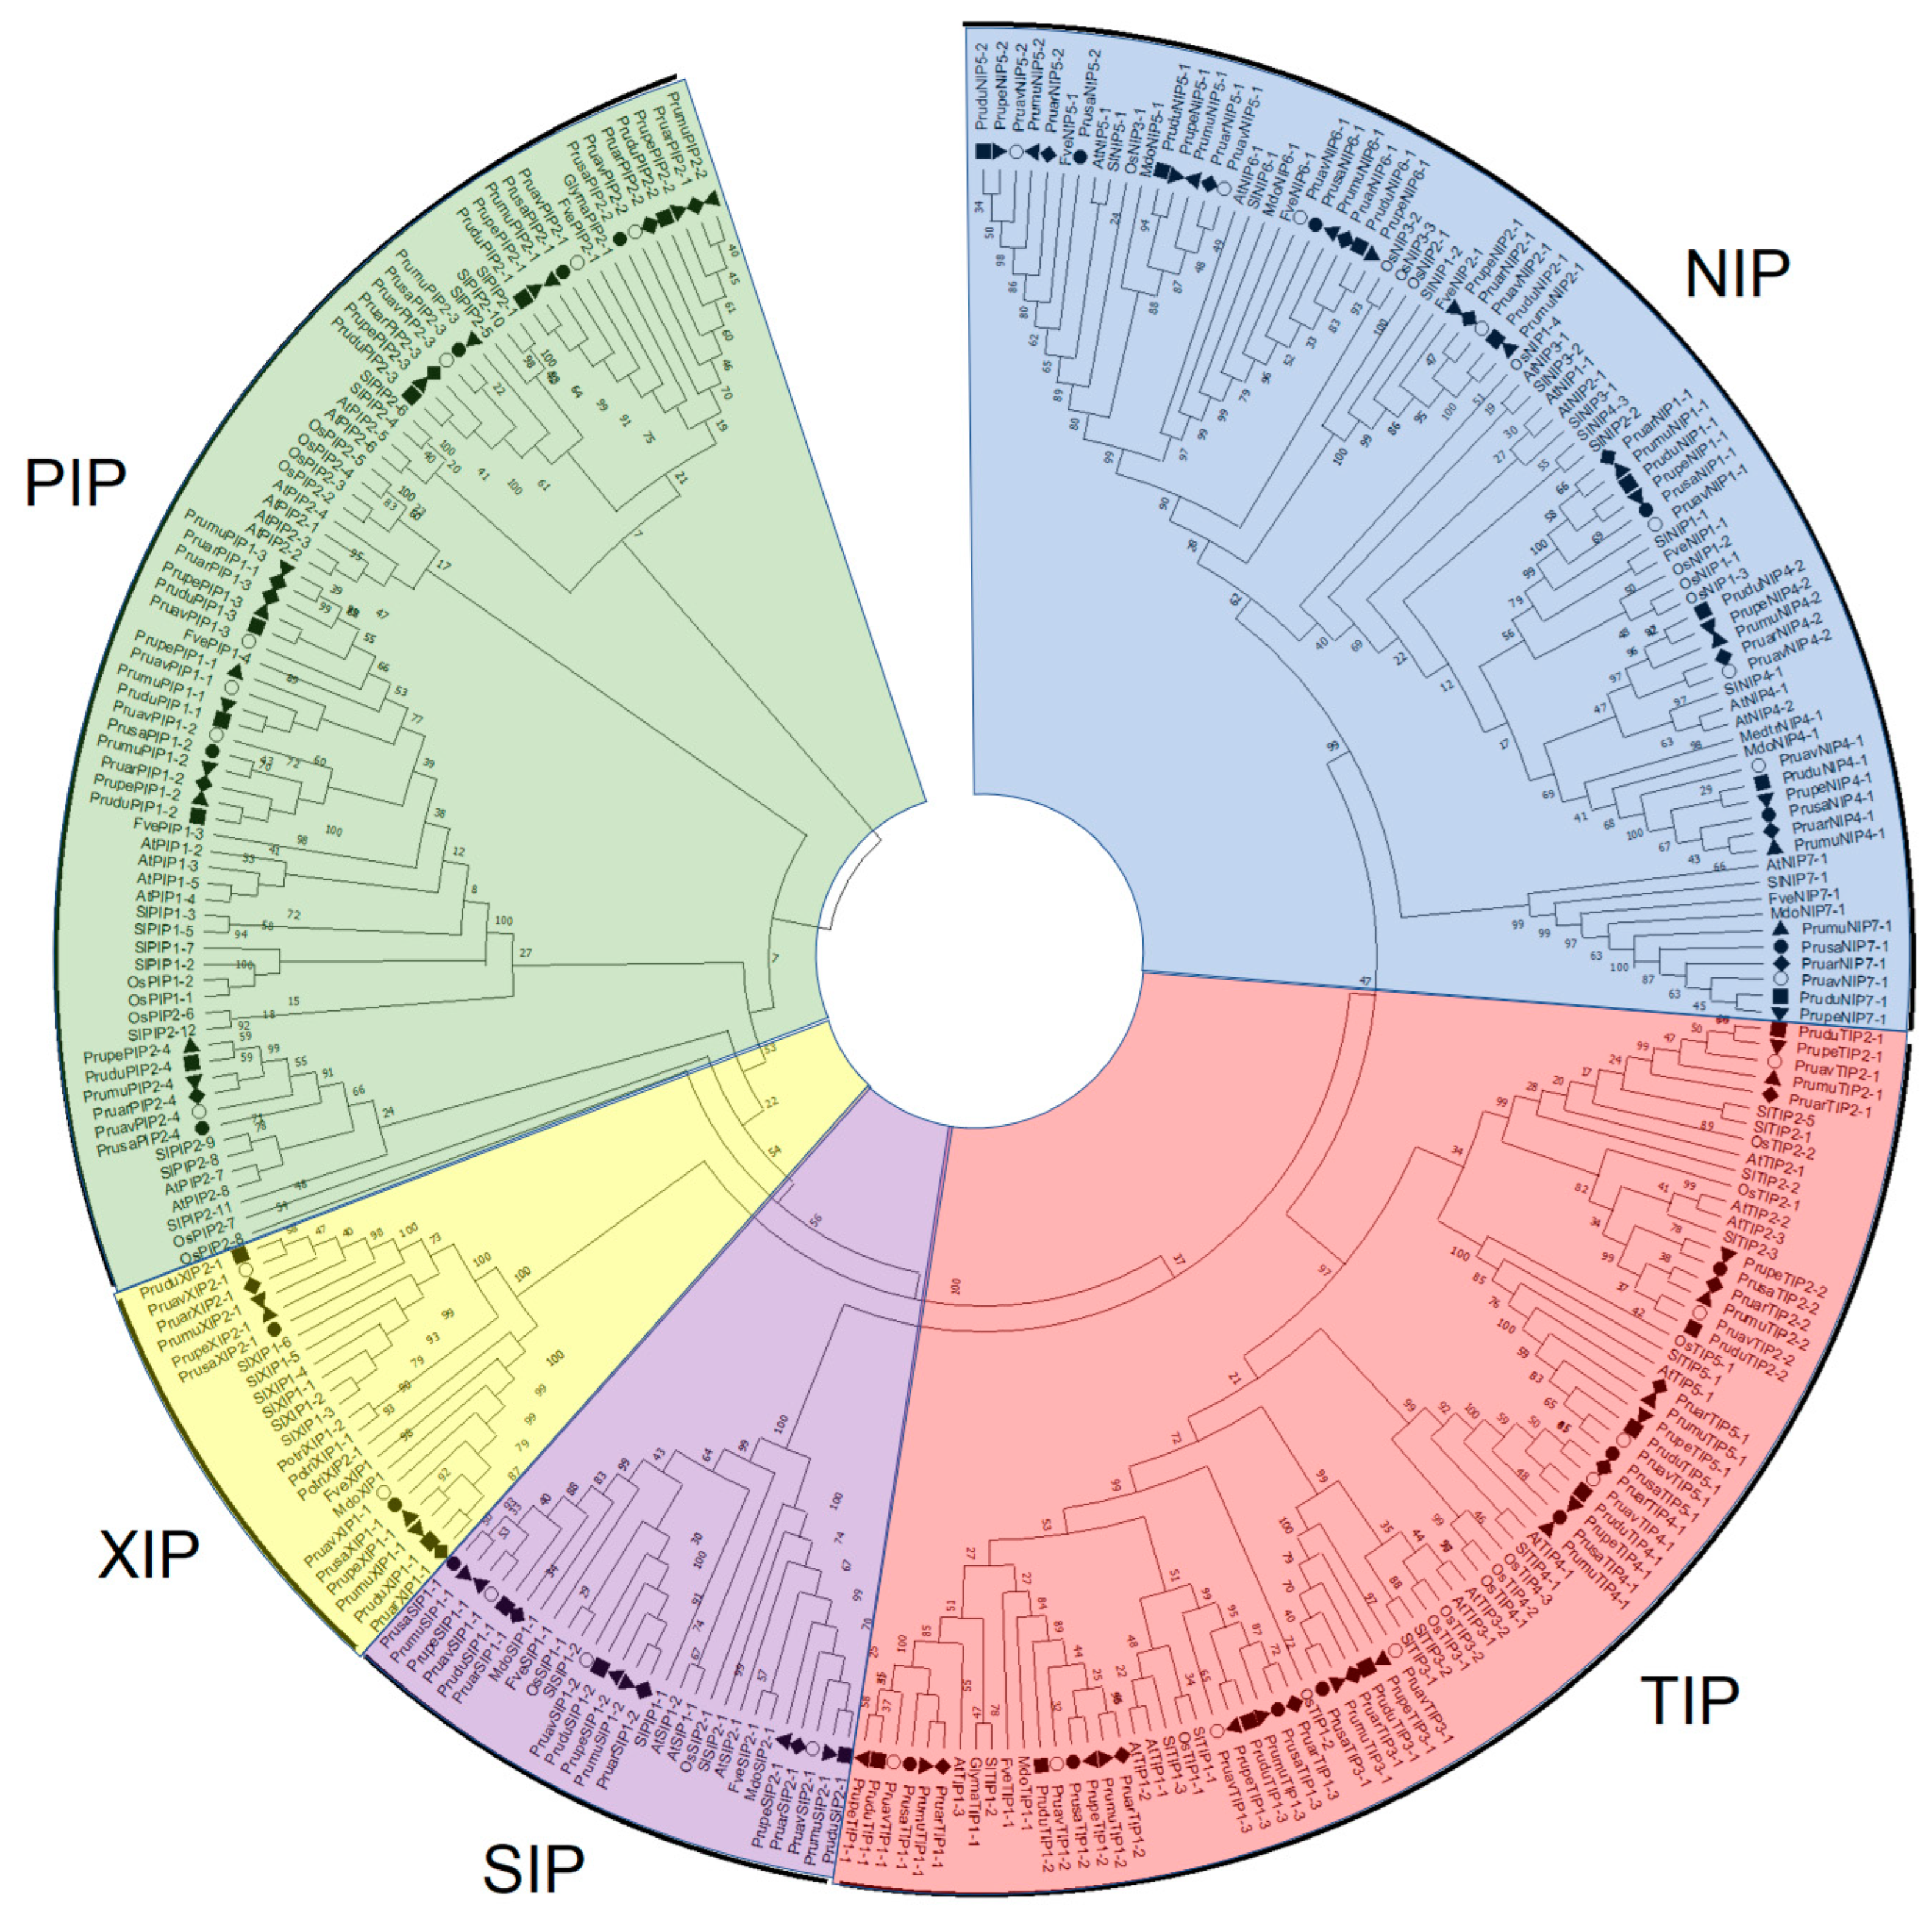
2.1. Identification of Aquaporin Genes and Phylogenetic Analysis

The complete aquaporin family from P. avium L. was retrieved by data mining the genome assembly belonging to the ‘Tieton’ cultivar (Genbank accession GCA_014155035.1) available at NCBI, using the complete aquaporin family from Prunus persica as queries to perform local blastn to identify all the aquaporins. The aquaporins from P. persica were obtained by searching the major intrinsic protein domain “PF00230” (http://pfam.xfam.org/family/pf00230) in Phytozome V12.1. The aquaporins of Prunus armeniaca, Prunus dulcis, Prunus salicina and Prunus mume (GCA_903112645.1, GCA_902201215.1, GCA_000346735.1 and GCA_014155035.1 Genbank accession numbers, respectively) were also used for synteny analysis purposes. A phylogenetic tree was constructed using the deduced amino acid sequences as input in MEGA 11 software [26] using the maximum likelihood method with 1000 bootstrap.

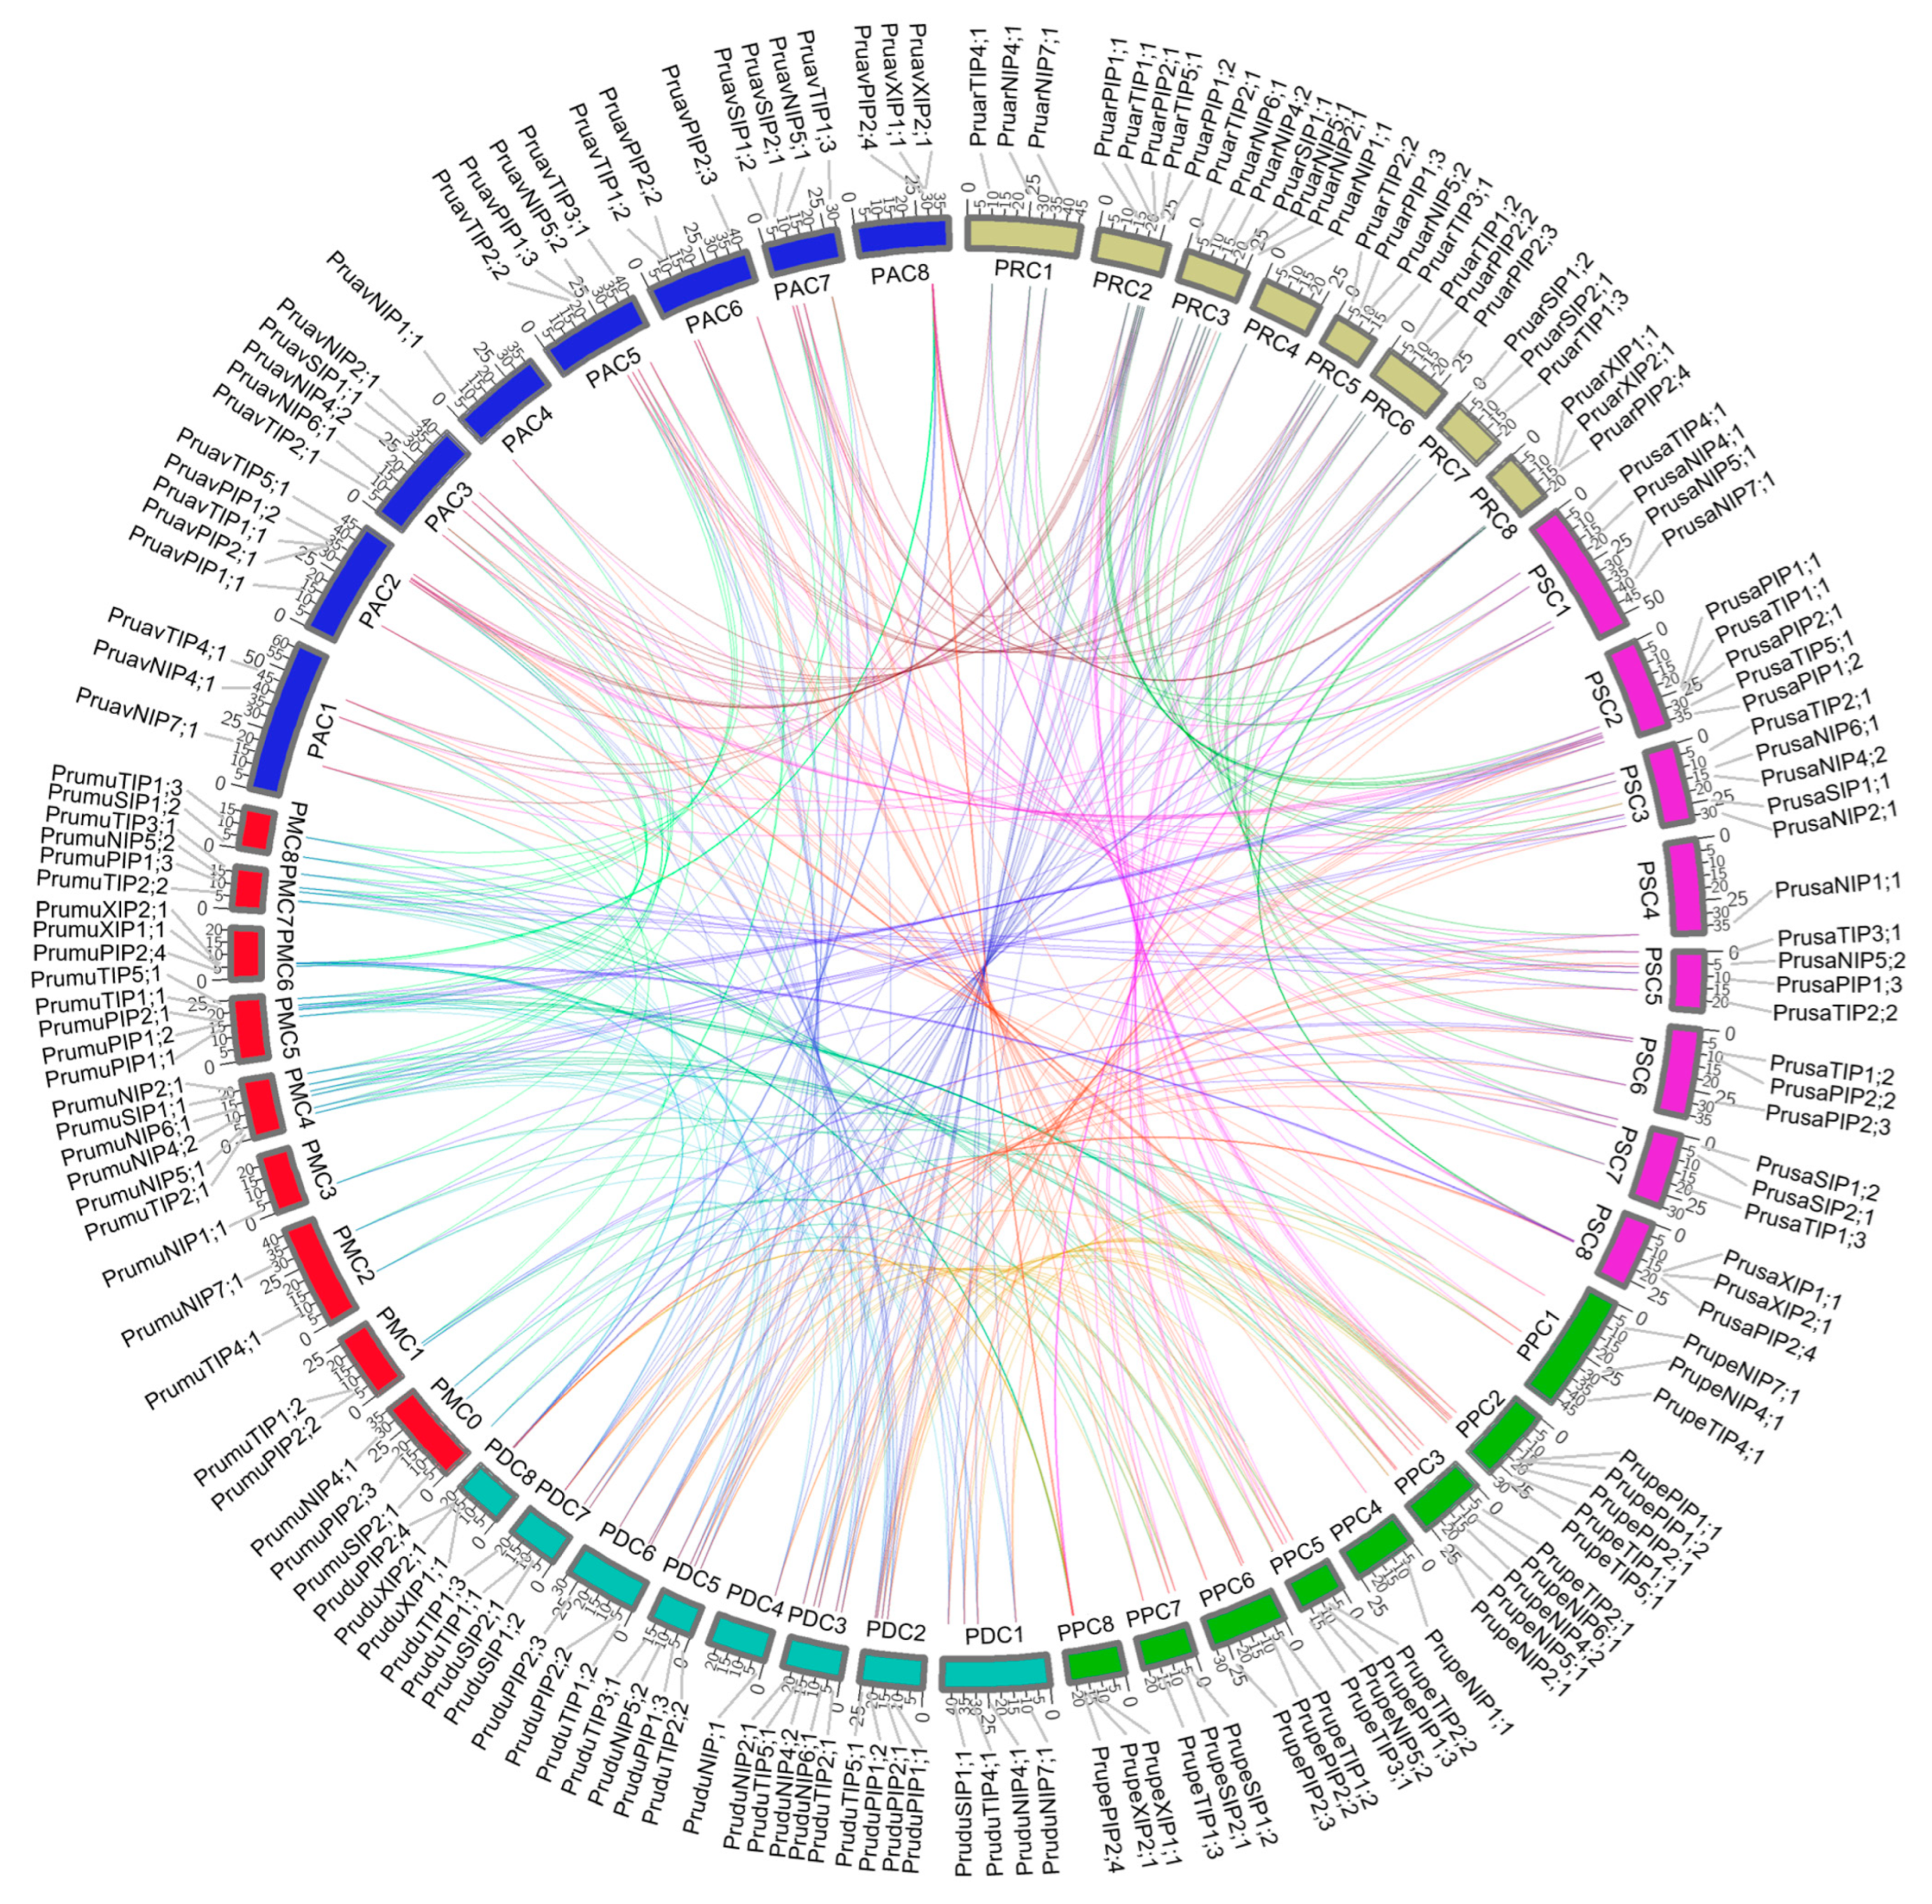
2.2. Microsynteny Relationships of Four Prunus Species

A microsynteny map was built using the clicO FS tool (http://clicofs.codoncloud.com/) using orthologous genes of aquaporin from P. avium, P. armeniaca, P. dulcis, P. mume, P. persica and P. salicina.

2.3. Cis-Acting Regulatory Element Analysis

The 2000 bp genomic sequences upstream of the ATG of the aquaporin genes were downloaded and analyzed by PlantCARE (http://bioinformatics.psb.ugent.be/webtools/plantcare/html/) for cis-acting regulatory elements identification. The TBtools software was used for image visualization [27].

2.4. Gene Structure, Characteristic Motif, Physicochemical Features, In Silico Prediction of Transmembrane Domains and Subcellular Localization

The gene structure for each aquaporin was determined using the Gene Structure Display Server (http://gsds.gao-lab.org/). Multiple sequence alignment was performed using the MUSCLE tool [28] to determine the conserved residues of NPA, ar/R selectivity filter [29,30,31], Froger’s residues [8] and specificity-determining positions (SPD) [9]. Physicochemical characteristics were performed using ProtParam (http://web.expasy.org/protparam/). Prediction of subcellular localization was performed using Wolf PSORT [32] and Plant-mPLoc [33] with default parameters. The nonsynonymous (Ka) to synonymous (Ks) substitution rates were determined using the Ka/Ks tool (http://services.cbu.uib.no/tools/kaks). The grand average of hydropathy was predicted using the Protein GRAVY tool from the Sequence Manipulation Suite (http://www.bioinformatics.org/sms2/protein_gravy.html).

2.5. Abiotic Stress Treatments

One-year-old P. avium plants were used in the abiotic stress treatment. A set of 18 P. avium plants were individually placed inside of 1 L containers with a mix of peat moss:sand (2:1) as substrate and maintained in a growth chamber at 28 °C, 50% relative humidity, a photoperiod of 16/8 day/night and 150 μmol m−2 s−1 of incident photosynthetically photon flux density (PPFD). All the plants were maintained in these conditions during the treatments with an exception for cold and heat stress. Subsets of three plants were used for each treatment. For root hypoxia treatment, plastic containers were filled with water to approximately 4 cm above the pot substrate level, according to Pimentel et al., 2014 [34]. For salt treatment, plants were watered three times per week with a solution of 120 mM NaCl, according to Toro et al., 2021 [35]. For cold treatment, plants were exposed to 4 °C for 72 h. For heat treatment, plants were exposed to 40 °C for 72 h. Drought stress treatment was achieved by progressive substrate drying by applying irrigation with a volume of water equivalent to 90% of the weight of the substrate recorded the previous day until the early appearance of epinasty, which marked the reference point for the start of this treatment. For each abiotic treatment, roots and leaves were harvested at 6 and 72 h, immediately frozen in liquid nitrogen and stored at −80 °C for aquaporin gene expression.

2.6. RNA Extraction and Transcript Analysis by qRT-PCR

Three independent total RNA samples of individual plants were isolated for PruavAQPs expression analysis in different organs (roots, stems, leaves and flowers) and for expression analysis under abiotic stress treatments (roots and leaves) by using the CTAB method with minor modifications [36]. For total RNA extraction, 5 g of root or leaf tissue was used and the chloroform:isoamyl alcohol step was repeated three or more times depending of each sample. RNA quantity and quality were determined based on A260/280 and A260/230 wavelength ratios using an Infinite 200 PRO NanoQuant Spectrophotometer (Tecan, Männedorf, Switzerland). RNA integrity was confirmed on a 2% agarose gel and RedSafe staining. DNAse I (Ambion, Austin, TX, USA) was used to remove genomic DNA contamination. From each biological replicate, 2 mg of total RNA was used as a template for first-strand cDNA synthesis using the Maxima First Strand cDNA Synthesis kit (Thermo Scientific, Waltham, MA, USA). The cDNA was diluted 1:4, and 2 mL of the dilution was amplified by qRT-PCR, using isoform-specific primers designed with Primer Premier software 5.0 (Premier Biosoft International, Palo Alto, Santa Clara, CA, USA). The Mx3000 P qPCR System (Agilent Technologies, Santa Clara, CA, USA) and Maxima SYBR Green/ROX qPCR Master Mix (Thermo Scientific, Waltham, MA, USA) were used as per the manufacturers’ instructions. Each biological replicate was analyzed in duplicate. The specificity of the amplification products was confirmed by the registration of a single peak in melting curves. Each biological sample (three) contained two technical replicates. The Prunus RNA polymerase II (Prupe.8 G132000.1) was used to normalize the raw data and calculate relative expression levels [37]. The baseline (0 h) control treatment was used as the calibrator sample in the abiotic stress experiment. Normalized Ct values were used for determining gene expression, according to Pfaffl, 2001 [38]. The primers used in this study are listed in Table S1.

3. Results

3.1. Identification and Analysis of Aquaporin Genes in P. avium

In a previous study, the complete aquaporin family of P. persica were identified, with a total of 29 putative genes [39]. All those sequences were obtained using the first version of the P. persica genome, and most of them are incomplete. A search by PF00230 in Phytozome resulted in 29 genes in total, with full length sequences. The gene with code Prupe.3G009400, was discarded since it lacks one of the NPA motifs, resulting in 28 putative aquaporin genes in P. persica. These sequences were used as queries to search for aquaporins in the latest genome of P. avium available at NCBI, which resulted in 28 putative aquaporin genes. The same procedure was also used for identifying all aquaporins in P. armeniaca, P. dulcis and P. mume genomes, which resulted in the same 28 aquaporin genes in every species. These genes were unevenly distributed in almost all P. avium chromosomes (PAC). PAC1 contained three aquaporins, i.e., two NIPs (PruavNIP4;1 and PruavNIP7;1) and one TIP (PruavTIP4;1), and PAC2 contained three PIPs (PruavPIP1;1, PruavPIP1;2 and PruavPIP2;1) and two TIPs (PruavTIP1;1 and PruavTIP5;1). PAC3 contained three NIPs (PruavNIP2;1, PruavNIP4;2 and PruavNIP6;1), one TIP (PruavTIP2;1) and one SIP (PruavSIP1;1). PAC4 contained only PruavNIP1;1. PAC5 contained one member of NIP (PruavNIP5;2), one PIP (PruavPIP1;3) and two TIPs (PruavTIP2;2 and PruavTIP3;1). PAC6 contained two members of the PIP subfamily (PruavPIP2;2 and PruavPIP2;3) and one member of TIP (PruavTIP1;2). PAC7 contained one TIP (PruavTIP1;3), one NIP (PruavNIP5;1) and two SIPs (PruavSIP1;2 and PruavSIP2;1). PAC8 contained one PIP (PruavPIP2;4) and two XIPs (PruavXIP1;1 and PruavXIP2;1). As expected, these showed a high synteny with the other Prunus species, since most aquaporins were in the same chromosome number. The differences were found in the gene coding for NIP5;1 that was found on chromosome 3 in P. armeniaca, P. persica and P. dulcis. In addition, the gene coding for SIP1;1 was found on chromosome 1 in P. dulcis. The nomenclature used in our aquaporin names was based on the Arabidopsis thaliana aquaporin analysis [40], phylogenetic trees and chromosome location, maintaining a numerical order.
Compared with P. mume, all aquaporins showed different positions, but with similar distribution in all subfamilies (Figure 1). In addition, comparing the number of identified aquaporins in P. avium with other plant species, it was inferior to A. thaliana with 35 aquaporins [40], Zea mays with 43 aquaporins [39], Oryza sativa with 34 putative aquaporins [41], Fragaria vesca with 39 putative aquaporins [39] and Populus trichocarpa with 58 putative aquaporins [42].
Using the translated CDS of all genes, and using the peptide sequence of other plant aquaporins, a clustering algorithm was performed to determine the aquaporin subfamilies and the distribution of their members (Figure 2). The genome of P. avium contained members of five subfamilies of aquaporins identified in higher plants. In addition, while the NIP subfamily contained eight members, seven members were identified in the PIP subfamily, eight members in the TIP subfamily, three members in the SIP subfamily and only two XIP aquaporins (Figure 2).
P. avium aquaporins ranged from 236 to 314 amino acids in length, containing both classic NPA motifs, with a variation in the alanine position with S-T-L-V residues in NPA I and I-V in NPA II. PruavXIP1;1 was the only aquaporin with different NPA I and II motifs, consisting in SLV and SPA, respectively. In the case of the ar/R selectivity filter motif, the arginine residue was conserved in all members of the NIP, PIP and XIP subfamilies. Members from the SIP subfamily contained N-S residues and TIP members contained C-R-V amino acids instead. The Froger’s residues showed a higher conservation of amino acids for each subfamily; moreover, in the third position, the alanine was conserved in all aquaporins. On the other hand, almost all members were predicted to be localized at the plasma membrane, with 4 to 7 transmembrane domains and a molecular weight ranging from 25.08 to 33.85 kDa, isoelectric points from 4.78 to 9.75 and the Ka/Ks ratio less than 1.00 in all subfamilies. This latter would indicate that a stabilizing selection was maintaining the function of the aquaporin genes in P. avium. The GRAVY analysis showed positive values for all subfamilies, pointing out a hydrophobic nature of the aquaporins. Here, the members of the PIP subfamily averaged the lowest value, with 0.383, and the members of TIP subfamily with the highest value of 0.803, on average (Table 1).

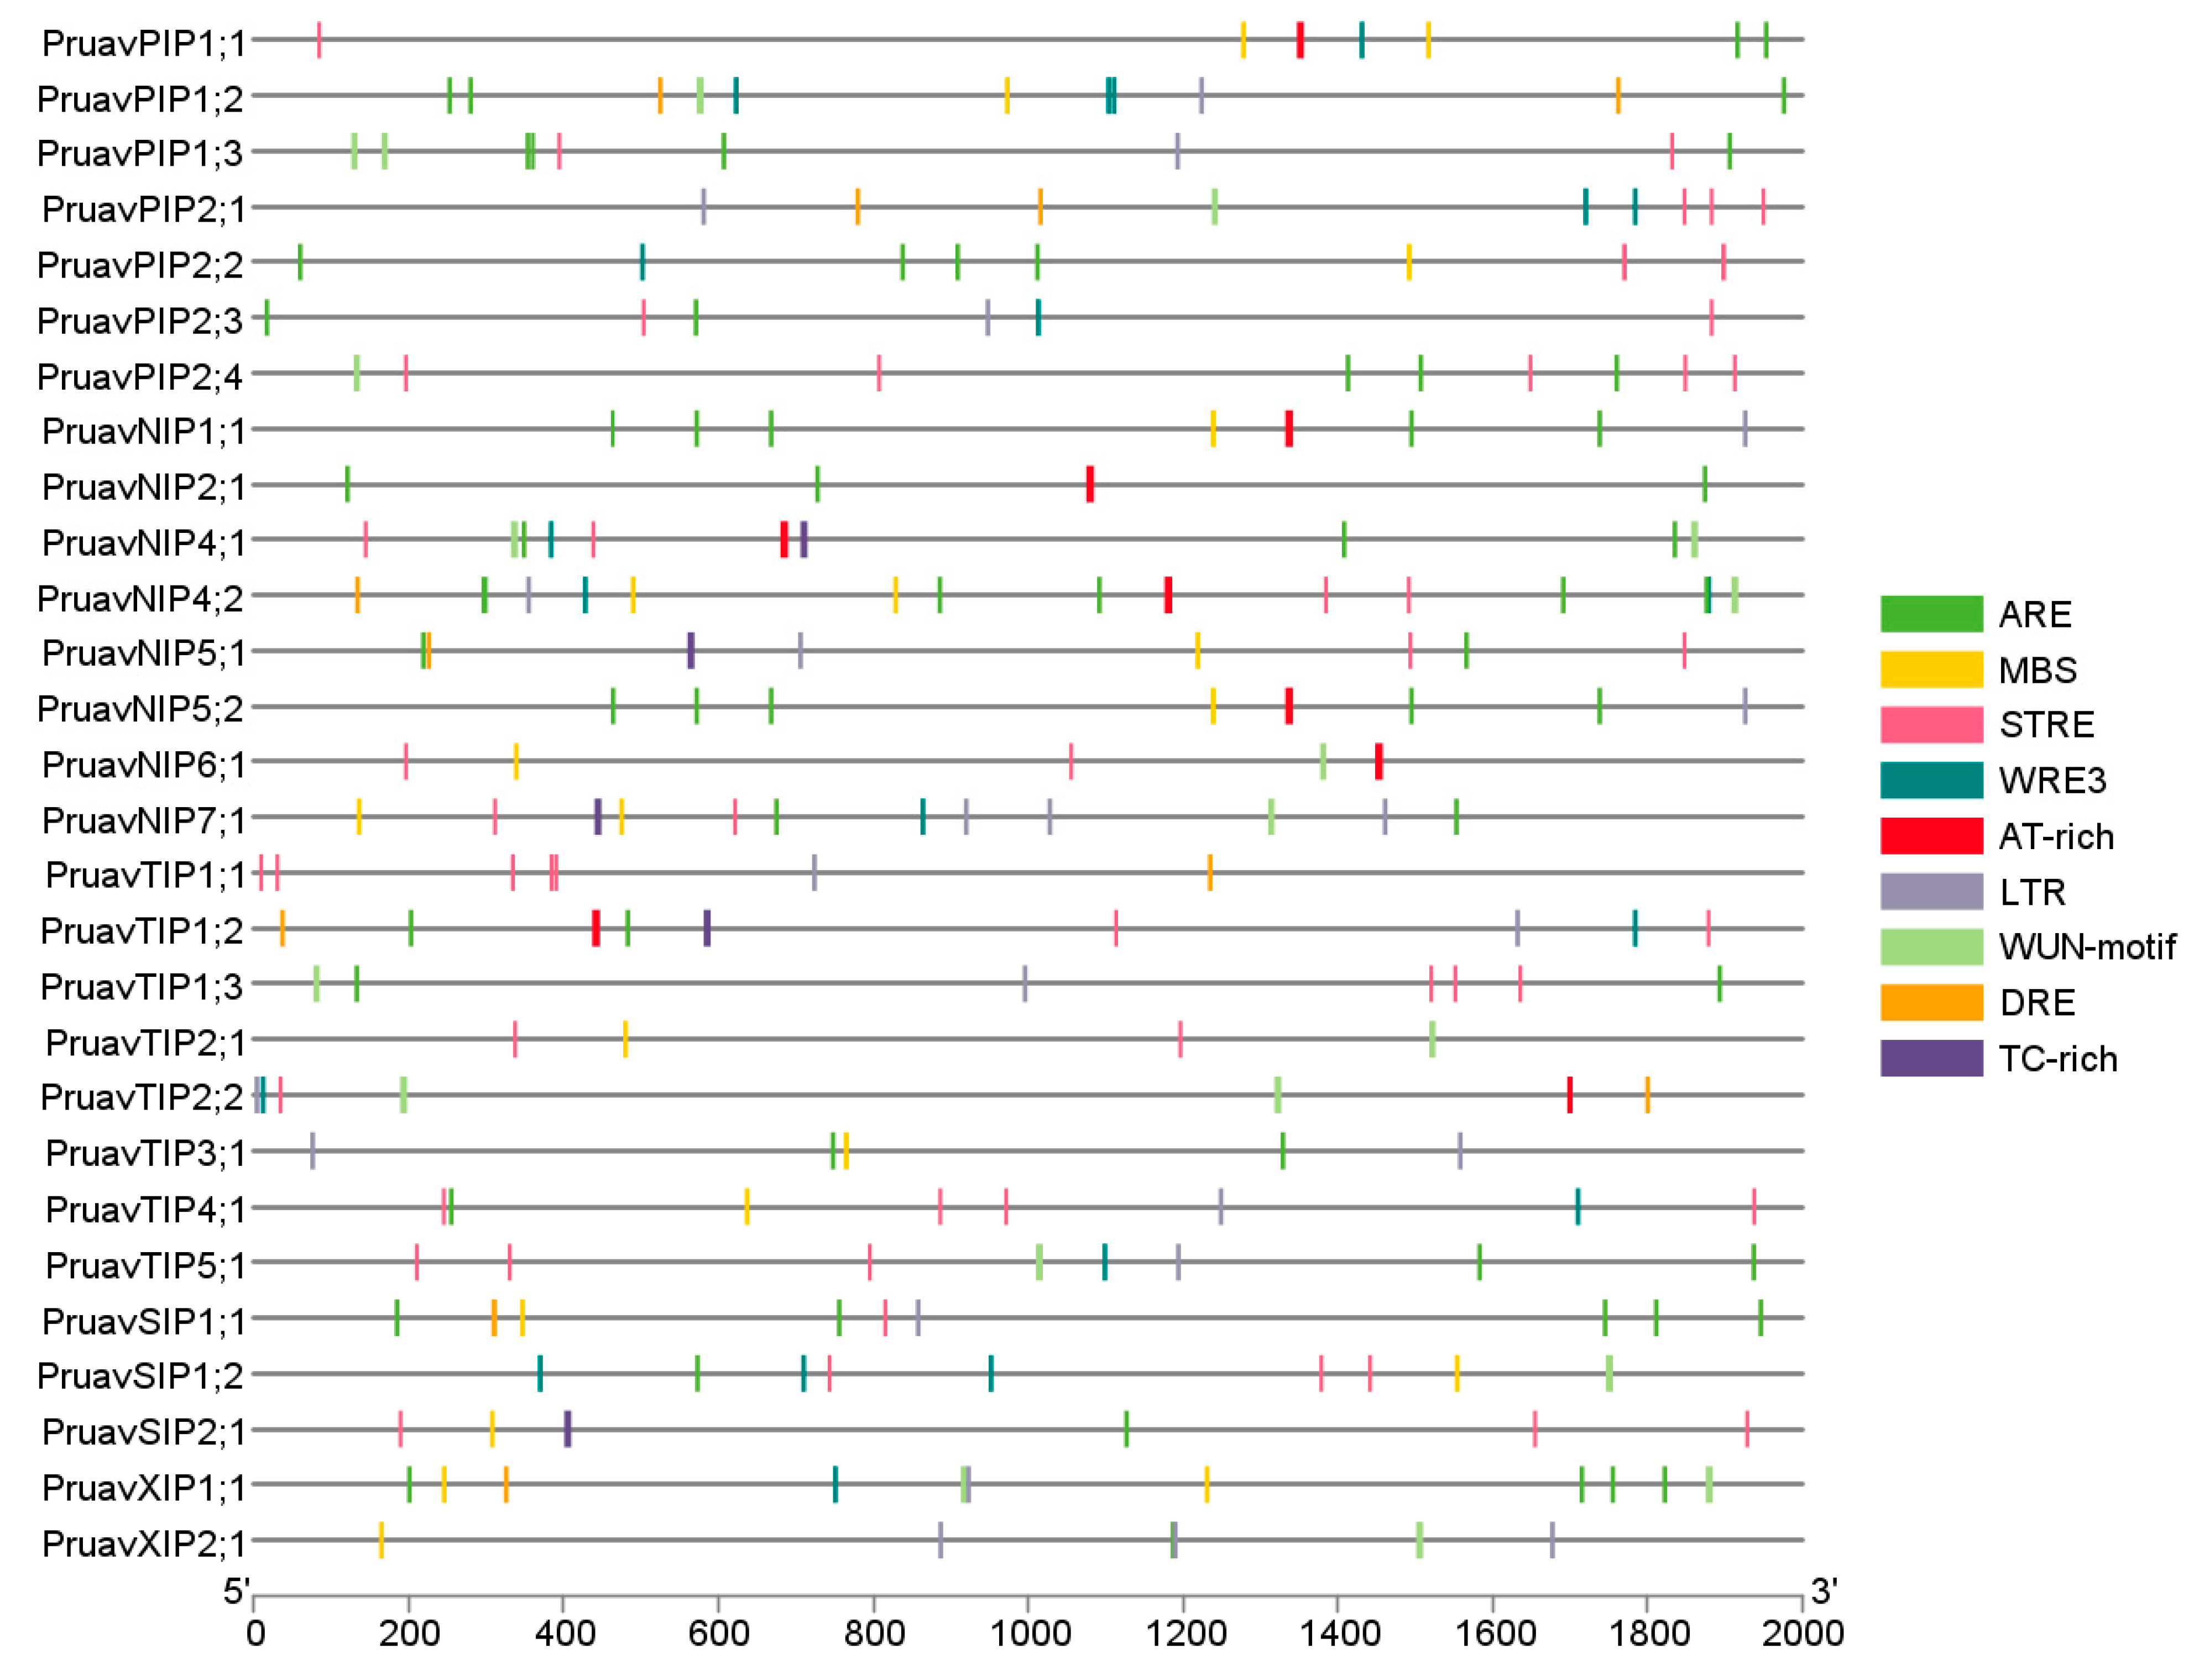
3.2. Analysis of Cis-Acting Regulatory Elements of the Aquaporin Gene Family of P. avium

The analysis of the 2000 bp upstream sequence of P. avium aquaporins identified several cis-acting regulatory elements (CREs) related to stress regulation (Figure 3). Twenty-three aquaporin genes contained CREs for anaerobic induction (ARE), where PruavNIP6;1, PruavPIP2;1, PruavTIP1;1, PruavTIP2;1 and PruavTIP2;2 were the exceptions. Twenty-one aquaporin genes contained at least one cis-acting element for wound (WRE3 and WUN), where PruavNIP1;1, PruavNIP2;1, PruavNIP5;2, PruavSIP2;1, PruavTIP1;1, PruavTIP1;3 and PruavTIP3;1 did not show any wound-related cis-acting element. Twenty aquaporin genes showed a general stress response (STRE), where PruavNIP1;1, PruavNIP2;1, PruavNIP5;1, PruavNIP5;2, PruavPIP1;2, PruavTIP3;1, PruavXIP1;1 and PruavXIP2;1 were exceptions. Nineteen aquaporin genes showed cis-acting elements related to low temperature responsiveness (LTR), but not in the case of PruavNIP2;1, PruavNIP4;1, PruavNIP6;1, PruavPIP1;1, PruavPIP2;2, PruavPIP2;4, PruavSIP1;2, PruavSIP2;1 and PruavTIP2;1. Seventeen aquaporin genes contained a drought-inducible element (MBS), where PruavNIP2;1, PruavNIP4;1, PruavPIP1;3, PruavPIP2;1, PruavPIP2;3, PruavPIP2;4, PruavTIP1;1, PruavTIP1;2, PruavTIP2;2 and PruavTIP5;1 were the exceptions. Nine aquaporin genes, i.e., PruavNIP4;2, PruavNIP5;1, PruavPIP1;2, PruavPIP2;1, PruavSIP1;1, PruavTIP1;1, PruavTIP1;2, PruavTIP2;2 and PruavXIP1;1, contained the cis-acting element for dehydration (DRE). Nine aquaporin genes contained elicitor-mediated activation elements (AT-rich), i.e., PruavNIP1;1, PruavNIP2;1, PruavNIP4;1, PruavNIP4;2, PruavNIP5;2, PruavNIP6;1, PruavPIP1;1, PruavTIP1;2 and PruavTIP2;2. Finally, only five aquaporin genes contained a cis-acting element involved in defense and stress responsiveness (TC-rich), i.e., PruavNIP4;1, PruavNIP5;1, PruavNIP7;1, PruavSIP2;1 and PruavTIP1;2.

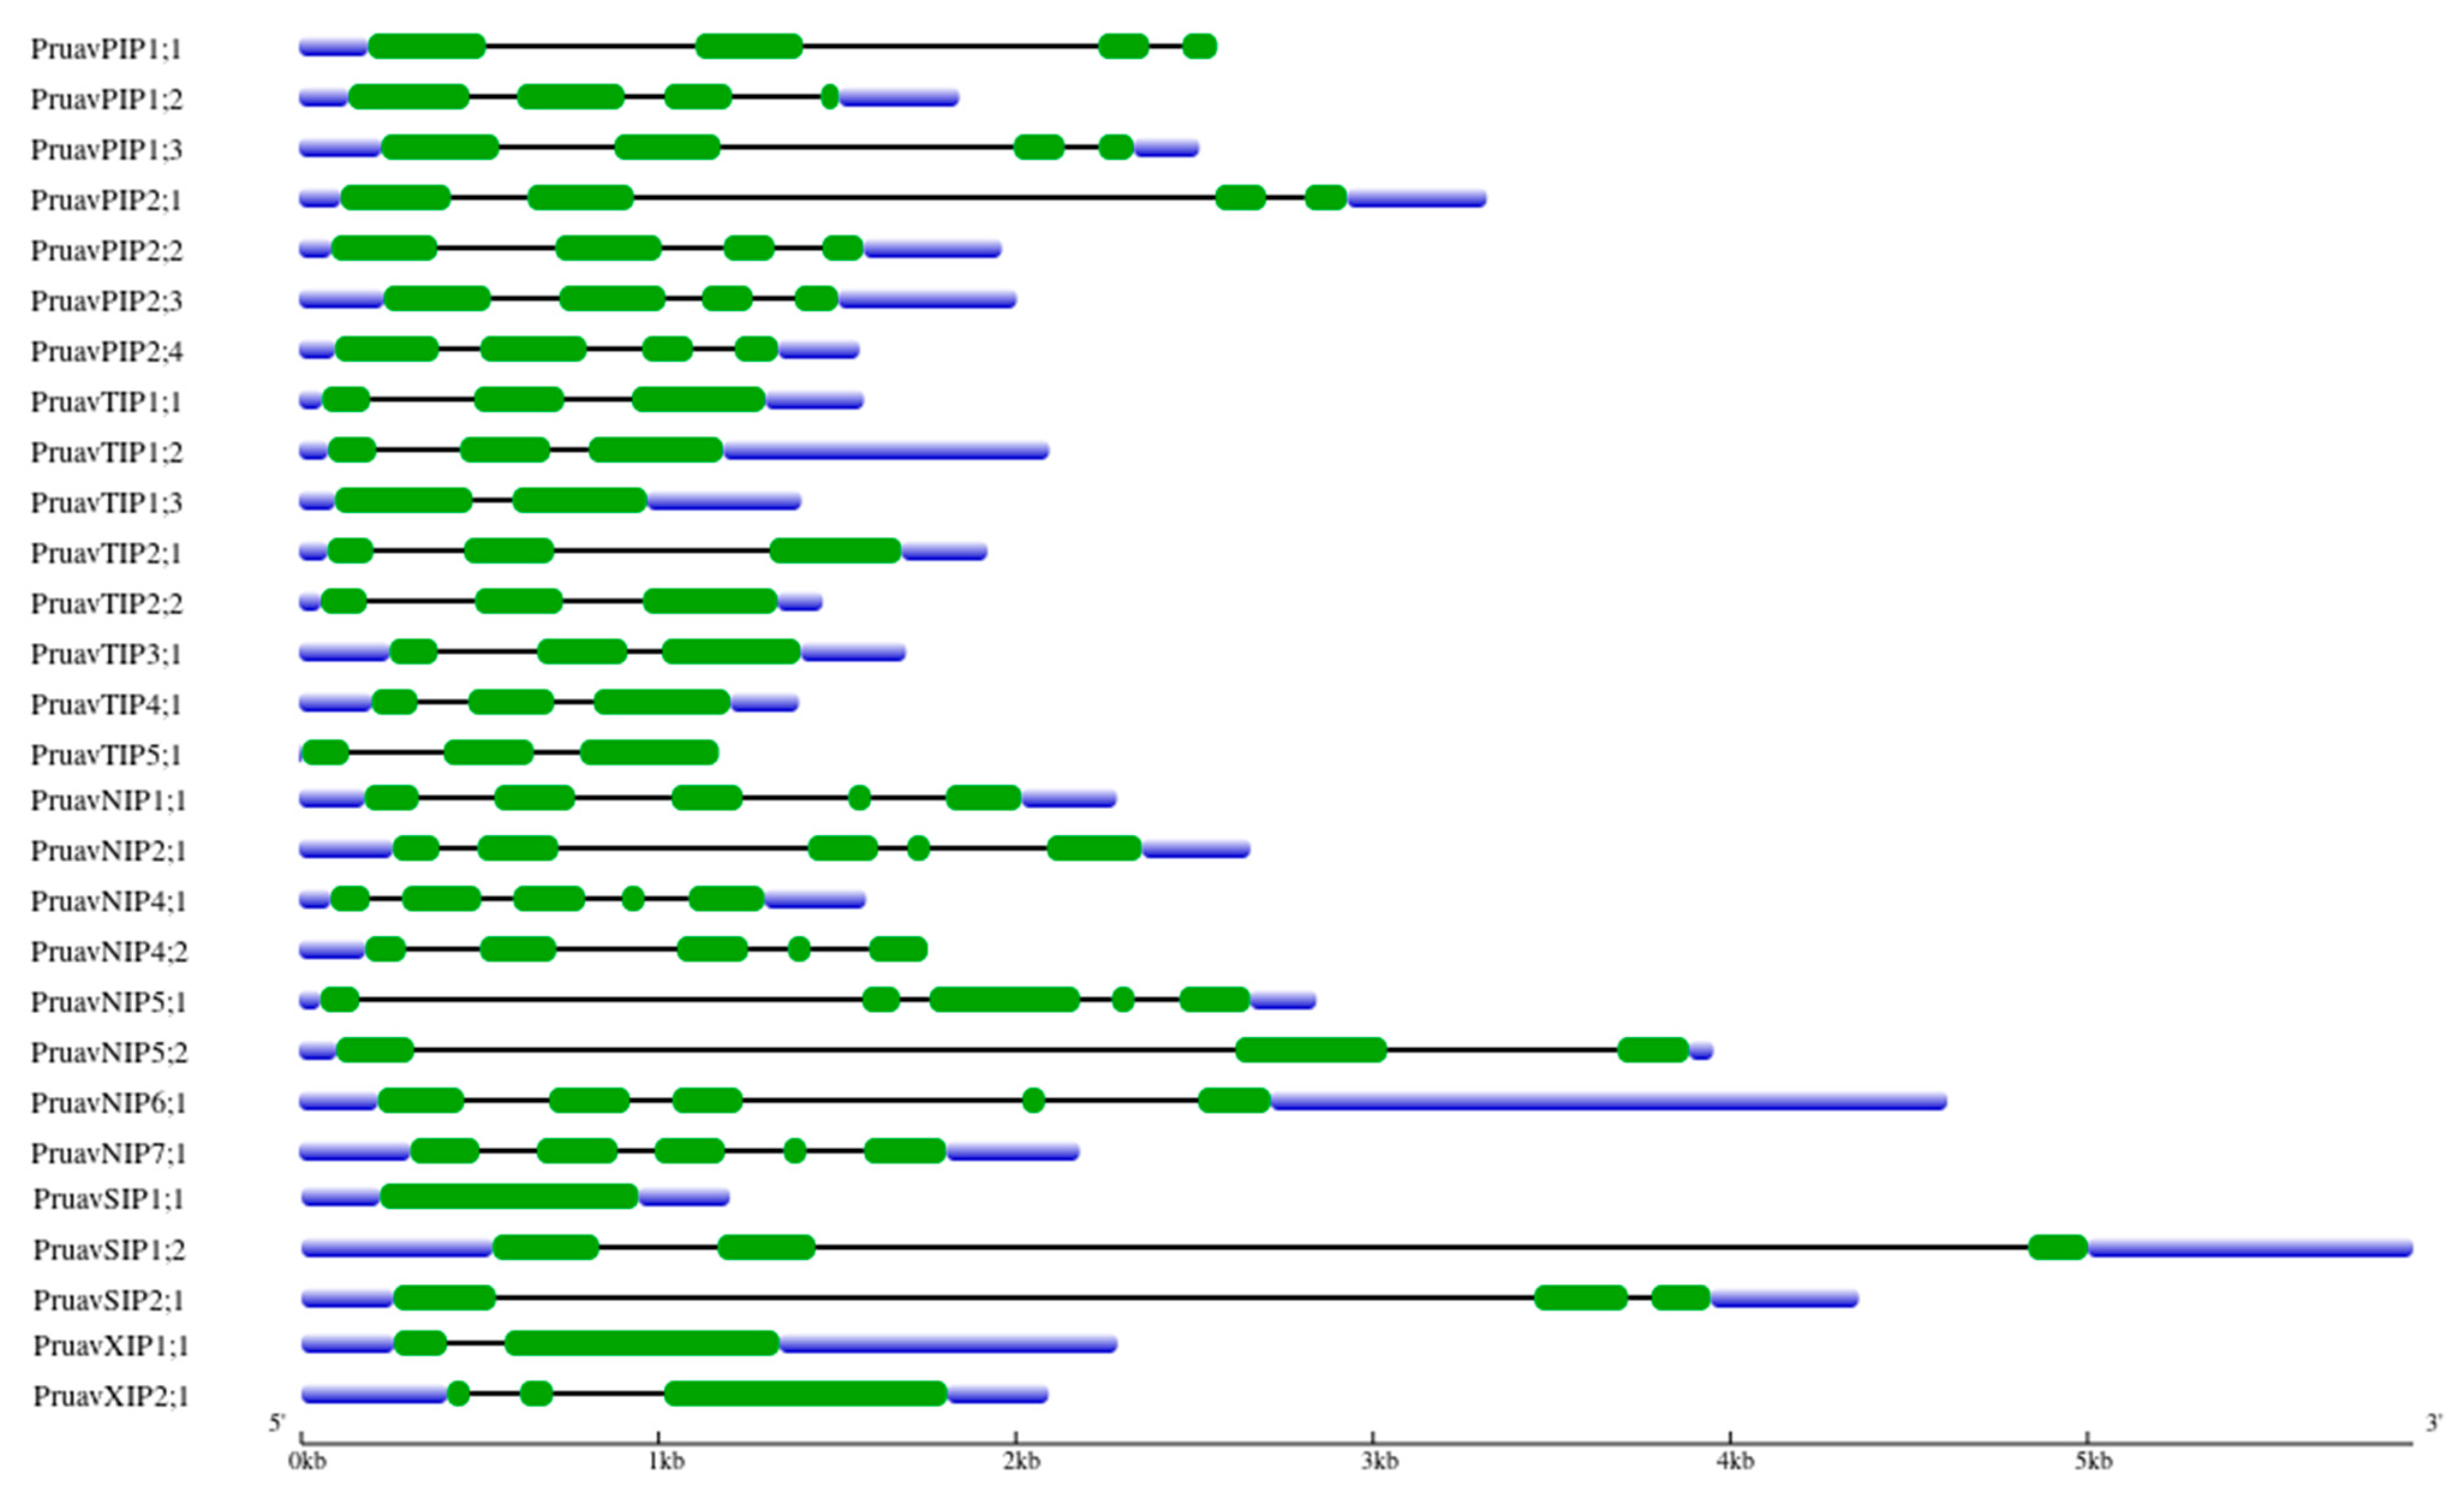
3.3. Analysis of Exon–Intron Structure

The 28 identified aquaporin genes were also analyzed using a constructed gene model (Figure 4). The shortest exon was found in PruavPIP1;2, with 33 bp, and the longest one was found in PruavXIP2;1, with 792 bp. The shortest intron was found in PruavNIP4;1, with 91 bp, and the longest intron was found in PruavSIP1;2, with 3450 bp. The number of introns varied from none in SIP1;1 to a maximum of four in members of the NIP subfamily (Figure 4).
The structures of the aquaporin genes from the NIP subfamily were conserved in almost all members, containing four introns and five exons, with the exception observed in the PruavNIP5;2 gene, which showed two exons. In the PIP subfamily, all members showed the same number of introns and exons, denoting a high conservation of gene structure. In the SIP subfamily, PruavSIP1;2 and PruavSIP2;1 contained two introns and three exons, and the lengths of the exons were similar. It is noteworthy that the third member, PruavSIP1;1, evidenced an absence of introns. In the TIP subfamily, it was observed that all genes contained two or three exons, and their lengths were similar. The exception was PruavTIP1;3 which contained only one intron and two exons. Finally, introns and exons of the members of the XIP subfamily were different between them regarding their numbers and lengths; thus, PruavXIP1;1 contained one intron and two exons, while PruavXIP2;1 contained two introns and three exons (Figure 4).

3.4. Structural Characteristics of P. avium Aquaporins

3.4.1. P. avium NIP Subfamily

The members from this subfamily had a protein sequence length of 244 to 307 residues, and an identity ranging from 33.80 to 64.1%. The two NPA motifs presented slight variations in the third amino acid, changing the well-known alanine to serine in PruavNIP5;1, PruavNIP5;2 and PruavNIP6;1 at the first NPA (Table 1). In the case of the second NPA, PruavNIP5;1 had an isoleucine in the third amino acid, while PruavNIP5;2 and PruavNIP6;1 both had a valine. The ar/R motifs also were less conserved. They contained [W/G/S/T/A]-[V/S/I]-[A/G]- R residues as selectivity filters, except for PruavNIP5;2, which lacked the second ar/R residue. The subcellular localization was predicted to be similar for all members, where the Wolf PSORT tool predicted a localization at the plasma membrane, except for PruavNIP5;2, whose location was predicted at the vacuole level. Meanwhile, Plant mPloc predicted the localization in the cell membrane for all members of this subfamily. With an average isoelectric point and molecular weight of 8.06 and 29.54, respectively, almost all members belonging to this group had a prediction of six transmembrane domains, except for PruavNIP5;2, with five predicted domains. Regarding the Froger’s residues, the five residues contained little variation within this subfamily, with phenylalanine or leucine in position 1 (P1), except for PruavNIP7;1, with a tyrosine in this position. P2 contained serine or threonine, while P3 and P4 contained alanine and tyrosine in all members. P5 was the least conserved, with the presence of isoleucine, leucine, valine and phenylalanine residues (Table 2).
Based on SDP analysis, all NIPs were categorized as boric acid transporters, but PruavNIP1;1 had a substitution of M for I/L/T in SDP7, and PruavNIP7;1 had a substitution of I for T/V in the SDP1. In the H2O2-type SDPs, four members of NIPs were categorized as H2O2 transporters, i.e., PruavNIP2;1, PruavNIP4;1, PruavNIP5;1 and PruavNIP5;2. Only one aquaporin from the NIP subfamily was inferred to be a silicic acid transporter (PruavNIP2;1), with a substitution of V for A/E/L in SDP3 and a substitution of N for A/K/P/T in the SDP9 position. Finally, only four members of the NIP aquaporins, i.e., PruavNIP1;1, PruavNIP2;1, PruavNIP5;1 and Pruav5;2, were identified as putative urea transporters (Table 2).

3.4.2. P. avium PIP Subfamily

The PIP subfamily showed a canonical signature of water channel motifs. The sequence identity ranged from 68.25% to 93.01%, with an amino acid sequence length between 281 and 290 residues. PIP aquaporins showed highly conserved dual NPA motifs with no variation among the members. The selectivity filter (ar/R motif) showed a characteristic configuration of water-channel proteins (FHTR), and this motif was conserved in all members of this subfamily. With an average isoelectric point and molecular weight of 8.65 and 31.15, respectively, all members of this subfamily were predicted to be localized in the plasma or cell membrane, with six transmembrane domains predicted, except for PruavPIP1;1, with only five. The Froger’s residues showed conserved amino acids in P2–P5 positions (SAFW), but PruavPIP1;2 was the only with a glutamine residue instead of the glutamic acid at P1 (Table 1).
As boric acid transporters, all PIPs were categorized as functional transporters, with a slight difference between PIP1 and PIP2 at SDP6. PIP1s have an L and PIP2s have an I at this specific position. Interestingly, in the CO2-type SDPs, only PruavPIP1;1, PruavPIP1;3 and PruavPIP2;2 were inferred to be transporters of CO2 with different residues at the SDP3 position, whereas PruavPIP1;1 and PruavPIP1;3 evidenced a substitution of T for C and PruavPIP2;2 had a substitution of S for C. Finally, all PIPs were categorized as H2O2 transporters and urea-type SDPs (Table 2).

3.4.3. P. avium TIP Subfamily

As seen for the NIP subfamily, the TIP subfamily showed the highest number of members with eight aquaporins. The sequence identity varied from 42.91% to 81.71%, and sequence length ranged between 248 and 256 amino acids. NPA motifs did not present variations. The ar/R filter showed differences among the members, with H, I, A, V residues for PruavTIP1 proteins. PruavTIP2 proteins showed H, I, G, R residues. PruavTIP3;1 and PruavTIP4;1 showed the same residues of TIP1 proteins but changing the fourth amino acid by R. PruavTIP5;1 showed a different ar/R motif with N, V, G, C residues in its selectivity filter. In the transmembrane domain prediction, most TIPs contained six domains, with PruavTIP2;1 and PruavTIP4;1 with seven predicted domains. On the other hand, most TIP aquaporins were localized in the plasma membrane and vacuole, with an average molecular weight of 25.98 and an isoelectric point ranging between 4.78 and 7.11. The Froger’s residues were highly conserved in most TIP aquaporins, with the residues T, S, A, Y, W in P1–P5 positions. However, PruavTIP3;1 varied in the P2 residue, changing the S for A. In addition, PruavTIP5;1 showed different residues at the P1 and P2 positions, containing V and A instead of T and S (Table 1).
Based on SDP analysis, only PruavTIP2;1 was inferred to be an ammonia transporter, differing in three amino acids in the SDP3, SDP6 and SDP9 positions, with T-L-I-L-A-T-H-P-V for all residues. Almost all members of the TIP subfamily (with the exception of PruavTIP1;2 and PruavTIP4;1) were categorized as hydrogen peroxide transporters, with PruavTIP2;1 and PruavTIP2;2 having a different residue in SDP6, containing an N in this position, and PruavTIP5;1 containing a T in SDP5. Finally, all TIPs were categorized as urea-type SDPs (excluding PruavTIP1;2) (Table 2).

3.4.4. P. avium SIP Subfamily

Three aquaporins were identified for this subfamily. Their sequence lengths varied from 236 to 244 aa and their identities ranged between 31.88% and 60.67%. Only the second NPA motif was conserved among those proteins. In detail, PruavSIP1;1 had a serine instead of an alanine in the third residue and PruavSIP1;2 and PruavSIP2;1 had a threonine and a leucine, respectively. The selectivity filter ar/R was more conserved in both SIP1s with A/T-V-P-N, while PruavSIP2;1 had S, H, G, S amino acids in this case. In addition, Wolf PSORT predicted the subcellular localization in the vacuole, chloroplast and plasma membrane, while Plant mPloc predicted a cell membrane for all members and a vacuole for SIP1 aquaporins. Despite the differences evidenced by these transmembrane domain predictions, SIP aquaporins shared similar isoelectric points and molecular weights. The Froger’s residues were conserved in SIP1 with M, A, A, Y, W residues, while only SIP2 contained F, V, A, Y, W amino acids. Based in the SDPs analysis, the members of this subfamily did not show any important residues to be determined as a potential transporter for other molecules different from water.

3.4.5. P. avium XIP Subfamily

The only two members from this subfamily showed sequence lengths between 304 and 314 aa. PruavXIP1;1 shared a 40.6% sequence identity with PruavXIP2;1. The NPA motifs were highly variable. Thus, the first NPA changed to SLV and NPV in PruavXIP1;1 and PruavXIP2;1, respectively. The second NPA conformed with an SPA in PruavXIP1;1 and the canonical NPA in PruavXIP2;1. The ar/R filter showed differences between both XIPs, since PruavXIP1;1 showed V, I, V, R residues and PruavXIP2;1 showed differences at the first and second positions (I, T, V, R). Both proteins were predicted to be localized in the plasma or cell membrane. The number of predicted transmembrane domains was six for PruavXIP1;1 and seven for PruavXIP2;1. Their molecular weight and isoelectric point averaged 33 and 6.86, respectively. The Froger’s residues were highly conserved, with only a point variation in P1, with [M/V]-C-A-F-W residues in this subfamily (Table 1).
Both XIP aquaporins were also categorized as boric acid transporters, but only PruavXIP1;1 showed different residues, given by a substitution of L for I/V in SDP2 and a substitution of V for I/L in SDP6. SDP analysis suggested that only PruavXIP2;1 can transport H2O2. PruavXIP1;1 represented a novel urea-type SDP with the substitution of V for L/M in SDP5 and substitution of G for A/G/P in SDP6 (Table 2).

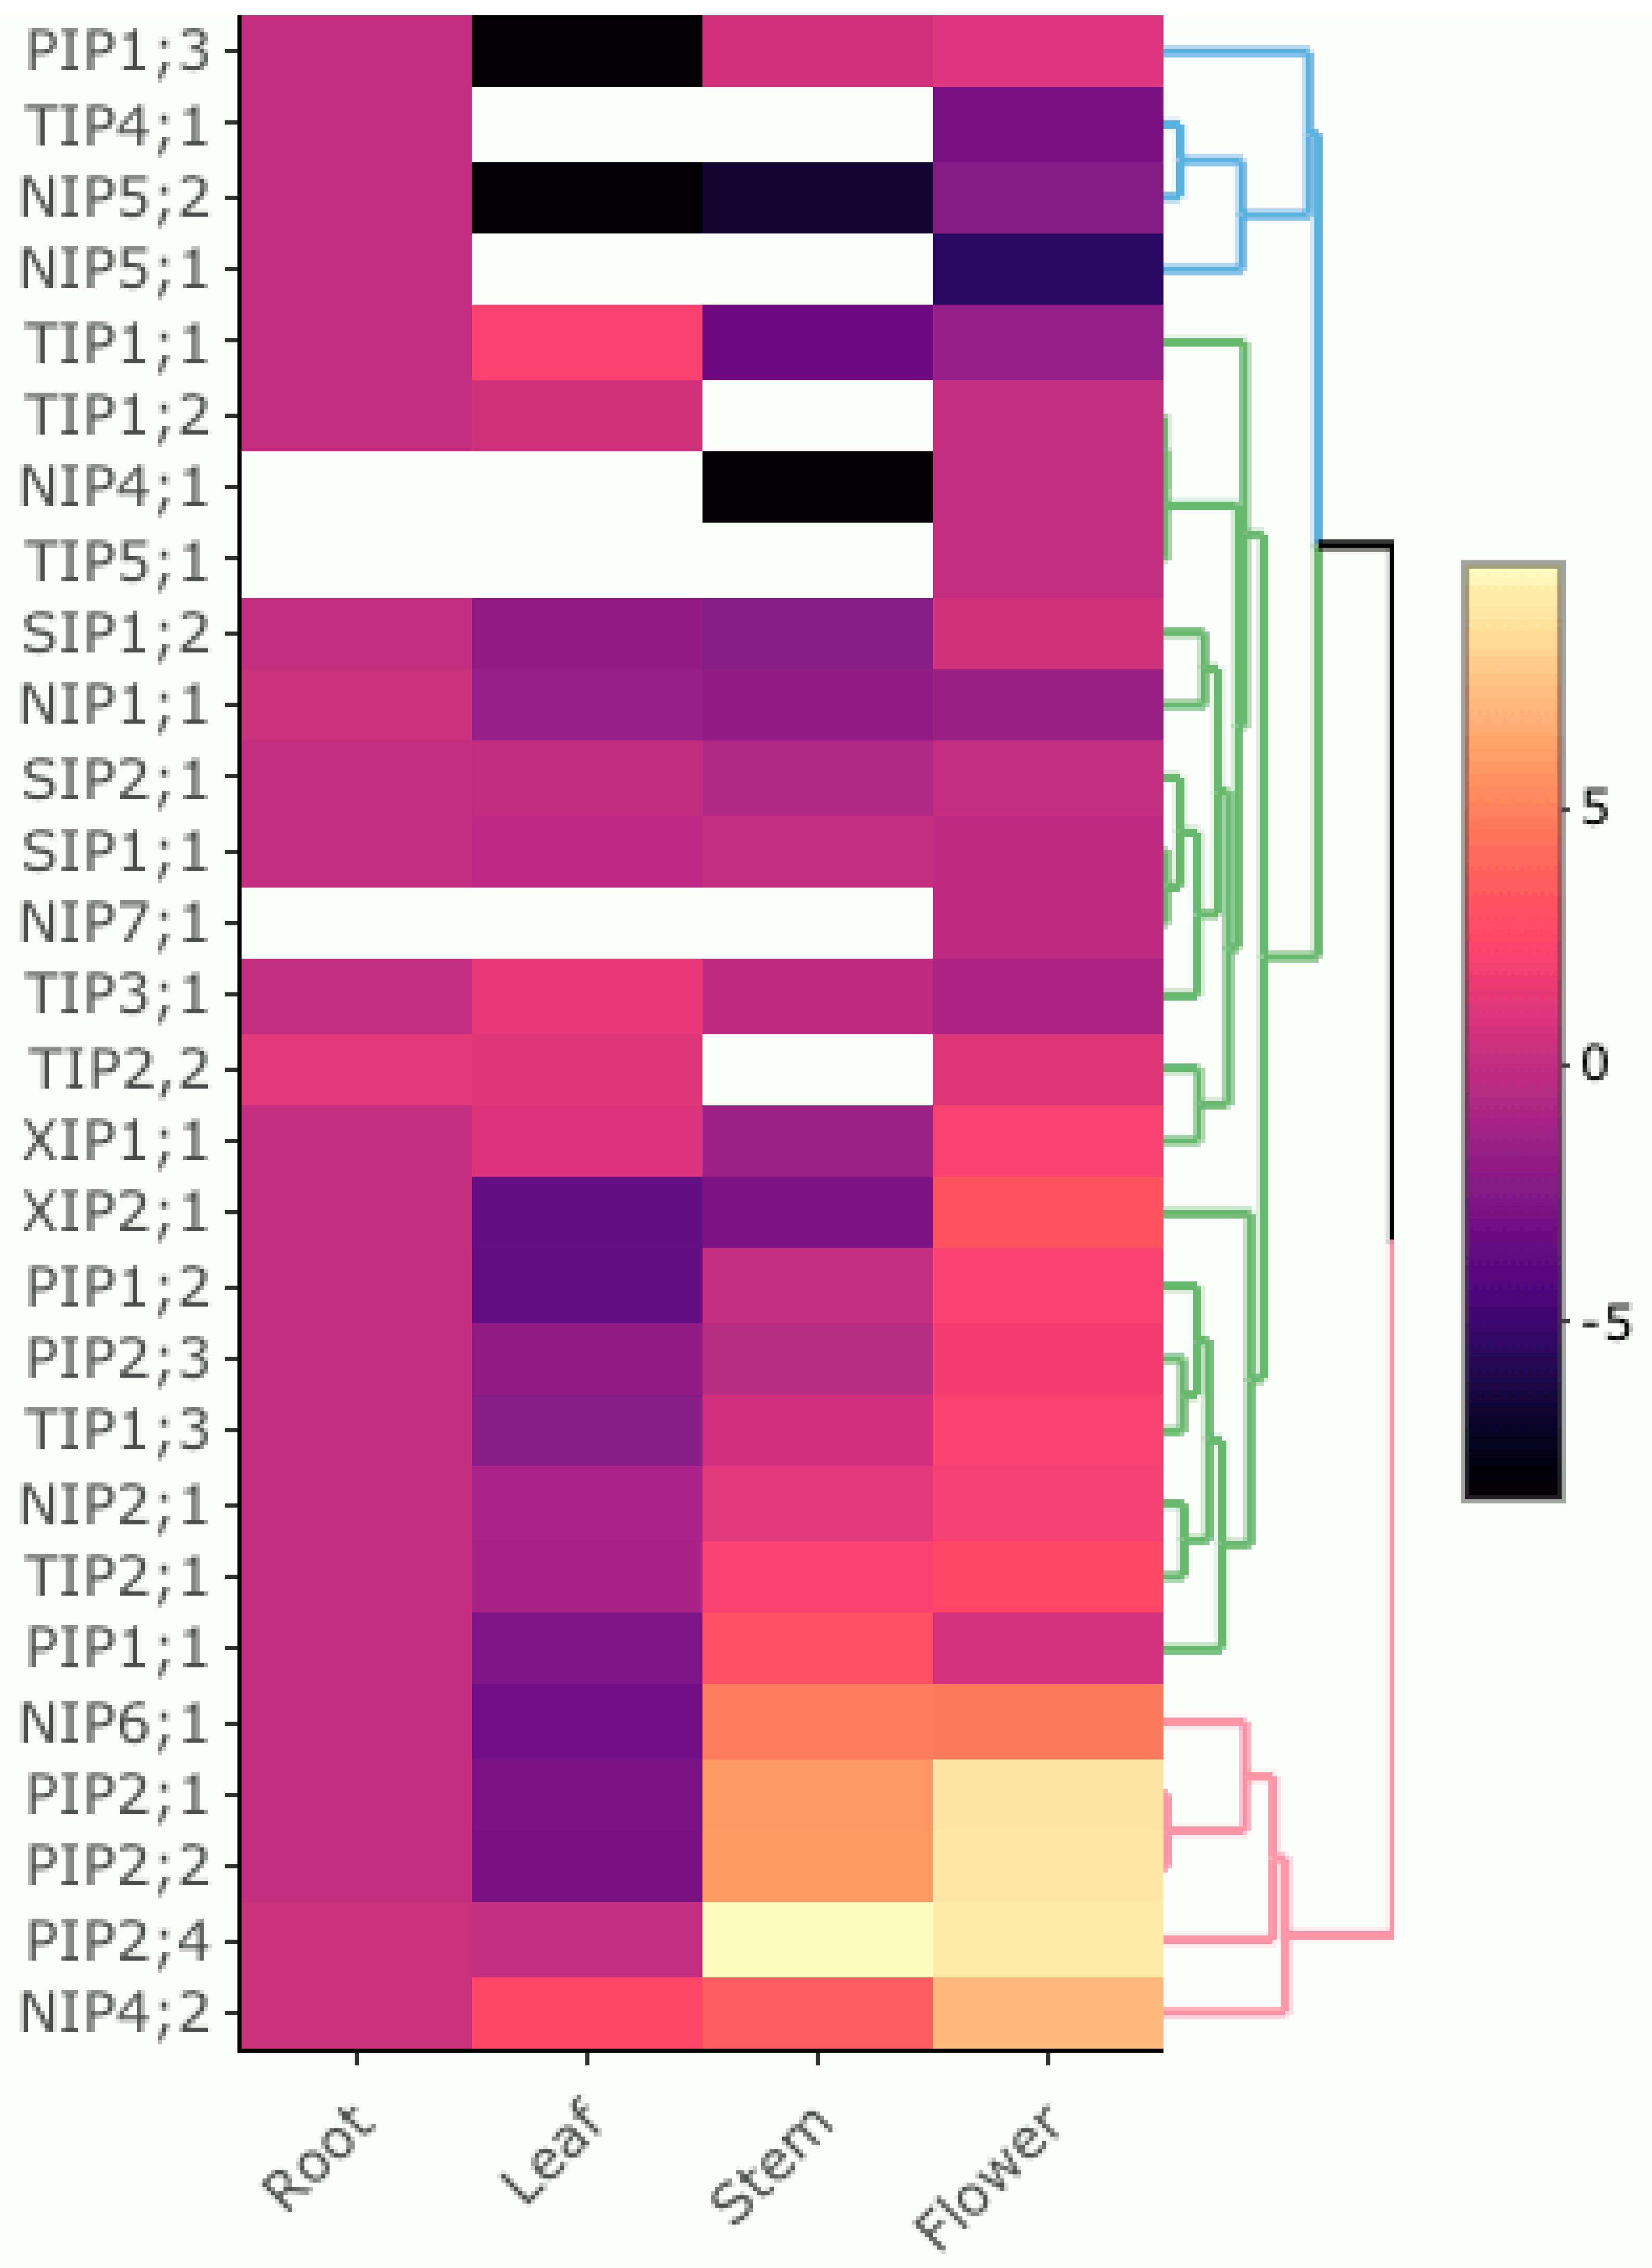
3.5. Expression Pattern of PruavAQP Genes in Different Organs

Roots, leaves, stems and flowers were used for expression patterns of 28 PruavAQPs by qRT-PCR (Figure 4). All Pruav aquaporins were detected in at least one organ. Flowers and roots were the organs with the largest number of expressed aquaporins, with 28 and 25 aquaporin genes, respectively. On the other hand, the lowest number of aquaporins detected was in stems. Some aquaporins showed a highly organ-associated expression. Among NIP genes, PruavNIP1;1, PruavNIP5;1 and PruavNIP5;2 were preferentially expressed at root level and the expressions of PruavNIP4;1 and PruavNIP7;1 were exclusively detected in flowers. Of all NIPs, only PruavNIP4;2 was up-regulated in leaves. PruavNIP4;2 and PruavNIP6;1 were strongly expressed in stems and flowers (Figure 5).
All PruavPIPs were expressed in roots. PruavPIP1;1, PruavPIP2;1, PruavPIP2;2 and PruavPIP2;4 were strongly up-regulated in stems. Several PruavPIPs were down-regulated in leaves. In addition, all PruavPIPs were expressed in flowers, with PruavPIP2;1, PruavPIP2;2 and PruavPIP2;4 being strongly expressed in this organ (Figure 5).
Almost all PruavTIPs were expressed in roots, excluding PruavTIP5;1, which was only expressed in flowers. Only PruavTIP1;3 and PruavTIP2;1 were up-regulated in stems while PruavTIP1;1 and PruavTIP3;1 were down-regulated. On the other hand, PruavTIP1;2, PruavTIP2;2, PruavTIP4;1 and PruavTIP5;1 were not detected in stems. PruavTIP1;1 and PruavTIP3;1 were strongly expressed in leaves and PruavTIP1;3 and PruavTIP2;1 in flowers (Figure 5).
All PruavSIPs were expressed in roots. PruavSIP1;1 was expressed in stems but PruavSIP1;2 and PruavSIP2;1 were down-regulated. PruavSIP1;1 and PruavSIP1;2 were repressed in leaves and only PruavSIP1;1 was down-regulated in flowers (Figure 5). Noteworthy, the expression profile of both PruavXIPs was quite similar. PruavXIP1;1 and PruavXIP2;1 were expressed in roots, strongly up-regulated in flowers and repressed in stems. However, an opposite pattern was detected in leaves since PruavXIP1;1 was up-regulated and PruavXIP2;1 was repressed (Figure 5). Finally, it should be noted that PruavPIP1;3, PruavTIP4;1, PruavNIP5;1 and PruavNIP5;2 showed very similar transcriptional profiles, which were characterized by their expression associated preferentially with the root, together with little or no presence of transcripts in the other organs assessed. Likewise, PruavNIP6;1, PruavPIP2;1, PruavPIP2;2, PruavPIP2;4 and PruavNIP4;2 were grouped into a clade defined by their marked gene expression in stems, being even higher at the flower level (Figure 5).

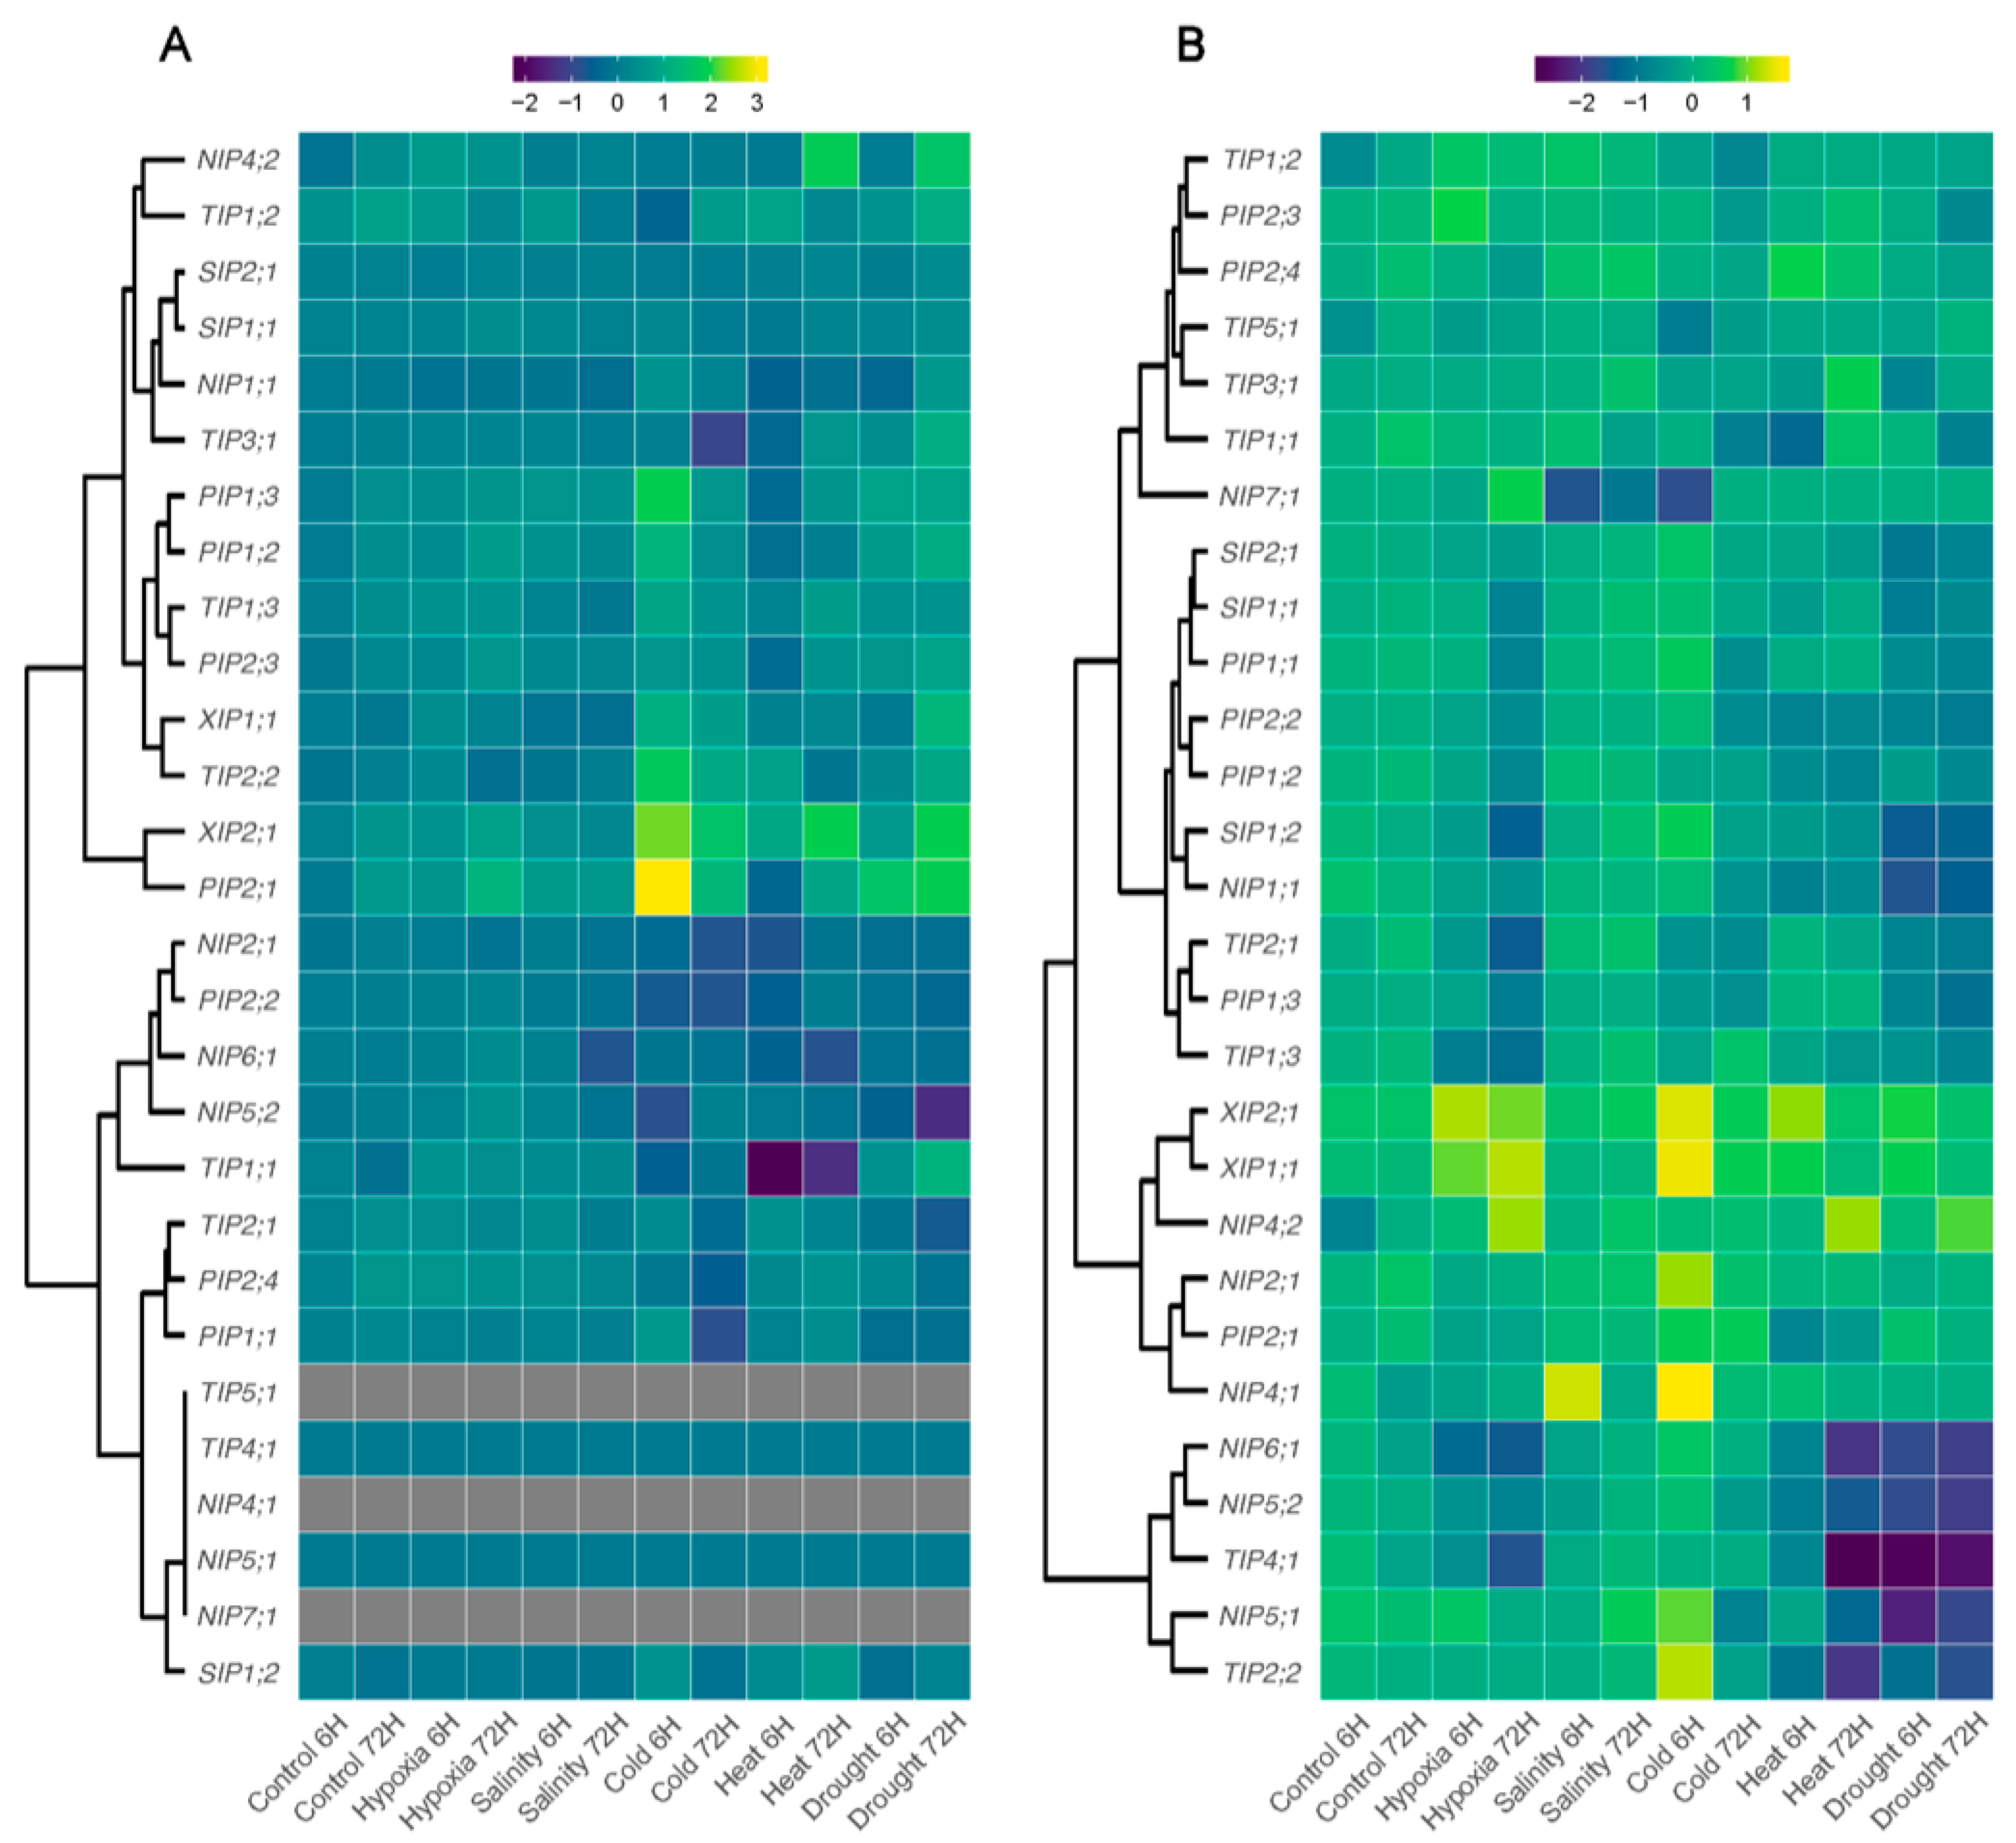
3.6. Expression Profiles of AQPs Genes in Response to Different Abiotic Stresses

We analyzed the expression patterns of PruavAQP genes in roots and leaves under different abiotic stresses: hypoxia, salinity, cold, heat and drought. We evaluated two sampling times (6 and 72 h) to find out if there were aquaporins related to early or late responses. When comparing the expression profiles of all AQP genes under different stresses analyzed, we observed that there were more PruavAQP genes that were down-regulated in roots. Interestingly, three PruavAQP were not detected in leaves (PruavTIP5;1, PruavNIP4;1, and PruavNIP7;1) independently of the abiotic stress analyzed (Figure 6).
In roots under cold and salt stress, 50% and a 42.9% of PruavAQP genes were up-regulated, respectively. On the other hand, in roots under drought stress, more than 60% of all AQP genes at 6 and 72 h were down-regulated. In leaves, 65.2% were up-regulated under hypoxia stress at 6 h, and 60.9% of AQP genes were up-regulated under drought stress at 72 h. In addition, 47.8% of PruavAQP genes were early down-regulated in leaves under heat stress and a 47.8% were repressed in salinity stress 72 h later (Figure 6).
In roots exposed to hypoxia stress, a large number of genes (19) were down-regulated (all PruavPIPs, five PruavNIPs, four PruavTIPs and all PruavSIPs). Only five aquaporin genes were up-regulated under hypoxia stress at 6 and 72 h, viz.; PruavNIP4;2, PruavNIP7;1, PruavTIP1;2, PruavXIP1;1 and PruavXIP2;1. However, the expression pattern in leaves was quite different since 13 genes were up-regulated and only 7 genes down-regulated (Figure 6).
Salinity stress modified the expression profile of aquaporin genes in roots, evidencing 17 aquaporin genes as up-regulated and only 7 as down-regulated (PruavNIP1;1, PruavNIP5;1, PruavNIP5;2, PruavNIP6;1, PruavTIP1;1, PruavTIP4;1 and PruavSIP1;2). Among them, only PruavTIP1;1 was down-regulated at 72 h of salt stress and the rest of the aquaporin genes were down-regulated earlier (6 h). In leaves, a similar number of PruavAQPs were down- and up-regulated in response to salinity (Figure 6).
Cold stress also altered the expression pattern of PruavAQPs in roots: 14 genes were up-regulated at 6 h and 15 genes were down-regulated at 72 h of treatment. In leaves, a similar number of aquaporins were up- and down-regulated, independent of the analyzed sampling time (Figure 6).
Notably, two stresses, heat and drought, showed similar expression profiles in roots. In this organ, most of the PruavAQPs were down-regulated under heat stress at 6 and 72 h. A few genes were up-regulated in roots under these extreme conditions: PruavNIP4;2, PruavPIP1;3, PruavPIP2;3, PruavPIP2;4 and PruavTIP3;1. In drought, most of the root aquaporins were repressed and only PruavNIP4;2, PruavPIP2;1, PruavXIP1;1 and PruavXIP2;1 were up-regulated. In leaves, PruavAQPs genes were mainly down-regulated under heat stress. However, under drought stress, several PruavAQP genes evidenced an up-regulated gene expression at 72 h (Figure 6).

4. Discussion

According to the IPCC Sixth Assessment Report (AR6), in the most recent five decades, the global surface temperature has experienced the most rapid increment estimated for any 50-year period over the last 2000 years, and is a phenomenon widely related to emissions of greenhouse gases derived from human activities [43]. An econometric analysis that evaluated the impacts of different climate scenarios on global agricultural productivity concluded that world agricultural productivity has become vulnerable to climate change, resulting in a global productive decline that averages 21% in the last 60 years [11]. The ability of crops to adapt to adverse environmental conditions is a key factor in sustaining food production. Plants deploy a wide variety of molecular and physiological mechanisms to ensure the acquisition of resources and their most efficient use in response to stressful stimuli, such as those imposed by the challenges of climate change.
As transmembrane channels involved in the selective bidirectional mobilization of water, ions and uncharged low-molecular mass solutes [2,3,4,10] through osmotic gradients, aquaporins (AQPs) have been shown to play a crucial role in the uptake of water and nutrients from the environment and their distribution throughout the whole plant.
Due to their function of transporting resources, aquaporins are ubiquitous protein channels that participate in various developmental and stress response processes [11,12,13,14,15,44,45]. Thus, the regulation of gene expression of the numerous isoforms of aquaporins in response to stresses such as root hypoxia [10], drought [46,47], salinity [48,49], cold [50,51,52,53], heat [54,55] and combinations of them [56] have been consistently reported.

4.1. Identification and In Silico Characterization of the PruavAQP Gene Family

The rapidly growing number of genome sequencing initiatives has allowed the research of many important economic plants in a deeper manner [57,58,59,60,61,62,63,64]. To date, seven genomes of species from the Prunus genus are publicly available, i.e., P. avium, P. armeniaca, P. dulcis, P. mume, P. persica, P.s salicina and P. yedoensis. The latter was excluded from the synteny analysis since it is reported as contigs, impeding the comparative study with the other Prunus species at the chromosomal level. A genome-wide identification of gene aquaporins in different plant species, including P. persica, showed a total of 29 putative aquaporins in the first genome assembly [39]. However, in the later and more curated version 2.1, available in Phytozome v12.1, we identified 28 sequences as putative aquaporins. Chen et al., 2018 [65] reported 25 putative full-length aquaporin genes in a first approach to identify and analyze the aquaporin family in P. avium. However, our methodology identified 28 full-length putative aquaporins genes, the same number as reported for other Prunus species, with a high sequence identity among the six species compared in this study. This denotes a high conservation of the aquaporin family within the Prunus genus. In addition, the microsynteny analysis showed a high synteny among P. avium, P. armeniaca, P. dulcis, P. persica and P. salicina, but with a similar locus pattern of distribution for almost all gene aquaporins in P. mume (Figure 1). The clustering algorithm presented in the phylogenetic tree allowed us to classify our aquaporins clearly within the five subfamilies and their subgroups described for higher plants (Figure 2).
Since aquaporin proteins can play a crucial role in water and other solute transport across plant membranes, their expression can be modulated by various abiotic and biotic stresses [66]. The identification of cis-acting elements related to stress regulation in the upstream sequences of PruavAQP genes revealed that, excluding PruavPIP2;1, PruavTIP1;1, PruavTIP2;1, PruavTIP2;2 and PruavNIP6;1, almost all aquaporins contained the ARE motif, denoting susceptibility to be induced by anaerobiosis. This pattern is like what was found in Cucumis sativus, where members of the same subfamily (i.e., CsPIP1;1, CsPIP2;1, CsTIP4;1, and CsNIP3;1) lacked the ARE motif [67]. However, a different pattern was observed in Lycium barbarum, where 16 out of 38 of their aquaporins did not contain the ARE motif [55]. Some aquaporin genes were exceptions to other stress-responsive cis-acting elements. Overall, these findings suggest that different stresses can activate different sets of cis-acting elements in sweet cherry aquaporins, leading to differential expression of these genes and, consequently, modulating the transport of water and other solutes in response to specific stress conditions (Figure 3).
On the other hand, when comparing the gene structure of P. avium aquaporins (Figure 4) with other species, we noted that there was a high conservation in the number of introns for each aquaporin subfamily with Solanum lycopersicum [57], Glycine max [68], Hebea brasiliensis [69], Phaseolus vulgaris [70], Citrus sinensis [71], Musa acuminata [72] and Sorghum bicolor [73].
One of the first important motifs described was the NPA, which is highly conserved among the aquaporins in P. avium, although with some variations (Table 1). Thus, the PIP and TIP subfamilies were the only ones with the three residues (asparagine, proline and alanine) present in all their members. In addition, not only the NPA motif was conserved in the PIP subfamily, but also the residues that form the ar/R selectivity filter. Compared with other species, those amino acids were also fully conserved in Z. mays, A. thaliana, P. trichocarpa, S. lycopersicum, G. max and B. rapa [42,57,68,74,75,76]. Previous studies have suggested its importance in the function of this subfamily, which could be regulating water uptake in roots and leaves [11,77], CO2 transport in the mesophyll in N. tabacum, A. thaliana, Hordeum vulgare and O. sativa [44,78,79,80], and even enhancing drought and salt tolerance in transgenic A. thaliana [81]. The Froger’s residues (Table 1) were also consistent with those proposed for water channels, with PruavPIP1;2 and PruavPIP1;3 with a variation at P1 (glutamic acid instead of glutamine), which could be affecting the channel conformation and, consequently, the transport performance due to the electric charge of the glutamic acid. The SDP analysis (Table 2) also inferred that PIPs were transporters for solutes. PIP aquaporins from O. sativa have been experimentally tested as boron transporters [82,83]. Here, all PruavPIPs were predicted as boric acid transporters, with no amino acid variations from those proposed for such a function. As CO2 transporters, some sequence variations were detected in SDP3, with a threonine in the case of PruavPIP1;1 and PruavPIP1;3, and a serine in PruavPIP2;2 instead of a cysteine. The shift of a non-polar by a polar residue could imply an altered efficiency for water transport given by a different channel conformation due to polar groups having more molecular freedom under aqueous conditions. Members of PIP1 and PIP2 subgroups have been characterized as H2O2 and urea transporters in A. thaliana and Z. mays [84,85], respectively. In our SDP analysis, all PIP members were predicted as potential transporters for those molecules, containing all the residues proposed with no variation. Previous studies on spinach aquaporin SoPIP2;1 and A. thaliana AtPIP2;4 characterized them as water and hydrogen peroxide transporters [86,87]. Interestingly, a gating mechanism mediated by a conformational change of the cytoplasmatic loop D was evidenced on SoPIP2;1, which consisted in a very conserved motif (S-A-T-D-[P,A]-K-R-[N,S]-A-R-D-S-H-V-P-[I,V]-L-A-P); such residues were present in both Pruav PIP aquaporin subfamilies. Moreover, the GRAVY analysis (Table 1) also showed the best value for hydrophilic affinity and, considering the low Ka/Ks ratio in this subfamily, a potential water transport capacity was expected for all PruavPIP aquaporins.
The NIP subfamily can be divided into three functional subgroups (NIP I-III), which are based in the four residues that form part of the ar/R selectivity filter (Wallace and Roberts, 2004) [88]. NIPs have a wide range of substrate specificity such as water, arsenic, silicic acid, ammonia, glycerol, urea, boric acid, silicon, aluminum and lactic acid [10,52,89,90,91,92,93,94,95,96,97,98]. In our Pruav NIP sequences analysis, we evidenced that this subfamily had the most variation in the ar/R selectivity filter and Froger’s residues. Moreover, three members (PruavNIP5;1, PruavNIP5;2 and PruavNIP6;1) exhibited a substitution in the third amino acid in both NPA motifs. However, the SDP analysis revealed that the whole PruavNIP subfamily was inferred to be a boric acid transporter, with a high residue conservation in all SDPs, suggesting a similar function for all NIPs. The A. thaliana boric acid transporter AtNIP5;1 spans NPS/NPV motifs and A/I/G/R residues in the ar/R selectivity filter with low water permeability [85]. In our study, its ortholog PruavNIP5;2 shared the same residues in the NPAs motifs, which suggests a function as a boric acid transporter in P. avium, although the second residue in the Ar/R filter was lacking. Another boron transporter in Arabidopsis is AtNIP6;1, with no water permeability [96]. Its ortholog PruavNIP6;1 showed a higher GRAVY value (i.e., more hydrophobic) than PruavNIP5;2 but there was a threonine instead of alanine in the H2 position of the ar/R selectivity filter, which could indicate a different transport efficiency due to a less wide pore produced by steric hindrance of the threonine size. OsNIP2;1 has been reported as a silicon, arsenite and boron transporter, with double NPA and G/S/G/R selectivity filter motifs [93]. The P. avium homolog, PruavNIP2;1, shared the same residues as well as the nine SDPs, which also suggests its involvement in boron transport. The NIP subgroup I (NIP I) can transport water, glycerol, lactic acid, ammonia, arsenite and hydrogen peroxide. PruavNIP I channels contained W V/I A R residues in the ar/R selectivity filter. In a previous work, our research group characterized PruavNIP1;1 as a lactic acid transporter [10], spanning WVAR amino acids just like PruavNIP4;1 and PruavNIP4;2. In this case, their orthologs AtNIP4;1 and AtNIP4;2 played a key role in the pollen development and pollination, transporting not only water but also ammonia, urea, boric acid and hydrogen peroxide in the case of AtNIP4;1 [83]. They shared the same NPA and ar/R motifs, but a different Froger’s residue at P1, with a phenylalanine in both AtNIP4s instead of leucine, as in the case of their homologs of P. avium.
In the TIP subfamily, TIP1 members have lost the arginine from the LE2 position, replacing it with a valine. This could affect the constriction zone with a wider pore due to the difference of size between these amino acids, allowing the pass for bigger non-aqueous molecules and affecting the transport rate of the channel. The same can be said for PruavTIP5;1, which has also lost the arginine, replaced by a smaller cysteine residue. Its ortholog, AtTIP5;1, has been characterized as a water and urea transporter [99,100]. Both share the same amino acids for NPA, ar/R selectivity filter, Froger and SDP residues for urea transport, suggesting a similar function for PruavTIP5;1. Previous studies have analyzed the importance of the arginine in the LE2 position, where its mutation altered the transport capacity of TIPs in Tulipa gesneriana [101], but mimicking the ar/R selectivity filter of the functional characterized TIP ammonia transporter from Arabidopsis PIP aquaporins resulted in no evidence of ammonia transport [102]. This suggests that the ar/R selectivity filter is not the most important region of the channel. Aside from the NPA, ar/R, Froger and SDP residues, it is important to consider the residues that form part of the external sides of the channels [5]. In our previous study, we analyzed the electrostatic surface potential in the 3D model of the lactic acid transporter PruavNIP1;1, which is similar to AtNIP2;1 [10], empirically reported as a lactic acid transporter [95]. This is a relevant feature since it can predict what kind of molecules will have better affinity with the cytosolic residues before it enters the channel.
Unlike any other aquaporin subfamily in higher plants, the SIP aquaporins subfamily have not been widely studied in term of structure and function. Just like A. thaliana, P. avium contained three genes encoding for SIP aquaporins: two SIP1 and one SIP2. Members of this subfamily in A. thaliana have been localized in the endoplasmic reticulum, and the ability of SIP1s for water mobilization has been assessed in Arabidopsis [103] and Vitis vinifera SIPs [104]. Molecular dynamic simulations in the 3D model of PruavSIP1;2 showed water transport across the channel (Mateluna, in preparation), and only differed from PruavSIP1;1 in the third residue of the first NPA, containing a threonine and serine, respectively. These residues are polar and can form interactions with water molecules, suggesting a similar function for both aquaporins. PruavSIP2;1 contained a leucine, which is a more hydrophobic residue in that position. It also had a histidine in the H2 position, which is bigger than a valine of SIP1 and has more propensity to pH changes that may alter the conformation of the ar/R selectivity filter under different conditions, suggesting a different function from the SIP1 subgroup. In this sense, in a yeast heterologous system, both SIP1s detected in A. thaliana (SIP1;1 and SIP1;2) demonstrated water-channel activity but not SIP2;1 [103].
Members of the XIP aquaporin subfamily have been functionally characterized as urea, glycerol, hydrogen peroxide, boric acid, copper, arsenic and nickel transporters, but impermeable to water [105]. However, mimicking the ar/R selectivity filter residues from AtTIP2;1 in Nicotiana benthamiana NbXIP1;1, allowed the permeability of water in such a channel [105]. The tridimensional model of NbXIP1;1 of that study suggests that, despite the pore size being wide enough for water permeability, the presence of hydrophobic residues may prevent the hydrogen bonding required for the passing of water molecules through the channel at the ar/R region. The PruavXIP1;1 also contained hydrophobic residues in the ar/R selectivity filter, but PruavXIP2;1 had a threonine in the H2 position, which could give the hydrogen bonding network required for water mobilization. In addition, the presence of a methionine at P1 of Froger’s residues in PruavXIP1;1 may have a structural function, stabilizing the protein chains, taking in account that this residue tends to form bonds with the amide groups of the nearest amino acids [106,107], suggesting different functions for both XIP aquaporins in P. avium.

4.2. Organ-Specific Expression

The presence of aquaporins has been widely documented in all plant organs or tissues, but the numerous isoforms present gene expressions subjected to temporal and spatial regulation [45,55,108,109,110]. Such transcriptional behavior may be associated with specific roles in the physiological processes of each organ. As expected, the analysis of transcript levels carried out by qPCR revealed a large mRNA variation of the different isoforms of PruavAQPs depending on the plant organ. In rice, expression of some root PIPs and root anatomical properties were correlated with hydraulic traits [111]. In addition, anatomical metanalysis data and qPCR analyses evidenced a root-associated expression of OsNIP2;1, OsTIP2;1, and OsPIP2;3 in comparison with other OsAQPs [112]. In cherry, two NIPs (PruavNIP5;1 and PruavNIP5;2), one TIP (PruavTIP4;1) and one PIP (PruavPIP1;3) were found to be preferentially expressed in root tissues.
At the leaf level, AQP transcriptional changes related to cell expansion and leaf elongation have been reported in Arabidopsis AtTIP1;1 [113], maize ZmPIP1;1, ZmPIP1;2, ZmPIP1;3, ZmPIP2;1 and ZmPIP2;2 [114] and barley (HvPIP1;1, HvPIP1;5, HvPIP2;2, HvPIP2;5, HvTIP1;1, HvTIP2;3 and HvNIP1;1 [115]. Interestingly, ZmAQP transcriptional patterns were correlated with cell water permeability, suggesting an involvement of some AQPs in the leaf growth process. In our study, five PruavAQPs (PruavNIP4;2, PruavTIP1;1, PruavTIP2;2, PruavTIP3;1 and PruavXIP1;1) exhibited a remarkable mRNA accumulation. It should be noted that in this group there were no members of the PIP subfamily, some of which have CO2 transport capacity, but an XIP aquaporin was included as transcriptionally relevant in the context of this organ.
Flowering is the fundamental process that sustains the generation of offspring and the survival of seed plant species. Within the barley genome have been found four AQPs (HvTIP1;1, HvTIP1;2, HvTIP2;3, and HvPIP2;1), predominantly expressed in flowers, with HvTIP1;1 having the highest expression among them [116]. In addition, in Arabidopsis, several members of the TIP subfamily (AtTIP1;3, AtTIP2;1, AtTIP3;1 and AtTIP5;1) were specifically expressed in petals, pointing out their relevance in flowering [117]. Similarly, RhTIP1;1 and LoPIP1 and LoPIP2 showed transcriptional profiles predominantly associated with petals in rose and lily, respectively [118,119].
Apparently, PIPs and TIPs would play an essential role in flower opening and petal expansion via water uptake. In cherry, PruavPIP2;1, PruavPIP2;2, PruavPIP2;4, PruavNIP6;1 and PruavNIP4;2 were grouped into a clade, defined by their marked gene expression in stems, being even higher at the flower level, which was more evident in the case of PIPs. Out of this clade, only two TIPs (PruavTIP1;3 and PruavTIP2;1) showed relevant gene expression at the flower level. Our analysis showed two NIPs to be strongly expressed in flowers, which may be due to the fact that whole flower samples were used, and other reproductive tissues, other than petals, could require boron and/or H2O2 transport functions that justify the expression of PruavNIP6;1 and PruavNIP4;2.

4.3. Expression Profiles of PruavAQPs under Abiotic Stresses

The water balance and the osmotic balance in plants can be negatively impacted as a consequence of abiotic stresses. Expectedly, the expression patterns of Pruav AQPs varied not only in different organs but also under different abiotic stresses.
Counterintuitively, root hypoxia, generally imposed by flooding or waterlogging, triggers a decrease in hydraulic conductivity, which impairs the availability of water in plant tissues and affects photosynthetic parameters [120]. Decreases in root hydraulic conductivity have been associated with PIP down-regulations [121]. On the other hand, the hypoxia-responsive NIP1;1 has been reported as a H2O2 transporter with a relevant role in detoxifying anaerobic-related molecules in cells [10,95]. In roots of cherry plants under hypoxia, PruavXIP1;1, PruavXIP2;1 and PruavNIP4;2 were strongly expressed. Instead, transcript levels showed only slight variations at the leaf level, with PruavPIP2;1 and PruavXIP2;1 being the only up-regulated genes, albeit to a modest extent. Usually, the transcriptional profiles of AQPs are comparatively opposite between root and leaf tissues, but PruavXIP2;1 expression also was up-regulated in leaves of oxygen-deprived plants (Figure 6). This AQP seems to be an interesting candidate to investigate in order to further define its functionality in the whole plant and its utility as a molecular marker for phenotypic selection against hypoxia stress in plant breeding programs.
Restrictions in the water availability can reduce stomatal and root hydraulic conductance, altering the water homeostasis of the plant [122]. In this context, the ability of AQPs to mobilize water between cells and tissues is key in plant adaptation processes. In Arabidopsis, a considerable number of AQP genes were strongly down-regulated upon drought stress, i.e., AtPIP1;3, AtPIP1;5, AtPIP2;2, AtPIP2;3, AtTIP1;1, AtTIP1;2, AtTIP2;1 and AtTIP2;2. However, after almost one day post re-hydration, their transcript levels returned to values like those detected for control plants. On the other hand, AtPIP1;4 and AtPIP2;5 were up-regulated under this stress [108]. Tobacco plants under drought stress reduced the expression of NtPIP1;1 and NtPIP2;1 to reduce osmotic hydraulic conductance in the roots [123]. In the same way, three HvTIP genes (HvTIP1;1, HvTIP1;2 and HvTIP2;3) involved in water transport diminished their transcripts under severe drought, but the expression of another two (HvTIP3;1 and HvTIP4;1) were induced. In addition, several genes returned to expression levels like those detected under optimal irrigation conditions [124].
Under drought treatment, PruavTIP4.1 was shown to be early and strongly down-regulated, but at the leaf level in stressed plants it did not exhibit any alteration. Along with this, PruavNIP6;1, PruavNIP5;2, PruavNIP5;1 and PruavTIP2;2 also showed a decrease in their transcripts, although to a greater extent later (72 h) (Figure 6). On the other hand, PruavXIP2;1, PruavXIP1;1, PruavNIP4;2, PruavNIP2;1, PruavPIP2;1 and PruavNIP4;1 were up-regulated in roots of water-restricted plants. Noteworthy, PruavXIP2;1 and PruavPIP2;1 gene expressions were induced also in leaves under drought stress (Figure 6).
Salinity lowers the osmotic potential of soil solutions, imposing water stress and nutritional imbalance in glycophytes [125]. To some extent, this water stress mimics the effects of drought so that common molecular and biological responses may be found between these two stresses. In a comparative study between two salt-stress-contrasting genotypes of barley, a reduction of hydraulic conductivity was associated with a low expression of HvPIPs after 24 h of 100 mM NaCl treatment [126]. Likewise, a reduction of transcripts of two PIPs (BoPIP1 and BoPIP2) was reported for broccoli plants after an application of 80 mM NaCl [127]. Compared with drought, salt stress alters a greater number of genes in Arabidopsis [128] which may be due to the double nature of this stress, being both an osmotic stress, like that established in drought (acute phase), and an ionic stress (chronic phase). This transcriptional behavior was not evidenced in P. avium under salt stress. Here, most of them showed little or no variation with respect to the levels of transcripts detected in roots of control plants, with the exception of PruavNIP4;2 and PruavNIP7;1, which showed remarkable gene repression and induction, respectively. In leaves, another member of the NIP subfamily (PruavNIP6;1) was repressed and a slight induction was found in PruavPIP2;1 (Figure 6). Here, two members of the NIP subfamily, i.e., PruavNIP4;1 and PruavNIP6;1, could be interesting for developing molecular markers to assist the selection of Prunus rootstock progenies with better physiological performances under salt stress conditions.
Low temperatures can affect plants due to their inherent effects on cellular processes and due to a dehydration phenomenon caused by the freezing of water [129]. Moreover, after an acute drop, a prolonged cold stress can increase the root hydraulic conductivity, as reported in rice. Concomitantly, a coordinated up-regulation of several root AQP genes was observed, highlighting the transcriptional activation of OsPIP2;5 [51]. In A. thaliana, cold acclimation induced the expression of AtPIP1;4 and AtPIP2;5. Additionally, the increase in the amount of PIP2;5 protein was confirmed by immunoblotting. Single and double mutants of these AQPs showed greater sensitivity to freezing temperatures compared with wild-type plants [130]. GhTIP1;1, a vacuolar AQP with water channel activity, is normally expressed in roots and hypocotyl of cotton seedlings, but in response to low temperatures it is rapidly down-regulated in roots and strongly up-regulated in cotyledons. Yeast overexpressing GhTIP1;1 improved their survival to freezing temperatures [50]. In P. avium roots, the greatest transcriptional reconfiguration occurred at the earliest time of stress (6 h), where the marked up-regulation of PruavNIP4;1, PruavXIP1;1, PruavXIP2;2, PruavTIP2;2 and PruavNIP2;1 reached a peak of transcripts that then decreased at 72 h of cold stress, although in most of these cases exceeding the values detected in roots of control plants. It should be noted that PruavNIP4;1 is the AQP most expressed in cherry roots subjected to cold temperatures, but it also shows this pattern in roots under high salinity, so it could be participating in a common response mechanism for both stresses. More studies are needed to understand the mechanisms involved in this fact. In leaves, the great and early accumulation of PruavNIP2;1 transcript in response to cold is remarkable. Noteworthy, this stress is where this AQP shows its greatest transcriptional change, so it could become a selection marker to phenotype sensitivity to low temperatures in Prunus breeding.
High temperatures alter the structure of plant cells, causing an increase in membrane permeability and affecting osmoregulation. In addition, heat stress negatively impacts numerous metabolic and physiological processes and, depending on the severity of the stress, growth inhibition and even plant death [131,132,133,134]. A transcriptome analysis of Rhazya stricta leaves, an evergreen shrub native to extremely hot regions (Western and South Asia), showed the up-regulation of three AQP genes (PIP2;1, PIP1;2 and TIP2;1) in response to high temperature, likely involved in thermotolerance in leaves and also in protection of the photosynthetic apparatus [135]. In S. bicolor (L.) exposed to heat stress, SbPIP1;1, SbPIP1;2, SbTIP1;1, SbTIP3;1, SbNIP2;1 and SbSIP1;2 were significantly up-regulated and SbPIP1;5, SbPIP1;6, SbPIP2;1, SbPIP2;4, SbPIP2;6, SbTIP3;3, SbTIP4;2, SbTIP4;3 and SbNIP3;2 were markedly repressed [73]. This last study showed a notable transcriptional reconfiguration at the AQPs level in this cereal species, which coincides with what was found in the case of cherry plant roots exposed to heat stress, where many members of PruavPIPs, PruavNIPs, PruavTIPs and PruavXIPs were up-regulated. However, in cherry leaves, only PruavXIP2;1, PruavNIP4;2 and PruavPIP2;1 increased their gene expression after 72 h of heat stress treatment. On the other hand, only PruavTIP4;1 and PruavTIP1;1 were strongly down-regulated in heat stressed roots and leaves, respectively. (Figure 6). It is interesting to note that in two related stresses, heat and drought, PruavNIP4;2 consistently showed an induction of its expression at 72 h of the respective treatments. More research is needed to understand the function of this AQP that emerges as a possible molecular marker to select Prunus progenies better adapted to semi-arid or arid environments where the combined stress of water restriction and high temperatures usually occurs.

5. Conclusions

Plant aquaporins have been demonstrated to be important membrane proteins controlling the flux of water and other solutes, all of which are key to the development and survival of plant organisms. There is a large and growing body of evidence showing roles of aquaporins in the plant response to stress, so these are proteins with an interesting capacity as targets for improving crop adaptation to adverse environmental conditions. In this work, we present a comprehensive study of AQP encoding genes in P. avium (‘Mazzard F12/1’ rootstock) on a genome-wide scale. A total of 28 non-redundant AQP genes were identified in Prunus spp. Genomes, which were phylogenetically grouped into five subfamilies (PIP, NIP, TIP, SIP and XIP). Bioinformatic analyses revealed a very high synteny and remarkable conservation of structural features among orthologs of different Prunus genomes. The differences detected at the level of gene promoters of the different PruavAQPs could account for the expression variations associated with each organ and abiotic stress (hypoxia, drought, salinity, cold and heat) analyzed in this study. Based on the transcriptional profiles at the root and leaf level of cherry plants subjected to abiotic stresses, possible candidate genes are proposed for further functional studies and for the development of molecular markers that can assist the progeny selection processes more efficiently in the context of breeding programs for rootstocks and/or varieties of stone fruit species better adapted to sustain food production, despite the challenges imposed by climate change.

Supplementary Materials

The following supporting information can be downloaded at: https://www.mdpi.com/article/10.3390/genes14040940/s1, Table S1: List of qPCR primers for PruavAQPs.

Author Contributions

Conceptualization, A.S. and P.P.; abiotic stress experiments, A.S. and P.P.; bioinformatics analysis, P.M.; gene expression by qPCR, S.S.; gene expression analysis, G.T.; writing—original draft preparation, A.S., P.M., G.T. and P.P.; writing—review and editing, A.S. and P.P.; visualization, A.S. and P.P.; supervision, A.S. and P.P.; funding acquisition, A.S. and P.P. All authors have read and agreed to the published version of the manuscript.

Funding

This research was funded by Fondo Nacional de Desarrollo Científico y Tecnológico (FONDECYT) grant number 1190816 and Agencia Nacional de Investigación y Desarrollo (ANID) grant number R22A10003.

Institutional Review Board Statement

Not applicable.

Informed Consent Statement

Not applicable.

Data Availability Statement

Data are available on request from the corresponding author.

Conflicts of Interest

The authors declare no conflict of interest.

References

  1. Denker, B.M.; Smith, B.L.; Kuhadja, F.P.; Agre, P. Identification, purification and characterization of a novel Mr 28,000 integral membrane protein from erythrocytes and renal tubules. J. Biol. Chem. 1988, 263, 15634–15642. [Google Scholar] [CrossRef] [PubMed]
  2. Chaumont, F.; Tyerman, S.D. Aquaporins: Highly regulated channels controlling plant water relations. Plant Physiol. 2014, 164, 1600–1618. [Google Scholar] [CrossRef] [PubMed]
  3. Maurel, C.; Boursiac, Y.; Luu, D.T.; Santoni, V.R.; Shahzad, Z.; Verdoucq, L. Aquaporins in plants. Physiology 2015, 95, 1321–1358. [Google Scholar]
  4. Zwiazek, J.J.; Xu, H.; Tan, X.; Navarro-Ródenas, A.; Morte, A. Significance of oxygen transport through aquaporins. Sci. Rep. 2017, 7, 40411. [Google Scholar] [CrossRef] [PubMed]
  5. Behera, B.K.; Parhi, J.; Dehury, B.; Rout, A.K.; Khatei, A.; Devi, A.L.; Mandal, S.C. Molecular characterization and structural dynamics of Aquaporin1 from walking catfish in lipid bilayers. Int. J. Biol. Macromol. 2022, 196, 86–97. [Google Scholar] [CrossRef]
  6. Walz, T. The three-dimensional structure of aquaporin-1. Nature 1997, 387, 624–627. [Google Scholar] [CrossRef]
  7. Törnroth-Horsefield, S.; Wang, Y.; Hedfalk, K.; Johanson, U.; Karlsson, M.; Tajkhorshid, E.; Neutze, R.; Kjellbom, P. Structural mechanism of plant aquaporin gating. Nature 2006, 439, 688–694. [Google Scholar] [CrossRef]
  8. Froger, A.; Tallur, B.; Thomas, D.; Delamarche, C. Prediction of functional residues in water channels and related proteins. Protein Sci. 1998, 7, 1458–1468. [Google Scholar] [CrossRef]
  9. Hove, R.; Bhave, M. Plant aquaporins with non-aqua functions: Deciphering the signature sequences. Mol. Biol. 2011, 75, 413–430. [Google Scholar] [CrossRef]
  10. Mateluna, P.; Salvatierra, A.; Solis, S.; Nuñez, G.; Pimentel, P. Involvement of aquaporin NIP1;1 in the contrasting tolerance response to root hypoxia in Prunus rootstocks. J. Plant Physiol. 2018, 228, 19–28. [Google Scholar] [CrossRef]
  11. Maurel, C.; Verdoucq, L.; Luu, D.-T.; Santoni, V. Plant aquaporins: Membrane channels with multiple integrated functions. Annu. Rev. Plant Biol. 2008, 59, 595–624. [Google Scholar] [CrossRef]
  12. Prado, K.; Boursiac, Y.; Tournaire-Roux, C.; Monneuse, J.M.; Postaire, O.; Da Ines, O.; Schäffner, A.R.; Hem, S.; Santoni, V.; Maurel, C. Regulation of Arabidopsis Leaf Hydraulics Involves Light-Dependent Phosphorylation of Aquaporins in Veins. Plant Cell 2013, 25, 1029–1039. [Google Scholar] [CrossRef]
  13. Sato, R.; Maeshima, M. The ER-localized aquaporin SIP2;1 is involved in pollen germination and pollen tube elongation in Arabidopsis thaliana. Plant Mol. Biol. 2019, 100, 335–349. [Google Scholar] [CrossRef]
  14. Kurowska, M.M. Aquaporins in cereals-important players in maintaining cell homeostasis under abiotic stress. Genes 2021, 25, 477. [Google Scholar] [CrossRef]
  15. Su, Y.; Liu, Z.; Sun, J.; Wu, C.; Li, Y.; Zhang, C.; Zhao, L. Genome-wide identification of maize aquaporin and functional analysis during seed germination and seedling establishment. Front. Plant Sci. 2022, 13, 831916. [Google Scholar] [CrossRef]
  16. Webster, A.D. Rootstock and interstock effects on deciduous fruit tree vigour, precocity, and yield productivity. New Zealand J. Crop Hortic. Sci. 1995, 23, 373–382. [Google Scholar] [CrossRef]
  17. Warschefsky, E.J.; Klein, L.L.; Frank, M.H.; Chitwood, D.H.; Londo, J.P.; von Wettberg, E.J.B. Rootstocks: Diversity, domestication, and impacts on shoot phenotypes. Trends Plant Sci. 2016, 21, 418–437. [Google Scholar] [CrossRef]
  18. Schwarz, D. Grafting as a tool to improve tolerance of vegetables to abiotic stresses: Thermal stress, water stress and organic pollutants. Sci. Hortic. 2010, 127, 162–171. [Google Scholar] [CrossRef]
  19. Olden, E.J.; Nybom, N. On the origin of Prunus cerasus L. Hereditas 1968, 59, 327–345. [Google Scholar] [CrossRef]
  20. Iezzoni, A.; Schmidt, H.; Albertini, A. Cherries (Prunus). Genet. Resour. Temp. Fruit Nut Crops 1991, 290, 111–176. [Google Scholar] [CrossRef]
  21. Shirasawa, K.; Isuzugawa, K.; Ikenaga, M.; Saito, Y.; Yamamoto, T.; Hirakawa, H.; Isobe, S. The genome sequence of sweet cherry (Prunus avium) for use in genomics-assisted breeding. DNA Res. 2017, 24, 499–508. [Google Scholar] [CrossRef] [PubMed]
  22. Calle, A.; Cai, L.; Iezzoni, A.; Wünsch, A. High-density linkage maps constructed in sweet cherry (Prunus avium L.) using cross-and self-pollination populations reveal chromosomal homozygosity in inbred families and non-syntenic regions with the peach genome. Tree Genet. Genomes 2018, 14, 37. [Google Scholar] [CrossRef]
  23. Baek, S.; Choi, K.; Kim, G.B.; Yu, H.J.; Cho, A.; Jang, H.; Mun, J.H. Draft genome sequence of wild Prunus yedoensis reveals massive inter-specific hybridization between sympatric flowering cherries. Genome Biol. 2018, 19, 127. [Google Scholar] [CrossRef] [PubMed]
  24. Qi, X.; Liu, C.; Li, L.; Li, M. Arabidopsis EOD3 homologue PaCYP78A6 affects fruit size and is involved in sweet cherry (Prunus avium L.) fruit ripening. Sci. Hortic. 2019, 246, 57–67. [Google Scholar] [CrossRef]
  25. Wang, J.; Liu, W.; Zhu, D.; Po, H.; Shizhong, Z.; Shijun, X.; Yue, T.; Xin, C.; Li, X.; Xiaojuan, Z.; et al. Chromosome-scale genome assem. sweet cherry (Prunus avium L.) cv. Tieton obtained using long-read Hi-C sequencing. Hortic Res. 2020, 7, 122. [Google Scholar] [CrossRef]
  26. Kumar, S.; Stecher, G.; Tamura, K. MEGA11: Molecular Evolutionary Genetics Analysis Version 11. Mol. Biol. Evol. 2021, 38, 3022–3027. [Google Scholar]
  27. Chen, C.; Chen, H.; Zhang, Y.; Thomas, H.R.; Frank, M.H.; He, Y.; Xia, R. TBtools: An Integrative Toolkit Developed for Interactive Analyses of Big Biological Data. Mol. Plant. 2020, 13, 1194–1202. [Google Scholar] [CrossRef]
  28. Edgar, R.C. MUSCLE: Multiple sequence alignment with high accuracy and high throughput. Nucleic Acids Res. 2004, 32, 1792–1797. [Google Scholar] [CrossRef]
  29. Murata, K.; Mitsuoka, K.; Hirai, T.; Walz, T.; Agre, P.; Heymann, J.B.; Engel, A.; Fujiyoshi, Y. Structural determinants of water permeation through aquaporin-1. Nature 2000, 407, 599–605. [Google Scholar] [CrossRef]
  30. Hub, J.S.; de Groot, B.L. Mechanism of selectivity in aquaporins and aquaglyceroporins. Proc. Natl. Acad. Sci. USA 2008, 105, 1198–1203. [Google Scholar] [CrossRef]
  31. Mitani-Ueno, N.; Yamaji, N.; Zhao, F.J.; Ma, J.F. The aromatic/arginine selectivity filter of NIP aquaporins plays a critical role in substrate selectivity for silicon, boron, and arsenic. J. Exp. Bot. 2011, 62, 4391–4398. [Google Scholar] [CrossRef]
  32. Horton, P.; Park, K.J.; Obayashi, T.; Fujita, N.; Harada, H.; Adams-Collier, C.J.; Nakai, K. WoLF PSORT: Protein localization predictor. Nucleic Acids Res. 2007, 35, W585–W587. [Google Scholar] [CrossRef]
  33. Chou, K.C.; Shen, H.B. Plant-mPLoc: A top-down strategy to augment the power for predicting plant protein subcellular localization. PLoS ONE 2010, 5, e11335. [Google Scholar] [CrossRef]
  34. Pimentel, P.; Almada, R.D.; Salvatierra, A.; Toro, G.; Arismendi, M.J.; Pino, M.T.; Sagredo, B.; Pinto, M. Physiological and morphological responses of Prunus species with different degree of tolerance to long-term root hypoxia. Sci. Hortic. 2014, 180, 14–23. [Google Scholar] [CrossRef]
  35. Toro, G.; Pimentel, P.; Salvatierra, A. Effective categorization of tolerance to salt stress through clustering Prunus rootstocks according to their physiological performances. Horticulturae 2021, 7, 542. [Google Scholar] [CrossRef]
  36. Chang, S.; Puryear, J.; Cairney, J. A simple and efficient method for isolating RNA from pine trees. Plant Mol. Biol. 1993, 11, 113–116. [Google Scholar] [CrossRef]
  37. Tong, Z.; Gao, Z.; Wang, F.; Zhou, J.; Zhang, Z. Selection of reliable reference genes for gene expression studies in peach using real-time PCR. BMC Mol. Biol. 2009, 10, 71. [Google Scholar] [CrossRef]
  38. Pfaffl, M.W. A new mathematical model for relative quantification in real-time RT-PCR. Nucleic Acids Res. 2001, 29, e45. [Google Scholar] [CrossRef]
  39. Deshmukh, R.A. A precise spacing between the NPA domains of aquaporins is essential for silicon permeability in plants. Plant J. 2015, 83, 489–500. [Google Scholar] [CrossRef]
  40. Quigley, F.; Rosenberg, J.M.; Shachar-Hill, Y.; Bohnert, H.J. From genome to function: The Arabidopsis aquaporins. Genome Biol. 2001, 3, RESEARCH0001. [Google Scholar] [CrossRef]
  41. Sakurai, J.; Ishikawa, F.; Yamaguchi, T.; Uemura, M.; Maeshima, M. Identification of 33 rice aquaporin genes and analysis of their expression and function. Plant Cell Physiol. 2005, 46, 1568–1577. [Google Scholar] [CrossRef] [PubMed]
  42. Gupta, A.B.; Sankararamakrishnan, R. Genome-wide analysis of major intrinsic proteins in the tree plant Populus trichocarpa: Characterization of XIP subfamily of aquaporins from evolutionary perspective. BMC Plant Biol. 2009, 9, 134. [Google Scholar] [CrossRef] [PubMed]
  43. AR6 Synthesis Report, Climate Change 2023. Available online: https://report.ipcc.ch/ar6syr/pdf/IPCC_AR6_SYR_LongerReport.pdf (accessed on 25 February 2023).
  44. Heckwolf, M.; Pater, D.; Hanson, D.T.; Kaldenhoff, R. The Arabidopsis thaliana aquaporin AtPIP1;2 is a physiologically relevant CO2 transport facilitator. Plant. J. 2011, 67, 795–804. [Google Scholar] [CrossRef] [PubMed]
  45. Sun, H.; Wang, S.; Lou, Y.; Zhu, C.; Zhao, H.; Li, Y.; Li, X.; Gao, Z. A bamboo leaf-specific aquaporin gene PePIP2;7 is involved in abiotic stress response. Plant Cell Rep. 2021, 40, 1101–1114. [Google Scholar] [CrossRef] [PubMed]
  46. Zupin, M.; Sedlar, A.; Kidrič, M.; Meglič, V. Drought-induced expression of aquaporin genes in leaves of two common bean cultivars differing in tolerance to drought stress. J. Plant Res. 2017, 130, 735–745. [Google Scholar] [CrossRef] [PubMed]
  47. Sahitya, U.L.; Krishna, M.S.R.; Suneetha, P. Integrated approaches to study the drought tolerance mechanism in hot pepper (Capsicum annuum L.). Physiol. Mol. Biol. Plants 2019, 25, 637–647. [Google Scholar] [CrossRef]
  48. Xue, H.; Zhang, F.; Zhang, Z.H.; Fu, J.F.; Wang, F.; Zhang, B.; Ma, Y. Differences in salt tolerance between diploid and autotetraploid apple seedlings exposed to salt stress. Sci. Hortic. 2015, 190, 24–30. [Google Scholar] [CrossRef]
  49. Jia, J.; Liang, Y.; Gou, T.; Hu, Y.; Zhu, Y.; Huo, H.; Guo, J.; Gong, H. The expression response of plasma membrane aquaporins to salt stress in tomato plants. Environ. Exp. Bot. 2020, 178, 104190. [Google Scholar] [CrossRef]
  50. Li, D.D.; Tai, F.J.; Zhang, Z.T.; Li, Y.; Zheng, Y.; Wu, Y.F.; Li, X.B. A cotton gene encodes a tonoplast aquaporin that is involved in cell tolerance to cold stress. Gene 2009, 438, 26–32. [Google Scholar] [CrossRef]
  51. Ahamed, A.; Murai-Hatano, M.; Ishikawa-Sakurai, J.; Hayashi, H.; Kawamura, Y.; Uemura, M. Cold stress-induced acclimation in rice is mediated by root-specific aquaporins. Plant Cell Physiol. 2012, 53, 1445–1456. [Google Scholar] [CrossRef]
  52. Wang, Y.; Li, R.; Li, D.; Jia, X.; Zhou, D.; Li, J.; Liu, J. NIP1;2 is a plasma membrane-localized transporter mediating aluminum uptake, translocation, and tolerance in Arabidopsis. Proc. Natl. Acad. Sci. USA 2017, 114, 5047–5052. [Google Scholar] [CrossRef]
  53. Dong, J.; Niu, S.; Qian, J.; Zhou, J.; Zhao, M.; Meng, Y.; Di, B. Identification of Aquaporin Gene Family in Response to Natural Cold Stress in Ligustrum × vicaryi Rehd. Forests 2022, 13, 182. [Google Scholar] [CrossRef]
  54. Simoes-Araujo, J.L.; Alves-Ferreira, M.; Rumjanek, N.G.; Margis-Pinheiro, M. VuNIP1 (NOD26-like) and VuHSP17. 7 gene expression are regulated in response to heat stress in cowpea nodule. Environ. Exp. Bot. 2008, 63, 256–265. [Google Scholar] [CrossRef]
  55. He, W.; Liu, M.; Qin, X.; Liang, A.; Chen, Y.; Yin, Y.; Qin, K.; Mu, Z. Genome-wide identification and expression analysis of the aquaporin gene family in Lycium barbarum during fruit ripening and seedling response to heat stress. Curr. Issues Mol. Biol. 2022, 44, 5933–5948. [Google Scholar] [CrossRef]
  56. Shafqat, W.; Jaskani, M.J.; Maqbool, R.; Chattha, W.S.; Ali, Z.; Naqvi, S.A.; Haider, M.S.; Kha, I.A.; Vincent, C.I. Heat shock protein and aquaporin expression enhance water conserving behavior of citrus under water deficits and high temperature conditions. Environ. Exp. Bot. 2021, 181, 104270. [Google Scholar] [CrossRef]
  57. Reuscher, S.; Akiyama, M.; Mori, C.; Aoki, K.; Shibata, D.; Shiratake, K. Genome-wide identification and expression analysis of aquaporins in tomato. PLoS ONE 2013, 8, e79052. [Google Scholar] [CrossRef]
  58. Madrid-Espinoza, J.; Brunel-Saldias, N.; Guerra, F.P.; Gutiérrez, A.; Del Pozo, A. Genome-wide identification and transcriptional regulation of aquaporin genes in bread wheat (Triticum aestivum L.) under water stress. Genes 2018, 9, 497. [Google Scholar] [CrossRef]
  59. Bao, F.; Ding, A.; Cheng, T.; Wang, J.; Zhang, Q. Genome-wide analysis of members of the wrky gene family and their cold stress response in Prunus mume. Genes 2019, 10, 911. [Google Scholar] [CrossRef]
  60. Ke, L.; Lei, W.; Yang, W.; Wang, J.; Gao, J.; Cheng, J.; Sun, Y.; Fan, Z.; Yu, D. Genome-wide identification of cold responsive transcription factors in Brassica napus L. BMC Plant Biol. 2020, 20, 62. [Google Scholar] [CrossRef]
  61. Dudhate, A.; Shinde, H.; Yu, P.; Tsugama, D.; Gupta, S.K.; Liu, S.; Takano, T. Comprehensive analysis of NAC transcription factor family uncovers drought and salinity stress response in pearl millet (Pennisetum glaucum). BMC Genom. 2021, 22, 70. [Google Scholar] [CrossRef]
  62. Musavizadeh, Z.; Najafi-Zarrini, H.; Kazemitabar, S.K.; Hashemi, S.H.; Faraji, S.; Barcaccia, G.; Heidari, P. Genome-wide analysis of potassium channel genes in rice: Expression of the OsAKT and OsKAT genes under salt stress. Genes 2021, 12, 784. [Google Scholar] [CrossRef] [PubMed]
  63. Yu, P.; Shinde, H.; Dudhate, A.; Tsugama, D.; Gupta, S.K.; Liu, S.; Takano, T. Genome-Wide Investigation of SQUAMOSA Promoter Binding Protein-like Transcription Factor Family in Pearl Millet (Pennisetum glaucum (L.) R. Br.). Plant Gene 2021, 27, 100313. [Google Scholar] [CrossRef]
  64. Li, G.; Jin, L.; Sheng, S. Genome-wide identification of bHLH transcription factor in Medicago sativa in response to cold stress. Genes 2022, 13, 2371. [Google Scholar] [CrossRef] [PubMed]
  65. Chen, Y.; Bishnu, P.K.; Linde, M.; Debener, T.; Alkio, M.; Knoche, M. Expression of putative aquaporin genes in sweet cherry is higher in flesh than skin and most are downregulated during development. Sci. Hortic. 2019, 244, 304–314. [Google Scholar] [CrossRef]
  66. Afzal, Z.; Howton, T.C.; Sun, Y.; Mukhtar, M.S. The roles of aquaporins in plant stress responses. J. Dev. Biol. 2016, 4, 9. [Google Scholar] [CrossRef]
  67. Zhu, Y.-X.; Yang, L.; Liu, N.; Yang, J.; Zhou, X.-K.; Xia, Y.-C.; He, Y.; He, Y.-Q.; Gong, H.-J.; Ma, D.-F.; et al. Genome-wide identification, structure characterization, and expression pattern profiling of aquaporin gene family in cucumber. BMC Plant Biol. 2019, 19, 345. [Google Scholar] [CrossRef]
  68. Zhang, D.Y.; Ali, Z.; Wang, C.B.; Xu, L.; Yi, J.X.; Xu, Z.L.; Liu, X.Q.; He, X.L.; Huang, Y.H.; Khan, I.A.; et al. Genome-wide sequence characterization and expression analysis of major intrinsic proteins in soybean (Glycine max L.). PLoS ONE 2013, 8, e56312. [Google Scholar] [CrossRef]
  69. Zou, Z.; Gong, J.; An, F.; Xie, G.; Wang, J.; Mo, Y.; Yang, L. Genome-wide identification of rubber tree (Hevea brasiliensis Muell. Arg.) aquaporin genes and their response to ethephon stimulation in the laticifer, a rubber-producing tissue. BMC Genom. 2015, 16, 1001. [Google Scholar] [CrossRef]
  70. Ariani, A.; Gepts, P. Genome-wide identification and characterization of aquaporin gene family in common bean (Phaseolus vulgaris L.). Mol. Genet. Genom. 2015, 290, 1771–1785. [Google Scholar] [CrossRef]
  71. Martins, C.; Pedrosa, A.M.; Du, D.; Gonçalves, L.P.; Yu, Q.; Gmitter, F.G.; Costa, M.G. Genome-wide characterization and expression analysis of Major Intrinsic Proteins during abiotic and biotic stresses in sweet orange (Citrus sinensis L. Osb.). PLoS ONE 2015, 10, e0138786. [Google Scholar]
  72. Hu, W.; Hou, X.; Huang, C.; Yan, Y.; Tie, W.; Ding, Z.; Wei, Y.; Liu, J.; Miao, H.; Lu, Z.; et al. Genome-wide identification and expression analyses of aquaporin gene family during development and abiotic stress in banana. Int. J. Mol. Sci. 2015, 16, 19728–19751. [Google Scholar] [CrossRef]
  73. Reddy, P.S.; Rao, T.S.R.B.; Sharma, K.K.; Vadez, V. Genome-wide identification and characterization of the aquaporin gene family in Sorghum bicolor (L.). Plant Gene 2015, 1, 18–28. [Google Scholar] [CrossRef]
  74. Chaumont, F.; Barrieu, F.; Wojcik, E.; Chrispeels, M.J.; Jung, R. Aquaporins constitute a large and highly divergent protein family in maize. Plant Physiol. 2001, 125, 1206–1215. [Google Scholar] [CrossRef]
  75. Johanson, U.; Karlsson, M.; Johansson, I.; Gustavsson, S.; Sjövall, S.; Fraysse, L.; Weig, A.R.; Kjellbom, P. The complete set of genes encoding major intrinsic proteins in Arabidopsis provides a framework for a new nomenclature for major intrinsic proteins in plants. Plant Phys. 2001, 126, 1358–1369. [Google Scholar] [CrossRef]
  76. Tao, P.; Zhong, X.; Li, B.; Wang, W.; Yue, Z.; Lei, J. Genome-wide identification and characterization of aquaporin genes (AQPs) in Chinese cabbage (Brassica rapa ssp. pekinensis). Mol. Genet. Genom. 2014, 289, 1131–1145. [Google Scholar] [CrossRef]
  77. Li, G.; Santoni, V.; Maurel, C. Plant aquaporins: Roles in plant physiology. Biochim. Biophys. Acta 2014, 1840, 1574–1582. [Google Scholar] [CrossRef]
  78. Flexas, J.; Ribas-Carbó, M.; Hanson, D.T.; Bota, J.; Otto, B.; Cifre, J.; McDowell, N.; Medrano, H.; Kaldenhoff, R. Tobacco aquaporin NtAQP1 is involved in mesophyll conductance to CO2 in vivo. Plant J. 2006, 48, 427–439. [Google Scholar] [CrossRef]
  79. Mori, I.C.; Rhee, J.; Shibasaka, M.; Sasano, S.; Kaneko, T.; Horie, T.; Katsuhara, M. CO2 transport by PIP2 aquaporins of barley. Plant Cell Physiol. 2014, 55, 251–257. [Google Scholar] [CrossRef]
  80. Xu, F.; Wang, K.; Yuan, W.; Xu, W.; Shuang, L.; Kronzucker, H.J.; Chen, G.; Miao, R.; Zhang, M.; Ding, M.; et al. Overexpression of rice aquaporin OsPIP1;2 improves yield by enhancing mesophyll CO2 conductance and phloem sucrose transport. J. Exp. Bot. 2018, 70, 671–681. [Google Scholar] [CrossRef]
  81. Wang, X.; Gao, F.; Bing, J.; Sun, W.; Feng, X.; Ma, X.; Zhou, Y.; Zhang, G. Overexpression of the jojoba aquaporin gene, ScPIP1, enhances drought and salt tolerance in transgenic Arabidopsis. Int. J. Mol. Sci. 2019, 20, 153. [Google Scholar] [CrossRef]
  82. Mosa, K.A.; Kumar, K.; Chhikara, S.; Musante, C.; White, J.C.; Dhankher, O.P. Enhanced boron tolerance in plants mediated by bidirectional transport through plasma membrane intrinsic proteins. Sci. Rep. 2016, 6, 21640. [Google Scholar] [CrossRef] [PubMed]
  83. Kumar, K.; Mosa, K.A.; Chhikara, S.; Musante, C.; White, J.C.; Dhankher, O.P. Two rice plasma membrane intrinsic proteins, OsPIP2;4 and OsPIP2;7, are involved in transport and providing tolerance to boron toxicity. Planta 2014, 239, 187–198. [Google Scholar] [CrossRef] [PubMed]
  84. Jang, J.Y.; Rhee, J.Y.; Chung, G.C.; Kang, H. Aquaporin as a membrane transporter of hydrogen peroxide in plant response to stresses. Plant Signal. Behav. 2012, 7, 1180–1181. [Google Scholar] [CrossRef] [PubMed]
  85. Gaspar, M.; Bousser, A.; Sissoeff, I.; Roche, O.; Hoarau, J.; Mahe, A. Cloning and characterization of ZmPIP1-5b, an aquaporin transporting water and urea. Plant Sci. 2003, 165, 21–31. [Google Scholar] [CrossRef]
  86. Frick, A.; Järvå, M.; Ekvall, M.; Uzdavinys, P.; Nyblom, M.; Törnroth-Horsefield, S. Mercury increases water permeability of a plant aquaporin through a non-cysteine-related mechanism. Biochem. J. 2013, 454, 491–499. [Google Scholar] [CrossRef]
  87. Wang, H.; Schoebel, S.; Schmitz, F.; Dong, H.; Hedfalk, K. Quantitative analysis of H2O2 transport through purified membrane proteins. MethodsX 2020, 7, 100816. [Google Scholar] [CrossRef]
  88. Wallace, I.S.; Roberts, D.M. Homology modeling of representative subfamilies of Arabidopsis major intrinsic proteins. Classification based on the aromatic/arginine selectivity filter. Plant Phys. 2004, 135, 1059–1068. [Google Scholar] [CrossRef]
  89. Dean, R.M.; Rivers, R.L.; Zeidel, M.L.; Roberts, D.M. Purification and functional reconstitution of soybean nodulin 26. An aquaporin with water and glycerol transport properties. Biochemistry 1999, 38, 347–353. [Google Scholar] [CrossRef]
  90. Niemietz, C.M.; Tyerman, S.D. Channel-mediated permeation of ammonia gas through the peribacteroid membrane of soybean nodules. FEBS Lett. 2000, 465, 110–114. [Google Scholar] [CrossRef]
  91. Wallace, I.S.; Wills, D.M.; Guenther, J.F.; Roberts, D.M. Functional selectivity for glycerol of the nodulin 26 subfamily of plant membrane intrinsic proteins. FEBS Lett. 2002, 523, 109–112. [Google Scholar] [CrossRef]
  92. Wallace, I.S.; Roberts, D.M. Distinct transport selectivity of two structural subclasses of the nodulin-like intrinsic protein family of plant aquaglyceroporin channels. Biochemistry 2005, 44, 16826–16834. [Google Scholar] [CrossRef]
  93. Ma, J.F.; Tamai, K.; Yamaji, N.; Mitani, N.; Konishi, S.; Katsuhara, M.; Ishiguro, M.; Murata, Y.; Yano, M. A silicon transporter in rice. Nature 2006, 440, 688–691. [Google Scholar] [CrossRef]
  94. Takano, J.; Wada, M.; Ludewig, U.; Schaaf, G.; von Wirén, N.; Fujiwara, T. The Arabidopsis major intrinsic protein NIP5;1 is essential for efficient boron uptake and plant development under boron limitation. Plant Cell 2006, 18, 1498–1509. [Google Scholar] [CrossRef]
  95. Choi, W.G.; Roberts, D.M. Arabidopsis NIP2;1, a major intrinsic protein transporter of lactic acid induced by anoxic stress. J. Biol. Chem 2007, 282, 24209–24218. [Google Scholar] [CrossRef]
  96. Tanaka, M.; Fujiwara, T. Physiological roles and transport mechanisms of boron: Perspectives from plants. Pflug. Arch. 2008, 456, 671–677. [Google Scholar] [CrossRef]
  97. Yang, H.; Menz, J.; Häussermann, I.; Benz, M.; Fujiwara, T.; Ludewig, U. High and Low Affinity Urea Root Uptake: Involvement of NIP5;1. Plant Cell Physiol. 2015, 56, 1588–1597. [Google Scholar] [CrossRef]
  98. Gu, R.; Chen, X.; Zhou, Y.; Yuan, L. Isolation and characterization of three maize aquaporin genes, ZmNIP2;1, ZmNIP2;4 and ZmTIP4;4 involved in urea transport. BMB Rep. 2012, 45, 96–101. [Google Scholar] [CrossRef]
  99. Soto, G.; Alleva, K.; Mazzella, M.A.; Amodeo, G.; Muschietti, J.P. AtTIP1; 3 and AtTIP5; 1, the only highly expressed Arabidopsis pollen-specific aquaporins, transport water and urea. FEBS Lett. 2008, 582, 4077–4082. [Google Scholar] [CrossRef]
  100. Soto, G.; Fox, R.; Ayub, N.; Alleva, K.; Guaimas, F.; Erijman, E.J.; Mazzella, A.; Amodeo, G.; Muschietti, J. TIP5;1 is an aquaporin specifically targeted to pollen mitochondria and is probably involved in nitrogen remobilization in Arabidopsis thaliana. Plant J. 2010, 64, 1038–1047. [Google Scholar] [CrossRef]
  101. Azad, A.K.; Yoshikawa, N.; Ishikawa, T.; Sawa, Y.; Shibata, H. Substitution of a single amino acid residue in the aromatic/arginine selectivity filter alters the transport profiles of tonoplast aquaporin homologs. Biochim. Biophys. Acta Biomembr. 2012, 1818, 1–11. [Google Scholar] [CrossRef]
  102. Dynowski, M.; Mayer, M.; Moran, O.; Ludewig, U. Molecular determinants of ammonia and urea conductance in plant aquaporin homologs. FEBS Lett. 2008, 582, 2458–2462. [Google Scholar] [CrossRef]
  103. Ishikawa, F.; Suga, S.; Uemura, T.; Sato, M.H.; Maeshima, M. Novel type aquaporin SIPs are mainly localized to the ER membrane and show cell-specific expression in Arabidopsis thaliana. FEBS Lett. 2005, 579, 5814–5820. [Google Scholar] [CrossRef] [PubMed]
  104. Noronha, H.; Agasse, A.; Martins, A.P.; Berny, M.C.; Gomes, D.; Zarrouk, O.; Gerós, H. The grape aquaporin VvSIP1 transports water across the ER membrane. J. Exp. Bot. 2013, 65, 981–993. [Google Scholar] [CrossRef] [PubMed]
  105. Ampah-Korsah, H.; Anderberg, H.I.; Engfors, A.; Kirscht, A.; Nordén, K.; Kjellstrom, S.; Johanson, U. The aquaporin splice variant NbXIP1; 1α is permeable to boric acid and is phosphorylated in the N-terminal domain. Front. Plant Sci. 2016, 7, 862. [Google Scholar] [CrossRef]
  106. Pal, D.; Chakrabarti, P. Non-hydrogen bond interactions involving the methionine sulfur atom. J. Biomol. Struct. Dyn. 2001, 19, 115–128. [Google Scholar] [CrossRef]
  107. Biswal, H.S.; Gloaguen, E.; Loquais, Y.; Tardivel, B.; Mons, M. Strength of NH··· S hydrogen bonds in methionine residues revealed by gas-phase IR/UV spectroscopy. J. Phys. Chem. 2012, 3, 755–759. [Google Scholar] [CrossRef] [PubMed]
  108. Venkatesh, J.; Yu, J.W.; Park, S.W. Genome-wide analysis and expression profiling of the Solanum tuberosum aquaporins. Plant Physiol. Biochem. 2013, 73, 392–404. [Google Scholar] [CrossRef] [PubMed]
  109. Kong, W.; Yang, S.; Wang, Y.; Bendahmane, M.; Fu, X. Genome-wide identification and characterization of aquaporin gene family in Beta vulgaris. Peer J. 2017, 5, e3747. [Google Scholar] [CrossRef]
  110. Song, S.; Zhang, D.; Ma, F.; Xing, W.; Huang, D.; Wu, B.; Chen, J.; Chen, D.; Xu, B.; Xu, Y. Genome-Wide identification and expression analyses of the aquaporin gene family in passion fruit (Passiflora edulis), revealing petip3-2 to be involved in drought stress. Int. J. Mol. Sci. 2022, 23, 5720. [Google Scholar] [CrossRef]
  111. Grondin, A.; Mauleon, R.; Vadez, V.; Henry, A. Root aquaporins contribute to whole plant water fluxes under drought stress in rice (Oryza sativa L.). Plant Cell Environ. 2016, 39, 347–365. [Google Scholar] [CrossRef]
  112. Nguyen, M.X.; Moon, S.; Jung, K.H. Genome-wide expression analysis of rice aquaporin genes and development of a functional gene network mediated by aquaporin expression in roots. Planta 2013, 238, 669–681. [Google Scholar] [CrossRef]
  113. Ludevid, D.; Höfte, H.; Himelblau, E.; Chrispeels, M.J. The expression pattern of the tonoplast intrinsic protein γ-TIP in Arabidopsis thaliana is correlated with cell enlargement. Plant Physiol. 1992, 100, 1633–1639. [Google Scholar] [CrossRef]
  114. Hachez, C.; Heinen, R.B.; Draye, X.; Chaumont, F. The expression pattern of plasma membrane aquaporins in maize leaf highlights their role in hydraulic regulation. Plant Mol. Biol. 2008, 68, 337–353. [Google Scholar] [CrossRef]
  115. Besse, M.; Knipfer, T.; Miller, A.J.; Verdeil, J.L.; Jahn, T.P.; Fricke, W. Developmental pattern of aquaporin expression in barley (Hordeum vulgare L.). leaves. J. Exp. Bot. 2011, 62, 4127–4142. [Google Scholar] [CrossRef]
  116. Li, Q.; Tong, T.; Jiang, W.; Cheng, J.; Deng, F.; Wu, X.; Chen, Z.-H.; Ouyang, Y.; Zeng, F. Highly conserved evolution of aquaporin PIPs and TIPs confers their crucial contribution to flowering process in plants. Front. Plant Sci. 2022, 12, 761713. [Google Scholar] [CrossRef]
  117. Alexandersson, E.; Fraysse, L.; Sjövall-Larsen, S.; Gustavsson, S.; Fellert, M.; Karlsson, M. Whole gene family expression and drought stress regulation of aquaporins. Plant Mol. Biol 2005, 59, 469–484. [Google Scholar] [CrossRef]
  118. Xue, J.; Yang, F.; Gao, J. Isolation of Rh-TIP1;1, an aquaporin gene and its expression in rose flowers in response to ethylene and water deficit. Postharvest. Biol. Technol. 2009, 51, 407–413. [Google Scholar] [CrossRef]
  119. Tong, Z.; Li, Q.; Yang, Y.; Dai, F.; Gao, J.; Hong, B. Isolation and expression analysis of LoPIP2, a lily (Lilium Oriental Hybrids) aquaporin gene involved in desiccation-induced anther dehiscence. Sci. Hortic. 2013, 164, 316–322. [Google Scholar] [CrossRef]
  120. Rasheed-Depardieu, C.; Parelle, J.; Tatin-Froux, F.; Parent, C.; Capelli, N. Short-term response to waterlogging in Quercus petraea and Quercus robur: A study of the root hydraulic responses and the transcriptional pattern of aquaporins. Plant Physiol. Biochem. 2015, 97, 323–330. [Google Scholar] [CrossRef]
  121. North, G.B.; Martre, P.; Nobel, P.S. Aquaporins account for variations in hydraulic conductance for metabolically active root regions of Agave deserti in wet, dry, and rewetted soil. Plant Cell Environ. 2004, 27, 219–228. [Google Scholar] [CrossRef]
  122. Siemens, J.A.; Zwiazek, J.J. Changes in water flow properties of solution culture-grown trembling aspen (Populus tremuloides) seedlings under different intensities of water-deficit stress. Physiol. Plant 2004, 121, 44–49. [Google Scholar] [CrossRef] [PubMed]
  123. Mahdieh, M.; Mostajeran, A.; Horie, T.; Katsuhara, M. Drought stress alters water relations and expression of PIP-type aquaporin genes in Nicotiana tabacum Plants. Plant Cell Physiol. 2008, 49, 801–813. [Google Scholar] [CrossRef] [PubMed]
  124. Kurowska, M.M.; Wiecha, K.; Gajek, K.; Szarejko, I. Drought stress and re-watering affect the abundance of TIP aquaporin transcripts in barley. PLoS ONE 2019, 14, e0226423. [Google Scholar] [CrossRef] [PubMed]
  125. Evelin, H.; Kapoor, R.; Giri, B. Arbuscular mycorrhizal fungi in alleviation of salt stress: A review. Ann. Bot. 2009, 104, 1263–1280. [Google Scholar] [CrossRef] [PubMed]
  126. Katsuhara, M.; Rhee, J.Y.; Sugimoto, G.; Chung, G.C. Early response in water relations influenced by NaCl reflects tolerance or sensitivity of barley plants to salinity stress via aquaporins. Soil Sci. Plant Nutr. 2011, 57, 50–60. [Google Scholar] [CrossRef]
  127. Muries, B.; Faize, M.; Carvajal, M.; Martínez-Ballesta, M. Identification and differential induction of the expression of aquaporins by salinity in broccoli plants. Mol Biosyst. 2011, 7, 1322–1335. [Google Scholar] [CrossRef]
  128. Chaves, M.M.; Flexas, J.; Pinheiro, C. Photosynthesis under drought and salt stress: Regulation mechanisms from whole plant to cell. Ann. Bot. 2009, 103, 551–560. [Google Scholar] [CrossRef]
  129. Beck, E.H.; Heim, R.; Hansen, J. Plant resistance to cold stress: Mechanisms and environmental signals triggering frost hardening and dehardening. J. Biosci. 2004, 29, 449–459. [Google Scholar] [CrossRef]
  130. Rahman, A.; Kawamura, Y.; Maeshima, M.; Rahman, A.; Uemura, M. Plasma membrane aquaporin members PIPs act in concert to regulate cold acclimation and freezing tolerance responses in Arabidopsis thaliana. Plant Cell Physiol. 2020, 61, 787–802. [Google Scholar] [CrossRef]
  131. Zhang, L.; Li, Y.; Xing, D.; Gao, C. Characterization of mitochondrial dynamics and subcellular localization of ROS reveal that HsfA2 alleviates oxidative damage caused by heat stress in Arabidopsis. J. Exp. Bot. 2009, 7, 2073–2091. [Google Scholar] [CrossRef]
  132. Grover, A.; Mittal, D.; Negi, M.; Lavania, D. Generating high temperature tolerant transgenic plants: Achievements and challenges. Plant Sci. 2013, 205–206, 38–47. [Google Scholar] [CrossRef]
  133. Liu, Z.; Xin, M.; Qin, J.; Peng, H.; Ni, Z.; Yao, Y. Temporal transcriptome profiling reveals expression partitioning of homeologous genes contributing to heat and drought acclimation in wheat (Triticum aestivum L.). BMC Plant Biol. 2015, 15, 152. [Google Scholar] [CrossRef]
  134. Guo, M.; Liu, J.H.; Ma, X.; Luo, D.X.; Gong, Z.H.; Lu, M.H. The plant heat stress transcription factors (HSFs): Structure, regulation, and function in response to abiotic stresses. Front. Plant Sci. 2016, 7, 114. [Google Scholar] [CrossRef]
  135. Obaid, A.Y.; Sabir, J.S.; Atef, A.; Liu, X.; Edris, S.; El-Domyati, F.M.; Jansen, R.K. Analysis of transcriptional response to heat stress in Rhazya stricta. BMC Plant Biol. 2016, 16, 252. [Google Scholar] [CrossRef]
Figure 1. Analysis of synteny and chromosomal distribution of gene aquaporins from Prunus spp. PAC(1–8) represent the eight chromosomes from P. avium. The same case for P. mume, represented chromosomes as PMC(1–8), P. persica with PPC(1–8), P. armeniaca with PRC(1–8), P. dulcis with PDC(1–8) and P. salicina with PSC(1–8). Aquaporins with unplaced locations in P. mume are represented in PMC0 with reduced size so as to not distort the image.
Genes 14 00940 g001
Figure 2. Phylogenetic tree of identified aquaporins in P. avium and other plant species. Open circles represent sequences from P. avium. Black dots represent sequences from P. salicina. Black squares represent P. dulcis sequences. Black rhombi represent sequences from P. armeniaca. Black triangles represent sequences from P. mume. Upside down black triangles represent sequences from P. persica.
Genes 14 00940 g002
Figure 3. Analysis of cis-acting regulatory elements of the aquaporin gene family of P. avium. A total of 2000 bp promoter sequences of 28 aquaporin genes were analyzed using the PlantCARE database. Different color boxes represent the cis-acting regulatory elements for stress response.
Genes 14 00940 g003
Figure 4. Exon–intron structure analysis of 28 P. avium aquaporins. Green rectangles represent exons. Blue rectangles represent the 5′ and 3′ UTR. Lines represent introns.
Genes 14 00940 g004
Figure 5. Heatmap and hierarchical clustering of the expression profiles of all AQP genes in different cherry tissues. The expression abundance of each transcript (log2 of qPCR analysis fold-change values, three biological and two technical replicates) is represented by a color range from yellow (higher expression) to black (lower expression). White: not detected at transcript levels. For each AQP gene, transcript levels were calculated using its mRNA abundance detected in roots as reference for the rest of the organs.
Genes 14 00940 g005
Figure 6. Heatmap and hierarchical clustering of the expression profiles of all AQP genes under different abiotic stress treatments. The expression abundance of each transcript (log2 of qPCR analysis fold-change values, three biological and two technical replicates) is represented by a color range from yellow (higher expression) to dark blue (lower expression). Gray: not detected transcript levels. For each AQP gene, transcript levels were calculated using its mRNA abundance detected in the control condition (6 h) as reference for the rest of the samples. (A) leaf, (B) root.
Genes 14 00940 g006
Table 1. Structural and subcellular localization analysis of P. avium aquaporins. SF: subfamily; AA: amino acids; WP: Wolf PSORT; PP: plant mPloc; TDP: hidden Markov model transmembrane domain prediction; Mw: molecular weight (kDa); Ip: isoelectric point; FR: Froger’s residues; Ka/Ks: nonsynonymous (Ka) and synonymous (Ks) calculation. GRAVY: grand average of hydropathy. Plas: plasma membrane; Vacu: vacuole; CM: cell membrane; VC: vacuole.
SFAQPAANPA INPA IIar/RWPPPTDPMwIpFRKa/KsGRAVY
PruavNIP1;1281NPANPAWVARPlasCM629.779.30FSAYI0.60.432
PruavNIP2;1291NPANPAGSGRPlasCM630.918.64LTAYV0.630.287
PruavNIP4;1267NPANPAWVARPlasCM628.186.41LSAYF0.170.722
NIPPruavNIP4:2248NPANPAWVARPlasCM626.066.40LSAYI0.190.732
PruavNIP5;1298NPSNPISIGRPlasCM631.267.64FTAYI0.110.517
PruavNIP5;2280NPSNPVA-GRVacuCM529.288.85FTAYL0.580.298
PruavNIP6;1307NPSNPVTIARPlasCM631.898.34FTAYL0.140.415
PruavNIP7;1300NPANPAAVGRPlasCM631.995.82YSAYI0.230.535
PruavPIP1;1286NPANPAFHTRPlasCM530.799.28ESAFW0.450.282
PruavPIP1;2290NPANPAFIGRPlasCM630.859.20QSAFW0.360.379
PruavPIP1;3286NPANPAFHTRPlasCM630.669.25QSAFW0.310.331
PIPPruavPIP2;1287NPANPAFHTRPlasCM630.528.94QSAFW0.250.511
PruavPIP2;2281NPANPAFHTRPlasCM630.047.00QSAFW0.380.420
PruavPIP2;3284NPANPAFHTRPlasCM630.076.89QSAFW0.290.505
PruavPIP2;4281NPANPAFHTRPlasCM629.839.00QSAFW0.410.415
PruavSIP1;1240NPSNPAAVPNVacuCM.VC525.189.82MAAYW0.350.896
SIPPruavSIP1;2244NPTNPATVPNChloCM.VC625.889.52MAAYW0.220.755
PruavSIP2;1236NPLNPASHGSPlasCM425.809.52FVAYW0.530.538
PruavTIP1;1252NPANPAHIAVPlasVC625.945.54TSAYW0.180.769
PruavTIP1;2252NPANPAHIAVVacuVC626.084.78TSAYW0.250.884
PruavTIP1;3252NPANPAHIAVPlasVC626.156.12TSAYW0.410.735
TIPPruavTIP2;1248NPANPAHIGRPlasVC725.406.26TSAYW0.550.941
PruavTIP2;2248NPANPAHIGRPlasVC625.174.86TSAYW0.440.982
PruavTIP3;1256NPANPAHIGRPlasVC627.267.11TAAYW0.580.530
PruavTIP4;1249NPANPAHIARVacuVC726.245.54TSAYW0.540.821
PruavTIP5;1255NPANPANVGCPlasCM.VC625.846.81VAAYW0.060.842
XIPPruavXIP1;1304SLVSPAVIVRPlasCM632.175.97MCAFW0.430.725
PruavXIP2;1314NPVNPAITVRPlasCM733.857.74VCAFW0.550.665
Table 2. Functional inference based on the specificity-determining positions analysis of sweet cherry aquaporins. Differences in residues are marked with grey.
SubstrateAquaporinSpecificity-Determining Positions
SDP1SDP2SDP3SDP4SDP5SDP6SDP7SDP8SDP9
Ammonia
Transporter
F/TK/L/N/VF/TV/L/TAD/SA/H/LE/P/SA/R/T
PruavTIP2;1TLILATHPV
Boric Acid
Transporter
T/VI/VH/IPEI/LI/L/TA/TA/G/K/P
PruavPIP1:1TIHPELLTP
PruavPIP1:2TIHPELLTP
PruavPIP1:3TIHPELLTP
PruavPIP2;1TIHPEILTP
PruavPIP2;2TIHPEILTP
PruavPIP2;3TIHPEILTP
PruavPIP2;4TIHPEILTP
PruavNIP1;1VIHPELMAP
PruavNIP2;1VIHPEIIAP
PruavNIP4;1VIHPEIFAP
PruavNIP4;2VIHPELFAP
PruavNIP5;1VIHPEVLAP
PruavNIP5;2VIHPELLAP
PruavNIP6;1VIHPELLAE
PruavNIP7;1IIHPELLTP
PruavXIP2;1TIHPEITTV
CO2 Transporter I/L/VICAI/VDWDW
PruavPIP1;1VITAIDWDW
PruavPIP1;3VITAIDWDW
PruavPIP2;2VISAVDWDW
H2O2
Transporter
A/SA/GL/VA/F/L/T/VI/L/VH/I/L/QF/YA/VP
PruavNIP2;1SALLVIYVP
PruavNIP4;1SALLVLYAP
PruavNIP5;1SALVILYVP
PruavPIP1;1AGVFIHFVP
PruavPIP1;2AGVFIHFVP
PruavPIP1;3AGVFIHFVP
PruavPIP2;1AGVFIQFVP
PruavPIP2;2AGVFIQFLP
PruavPIP2;3AGVFIQFVP
PruavPIP2;4AGVIIQFVP
PruavTIP1;1SALAIHYAP
PruavTIP1;3AALVIHYVP
PruavTIP2;1AALVINYVP
PruavTIP2;2SALVINYVP
PruavTIP3;1AALVIHYVP
PruavTIP5;1SALTIQYVP
PruavXIP2;1AGLVVHFVP
Silicic
acid Transporter
C/SF/YA/E/LH/R/YGK/N/TRE/S/TA/K/P/T
PruavNIP2;1SFVHGNRSN
Urea
Transporter
HPF/I/L/TA/C/F/LL/MA/G/PG/SG/SN
PruavNIP1;1HPIALPGSN
PruavNIP2;1HPLAMPGSN
PruavNIP5;1HPIALPGSN
PruavNIP5;2HPIALPGSN
PruavPIP1;1HPFFLPGGN
PruavPIP1;2HPFFLPGGN
PruavPIP1;3HPFFLPGGN
PruavPIP2;1HPFFLPGGN
PruavPIP2;2HPFFLPGGN
PruavPIP2;3HPFFLPGGN
PruavPIP2;4HPFFLPGGN
PruavTIP1;1HPFFLAGSN
PruavTIP1;2HPFFLAGSN
PruavTIP1;3HPFALPGSN
PruavTIP2;1HPFALPGSN
PruavTIP2;2HPLALPGSN
PruavTIP3;1HPFLLPGSN
PruavTIP4;1HPLLLAGSN
PruavTIP5;1HPFALPGSN
PruavXIP1;1HLFAVGGGN
Disclaimer/Publisher’s Note: The statements, opinions and data contained in all publications are solely those of the individual author(s) and contributor(s) and not of MDPI and/or the editor(s). MDPI and/or the editor(s) disclaim responsibility for any injury to people or property resulting from any ideas, methods, instructions or products referred to in the content.

