Communication

Retinal Phenotyping of a Murine Model of Lafora Disease

1
Department of Ophthalmology and Vision Sciences, Hospital for Sick Children, Toronto, ON M5G 1X8, Canada
2
Genetics and Genome Biology, Hospital for Sick Children, Toronto, ON M5G 0A4, Canada
3
Department of Ophthalmology and Vision Sciences, University of Toronto, Toronto, ON M5T 3A9, Canada
4
The Center for Phenogenomics, Toronto, ON M5T 3H7, Canada
5
Division of Neurology, Department of Pediatrics, University of Texas Southwestern Medical Center, Dallas, TX 75390, USA
*
Authors to whom correspondence should be addressed.
Genes 2023, 14(4), 854; https://doi.org/10.3390/genes14040854
Submission received: 7 February 2023 / Revised: 24 March 2023 / Accepted: 27 March 2023 / Published: 31 March 2023
(This article belongs to the Topic Animal Models of Human Disease)

Abstract

:
Lafora disease (LD) is a progressive neurologic disorder caused by biallelic pathogenic variants in EPM2A or EPM2B, leading to tissue accumulation of polyglucosan aggregates termed Lafora bodies (LBs). This study aimed to characterize the retinal phenotype in Epm2a−/− mice by examining knockout (KO; Epm2a−/−) and control (WT) littermates at two time points (10 and 14 months, respectively). In vivo exams included electroretinogram (ERG) testing, optical coherence tomography (OCT) and retinal photography. Ex vivo retinal testing included Periodic acid Schiff Diastase (PASD) staining, followed by imaging to assess and quantify LB deposition. There was no significant difference in any dark-adapted or light-adapted ERG parameters between KO and WT mice. The total retinal thickness was comparable between the groups and the retinal appearance was normal in both groups. On PASD staining, LBs were observed in KO mice within the inner and outer plexiform layers and in the inner nuclear layer. The average number of LBs within the inner plexiform layer in KO mice were 1743 ± 533 and 2615 ± 915 per mm2, at 10 and 14 months, respectively. This is the first study to characterize the retinal phenotype in an Epm2a−/− mouse model, demonstrating significant LB deposition in the bipolar cell nuclear layer and its synapses. This finding may be used to monitor the efficacy of experimental treatments in mouse models.

1. Introduction

Lafora Disease (LD), first described in 1911 [1], is a rare progressive myoclonus epilepsy due to biallelic pathogenic variants in EPM2A or EPM2B [2,3,4]. The disease typically manifests in adolescence with focal visual seizures or visual hallucinations [5]. This is soon followed by action and stimulus-sensitive myoclonus, as well as tonic-clonic and absence seizures [6,7]. Neuro-psychiatric symptoms that include behavioural changes, depression and apathy are also often seen early in the disease [5,6,7]. These initial symptoms rapidly deteriorate, and patients develop progressive dementia, psychosis, cerebellar ataxia, dysarthria, muscle wasting and respiratory failure that invariably leads to death within a decade [4,5,6,7,8]. In early disease, electroencephalography (EEG) typically shows spikes and polyspikes on a slowed background, both when awake and during sleep [6,9,10,11,12]. As the disease progresses, EEG demonstrates long bursts of diffuse spike-waves and fast polyspikes associated with myoclonic jerks and enhanced by photic stimulation [6,9,10,11,12]. Although, subjects with LD typically retain good visual acuity and color vision [13,14], retinal structure and function are often abnormal [13,14,15]. For instance, on full-field electroretinogram (ERG) testing, a generalized cone dysfunction is commonly observed [13,14]; additional involvement of the rod bipolar system may be seen in some patients [13]. Optical coherence tomography (OCT), an in vivo imaging technique, shows preservation of retinal lamination [13], but regional thinning is described in some patients [15]. Further, adaptive optics scanning light ophthalmoscopy (AOSLO), a non-invasive technique capable of resolving single-cell structures, shows nummular hyperreflective structures within the retinal nerve fiber layer in LD [15].
Lafora Disease has been reported in multiple dog breeds [16,17,18,19,20] as an autosomal recessive trait caused by repeat expansion variation in NHLRC1 (EPM2B) [19,20,21,22], with an average age of disease onset of 7 years [18,19,23,24]. The common manifestations in dogs include spontaneous and reflex myoclonus, hypnic myoclonus, generalized tonic-clonic and focal seizures, and jaw smacking [24]. The disease symptoms progressively intensify, and dogs are typically euthanized in late disease [20,24,25]. The EEG findings in dogs are similar to human LD and include spontaneous or visually evoked solitary spikes, bursts or polyspikes, with the latter being easily evoked by photic stimulation [21,26]. Impaired vision or blindness has been described in about 40% of affected dogs in late disease stages and is uncommon in early disease [24]; however, the cause for vision impairment is currently unknown. Knockout mouse models of Epm2a−/− and Epm2b−/− have been generated [27,28,29]. The Epm2a−/− mice developed behavioral abnormalities at 4 months of age, motor coordination and memory deficits between 4 and 8 months, and myoclonus by 9 months [27,30]; these deficits worsen over time [30]. Older Epm2a−/− mice showed spike and slow-wave formation on EEG; notably, the regular and well-formed diffuse 3–6 Hz spike-wave complexes found in human LD are absent in this mouse model even at 1 year of age [27]. However, one study reported epileptiform activity in Epm2a−/− mice as young as 3 months [30]. The Epm2b−/− mice developed impaired motor coordination, memory deficits and epileptiform activity including tonic-clonic seizures between 3 and 8 months of age that progressively worsened [30,31]; however, a different strain of Epm2b−/− showed no behavioural, cognitive or learning abnormalities up to 11 months of age, suggesting variability between genetic strains [29]. The EEG of these mice showed spontaneous slow spike, spike-wave, and poly spike-wave complexes with or without corresponding myoclonic jerks [30].
A pathological hallmark of LD is the progressive deposition of polyglucosan aggregates in tissues, termed Lafora Bodies (LBs) [1]. In humans, LBs have been identified in the brain, liver, skeletal and cardiac muscle, sweat glands and retina [32,33,34,35,36,37]. In canine LD, LBs have been identified in the brain, liver, apocrine and eccrine sweat glands, and muscle tissue [20,23,25,38]. In Epm2a and Epm2b knock-out (KO) mice, LBs were identified in the various regions of the brain, footpads, as well as skeletal and cardiac muscles [27,28].
Currently, multiple therapeutic options are being pursued for LD [39]. Since the retina can be easily assessed to monitor treatment efficacy, identification of a retinal phenotype in an animal model of LD could accelerate the development of such therapies. Hence, the current study, aimed to ascertain and characterize the retinal phenotype in a KO model of Lafora disease (Epm2a−/−) by performing in-depth in vivo and ex vivo assessments.

2. Materials and Methods

2.1. Mouse Line

The Epm2a−/− KO mice were a gift from Drs. Subramaniam Ganesh and Antonio Delgado–Escueta. Briefly, the mice were generated by deleting the dual-specificity phosphatase domain (DPSD) coding region (exon 4) of the Epm2a gene and replacing it with a neomycin resistance gene via homologous recombination [27]. The absence of gene expression was verified by the Northern blot and RT-PCR analysis of brain and liver tissue from homozygous mutant animals using probes to the DSPD and upstream exons 1–3 [27]. Mice were housed in individually ventilated cages at 20 to 22 °C with access to water and food. Animal procedures were approved by The Centre for Phenogenomics Animal Care Committee and in compliance with the Canadian Council for Animal Care Guidelines.

2.2. Electroretinogram Testing, Retinal Photography and Optical Coherence Tomography

Five knockouts (KO; Epm2a−/−) and control (WT) littermates were examined at two time points (10 and 14 months, respectively). After overnight dark adaptation (DA), pupils were dilated using tropicamide 1% and phenylephrine 2.5% eye drops. Subsequently, mice were injected with 0.01 mL/g body weight of anesthetic solution (combination of 100 mg/mL Ketamine and 20 mg/mL Xylazine). Binocular electroretinogram (ERG) testing was then performed using the Lab Cradle (Diagnosys LLC) system. A DA (scotopic) intensity series ERG was performed (9 steps; 0.0025–10 cd·s·m−2) followed by a 10-min light adaptation (LA; 30 cd.m−2). Subsequently, LA ERGs were performed using a 5 cd·s·m−2 stimulus flash to four stimulus frequencies (5, 10, 15 and 20 Hz). For analysis, the ERG from the eye with superior technical quality was chosen. If responses from either eye were similar, the right eye was chosen. Both a-wave and b-wave amplitudes were measured for the steps of the DA ERG. The a-wave amplitude was measured from the baseline to the trough of the first negative waveform, whilst the b-wave amplitude was measured from the trough of the a-wave to the peak of the subsequent positive waveform. The a-wave amplitudes were measured for 7 light intensities (DA 0.01 cd·s·m−2 to DA 10 cd·s·m−2) and the b-wave amplitudes were measured for all steps of the DA ERG. For the LA ERG, the trough-to-peak amplitude of the responses was calculated for all four stimulus frequencies.
After ERG testing, fundus imaging and retinal OCT were performed using Phoenix MICRON-III™. Retinal photographs were obtained from either eye to ascertain any visible retinal abnormalities. For OCT, horizontal single line scans (1.8 mm diameter, 1.02 µm depth) were performed centered at the optic disc and at regions dorsal and ventral to the disc in each eye. The OCT allows for the detection of changes to the retinal thickness and lamination; also, the OCT can detect abnormal retinal deposition or any disruption to the retinal layers [40,41,42,43]. For quantifying retinal thickness, a horizontal line scan from the right eye, close to the optic disc was chosen in each mouse. Next, using ImageJ (Version 1.53t), the distance between the retinal pigment epithelium and the internal limiting membrane was manually calculated from three different locations from within the scan (Figure 1E) and was averaged to obtain the average retinal thickness in each mouse.

2.3. Histological Analysis

After the ERG and OCT testing, animals were sacrificed by cervical dislocation. Eyes were removed and immediately fixed in 10% buffered formalin followed by paraffin embedding. Paraffin-embedded retinal tissue was sectioned and stained with the Periodic acid Schiff-Diastase (PASD) at The Centre for Phenogenomics Pathology Services, Toronto. PASD is a sensitive histochemical method to assess for glycogen; diastase application depolymerises glycogen to maltose and glucose, which are washed out of the slide [44]. The LBs are polyglucosan aggregates resistant to diastase and as such are easily identifiable after PASD staining [6,45,46]. After PASD staining, slides were imaged at 40× using 3DHistech Pannoramic Flash II Slide Scanner at the Hospital for Sick Children Imaging facility, Toronto. Slides were analyzed using 3DHistech CaseViewer software and LBs were counted using 3DHistech QuantCenter. Briefly, regions of interest were selected on the retina sections, and a scenario was built in QuantCentre that distinguishes LBs from the background and other structures within the inner plexiform layer (IPL). The same scenario was used for both WT and KO samples to count LBs.

3. Results

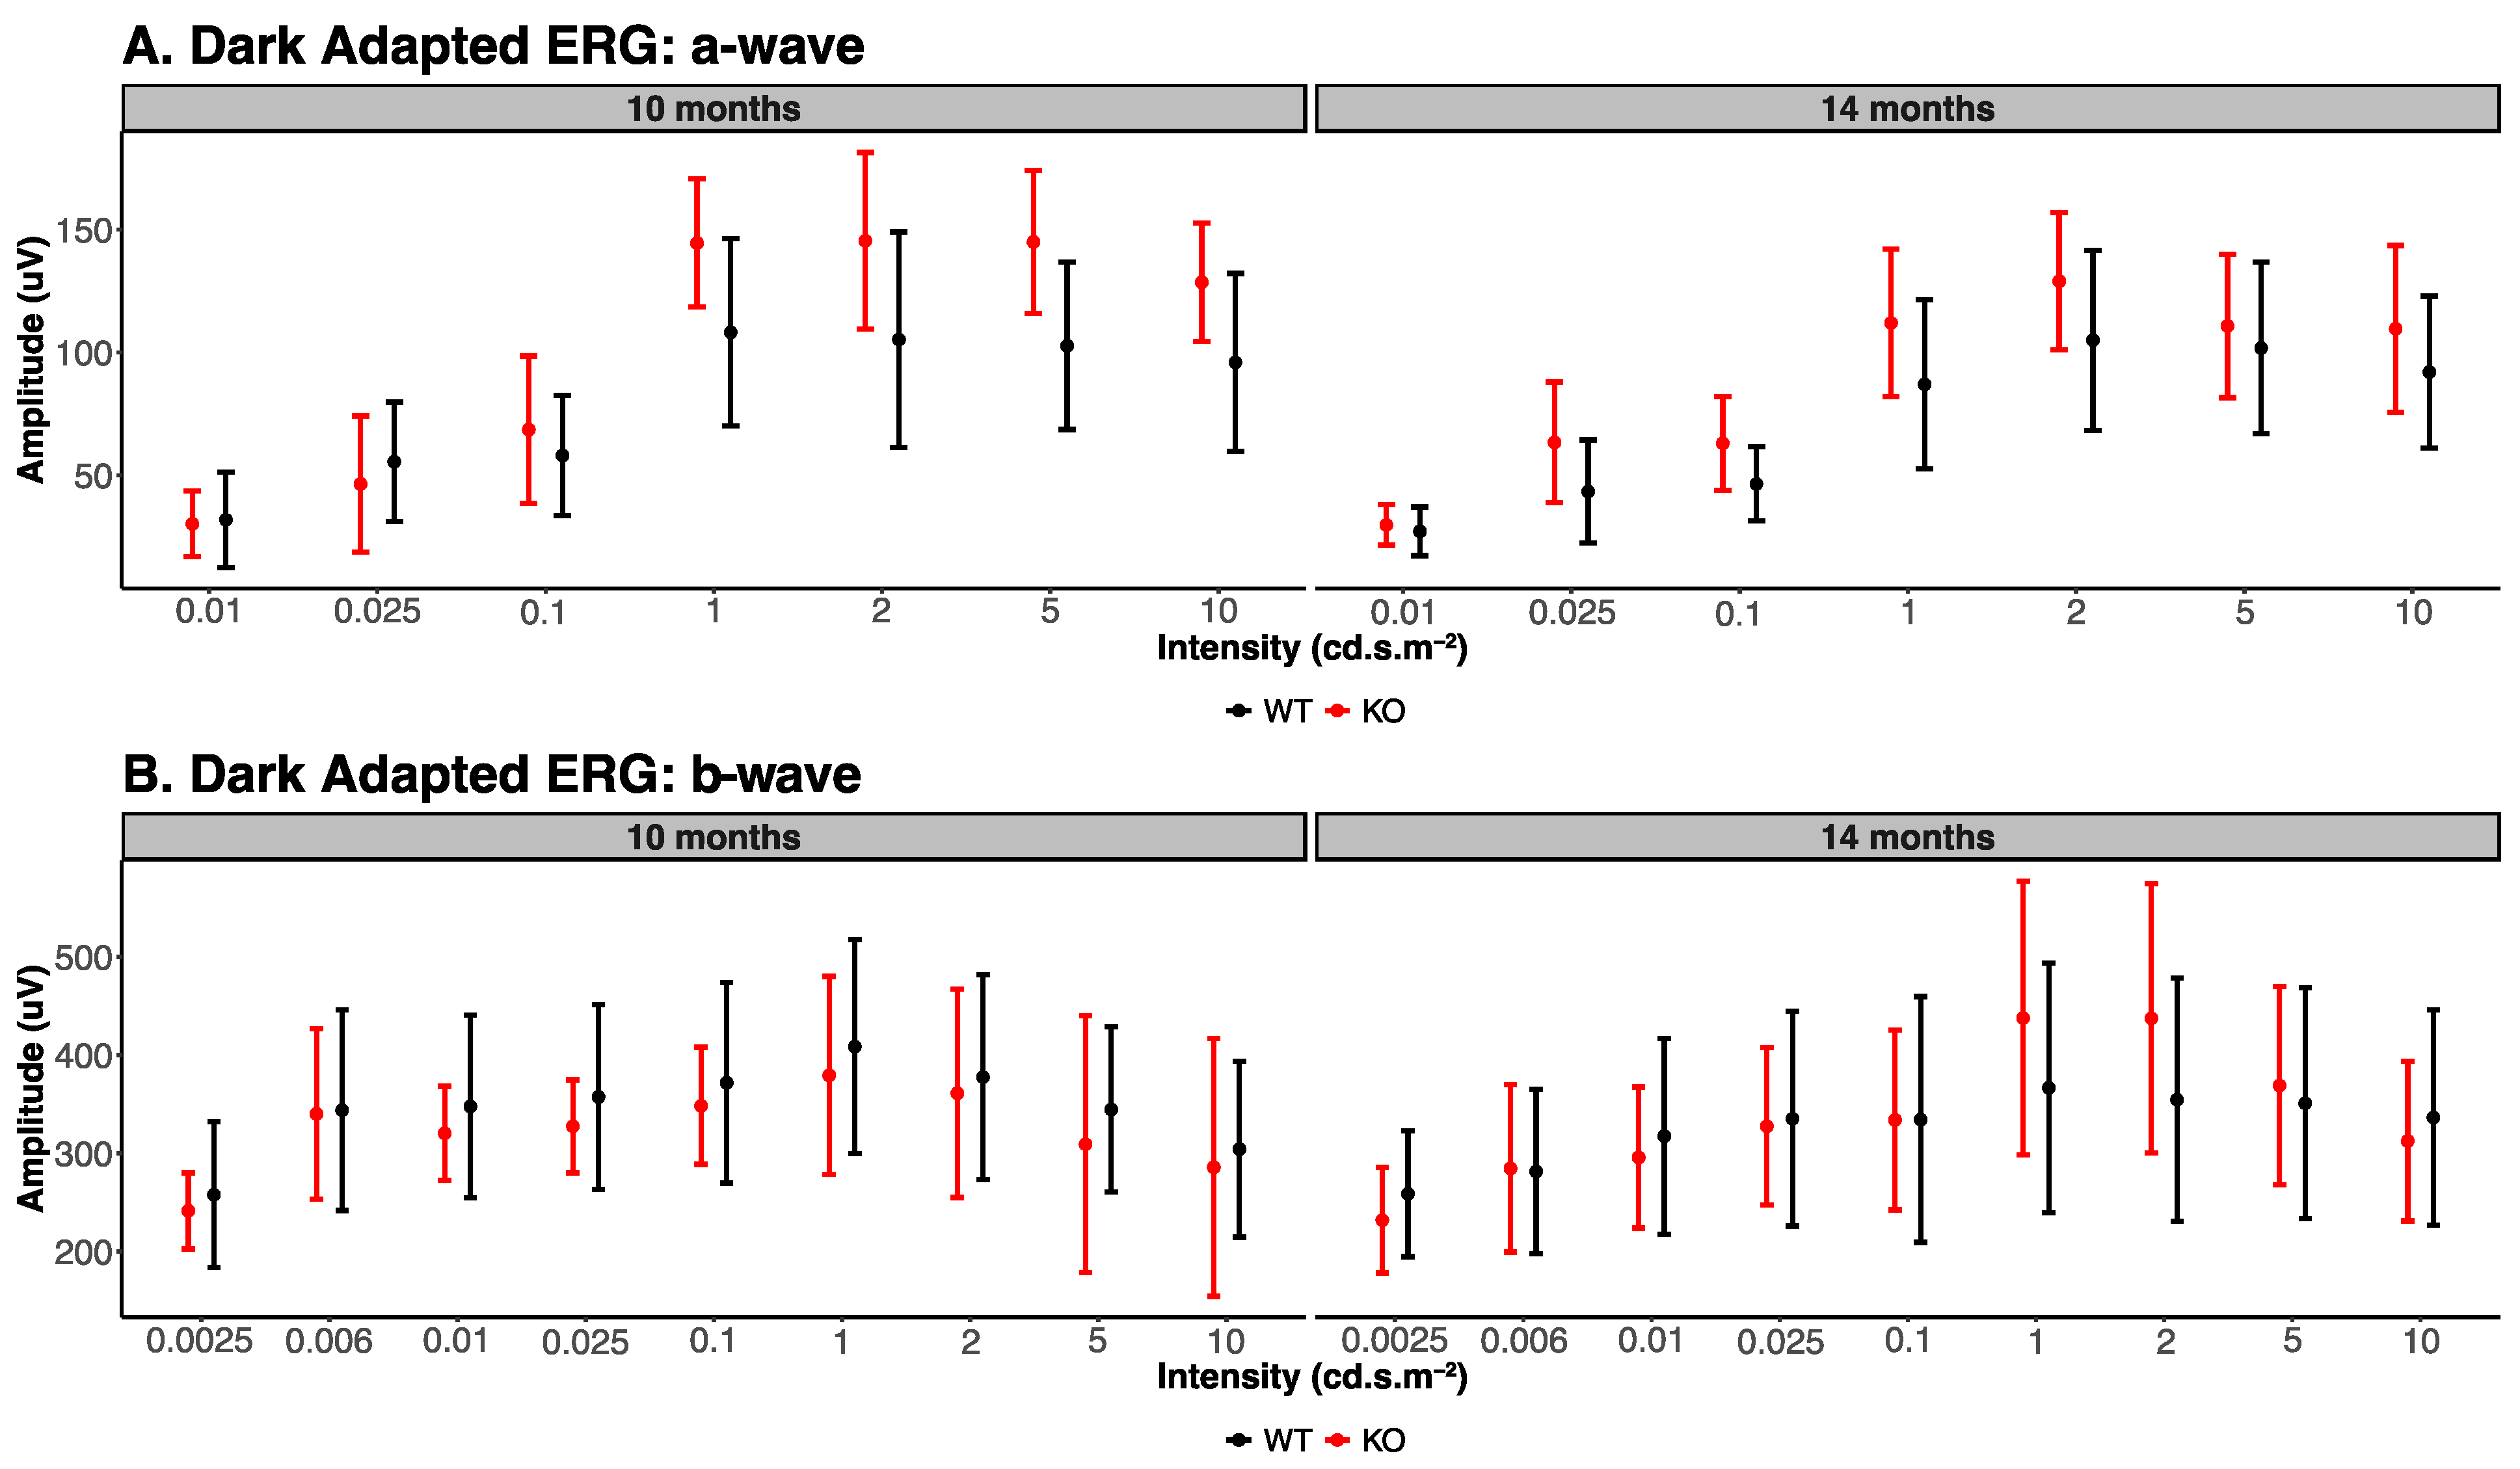
3.1. Electroretinogram Analysis

Full-field ERG was performed to assess the effects of LBs deposition on retinal function. Table 1 and Figure 1A–C details the summary of the ERG findings. Briefly, there was no significant difference seen for any of the a- or b-wave amplitude measures of the DA ERG, between KO and WT mice, at either time point. Similarly, LA ERG amplitudes showed no significant difference between KO and WT mice at both time points.

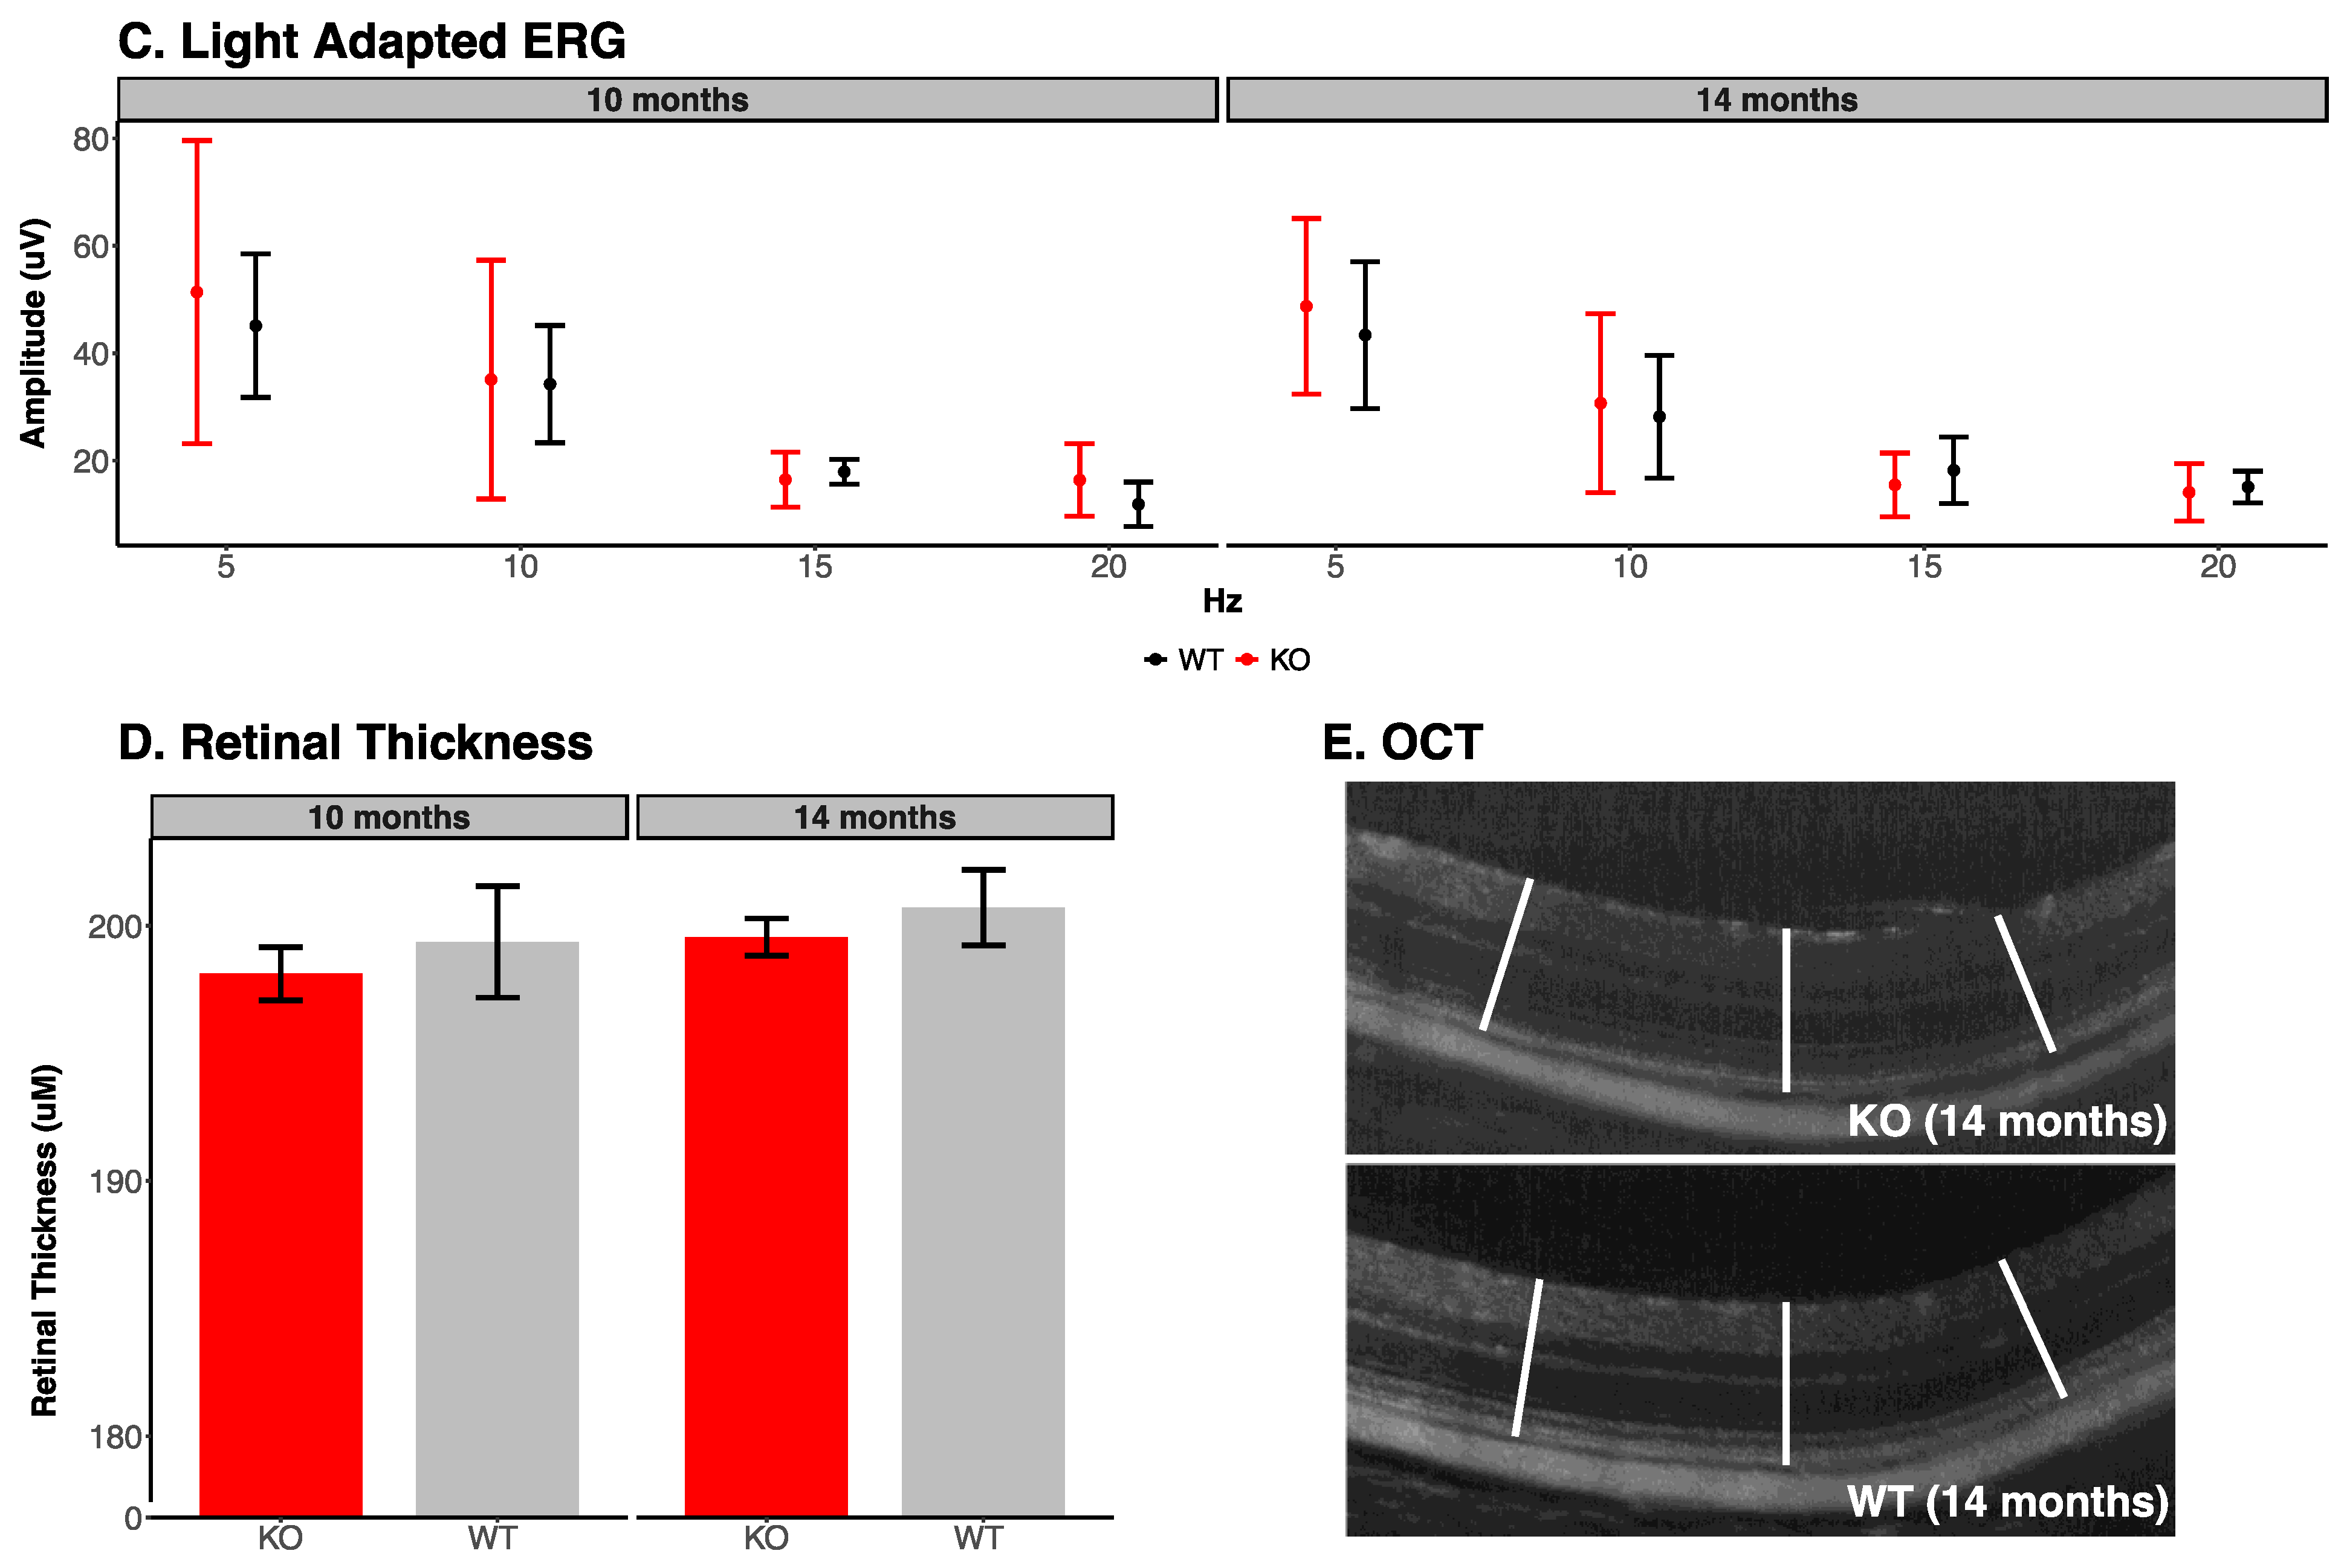
3.2. Retinal Photography and Optical Coherence Tomography

Both KO and WT mice had a normal appearance on retinal photography at both 10 and 14 months. Overall, on OCT imaging, the retinal lamination appeared preserved and no localized changes in reflectivity were observed in KO mice. The average retinal thickness in KO mice was 198.53 ± 0.97 µm and 199.86 ± 0.67 µm at 10 and 14 months, respectively (Figure 1D). The average retinal thickness in WT mice was 199.69 ± 2.02 µm and 200.93 ± 1.37 µm at 10 months and 14 months, respectively (Figure 1D). These results show that average retinal thickness was similar in both KO and WT groups, at both 10 (p = 0.29) and 14 months (p = 0.17).

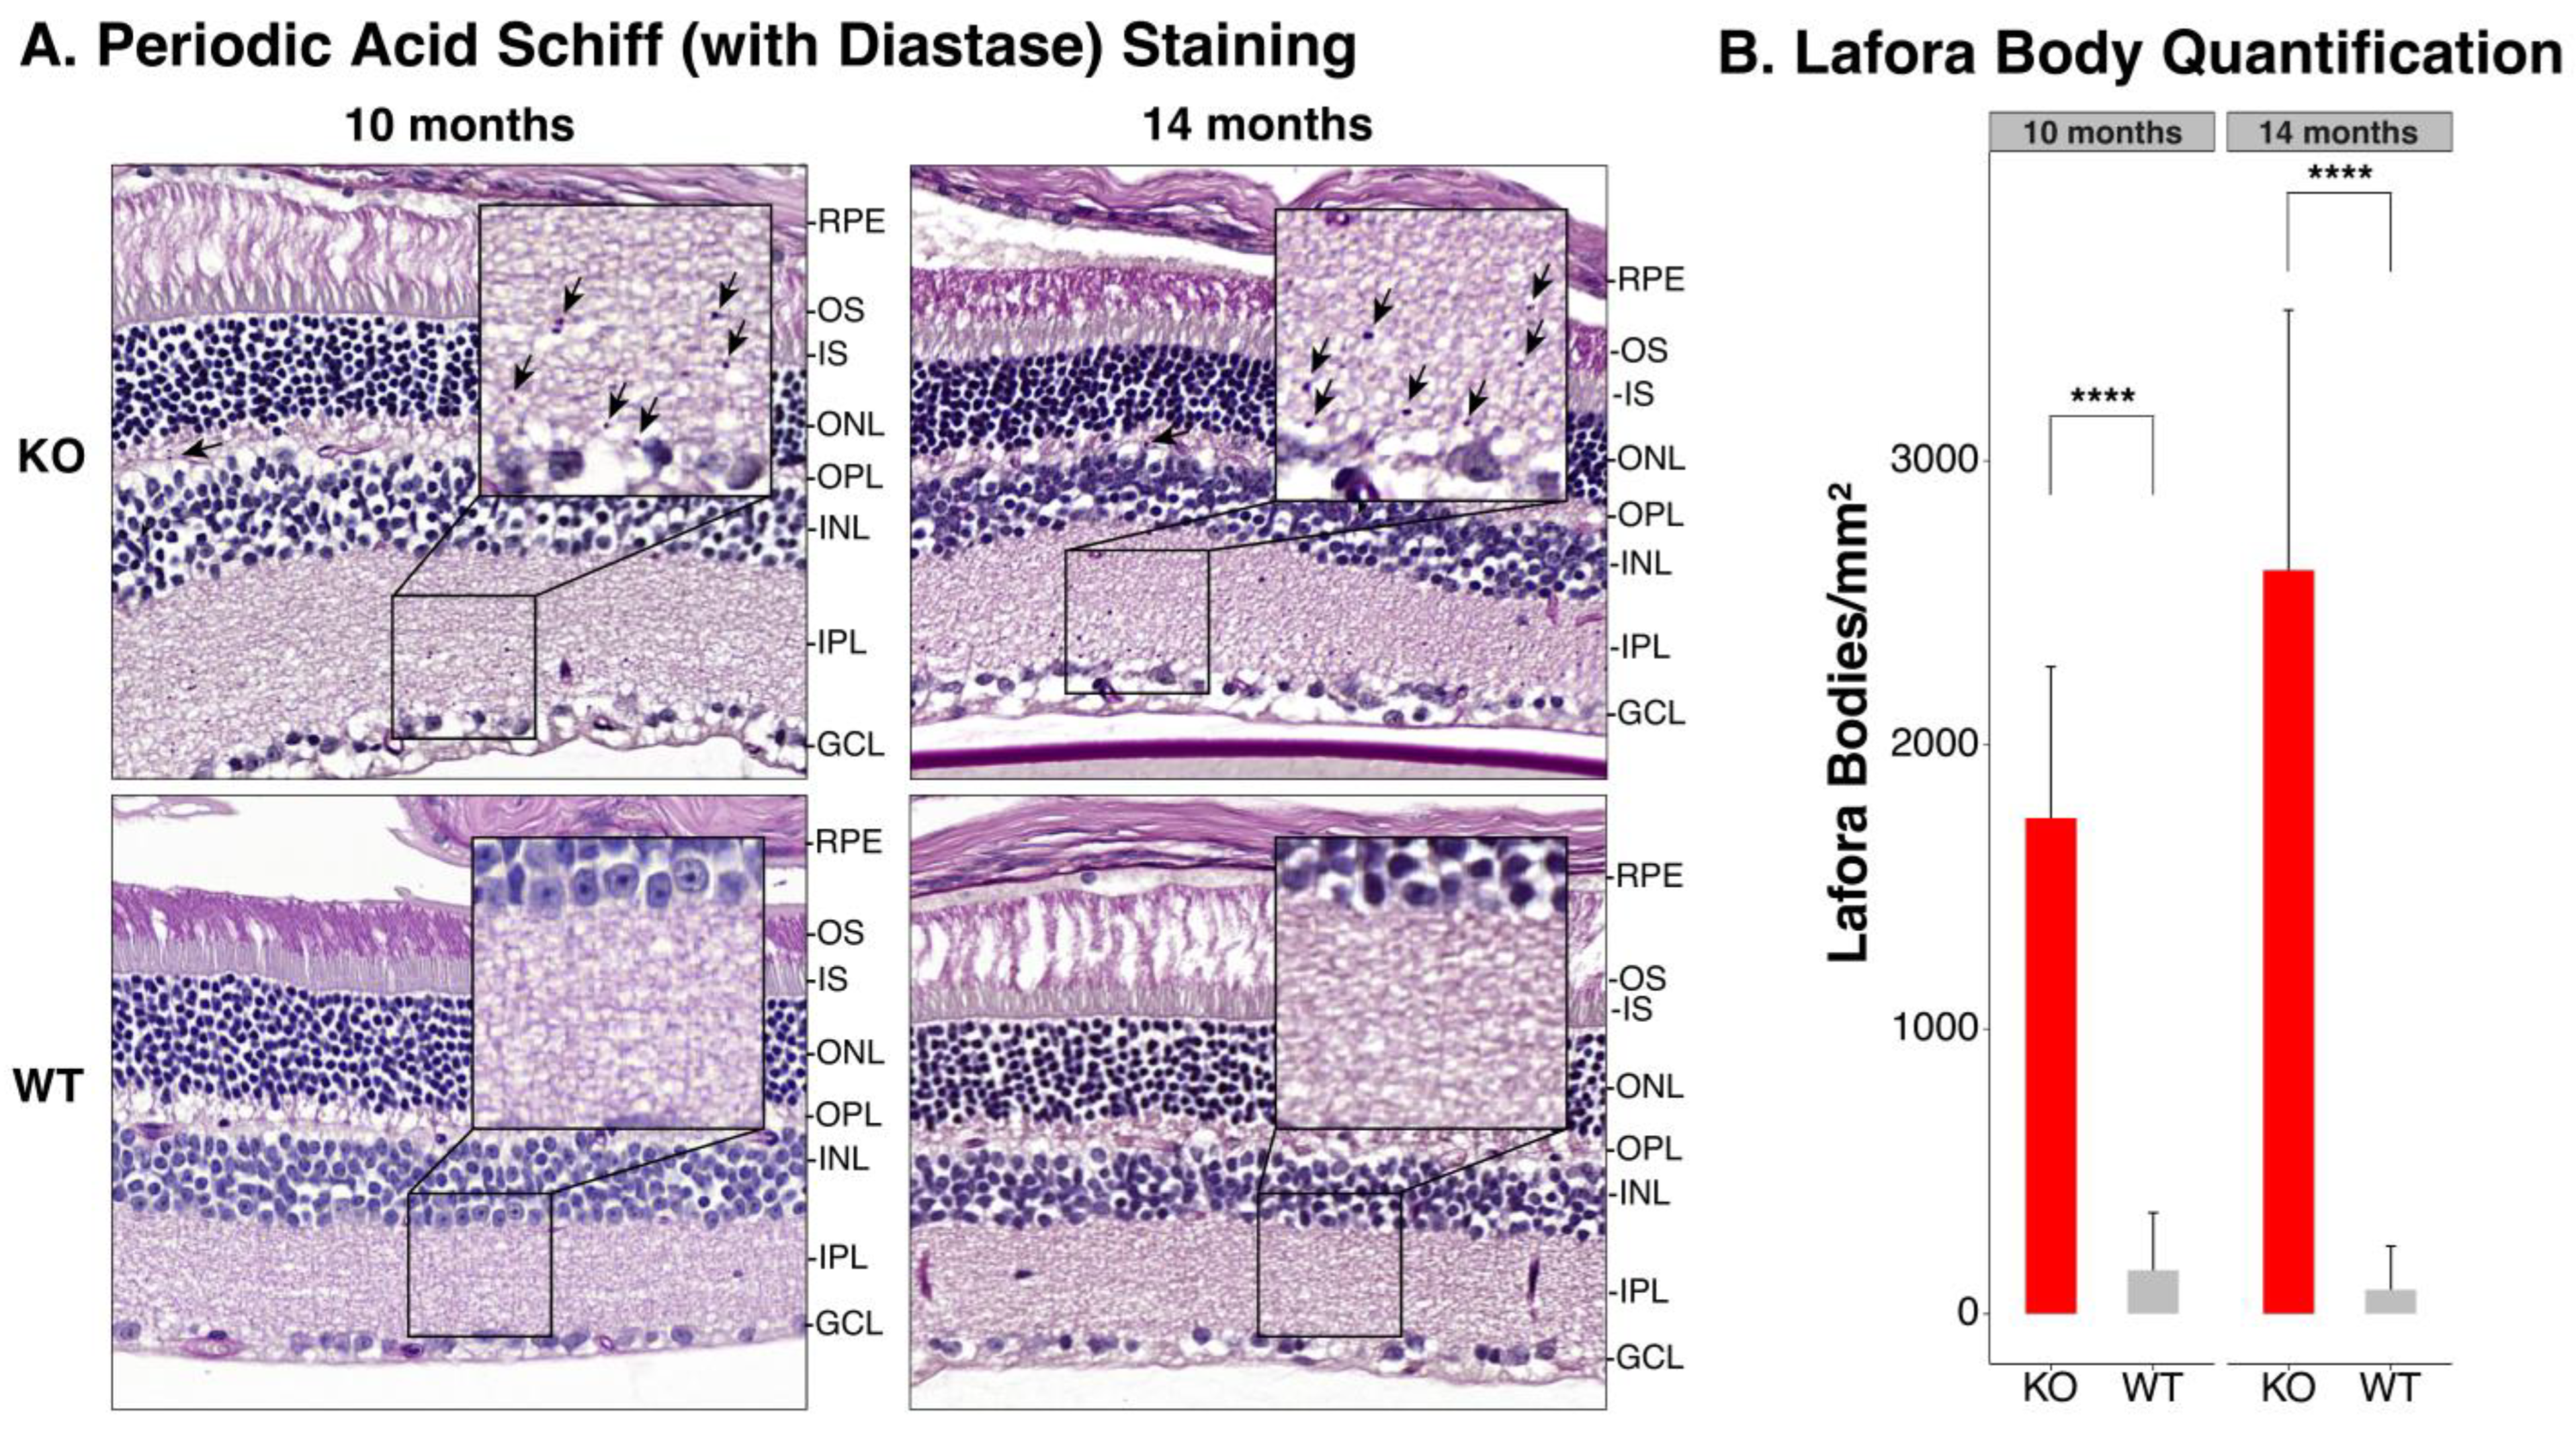
3.3. Periodic Acid Schiff-Diastase Staining of the Retina

Periodic acid Schiff-Diastase staining was executed to label LBs in the retinal tissue. The LBs were only observed in the retinas of KO mice and not in the WT littermates (Figure 2A, upper panels black arrows). In the KO mice retina, numerous LBs were observed within the IPL; LBs were also present less frequently in the inner nuclear layer (INL) and the outer plexiform layer (OPL). Upon quantification of LBs in the IPL, the average number of LB accumulation in KO mice was 1743 ± 533 and 2615 ± 915 per mm2 at 10 and 14 months, respectively (Figure 2B). There were no identifiable LBs in the IPL of WT mice (Figure 2A, lower panels), but the software identified some of the background noise in slides as LBs, which numbered 153 ± 202 and 84 ± 154 per mm2 at 10 and 14 months, respectively. There was a statistically significant difference in the amount of LB deposition between KO and WT mice at both 10 (p < 0.0001) and 14 months (p < 0.0001). There was a significant increase in LB deposition over time in KO mice (p = 0.035). Further, the average diameter of the LB in KO mice was 0.45 ± 0.11 µm (range: 0.31–0.60 µm) and 0.47 ± 0.14 µm (range: 0.30–0.71 µm) at 10 and 14 months, respectively.

4. Discussion

This Epm2a−/− mouse model demonstrates LB deposition in the inner and outer plexiform layers of the retina, as well as in the INL. The LBs were most numerous in the IPL which represents the synapse of the bipolar cell neuron with the ganglion cell neuron. Intriguingly, in microscopic studies of human LD [36], LBs were identified in the same layers as our Epm2a−/− mouse model. This novel finding indicates some reminiscence of this Epm2a−/− mouse model to human LD. Further, retinal photographs in the Epm2a−/− mice in the current study were normal, and similar to WT littermates. Human patients with molecularly confirmed LD also demonstrate normal retinal appearance in color photography [13,14].
In the current study, full-field ERG was performed to assess the generalized retinal function. The a- and b-waves of the DA mouse ERG arise from the rod photoreceptors and bipolar cells, respectively [47,48,49,50]. The mouse LA ERG has its origins from the cone photoreceptors, and cone depolarizing and hyperpolarizing bipolar cells; whilst the depolarizing bipolar cell contribution is higher between 5 and 15 Hz stimulus frequencies, the hyperpolarizing bipolar cell contribution predominates at 20 Hz stimulus frequency [51,52,53,54,55]. All tested ERG parameters were normal in KO mice, and none of the parameters showed any difference from WT littermates. The normal DA a-wave amplitudes may be explained by the absence of LB deposition in the photoceptor layer on PASD staining. Although there was some degree of LB deposition in the INL, DA b-wave amplitude and LA flicker amplitudes were also normal; these results may indicate that there is not enough LB deposition in the inner retina to cause a detectable dysfunction. On the contrary, human patients with LD consistently show ERG abnormalities [13,14], and perhaps, this represents a distinction in the degree of retinal involvement between human LD and this Epm2a−/− mouse model. Notably, there are also differences in the degree and timing of the neurological and behavioural deficits observed amongst various LD mouse models themselves [27,29,30,31], as well as between mouse models and human LD [27,30]. It is likely that other factors including environmental, genetic or species-specific may contribute to the observed differences in phenotypes [27,30]. Further, Epm2a and Epm2b that encode laforin and malin, respectively, are thought to function as a complex, and KO mice demonstrate defects in autophagy and protein clearance [31,56,57,58,59,60,61]. That said, there is also evidence to suggest that malin may have roles independent of laforin [31,56]. Hence, Epm2a and Epm2b double knockout mice could be a better model of LD and perhaps, show more pronounced retinal dysfunction compared to the Epm2a−/− mice in the present study.
The retinal lamination was preserved in KO mice at both time points. This finding is similar to human LD, where also, the retinal lamination is preserved [13,14]. The average retinal thickness in KO mice was similar to WT littermates at both 10 months and 14 months. In human LD, there is a single study, which reported regional inner retinal thinning within the macula in two patients [15]. A conference abstract on Epm2b−/− mice (in 2018) also noted thinning of the retinal nerve fiber layer [62], although no further details were available. The mouse retina lacks a macula and the MICRON-III system used to image Epm2a−/− mice in the current study did not have the capability to measure regional retinal thickness, limiting our analysis. Whilst the LBs were seen on PASD staining in the KO mice, they were not visualised on in vivo OCT scanning. This is likely due to the average diameter of LB in KO mice measuring ~0.45 and 0.47 µm at 10 and 14 months, respectively, which is beyond the axial resolution capability of the OCT system (~3 µm). Upon review of the literature, the size of LB noted in the hippocampus in Epm2a−/− mice at 9 months appeared to be ≤2 µm [27] and those identified in the human retina ranged between 2–10 µm [36]. Hence, to be able to in vivo image LB deposition in the retina of Epm2a−/− mice, one might need higher resolution OCT or AOSLO technology (<2 µm) [63]. It is notable, that a prior human study was able to identify Gunn’s dots (a biomarker for neurodegeneration) in the retinal nerve fiber layer using AOSLO imaging but was not successful in imaging LB [15]. Further, in our study, a notable increase in retinal LB deposition was observed at 14 months, compared to 10 months.
Since the primary aim of our study was to characterize the eye phenotype in Epm2a−/− mice, we did not ascertain LB deposition in the brain, liver or skeletal muscle in these mice. In retrospect, this is a missed opportunity as we could have compared the increase in LBs in KO mice retina over time to any changes in LB accumulation over time in other tissues. It is noted that an increase in LB deposition in the brain over time (4 to 17 months of age) has previously been reported by others in the same Epm2a−/− mouse model [27,30].
To summarize, we have characterised the retinal phenotype in a KO mouse model of Epm2a, widely used as a human disease model for LD. Whilst these Epm2a−/− mice had deposition of LBs, a pathognomonic feature of LD, within the middle and inner retinal layers, these bodies did not lead to any structural and functional retinal defects that were identifiable in vivo. The degree of retinal involvement in this mouse model is milder than in the patients affected with EPM2A-related LD, as most human subjects showed ERG changes indicative of a functional defect. Nonetheless, as several treatment options are being explored for LD, the extent of LB deposition in the retina may be monitored ex vivo in the Epm2a−/− mice to ascertain treatment success for eye involvement. Further, in vivo monitoring of the neurological and behavioural deficits, as well as the EEG abnormalities in Epm2a−/− mice [27,30] could help ascertain treatment success for systemic features. Imaging techniques with higher lateral and axial resolution will likely enable visualization of LBs in vivo in the retina and could be the focus of future studies.

Author Contributions

Conceptualization, B.A.M. and A.V.; data curation, A.V., K.A., R.H., A.T. and Z.B.; formal analysis, A.V., K.A., R.H. and A.T.; investigation, A.V., K.A., Z.B. and X.Z.; methodology, A.V., K.A., Z.B., X.Z. and B.A.M.; project administration, A.V. and B.A.M.; resources, B.A.M.; supervision, A.V. and B.A.M.; writing—original draft, A.V. and K.A.; writing—review and editing, A.V., K.A., R.H., Z.B., A.T., X.Z. and B.A.M. All authors have read and agreed to the published version of the manuscript.

Funding

This research was funded by Foundation Fighting Blindness U.S.A, grant number CD-CL-0617-0727-HSC.

Institutional Review Board Statement

The animal study protocol was approved by the Animal Care Committee at The Centre for Phenogenomics, Toronto, in compliance with the Canadian Council for Animal Care Guidelines (AUP 21-0044H, approved 12 October 2017).

Informed Consent Statement

Not applicable.

Data Availability Statement

The data presented in this study are available on request from the corresponding author.

Conflicts of Interest

The authors declare no conflict of interest.

References

  1. Lafora, G.R.; Glueck, B. Beitrag zur Histopathologie der myoklonischen Epilepsie. Z. Gesamte Neurol. Psychiatr. 1911, 6, 1–14. [Google Scholar] [CrossRef]
  2. Minassian, B.A.; Lee, J.R.; Herbrick, J.A.; Huizenga, J.; Soder, S.; Mungall, A.J.; Dunham, I.; Gardner, R.; Fong, C.Y.; Carpenter, S.; et al. Mutations in a gene encoding a novel protein tyrosine phosphatase cause progressive myoclonus epilepsy. Nat. Genet. 1998, 20, 171–174. [Google Scholar] [CrossRef] [PubMed]
  3. Chan, E.M.; Young, E.J.; Ianzano, L.; Munteanu, I.; Zhao, X.; Christopoulos, C.C.; Avanzini, G.; Elia, M.; Ackerley, C.A.; Jovic, N.J.; et al. Mutations in NHLRC1 cause progressive myoclonus epilepsy. Nat. Genet. 2003, 35, 125–127. [Google Scholar] [CrossRef] [PubMed]
  4. Ganesh, S.; Puri, R.; Singh, S.; Mittal, S.; Dubey, D. Recent advances in the molecular basis of Lafora’s progressive myoclonus epilepsy. J. Hum. Genet. 2006, 51, 1–8. [Google Scholar] [CrossRef]
  5. Minassian, B.A. Lafora’s disease: Towards a clinical, pathologic, and molecular synthesis. Pediatr. Neurol. 2001, 25, 21–29. [Google Scholar] [CrossRef]
  6. Turnbull, J.; Tiberia, E.; Striano, P.; Genton, P.; Carpenter, S.; Ackerley, C.A.; Minassian, B.A. Lafora disease. Epileptic Disord. 2016, 18, 38–62. [Google Scholar] [CrossRef]
  7. Striano, P.; Zara, F.; Turnbull, J.; Girard, J.M.; Ackerley, C.A.; Cervasio, M.; De Rosa, G.; Del Basso-De Caro, M.L.; Striano, S.; Minassian, B.A. Typical progression of myoclonic epilepsy of the Lafora type: A case report. Nat. Clin. Pract. Neurol. 2008, 4, 106–111. [Google Scholar] [CrossRef]
  8. Franceschetti, S.; Gambardella, A.; Canafoglia, L.; Striano, P.; Lohi, H.; Gennaro, E.; Ianzano, L.; Veggiotti, P.; Sofia, V.; Biondi, R.; et al. Clinical and genetic findings in 26 Italian patients with Lafora disease. Epilepsia 2006, 47, 640–643. [Google Scholar] [CrossRef]
  9. Araya, N.; Takahashi, Y.; Shimono, M.; Fukuda, T.; Kato, M.; Nakashima, M.; Matsumoto, N.; Saitsu, H. A recurrent homozygous NHLRC1 variant in siblings with Lafora disease. Hum. Genome Var. 2018, 5, 16. [Google Scholar] [CrossRef]
  10. Acharya, J.N.; Satishchandra, P.; Asha, T.; Shankar, S.K. Lafora’s disease in south India: A clinical, electrophysiologic, and pathologic study. Epilepsia 1993, 34, 476–487. [Google Scholar] [CrossRef]
  11. Ferlazzo, E.; Canafoglia, L.; Michelucci, R.; Gambardella, A.; Gennaro, E.; Pasini, E.; Riguzzi, P.; Plasmati, R.; Volpi, L.; Labate, A.; et al. Mild Lafora disease: Clinical, neurophysiologic, and genetic findings. Epilepsia 2014, 55, e129–e133. [Google Scholar] [CrossRef] [PubMed]
  12. Yen, C.; Beydoun, A.; Drury, I. Longitudinal EEG studies in a kindred with Lafora disease. Epilepsia 1991, 32, 895–899. [Google Scholar] [CrossRef] [PubMed]
  13. Vincent, A.; Macri, A.; Tumber, A.; Koukas, N.; Ahonen, S.; Striano, P.; Minassian, B. Ocular phenotype and electroretinogram abnormalities in Lafora disease: A “window to the brain”. Neurology 2018, 91, 137–139. [Google Scholar] [CrossRef] [PubMed]
  14. Orsini, A.; Ferrari, D.; Riva, A.; Santangelo, A.; Macri, A.; Freri, E.; Canafoglia, L.; D’Aniello, A.; Di Gennaro, G.; Massimetti, G.; et al. Ocular phenotype and electroretinogram abnormalities in Lafora disease and correlation with disease stage. J. Neurol. 2022, 269, 3597–3604. [Google Scholar] [CrossRef]
  15. Heitkotter, H.; Linderman, R.E.; Cava, J.A.; Woertz, E.N.; Mastey, R.R.; Summerfelt, P.; Chui, T.Y.; Rosen, R.B.; Patterson, E.J.; Vincent, A.; et al. Retinal alterations in patients with Lafora disease. Am. J. Ophthalmol. Case Rep. 2021, 23, 101146. [Google Scholar] [CrossRef]
  16. Holland, J.M.; Davis, W.C.; Prieur, D.J.; Collins, G.H. Lafora’s disease in the dog. A comparative study. Am. J. Pathol. 1970, 58, 509–530. [Google Scholar]
  17. Kaiser, E.; Krauser, K.; Schwartz-Porsche, D. Lafora disease (progressive myoclonic epilepsy) in the Bassett hound—Possibility of early diagnosis using muscle biopsy? Tierarztl. Prax. 1991, 19, 290–295. [Google Scholar]
  18. Davis, K.E.; Finnie, J.W.; Hooper, P.T. Lafora’s disease in a dog. Aust. Vet. J. 1990, 67, 192–193. [Google Scholar] [CrossRef]
  19. Hajek, I.; Kettner, F.; Simerdova, V.; Rusbridge, C.; Wang, P.; Minassian, B.A.; Palus, V. NHLRC1 repeat expansion in two beagles with Lafora disease. J. Small Anim. Pract. 2016, 57, 650–652. [Google Scholar] [CrossRef]
  20. Lohi, H.; Young, E.J.; Fitzmaurice, S.N.; Rusbridge, C.; Chan, E.M.; Vervoort, M.; Turnbull, J.; Zhao, X.C.; Ianzano, L.; Paterson, A.D.; et al. Expanded repeat in canine epilepsy. Science 2005, 307, 81. [Google Scholar] [CrossRef]
  21. Demeny, H.; Florea, B.; Tabaran, F.; Danciu, C.G.; Ognean, L. EEG Patterns Orienting to Lafora Disease Diagnosis-A Case Report in Two Beagles. Front. Vet. Sci. 2020, 7, 589430. [Google Scholar] [CrossRef] [PubMed]
  22. Mari, L.; Comero, G.; Mueller, E.; Kuehnlein, P.; Kehl, A. NHLRC1 homozygous dodecamer expansion in a Newfoundland dog with Lafora disease. J. Small Anim. Pract. 2021, 62, 1030–1032. [Google Scholar] [CrossRef]
  23. Schoeman, T.; Williams, J.; van Wilpe, E. Polyglucosan storage disease in a dog resembling Lafora’s disease. J. Vet. Intern. Med. 2002, 16, 201–207. [Google Scholar] [PubMed]
  24. Swain, L.; Key, G.; Tauro, A.; Ahonen, S.; Wang, P.; Ackerley, C.; Minassian, B.A.; Rusbridge, C. Lafora disease in miniature Wirehaired Dachshunds. PLoS ONE 2017, 12, e0182024. [Google Scholar] [CrossRef] [PubMed]
  25. Hegreberg, G.A.; Padgett, G.A. Inherited progressive epilepsy of the dog with comparisons to Lafora’s disease of man. Fed. Proc. 1976, 35, 1202–1205. [Google Scholar]
  26. Gredal, H.; Berendt, M.; Leifsson, P.S. Progressive myoclonus epilepsy in a beagle. J. Small Anim. Pract. 2003, 44, 511–514. [Google Scholar] [CrossRef]
  27. Ganesh, S.; Delgado-Escueta, A.V.; Sakamoto, T.; Avila, M.R.; Machado-Salas, J.; Hoshii, Y.; Akagi, T.; Gomi, H.; Suzuki, T.; Amano, K.; et al. Targeted disruption of the Epm2a gene causes formation of Lafora inclusion bodies, neurodegeneration, ataxia, myoclonus epilepsy and impaired behavioral response in mice. Hum. Mol. Genet. 2002, 11, 1251–1262. [Google Scholar] [CrossRef]
  28. Turnbull, J.; Wang, P.; Girard, J.M.; Ruggieri, A.; Wang, T.J.; Draginov, A.G.; Kameka, A.P.; Pencea, N.; Zhao, X.; Ackerley, C.A.; et al. Glycogen hyperphosphorylation underlies lafora body formation. Ann. Neurol. 2010, 68, 925–933. [Google Scholar] [CrossRef]
  29. Valles-Ortega, J.; Duran, J.; Garcia-Rocha, M.; Bosch, C.; Saez, I.; Pujadas, L.; Serafin, A.; Canas, X.; Soriano, E.; Delgado-Garcia, J.M.; et al. Neurodegeneration and functional impairments associated with glycogen synthase accumulation in a mouse model of Lafora disease. EMBO Mol. Med. 2011, 3, 667–681. [Google Scholar] [CrossRef]
  30. Garcia-Cabrero, A.M.; Marinas, A.; Guerrero, R.; de Cordoba, S.R.; Serratosa, J.M.; Sanchez, M.P. Laforin and malin deletions in mice produce similar neurologic impairments. J. Neuropathol. Exp. Neurol. 2012, 71, 413–421. [Google Scholar] [CrossRef]
  31. Criado, O.; Aguado, C.; Gayarre, J.; Duran-Trio, L.; Garcia-Cabrero, A.M.; Vernia, S.; San Millan, B.; Heredia, M.; Roma-Mateo, C.; Mouron, S.; et al. Lafora bodies and neurological defects in malin-deficient mice correlate with impaired autophagy. Hum. Mol. Genet. 2012, 21, 1521–1533. [Google Scholar] [CrossRef] [PubMed]
  32. Sakai, M.; Austin, J.; Witmer, F.; Trueb, L. Studies in myoclonus epilepsy (Lafora body form). II. Polyglucosans in the systemic deposits of myoclonus epilepsy and in corpora amylacea. Neurology 1970, 20, 160–176. [Google Scholar] [CrossRef] [PubMed]
  33. Barbieri, F.; Santangelo, R.; Gasparo-Rippa, P.; Santoro, M. Biopsy findings (cerebral cortex, muscle, skin) in Lafora disease. Acta Neurol. 1987, 9, 81–94. [Google Scholar]
  34. Shirozu, M.; Hashimoto, M.; Tomimatsu, M.; Nakazawa, Y.; Anraku, S.; Nagata, M. Lafora disease diagnosed by skin biopsy. Kurume Med. J. 1985, 32, 311–313. [Google Scholar] [CrossRef]
  35. Carpenter, S.; Karpati, G. Ultrastructural findings in Lafora disease. Ann. Neurol. 1981, 10, 63–64. [Google Scholar] [CrossRef]
  36. Berard-Badier, M.; Pellissier, J.F.; Gambarelli, D.; de Barsy, T.; Roger, J.; Toga, M. The retina in Lafora disease: Light and electron microscopy. In Current Research in Ophthalmic Electron Microscopy; Springer: Berlin/Heidelberg, Germany, 1980; Volume 212, pp. 285–294. [Google Scholar]
  37. Andrade, D.M.; Ackerley, C.A.; Minett, T.S.; Teive, H.A.; Bohlega, S.; Scherer, S.W.; Minassian, B.A. Skin biopsy in Lafora disease: Genotype-phenotype correlations and diagnostic pitfalls. Neurology 2003, 61, 1611–1614. [Google Scholar] [CrossRef]
  38. von Klopmann, T.; Ahonen, S.; Espadas-Santiuste, I.; Matiasek, K.; Sanchez-Masian, D.; Rupp, S.; Vandenberghe, H.; Rose, J.; Wang, T.; Wang, P.; et al. Canine Lafora Disease: An Unstable Repeat Expansion Disorder. Life 2021, 11, 689. [Google Scholar] [CrossRef]
  39. Mitra, S.; Gumusgoz, E.; Minassian, B.A. Lafora disease: Current biology and therapeutic approaches. Rev. Neurol. 2022, 178, 315–325. [Google Scholar] [CrossRef]
  40. Drexler, W.; Fujimoto, J.G. State-of-the-art retinal optical coherence tomography. Prog. Retin. Eye Res. 2008, 27, 45–88. [Google Scholar] [CrossRef]
  41. Fischer, M.D.; Huber, G.; Beck, S.C.; Tanimoto, N.; Muehlfriedel, R.; Fahl, E.; Grimm, C.; Wenzel, A.; Reme, C.E.; van de Pavert, S.A.; et al. Noninvasive, in vivo assessment of mouse retinal structure using optical coherence tomography. PLoS ONE 2009, 4, e7507. [Google Scholar] [CrossRef]
  42. Grieve, K.; Thouvenin, O.; Sengupta, A.; Borderie, V.M.; Paques, M. Appearance of the Retina With Full-Field Optical Coherence Tomography. Investig. Ophthalmol. Vis. Sci. 2016, 57, OCT96–OCT104. [Google Scholar] [CrossRef] [PubMed]
  43. Jagodzinska, J.; Sarzi, E.; Cavalier, M.; Seveno, M.; Baecker, V.; Hamel, C.; Pequignot, M.; Delettre, C. Optical Coherence Tomography: Imaging Mouse Retinal Ganglion Cells In Vivo. J. Vis. Exp. 2017, 127, e55865. [Google Scholar]
  44. Fu, D.A.; Campbell-Thompson, M. Periodic Acid-Schiff Staining with Diastase. Methods Mol. Biol. 2017, 1639, 145–149. [Google Scholar] [PubMed]
  45. Ng, I.O.; Sturgess, R.P.; Williams, R.; Portmann, B. Ground-glass hepatocytes with Lafora body like inclusions—Histochemical, immunohistochemical and electronmicroscopic characterization. Histopathology 1990, 17, 109–115. [Google Scholar] [CrossRef]
  46. Ganesh, S.; Tsurutani, N.; Suzuki, T.; Hoshii, Y.; Ishihara, T.; Delgado-Escueta, A.V.; Yamakawa, K. The carbohydrate-binding domain of Lafora disease protein targets Lafora polyglucosan bodies. Biochem. Biophys. Res. Commun. 2004, 313, 1101–1109. [Google Scholar] [CrossRef] [PubMed]
  47. Pinto, L.H.; Invergo, B.; Shimomura, K.; Takahashi, J.S.; Troy, J.B. Interpretation of the mouse electroretinogram. Doc. Ophthalmol. 2007, 115, 127–136. [Google Scholar] [CrossRef]
  48. Goto, Y.; Peachey, N.S.; Ziroli, N.E.; Seiple, W.H.; Gryczan, C.; Pepperberg, D.R.; Naash, M.I. Rod phototransduction in transgenic mice expressing a mutant opsin gene. J. Opt. Soc. Am. A Opt. Image Sci. Vis. 1996, 13, 577–585. [Google Scholar] [PubMed]
  49. Robson, J.G.; Maeda, H.; Saszik, S.M.; Frishman, L.J. In vivo studies of signaling in rod pathways of the mouse using the electroretinogram. Vis. Res. 2004, 44, 3253–3268. [Google Scholar] [CrossRef] [PubMed]
  50. Green, D.G.; Guo, H.; Pillers, D.A. Normal photoresponses and altered b-wave responses to APB in the mdxCv3 mouse isolated retina ERG supports role for dystrophin in synaptic transmission. Vis. Neurosci. 2004, 21, 739–747. [Google Scholar] [CrossRef]
  51. Biel, M.; Seeliger, M.; Pfeifer, A.; Kohler, K.; Gerstner, A.; Ludwig, A.; Jaissle, G.; Fauser, S.; Zrenner, E.; Hofmann, F. Selective loss of cone function in mice lacking the cyclic nucleotide-gated channel CNG3. Proc. Natl. Acad. Sci. USA 1999, 96, 7553–7557. [Google Scholar] [CrossRef]
  52. Tanimoto, N.; Sothilingam, V.; Kondo, M.; Biel, M.; Humphries, P.; Seeliger, M.W. Electroretinographic assessment of rod- and cone-mediated bipolar cell pathways using flicker stimuli in mice. Sci. Rep. 2015, 5, 10731. [Google Scholar] [CrossRef] [PubMed]
  53. Sharma, S.; Ball, S.L.; Peachey, N.S. Pharmacological studies of the mouse cone electroretinogram. Vis. Neurosci. 2005, 22, 631–636. [Google Scholar] [CrossRef] [PubMed]
  54. Krishna, V.R.; Alexander, K.R.; Peachey, N.S. Temporal properties of the mouse cone electroretinogram. J. Neurophysiol. 2002, 87, 42–48. [Google Scholar] [CrossRef]
  55. Ekesten, B.; Gouras, P.; Moschos, M. Cone properties of the light-adapted murine ERG. Doc. Ophthalmol. 1998, 97, 23–31. [Google Scholar] [CrossRef]
  56. Garyali, P.; Siwach, P.; Singh, P.K.; Puri, R.; Mittal, S.; Sengupta, S.; Parihar, R.; Ganesh, S. The malin-laforin complex suppresses the cellular toxicity of misfolded proteins by promoting their degradation through the ubiquitin-proteasome system. Hum. Mol. Genet. 2009, 18, 688–700. [Google Scholar] [CrossRef]
  57. Aguado, C.; Sarkar, S.; Korolchuk, V.I.; Criado, O.; Vernia, S.; Boya, P.; Sanz, P.; de Cordoba, S.R.; Knecht, E.; Rubinsztein, D.C. Laforin, the most common protein mutated in Lafora disease, regulates autophagy. Hum. Mol. Genet. 2010, 19, 2867–2876. [Google Scholar] [CrossRef]
  58. Knecht, E.; Aguado, C.; Sarkar, S.; Korolchuk, V.I.; Criado-Garcia, O.; Vernia, S.; Boya, P.; Sanz, P.; Rodriguez de Cordoba, S.; Rubinsztein, D.C. Impaired autophagy in Lafora disease. Autophagy 2010, 6, 991–993. [Google Scholar] [CrossRef]
  59. Puri, R.; Ganesh, S. Laforin in autophagy: A possible link between carbohydrate and protein in Lafora disease? Autophagy 2010, 6, 1229–1231. [Google Scholar] [CrossRef] [PubMed]
  60. Rao, S.N.; Maity, R.; Sharma, J.; Dey, P.; Shankar, S.K.; Satishchandra, P.; Jana, N.R. Sequestration of chaperones and proteasome into Lafora bodies and proteasomal dysfunction induced by Lafora disease-associated mutations of malin. Hum. Mol. Genet. 2010, 19, 4726–4734. [Google Scholar] [CrossRef]
  61. Puri, R.; Suzuki, T.; Yamakawa, K.; Ganesh, S. Dysfunctions in endosomal-lysosomal and autophagy pathways underlie neuropathology in a mouse model for Lafora disease. Hum. Mol. Genet. 2012, 21, 175–184. [Google Scholar] [CrossRef]
  62. Campbell, M.C.W.; Emptage, L.; Corapi, F. Effects of Lafora disease on the retina of a transgenic mouse model. Investig. Ophthalmol. Vis. Sci. 2018, 59, 4319. [Google Scholar]
  63. Burns, S.A.; Elsner, A.E.; Sapoznik, K.A.; Warner, R.L.; Gast, T.J. Adaptive optics imaging of the human retina. Prog. Retin. Eye Res. 2019, 68, 1–30. [Google Scholar] [CrossRef] [PubMed]
Figure 1. Full-field electroretinogram (ERG) and optical coherence tomography (OCT) findings in Epm2a−/− knock out (KO) mice and control (WT) littermates. (A) Dark-adapted (DA) ERG a-wave amplitude measures to different intensities of flash (ranging from 0.01 cd·s·m−2 to 10 cd·s·m−2) showed no difference between KO and WT mice at both 10 months and 14 months of age. (B) The DA ERG b-wave amplitude measures to different intensities of flash (ranging from 0.0025 cd·s·m−2 to 10 cd·s·m−2) showed no difference between KO and WT mice at both time points. (C) Light-adapted (LA) ERG amplitude measures to four different flicker frequencies (5–20 Hz) showed no difference between KO and WT mice at both time points. Notably, the LA flicker amplitudes are lower at higher stimulus frequencies (15 and 20 Hz) compared to lower stimulus frequencies (5 and 10 Hz) in both KO and WT mice. This is because the depolarizing bipolar cell contribution that predominates the LA ERG at lower flicker frequencies shows larger amplitudes compared to the hyperpolarizing bipolar cell contribution that predominates at high flicker frequencies. Similar findings have been consistently observed in multiple WT mouse models. (D) The average retinal thickness was comparable between KO and WT mice at both time points. (E) A representative horizontal line scan from KO and WT mice, respectively, showing how the average retinal thickness was calculated.
Genes 14 00854 g001aGenes 14 00854 g001b
Figure 2. Periodic Acid Schiff-Diastase) (PASD) staining in Epm2a−/− knock out (KO) mice and control (WT) littermates. (A) PASD staining of KO mice shows Lafora body (LB) deposition in KO mice at both 10 and 14 months (top panel). The LBs (black arrows) were noted in the inner plexiform layer (IPL), inner nuclear layer (INL) and outer plexiform layer (OPL). The LBs were most numerous in the IPL. The LBs were not visualised in WT littermates (bottom panel). All the other retinal layers are also labelled: retinal pigmented epithelium (RPE), photoreceptor outer segment (OS), photoreceptor inner segment (IS), outer nuclear layer (ONL) and ganglion cell layer (GCL). (B) Automated quantification of the LBs within the IPL showed a significantly higher LB deposition in KO mice compared to WT mice at both time points (**** p < 0.0001). There is a significant increase in the number of LBs in KO mice at 14 months, in comparison to 10 months (p = 0.035).
Genes 14 00854 g002
Table 1. ERG Parameters in Epm2a knockout and wildtype mice.
Dark Adapted ERG Parameters (10 Months)
Stimulus Flash in cd·s·m−2A WaveB Wave
KnockoutWildtypep-ValueKnockoutWildtypep-Value
0.0025-- 242 ± 38.76258 ± 74.160.68
0.006-- 340 ± 86.56344 ± 102.190.95
0.0127 ± 9.9132 ± 19.470.62320 ± 47.77348 ± 93.180.57
0.02543 ± 20.9855 ± 24.240.47328 ± 47.30357 ± 94.020.55
0.146 ± 15.1358 ± 24.460.38348 ± 59.59372 ± 102.170.66
187 ± 34.40108 ± 38.100.39379 ± 100.68409 ± 109.050.66
2105 ± 36.65105 ± 43.861.00361 ± 106.10378 ± 104.350.80
5102 ± 34.97103 ± 34.080.96309 ± 130.79345 ± 83.990.62
1092 ± 30.8996 ± 36.240.86286 ± 131.38304 ± 89.580.81
Dark Adapted ERG Parameters (14 Months)
Stimulus Flash in cd·s·m−2A WaveB Wave
KnockoutWildtypep-ValueKnockoutWildtypep-Value
0.0025-- 232 ± 53.71259 ± 64.010.49
0.006-- 285 ± 85.24282 ± 83.610.96
0.0130 ± 8.2930 ± 13.331.00296 ± 71.82317 ± 99.560.71
0.02563 ± 24.5546 ± 27.680.33328 ± 80.20335 ± 109.260.91
0.163 ± 19.0769 ± 30.050.72334 ± 91.61334 ± 125.151.00
1112 ± 30.08145 ± 26.070.10438 ± 139.30367 ± 127.210.42
2129 ± 27.96145 ± 35.950.45437 ± 136.87355 ± 123.900.35
5111 ± 29.22145 ± 29.120.10369 ± 101.02351 ± 117.610.80
10110 ± 33.93129 ± 24.050.34313 ± 81.42337 ± 109.480.70
Light Adapted ERG Parameters (10 Months)
Stimulus Frequency in HzTrough to Peak Amplitude
KnockoutWildtypep-Value
549.98 ± 25.4747.93 ± 13.780.89
1037.25 ± 20.5736.72 ± 11.470.97
1517.05 ± 4.7918.27 ± 2.220.62
2016.99 ± 6.2112.9 ± 4.460.27
Light Adapted ERG Parameters (14 Months)
Stimulus Frequency in HzTrough to Peak Amplitude
KnockoutWildtypep-Value
548.74 ± 16.3243.38 ± 13.650.59
1030.7 ± 16.6728.18 ± 11.450.79
1515.5 ± 5.9418.20 ± 6.220.50
2014.1 ± 5.3715.09 ± 2.960.73
Disclaimer/Publisher’s Note: The statements, opinions and data contained in all publications are solely those of the individual author(s) and contributor(s) and not of MDPI and/or the editor(s). MDPI and/or the editor(s) disclaim responsibility for any injury to people or property resulting from any ideas, methods, instructions or products referred to in the content.

