
Genome-Wide Association Studies of Live Weight at First Breeding at Eight Months of Age and Pregnancy Status of Ewe Lambs
 , , , , , and
Abstract
:1. Introduction
2. Materials and Methods
2.1. Animals and Phenotypes
2.2. Single-Nucleotide Polymorphism Analysis
2.3. Statistical Analysis
2.4. Candidate Genes and Functional Analysis
3. Results
4. Discussion
4.1. Genetic Parameter Estimates
4.2. Candidate Genes
4.3. Limitations
5. Conclusions
Author Contributions
Funding
Institutional Review Board Statement
Informed Consent Statement
Data Availability Statement
Acknowledgments
Conflicts of Interest
References
- Kenyon, P.R.; Thompson, A.N.; Morris, S.T. Breeding ewe lambs successfully to improve lifetime performance. Small Rumin. Res. 2014, 118, 2–15. [Google Scholar] [CrossRef]
- Farrell, L.J.; Kenyon, P.R.; Tozer, P.R.; Morris, S.T. Determining the Impact of Hogget Breeding Performance on Profitability under a Fixed Feed Supply Scenario in New Zealand. Animals 2021, 11, 1303. [Google Scholar] [CrossRef]
- Haslin, E.; Corner-Thomas, R.A.; Kenyon, P.R.; Pettigrew, E.J.; Hickson, R.E.; Morris, S.T.; Blair, H.T. Effects of heavier live weight of ewe lambs at mating on fertility, lambing percentage, subsequent live weight and the performance of their progeny. N. Z. J. Agric. Res. 2022, 65, 114–128. [Google Scholar] [CrossRef]
- Fossceco, S.L.; Notter, D.R. Heritabilities and genetic correlations of body weight, testis growth and ewe lamb reproductive traits in crossbred sheep. Anim. Sci. 1995, 60, 185–195. [Google Scholar] [CrossRef]
- Almasi, M.; Zamani, P.; Mirhoseini, S.Z.; Moradi, M.H. Genome-wide association study for postweaning weight traits in Lori-Bakhtiari sheep. Trop. Anim. Health Prod. 2021, 53, 163. [Google Scholar] [CrossRef]
- Medrado, B.D.; Pedrosa, V.B.; Pinto, L.F.B. Meta-analysis of genetic parameters for economic traits in sheep. Livest. Sci. 2021, 247, 104477. [Google Scholar] [CrossRef]
- Ahmad, S.M.; Bhat, B.; Manzoor, Z.; Dar, M.A.; Taban, Q.; Ibeagha-Awemu, E.M.; Shabir, N.; Hussain, M.I.; Shah, R.A.; Ganai, N.A. Genome wide expression analysis of circular RNAs in mammary epithelial cells of cattle revealed difference in milk synthesis. PeerJ 2022, 10, e13029. [Google Scholar] [CrossRef] [PubMed]
- Ambike, V.; Venkataramanan, R.; Karthickeyan SM, K.; Tirumurugaan, K.G. Meta-analysis of performance and genetic parameter estimates for growth and body weight traits of sheep in the tropics. Small Rumin. Res. 2022, 206, 106597. [Google Scholar] [CrossRef]
- Safari, E.; Fogarty, N.M.; Gilmour, A.R. A review of genetic parameter estimates for wool, growth, meat and reproduction traits in sheep. Livest. Prod. Sci. 2005, 92, 271–289. [Google Scholar] [CrossRef]
- Auvray, B.; McEwan, J.C.; Newman, S.-A.N.; Lee, M.; Dodds, K.G. Genomic prediction of breeding values in the New Zealand sheep industry using a 50K SNP chip. J. Anim. Sci. 2014, 92, 4375–4389. [Google Scholar] [CrossRef] [PubMed] [Green Version]
- Brito, L.F.; Clarke, S.M.; McEwan, J.C.; Miller, S.P.; Pickering, N.K.; Bain, W.E.; Dodds, K.G.; Sargolzaei, M.; Schenkel, F.S. Prediction of genomic breeding values for growth, carcass and meat quality traits in a multi-breed sheep population using a HD SNP chip. BMC Genet. 2017, 18, 7. [Google Scholar] [CrossRef] [PubMed] [Green Version]
- Raoul, J.; Swan, A.A.; Elsen, J.-M. Using a very low-density SNP panel for genomic selection in a breeding program for sheep. Genet. Sel. Evol. 2017, 49, 76. [Google Scholar] [CrossRef] [PubMed] [Green Version]
- McEwan, J.C. Current and future impact of DNA technologies on the New Zealand sheep industry. Proc. N. Z. Soc. Anim. Prod. 2009, 69, 165–168. [Google Scholar]
- Liu, Z.; Seefried, F.R.; Reinhardt, F.; Rensing, S.; Thaller, G.; Reents, R. Impacts of both reference population size and inclusion of a residual polygenic effect on the accuracy of genomic prediction. Genet. Sel. Evol. 2011, 43, 19. [Google Scholar] [CrossRef] [Green Version]
- Fortes, M.R.S.; Nguyen, L.T.; Neto, L.R.P.; Reverter, A.; Moore, S.S.; Lehnert, S.A.; Thomas, M.G. Polymorphisms and genes associated with puberty in heifers. Theriogenology 2016, 86, 333–339. [Google Scholar] [CrossRef] [PubMed]
- Kinder, J.E.; Day, M.L.; Kittok, R.J. Endocrine regulation of puberty in cows and ewes. J. Reprod. Fertil. Suppl. 1987, 34, 167–186. [Google Scholar] [CrossRef] [PubMed] [Green Version]
- Pettigrew, E.J.; Hickson, R.E.; Blair, H.T.; Griffiths, K.J.; Ridler, A.L.; Morris, S.T.; Kenyon, P.R. Differences in birth weight and neonatal survival rate of lambs born to ewe hoggets or mature ewes. N. Z. J. Anim. Sci. Prod. 2018, 78, 16–20. [Google Scholar]
- Pettigrew, E.J.; Hickson, R.E.; Blair, H.T.; Griffiths, K.J.; Ridler, A.L.; Morris, S.T.; Kenyon, P.R. Differences in lamb production between ewe lambs and mature ewes. N. Z. J. Agric. Res. 2021, 64, 508–521. [Google Scholar] [CrossRef]
- Haslin, E.; Corner-Thomas, R.A.; Kenyon, P.R.; Pettigrew, E.J.; Hickson, R.E.; Morris, S.T.; Blair, H.T. Effect of Breeding Heavier Romney Ewe Lambs at Seven Months of Age on Lamb Production and Efficiency over Their First Three Breeding Seasons. Animals 2021, 11, 3486. [Google Scholar] [CrossRef]
- Pettigrew, E.; Hickson, R.; Morris, S.; Kenyon, P.; Corner-Thomas, R.; Haslin, E.; Blair, H. The Effect of Age of Dam and Birth Rank on the Reproductive Performance of Ewes as One-and Two-Year-Olds. Animals 2021, 11, 770. [Google Scholar] [CrossRef]
- Dodds, K.G. Use of gene markers in the New Zealand sheep industry. In Proceedings of the Association for the Advancement of Animal Breeding and Genetics; Association for the Advancement of Animal Breeding and Genetics: Armidale, Australia, 2007; pp. 418–425. [Google Scholar]
- Gilmour, A.R.; Gogel, B.J.; Cullis, B.R.; Thompson, R. ASReml User Guide Release 3.0; VSN International Ltd.: Hemel Hempstead, UK, 2009. [Google Scholar]
- Falconer, D.S.; Mackay, M. Introduction to Quantitative Genetics, 4th ed.; Addison Wesley Longman: Harlow, UK, 1996. [Google Scholar]
- Yang, J.; Lee, S.H.; Goddard, M.E.; Visscher, P.M. GCTA: A tool for genome-wide complex trait analysis. Am. J. Hum. Genet. 2011, 88, 76–82. [Google Scholar] [CrossRef] [Green Version]
- Lander, E.; Kruglyak, L. Genetic dissection of complex traits: Guidelines for interpreting and reporting linkage results. Nat. Genet. 1995, 11, 241–247. [Google Scholar] [CrossRef] [PubMed]
- Turner, S.D. qqman: An R package for visualizing GWAS results using QQ and manhattan plots. Biorxiv 2014, 005165. [Google Scholar] [CrossRef]
- Mi, H.; Thomas, P. PANTHER pathway: An ontology-based pathway database coupled with data analysis tools. Methods Mol. Biol. 2009, 563, 123–140. [Google Scholar] [PubMed]
- Mi, H.; Ebert, D.; Muruganujan, A.; Mills, C.; Albou, L.-P.; Mushayamaha, T.; Thomas, P.D. PANTHER version 16: A revised family classification, tree-based classification tool, enhancer regions and extensive API. Nucleic Acids Res. 2020, 49, D394–D403. [Google Scholar] [CrossRef] [PubMed]
- Gillespie, M.; Jassal, B.; Stephan, R.; Milacic, M.; Rothfels, K.; Senff-Ribeiro, A.; Griss, J.; Sevilla, C.; Matthews, L.; Gong, C.; et al. The reactome pathway knowledgebase 2022. Nucleic Acids Res. 2022, 50, D687–D692. [Google Scholar] [CrossRef]
- Morellini, F.; Schachner, M. Enhanced novelty-induced activity, reduced anxiety, delayed resynchronization to daylight reversal and weaker muscle strength in tenascin-C-deficient mice. Eur. J. Neurosci. 2006, 23, 1255–1268. [Google Scholar] [CrossRef]
- Flück, M.; Mund, S.I.; Schittny, J.C.; Klossner, S.; Durieux, A.-C.; Giraud, M.-N. Mechano-regulated tenascin-C orchestrates muscle repair. Proc. Natl. Acad. Sci. USA 2008, 105, 13662–13667. [Google Scholar] [CrossRef] [PubMed] [Green Version]
- Gruber, B.L.; Mienaltowski, M.J.; MacLeod, J.N.; Schittny, J.; Kasper, S.; Flück, M. Tenascin-C expression controls the maturation of articular cartilage in mice. BMC Res. Notes 2020, 13, 78. [Google Scholar] [CrossRef] [Green Version]
- Marín, N.D.; García, L.F. The role of CD30 and CD153 (CD30L) in the anti-mycobacterial immune response. Tuberculosis 2017, 102, 8–15. [Google Scholar] [CrossRef]
- Tríbulo, P.; Jumatayeva, G.; Lehloenya, K.; Moss, J.I.; Negrón-Pérez, V.M.; Hansen, P.J. Effects of sex on response of the bovine preimplantation embryo to insulin-like growth factor 1, activin A, and WNT7A. BMC Dev. Biol. 2018, 18, 16. [Google Scholar] [CrossRef] [PubMed] [Green Version]
- Arvanitidis, A.; Karsdal, M.A. Type XXVIII Collagen. In Biochemistry of Collagens, Laminins and Elastin; Karsdal, M.A., Ed.; Elsevier: Amsterdam, The Netherlands, 2016; pp. 159–161. [Google Scholar]
- Legay, C.; Dobbertin, A. Collagens at the vertebrate neuromuscular junction, from structure to pathologies. Neurosci. Lett. 2020, 735, 135155. [Google Scholar] [CrossRef] [PubMed]
- Kenyon, P.R.; Corner-Thomas, R.A. Breeding Ewe Lambs: An Australasian Perspective. Animals 2022, 12, 3207. [Google Scholar] [CrossRef]
- Khanzadeh, H.; Ghavi Hossein-Zadeh, N.; Ghovvati, S. A meta-analysis of the gap between pedigree-based and genomic heritability estimates for production traits in dairy cows. Livest. Sci. 2022, 263, 105000. [Google Scholar] [CrossRef]
- Shin, D.; Park, K.D.; Ka, S.; Kim, H.; Cho, K.H. Heritability Estimated Using 50K SNPs Indicates Missing Heritability Problem in Holstein Breeding. Genom. Inform. 2015, 13, 146–151. [Google Scholar] [CrossRef] [Green Version]
- Manolio, T.A.; Collins, F.S.; Cox, N.J.; Goldstein, D.B.; Hindorff, L.A.; Hunter, D.J.; McCarthy, M.I.; Ramos, E.M.; Cardon, L.R.; Chakravarti, A.; et al. Finding the missing heritability of complex diseases. Nature 2009, 461, 747–753. [Google Scholar] [CrossRef] [Green Version]
- Swan, A.; Brown, D.; Daetwyler, H.D.; Hayes, B.J.; Kelly, M.; Moghaddar, N.; Van Der Werf, J.H. Genomic evaluations in the Australian sheep industry. In Proceedings of the 10th World Congress on Genetics Applied to Livestock Production, Vancouver, BC, Canada, 17–22 August 2014. [Google Scholar]
- Hsia, H.C.; Schwarzbauer, J.E. Meet the Tenascins: Multifunctional and Mysterious. J. Biol. Chem. 2005, 280, 26641–26644. [Google Scholar] [CrossRef] [Green Version]
- Shraiman, B.I. Mechanical feedback as a possible regulator of tissue growth. Proc. Natl. Acad. Sci. USA 2005, 102, 3318–3323. [Google Scholar] [CrossRef] [Green Version]
- Aegerter-Wilmsen, T.; Aegerter, C.M.; Hafen, E.; Basler, K. Model for the regulation of size in the wing imaginal disc of Drosophila. Mech. Dev. 2007, 124, 318–326. [Google Scholar] [CrossRef]
- LeGoff, L.; Lecuit, T. Mechanical Forces and Growth in Animal Tissues. Cold Spring Harb. Perspect. Biol. 2016, 8, a019232. [Google Scholar] [CrossRef] [Green Version]
- Wartlick, O.; Mumcu, P.; Jülicher, F.; Gonzalez-Gaitan, M. Understanding morphogenetic growth control—Lessons from flies. Nat. Rev. Mol. Cell Biol. 2011, 12, 594–604. [Google Scholar] [CrossRef]
- Cobham, A.E.; Mirth, C.K. The development of body and organ shape. BMC Zool. 2020, 5, 14. [Google Scholar] [CrossRef]
- Kenyon, P.R.; Corner-Thomas, R.A.; Paganoni, B.L.; Morris, S.T. Percentage of Mature Liveweight Affects Reproductive Performance in Ewe Lambs. In Proceedings of the 30th Biennial Conference of the Australian Society of Animal Production, Canberra, Australia, 8–12 September 2014; Volume 30, p. 255. [Google Scholar]
- Lin, Y.S.; Zhou, H.; Forrest, R.H.J.; Frampton, C.M.; Burrows, L.E.R.; Hickford, J.G.H. Association between variation in faecal egg count for a natural mixed field-challenge of nematode parasites and TLR4 variation. Vet. Parasitol. 2016, 218, 5–9. [Google Scholar] [CrossRef]
- Xu, S.-S.; Li, M.-H. Recent advances in understanding genetic variants associated with economically important traits in sheep (Ovis aries) revealed by high-throughput screening technologies. Front. Agric. Sci. Eng. 2017, 4, 279–288. [Google Scholar] [CrossRef] [Green Version]
- Li, S.; Zhou, H.; Zhao, F.; Fang, Q.; Wang, J.; Liu, X.; Luo, Y.; Hickford, J.G.H. Nucleotide Sequence Variation in the Insulin-Like Growth Factor 1 Gene Affects Growth and Carcass Traits in New Zealand Romney Sheep. DNA Cell Biol. 2021, 40, 265–271. [Google Scholar] [CrossRef]
- Ding, N.; Tian, D.; Li, X.; Zhang, Z.; Tian, F.; Liu, S.; Han, B.; Liu, D.; Zhao, K. Genetic Polymorphisms of IGF1 and IGF1R Genes and Their Effects on Growth Traits in Hulun Buir Sheep. Genes 2022, 13, 666. [Google Scholar] [CrossRef]
- Gebauer, J.M.; Kobbe, B.; Paulsson, M.; Wagener, R. Structure, evolution and expression of collagen XXVIII: Lessons from the zebrafish. Matrix Biol. 2016, 49, 106–119. [Google Scholar] [CrossRef]
- Klein, C.; Troedsson, M.H.T. Transcriptional Profiling of Equine Conceptuses Reveals New Aspects of Embryo-Maternal Communication in the Horse1. Biol. Reprod. 2011, 84, 872–885. [Google Scholar] [CrossRef] [Green Version]
- Li, H.; Hu, J.; Liu, Y.; Wang, X.; Tang, S.; Chen, X.; Niu, M.; Waili, N.; Bai, Y.; Wei, Y. Effects of prenatal hypoxia on fetal sheep heart development and proteomics analysis. Int. J. Clin. Exp. Pathol. 2018, 11, 1909–1922. [Google Scholar] [PubMed]
- Aboul-Naga, A.M.; Alsamman, A.M.; El Allali, A.; Elshafie, M.H.; Abdelal, E.S.; Abdelkhalek, T.M.; Abdelsabour, T.H.; Mohamed, L.G.; Hamwieh, A. Genome-wide analysis identified candidate variants and genes associated with heat stress adaptation in Egyptian sheep breeds. Front. Genet. 2022, 13, 898522. [Google Scholar] [CrossRef]
- Gao, H.; Wu, G.; Spencer, T.E.; Johnson, G.A.; Bazer, F.W. Select Nutrients in the Ovine Uterine Lumen. IV. Expression of Neutral and Acidic Amino Acid Transporters in Ovine Uteri and Peri-Implantation Conceptuses. Biol. Reprod. 2009, 80, 1196–1208. [Google Scholar] [CrossRef] [PubMed] [Green Version]
- Forde, N.; Simintiras, C.A.; Sturmey, R.; Mamo, S.; Kelly, A.K.; Spencer, T.E.; Bazer, F.W.; Lonergan, P. Amino Acids in the Uterine Luminal Fluid Reflects the Temporal Changes in Transporter Expression in the Endometrium and Conceptus during Early Pregnancy in Cattle. PLoS ONE 2014, 9, e100010. [Google Scholar] [CrossRef] [PubMed]
- Gibson, C.; de Ruijter-Villani, M.; Rietveld, J.; Stout, T.A.E. Amino acid transporter expression in the endometrium and conceptus membranes during early equine pregnancy. Reprod. Fertil. Dev. 2018, 30, 1675–1688. [Google Scholar] [CrossRef] [PubMed]
- De, S.; Marcinkiewicz, J.L.; Vijayaraghavan, S.; Kline, D. Expression of 14-3-3 protein isoforms in mouse oocytes, eggs and ovarian follicular development. BMC Res. Notes 2012, 5, 57. [Google Scholar] [CrossRef] [PubMed] [Green Version]
- Eisa, A.A.; De, S.; Detwiler, A.; Gilker, E.; Ignatious, A.C.; Vijayaraghavan, S.; Kline, D. YWHA (14-3-3) protein isoforms and their interactions with CDC25B phosphatase in mouse oogenesis and oocyte maturation. BMC Dev. Biol. 2019, 19, 20. [Google Scholar] [CrossRef] [PubMed] [Green Version]


| Contemporary Group | n | Year Born | Dam Age 2 | Birth Rank | Feed Treatment |
|---|---|---|---|---|---|
| 16GenA 1 | 371 | 2016 | Mature ewes | Singletons and twins | Normal, Group A |
| 16GenB 1 | 355 | 2016 | Mature ewes | Singletons and twins | Normal, Group B |
| 16ComA 1 | 53 | 2016 | Mature ewes | Singletons and twins | Normal, Group A |
| 16ComB 1 | 59 | 2016 | Mature ewes | Singletons and twins | Normal, Group B |
| 17MatNorm | 134 | 2017 | Mature ewes | Twins | Normal |
| 17MatPref | 135 | 2017 | Mature ewes | Twins | Supplementary feeding from weaning to breeding |
| 17LambSing | 133 | 2017 | Ewe lambs | Singletons | Supplementary feeding from weaning to breeding |
| 17LambTwin | 87 | 2017 | Ewe lambs | Twins | Supplementary feeding from weaning to breeding |
| Trait | Pedigree-Based Variance Component Estimates | Genomic Variance Component Estimates | ||||||||
|---|---|---|---|---|---|---|---|---|---|---|
| Correlations | ||||||||||
| LWT | 9.73 ± 1.94 | 7.46 ± 1.55 | 17.19 ± 0.77 | 0.57 ± 0.10 | = 0.19 ± 0.03 | 9.23 ± 1.53 | 15.33 ± 1.13 | 24.56 ± 1.09 | 0.38 ± 0.05 | |
| Preg | 0.08 ± 0.03 | 0.17 ± 0.02 | 0.40 ± 0.07 | 0.31 ± 0.11 | = 0.69 ± 0.14 | 0.035 ± 0.01 | 0.22 ± 0.01 | 0.25 ± 0.01 | 0.14 ± 0.05 | |
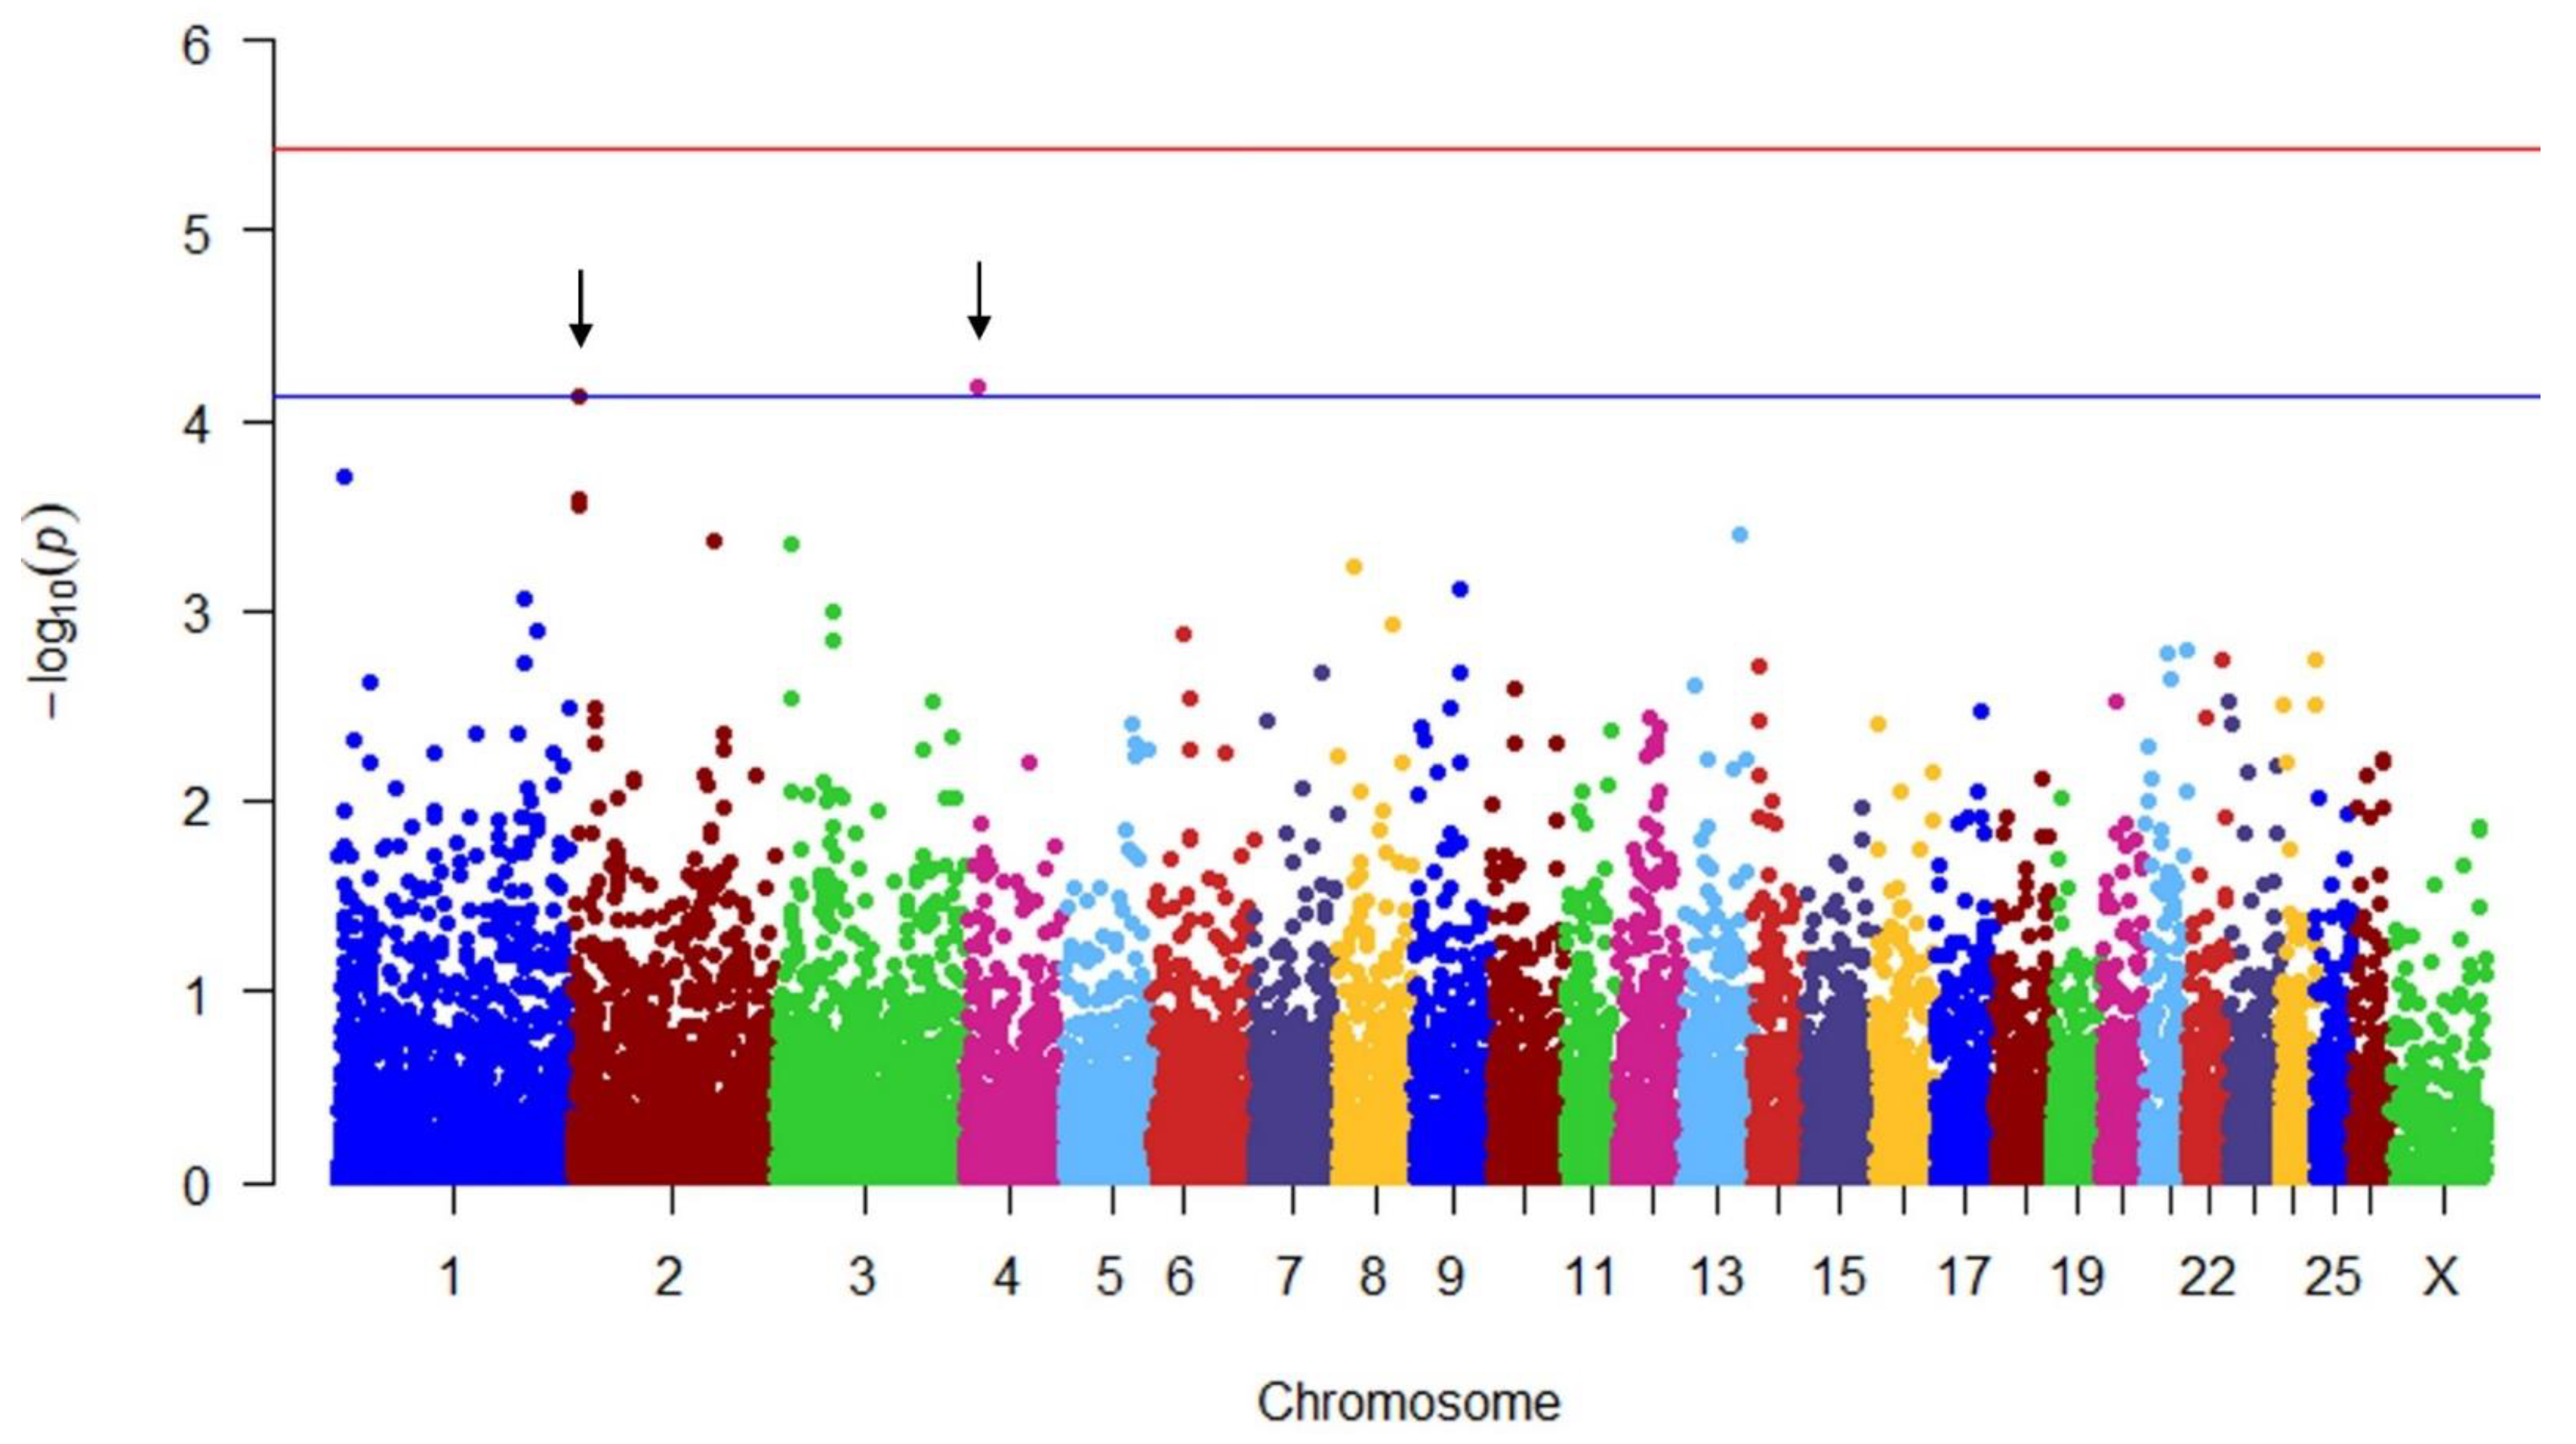
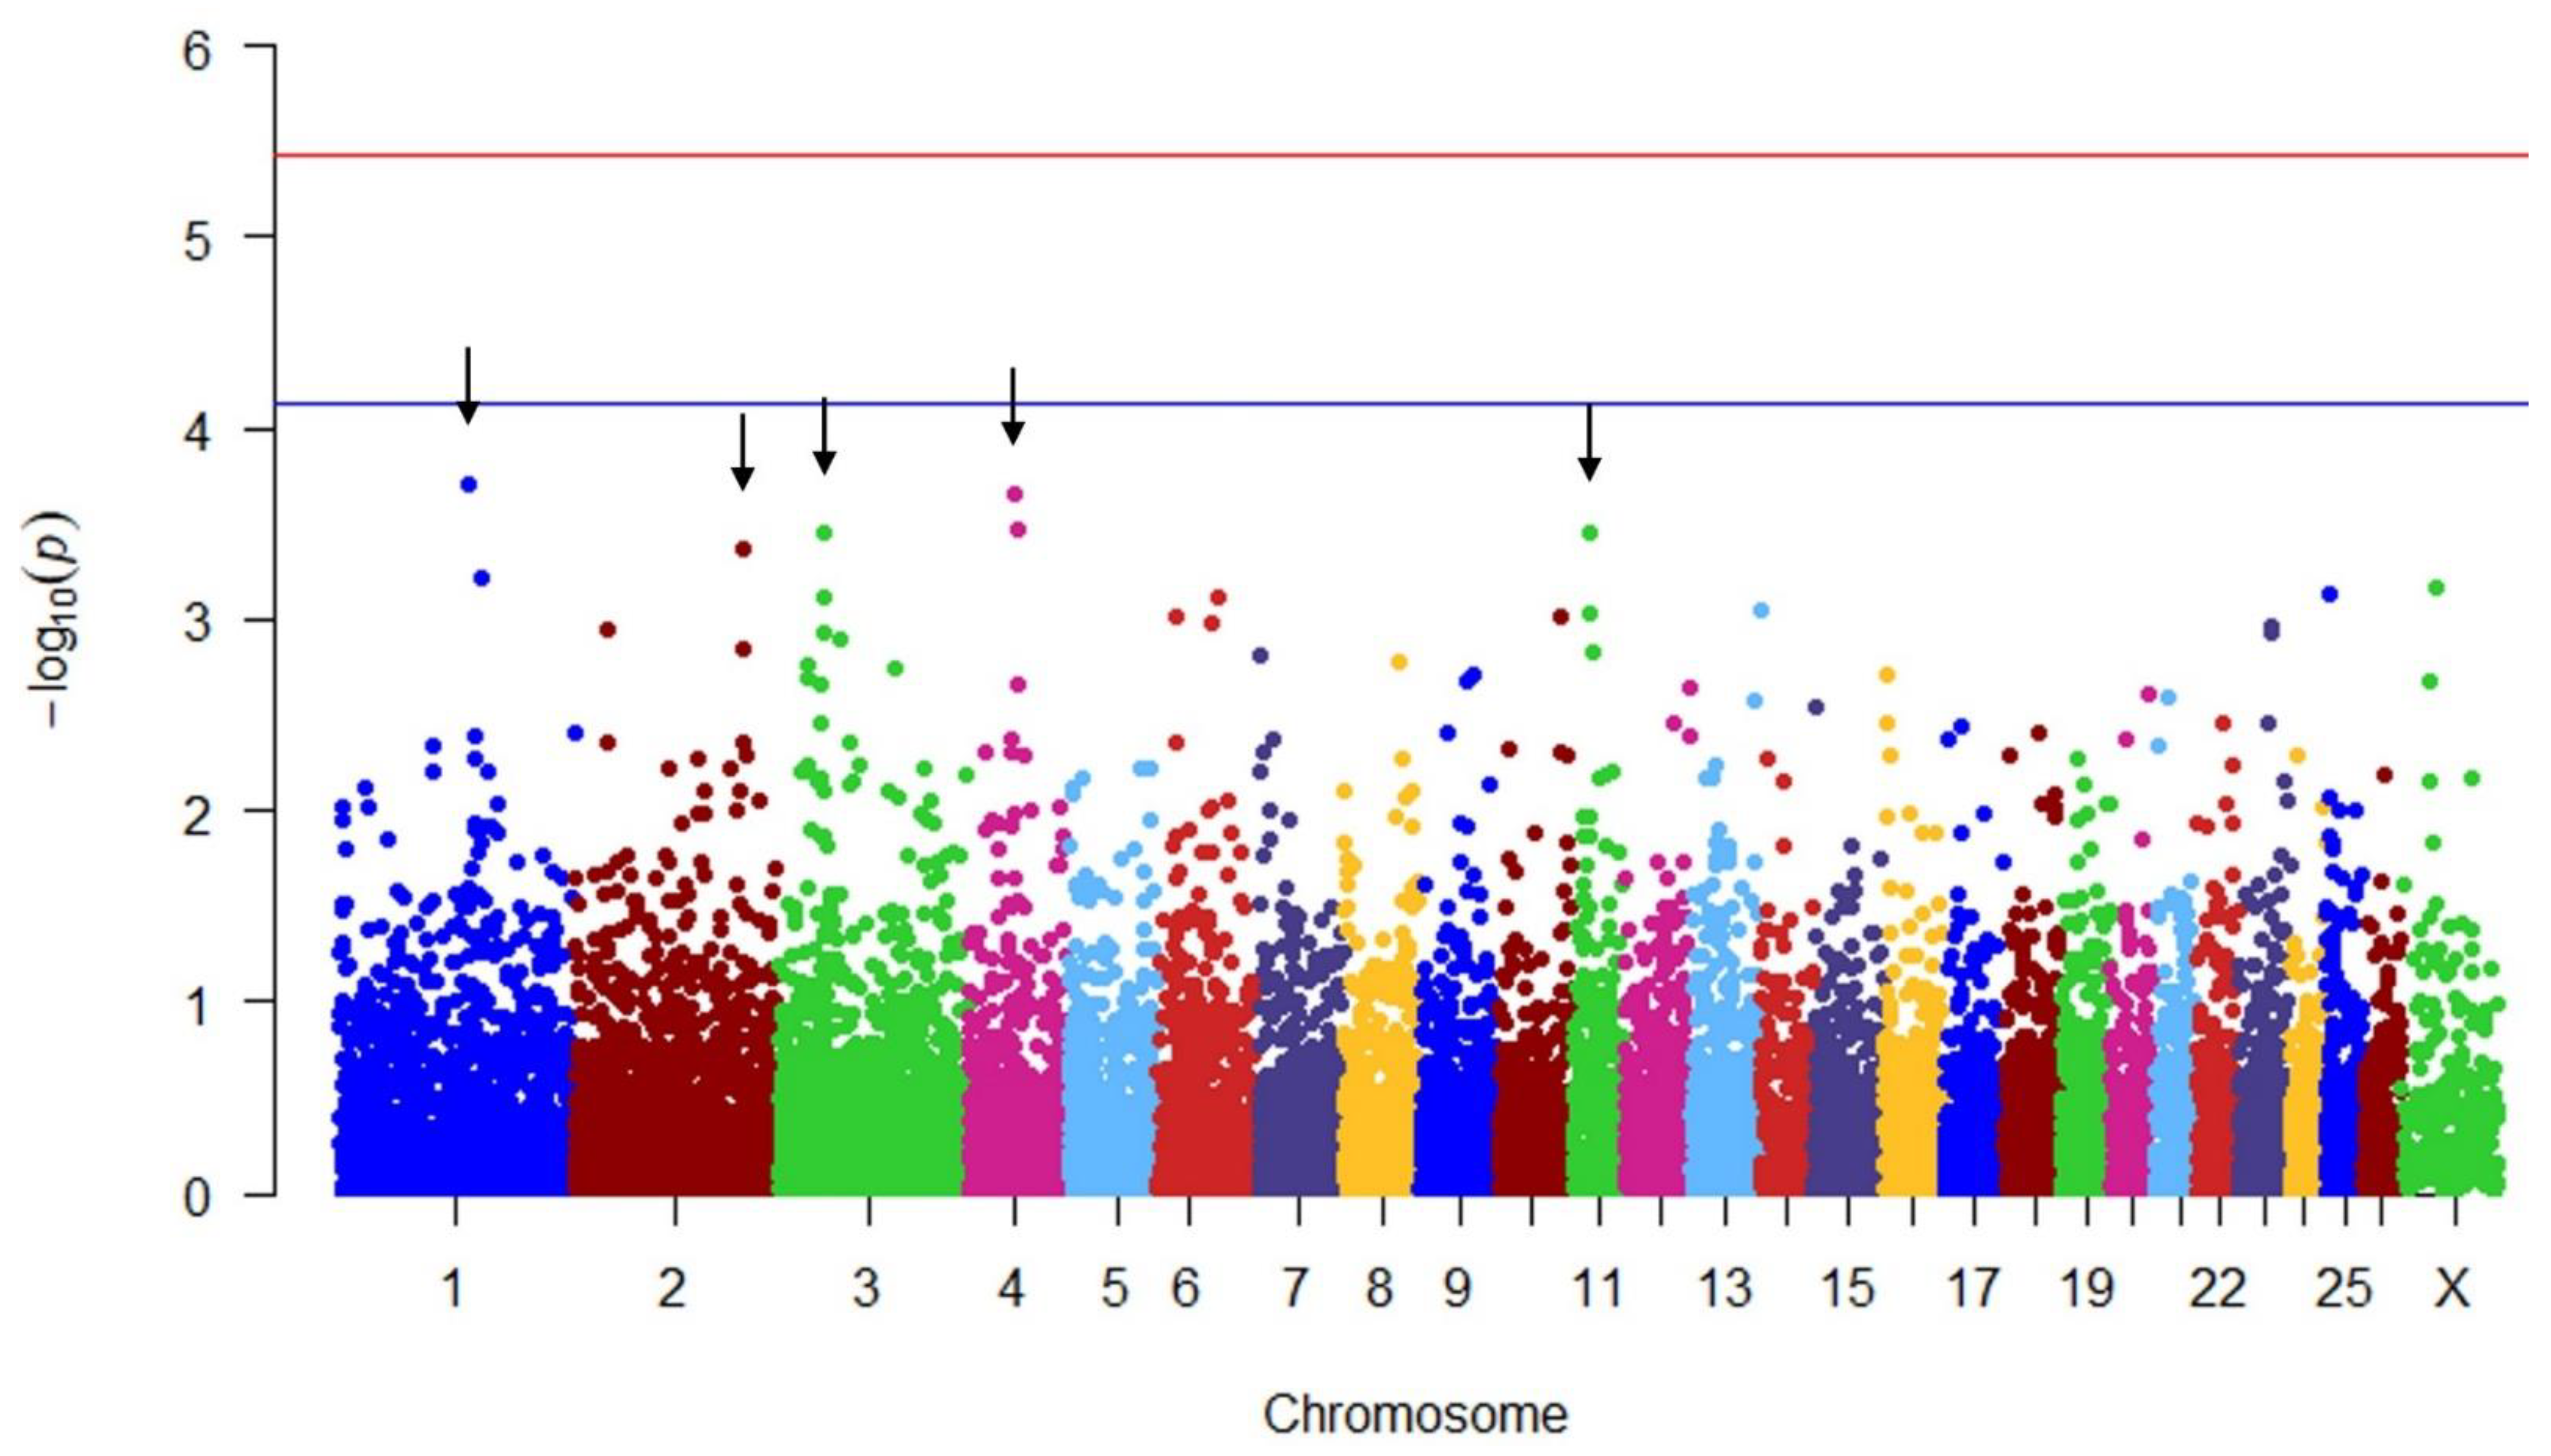
| Trait | Chr | Position | Effect | Effect SE | −log10 (p Value) | Gene 1 |
|---|---|---|---|---|---|---|
| LWT | 2 | 9,111,357 | −0.722 | 0.182 | 4.123808 | TNC, TNFSF8 |
| LWT | 4 | 17,435,731 | 0.840 | 0.210 | 4.183784 | COL28A1 |
| Preg | 1 | 165,324,517 | −0.094 | 0.025 | 3.708944 | Long non-coding RNA |
| Preg | 2 | 221,329,561 | 0.076 | 0.022 | 3.366369 | PARD3B |
| Preg | 3 | 55,593,107 | −0.076 | 0.021 | 3.457839 | Uncharacterized location 2 |
| Preg | 4 | 62,075,731 | −0.089 | 0.024 | 3.658320 | SMIM30, GPR85 |
| Preg | 11 | 40,677,674 | −0.079 | 0.022 | 3.460317 | SERPINF1, SERPINF2, SLC43A2, WDR81, PRPF8, SCARF1, INPP5K, YWHAE, TLCD2, RILP, MYO1C, ENSOARG00020010695 |
| Trait | Gene | Name | Reactome Basic Function | Targeted Pathway Analysis | Reference |
|---|---|---|---|---|---|
| LWT | TNC | Tenascin C | Extracellular matrix organization | Implication in adaptative response of musculoskeletal tissues to mechanical stress | [30,31,32] |
| LWT | TNFSF8 | TNF superfamily member 8 | Immune System | Expressed on activated T cells Regulation of cell survival and apoptosis | [33,34] |
| LWT | COL28A1 | Collagen type XXVIII α 1 chain | Extracellular matrix organization | Collagen biosynthesis and modifying enzymes | [35,36] |
Disclaimer/Publisher’s Note: The statements, opinions and data contained in all publications are solely those of the individual author(s) and contributor(s) and not of MDPI and/or the editor(s). MDPI and/or the editor(s) disclaim responsibility for any injury to people or property resulting from any ideas, methods, instructions or products referred to in the content. |
© 2023 by the authors. Licensee MDPI, Basel, Switzerland. This article is an open access article distributed under the terms and conditions of the Creative Commons Attribution (CC BY) license (https://creativecommons.org/licenses/by/4.0/).
Share and Cite
Haslin, E.; Pettigrew, E.J.; Hickson, R.E.; Kenyon, P.R.; Gedye, K.R.; Lopez-Villalobos, N.; Jayawardana, J.M.D.R.; Morris, S.T.; Blair, H.T. Genome-Wide Association Studies of Live Weight at First Breeding at Eight Months of Age and Pregnancy Status of Ewe Lambs. Genes 2023, 14, 805. https://doi.org/10.3390/genes14040805
Haslin E, Pettigrew EJ, Hickson RE, Kenyon PR, Gedye KR, Lopez-Villalobos N, Jayawardana JMDR, Morris ST, Blair HT. Genome-Wide Association Studies of Live Weight at First Breeding at Eight Months of Age and Pregnancy Status of Ewe Lambs. Genes. 2023; 14(4):805. https://doi.org/10.3390/genes14040805
Chicago/Turabian StyleHaslin, Emmanuelle, Emma J. Pettigrew, Rebecca E. Hickson, Paul R. Kenyon, Kristene R. Gedye, Nicolas Lopez-Villalobos, J. M. D. R. Jayawardana, Stephen T. Morris, and Hugh T. Blair. 2023. "Genome-Wide Association Studies of Live Weight at First Breeding at Eight Months of Age and Pregnancy Status of Ewe Lambs" Genes 14, no. 4: 805. https://doi.org/10.3390/genes14040805