Article

Genome-Wide Association Study for Grain Protein, Thousand Kernel Weight, and Normalized Difference Vegetation Index in Bread Wheat (Triticum aestivum L.)

1
ICAR-Indian Institute of Wheat and Barley Research, Karnal 132001, India
2
ICAR-Sugarcane Breeding Institute, Coimbatore 641007, India
3
ICAR-Indian Agricultural Research Institute, New Delhi 110012, India
4
ICAR-Indian Agricultural Research Institute, Gauria Karma 825411, India
5
ICAR-National Bureau of Plant Genetic Resources, New Delhi 110012, India
*
Author to whom correspondence should be addressed.
Genes 2023, 14(3), 637; https://doi.org/10.3390/genes14030637
Submission received: 7 February 2023 / Revised: 24 February 2023 / Accepted: 28 February 2023 / Published: 3 March 2023
(This article belongs to the Special Issue Wheat Genomics, Genetics and Breeding)

Abstract

:
Genomic regions governing grain protein content (GPC), 1000 kernel weight (TKW), and normalized difference vegetation index (NDVI) were studied in a set of 280 bread wheat genotypes. The genome-wide association (GWAS) panel was genotyped using a 35K Axiom array and phenotyped in three environments. A total of 26 marker-trait associations (MTAs) were detected on 18 chromosomes covering the A, B, and D subgenomes of bread wheat. The GPC showed the maximum MTAs (16), followed by NDVI (6), and TKW (4). A maximum of 10 MTAs was located on the B subgenome, whereas, 8 MTAs each were mapped on the A and D subgenomes. In silico analysis suggest that the SNPs were located on important putative candidate genes such as NAC domain superfamily, zinc finger RING-H2-type, aspartic peptidase domain, folylpolyglutamate synthase, serine/threonine-protein kinase LRK10, pentatricopeptide repeat, protein kinase-like domain superfamily, cytochrome P450, and expansin. These candidate genes were found to have different roles including regulation of stress tolerance, nutrient remobilization, protein accumulation, nitrogen utilization, photosynthesis, grain filling, mitochondrial function, and kernel development. The effects of newly identified MTAs will be validated in different genetic backgrounds for further utilization in marker-aided breeding.

1. Introduction

Wheat is one of the essential staple foods around the world. Wheat-based products are gaining increased demand because of changing dietary habits driven by urbanization along with industrialization. It is the main source of energy and starch and also provides a considerable quantity of protein, vitamins, dietary fibers, and phytochemicals that are beneficial or essential for health. Reduced secondary immunity due to protein energy malnutrition (PEM) is considered to be the most frequent cause of various diseases in human beings, and, in acute cases, clinically these are referred to as marasmus or kwashiorkor [1]. Further, severe PEM affects children’s cognitive development [2]. The protein concentration and composition are the two important determinants of both nutritional and end-use quality [3]. Gluten proteins (∼80%) are the major storage proteins that influence the baking process through flour’s functional properties. Grain protein content and hardness are the two key determinants of wheat grain quality to classify quality class in international trade and also to decide the suitability of the quality class to different types of end products [4].
The protein concentration in wheat is the result of genetic makeup, environmental effect, and genotype-environment interaction (GEI). GPC is a highly complex quantitative trait with substantial environmental (particularly nitrogen availability) and GEI effects. Several studies suggested the substantial effect of environment and GEI on GPC, TKW, and NDVI traits [5,6,7,8]. The process of protein enhancement is further complicated by the existence of trade-off between grain protein and yield in wheat. Therefore, crop improvement programs need to infuse more genetic diversity using wheat landraces and crop wild relatives [9]. High-grain protein concentration has been effectively transferred to modern cultivars through traditional plant breeding methods. High protein genes present in genetic resources like Atlas 50 and Atlas 66 have widely been utilized in breeding programs [10]. In addition, wild relatives have been utilized for a few high-protein genes in different breeding programs. For instance, in Israel, wild emmer, particularly accession FA15-3, is one of the most widely exploited germplasm for high grain protein, which can accumulate about 40% protein under adequate nitrogen fertilization [11]. The region controlling GPC is mapped on the 6BS chromosome and is designated as the Gpc-B1 gene [12]. The designated gene through a NAC transcription factor, i.e., NAM-B1, has a pleiotropic effect, which enhances protein, iron, and zinc [13], due to faster senescence leading to remobilization of nutrients from source to sink [14].
The NDVI estimation provides the overall quantification of ground coverage along with the nitrogen status of the crop. It is an important physiological tool having high correlations with yield, biomass, and nitrogen content in wheat [15]. The NDVI could be used as a surrogate trait for the indirect assessment of leaf health for photosynthesis [16]. Therefore, both GPC and NDVI are related traits with much dependency on the genetic potential for nitrogen use efficiency. Although TKW in wheat has no nutritional importance by itself, but it has a concentration/dilution effect that influences the other nutrients including protein and micronutrient concentration. The simultaneous increase in grain yield coupled with reduced protein content was attributed to the dilution effect in wheat, which is demonstrated in many studies [17,18]. Thus, TKW is a key economic trait in crop improvement programs because of its role in the expression of grain yield and quality. While breeding for higher grain protein content, TKW always needs to be considered, as the shriveled grains always overestimate the protein content.
The quantitative traits like GPC, TKW, and NDVI need to be studied through genetic and molecular approaches for harnessing them through marker-assisted breeding (MAB). Further identifying linked molecular markers through QTL mapping would aid in the improvement of these polygenic traits [19,20]. The GWAS and quantitative trait loci (QTL) mapping are the two most commonly used approaches for understanding the genetics of quantitative traits. The conventional approach of QTL mapping depends on the genetic composition of bi-parental populations. A large number of QTLs have been identified in the last decade in wheat for the expression of GPC [21,22,23,24,25], TKW [26,27,28,29], and NDVI [30,31,32] through bi-parental-based conventional QTL mapping approach. However, the mapping resolution is very low in bi-parental population-based QTLs due to limited crossovers.
Alternatively, the linkage disequilibrium-based (LD) association mapping (AM) approach can enhance the genetic map resolution to a greater extent due to the representation of a wider gene pool and more recombination events in history [33]. The GWAS method detects non-random associations of markers distributed across the genome with the phenotype [34] and has extensively been utilized to identify marker-trait associations in crop plants [35]. The utilization of diverse lines that have accumulated more crossovers since their most recent progenitors diverged has greatly improved the QTL resolution in the GWAS mapping approach [36]. The GWAS approach overcomes the two general shortcomings, i.e., low allelic diversity and mapping resolution of bi-parental studies [37].
However, the control of the false positive rate in GWAS due to population structure and family association is one of the main limitations [38]. To reduce the false positives, a statistical package of BLINK is highly useful, as it eliminates the basic assumption of equal distribution of causal genes throughout the genome, and the statistical power is better when compared with other available GWAS models such as SUPER and FarmCPU [39].
Through the GWAS approach, many marker-trait linkages were found for GPC [40,41,42], TKW [43,44,45,46], and NDVI [47,48,49,50,51] in wheat using a GWAS panel with a diverse set of genotypes. Several MTAs/QTLs have been mapped on all three subgenomes of wheat; however, more mapping studies are required as the saturation point may not be reached [52]. Further, these traits are environmentally sensitive, hence, detection and validation of consistent MTAs in multi-location or multi-year studies are important to use in marker-aided breeding. Moreover, hexaploid wheat has three subgenomes with a size of ~17 Gb [53], with the limited characterization of LD decay. Thus, further studies are required to understand the genetic basis and devise marker-based breeding approach to further complement conventional breeding efforts. The present investigation aims to identify MTAs related to GPC, TKW, and NDVI in a diverse set of bread wheat genotypes in multi-environments following the GWAS method and putative candidate genes associated with the SNPs.

2. Materials and Methods

2.1. Genotypes and Field Experiments

A set of 280 diverse bread wheat genotypes, including advanced elite genotypes and commercial varieties, was used for the mapping study. The details of the genotypes used in the study are given in Table S1. The set of genotypes was evaluated in three different environments, i.e., E1-ICAR-Indian Agricultural Research Institute, New Delhi; E2- ICAR-Indian Agricultural Research Institute, Jharkhand; and E3- ICAR-Indian Institute of Wheat and Barley, Karnal. The weather parameters of the experimental sites during crop season 2021–22 is illustrated in Figure 1. The experiment was conducted under irrigated conditions, and planting was done from 1st to 15th November at all the locations during the year 2021–2022 Rabi (winter) season. The recommended dose of NPK in the ratio of 150:60:40 kg/ha was applied as urea and diammonium phosphate (DAP) for nitrogen, DAP for phosphorus, and muriate of potash for potassium. Biotic stresses were effectively controlled by the fungicide (tebuconazole 25% EC), pesticide (imidacloprid 30.5 SC), and pre-emergence herbicide (pendimethalin 30% EC). An augmented block design was used, in which checks (DBW 187, MACS 6222, WH 1124, and WH 1142) were replicated in each block of two rows of two-meter length.

2.2. Data Recording and Statistical Analysis

Phenotyping of 280 genotypes for GPC, TKW, and NDVI was done at three locations. The GPC was recorded with the infra-red transmittance-based instrument Infratech 1125, and the estimated readings were expressed at a 12.0% moisture level. A random sample of 1000 grains was counted, and the weight has been measured in an electric weighing machine. NDVI was recorded at the maximum vegetative stage (Zadok’s scale 41) using a handheld crop sensor, i.e., GreenSeeker (Trimble industries, Inc., Westminster, CO, USA), which was held 50 cm above the canopy facing the center of the plot to record the NDVI. Approximately, 3–4 NDVI readings/plot were recorded, and the mean represents the NDVI reading for that particular plot. The data for various genetic parameters were analyzed using the R package “augmented RCBD” [54].

2.3. Genotyping and Quality Control (QC)

The genomic DNA was extracted using the cetyltrimethylammonium bromide (CTAB) method [55]. The pure seeds of each genotype were sown in a plastic tray with separate chambers, and the leaf samples were collected from 21-day-old seedlings from each genotype. The collected leaf samples were thoroughly washed with distilled water and dried on blotting paper. The dried leaf samples were cut into 1.5–2.5 cm length and kept in a mortar and pestle. The leaf sample was finely ground and transferred into a 2.0 mL Eppendorf tube, added with 700 μL pre-warmed 2% CTAB extraction buffer along with 0.2 vol% β-mercaptoethanol, and incubated in a water bath at 65 °C for 45 min. A total of 750 μL of chloroform/iso-amayl alcohol in the ratio of 24:1 was put into the tube and shaken thoroughly. The mixture in a tube was centrifuged at 12,000 rpm for 12 min, and the resulting supernatant was collected in a 1.5 mL tube. Later on, 700 μL cold iso-propanol was added and shaken slowly by inverting the Eppendorf tube. The tubes were kept under freezing conditions for 2 h at −20 °C and subsequently centrifuged at 12,000 rpm for 10 min, which results in DNA pellet. The DNA was treated with RNaseA, and the concentration was determined in a NanoDrop spectrophotometer. The genotyping of 280 genotypes was done using Axiom Wheat Breeder’s genotyping array (Affymetrix, Santa Clara, CA, USA) consisting of 35,143 genome-wide SNPs. Stringent quality control was applied through the removal of monomorphic markers, markers with minor allele frequency (MAF) of 20%, and heterozygote frequency of >25.0%. A total of 14,790 curated markers were further utilized for the GWAS study.

2.4. Population Statistics and GWAS

Pairwise LD values (r2) were calculated using Analysis by aSSociation Evolution and Linkage (TASSEL) version 5.0 [56]. The LD block size of the whole genome, as well as individual subgenomes was calculated by fixing the r2 threshold at half LD decay. The PCA and kinship association were estimated using GAPIT [57]. Phenotypic data of GPC, TKW, and NDVI of the GWAS panel and corresponding genotypic data were used in GWAS analysis. Significant MTAs were detected through BLINK (Bayesian-information and linkage disequilibrium iteratively nested keyway) model [39] implemented in Genome Association and Prediction Integrated Tool (GAPIT) version 3.0 [58] in the R software package. The SNPs with p ≤ 0.0001 were considered significantly associated, and R2 reflects the percent phenotypic variation (PVE).

2.5. In Silico Analysis

The sequence information of the significant SNPs was used to search for putative candidate genes with BLAST using default parameters in the Ensemble Plants database (http://plants.ensembl.org/index.html (accessed on 23 December 2022)) of the bread wheat genome (IWGSC (RefSeq v1.0)). The genes located in the overlapping and within the region of 0.1 Mb intervals flanking either side of the linked marker were recorded as putative candidate genes. The role of the detected genes in the regulation of GPC, TKW, and NDVI was also determined by comparing with the earlier reports in both wheat and other crop plants.

3. Results

3.1. Variability, Heritability, and Correlation

The genetic parameters of 280 genotypes given in Table 1, which exhibited a large range of variability across the environments for GPC, TKW, and NDVI, ranging from 09.59–16.71%, 28.38–55.98 gm, and 0.32–0.71, respectively. The percent CV was less than 8.0% in all the environments for all three traits, which ranged from 3.42–5.47% (GPC), 2.37–3.85% (TKW), and 6.58–7.65% (NDVI). Out of all the studied environments, E3 was found to be a relatively higher CV for all the traits. The trend of broad sense heritability of both GPC and NDVI are similar and lower than TKW, which recorded more than 80.0% in all the environments. The trait’s mean values are presented in Figure 2 as boxplots. All three traits recorded comparatively higher trait mean values in the E3 environment compared to other environments. The lowest trait mean values for GPC were recorded at E3, whereas, the lowest mean values for TKW and NDV were recorded at E2.
The frequency distribution of GPC, TKW, and NDVI in a set of 280 genotypes tested at E1–E3 during 2021–2022 is illustrated in Figure 3. The continuous frequency distribution was observed for GPC, TKW, and NDVI. Pearson’s correlation coefficient (r2) was estimated and illustrated in Figure 4. The direction of the correlation between GPC and TKW was similar in all three environments, and it was negatively associated. Further, a significant and strong negative correlation between GPC and TKW was observed in E2. None of the environments recorded a significant correlation between GPC and NDVI; however, the direction of the correlation was positive in E2 and E3, whereas, it was negative in E1. Similarly, the association between TKW and NDVI was negative and significant at E1, and also the direction of the association was similar in E3. However, the direction of the association was positive in E2.

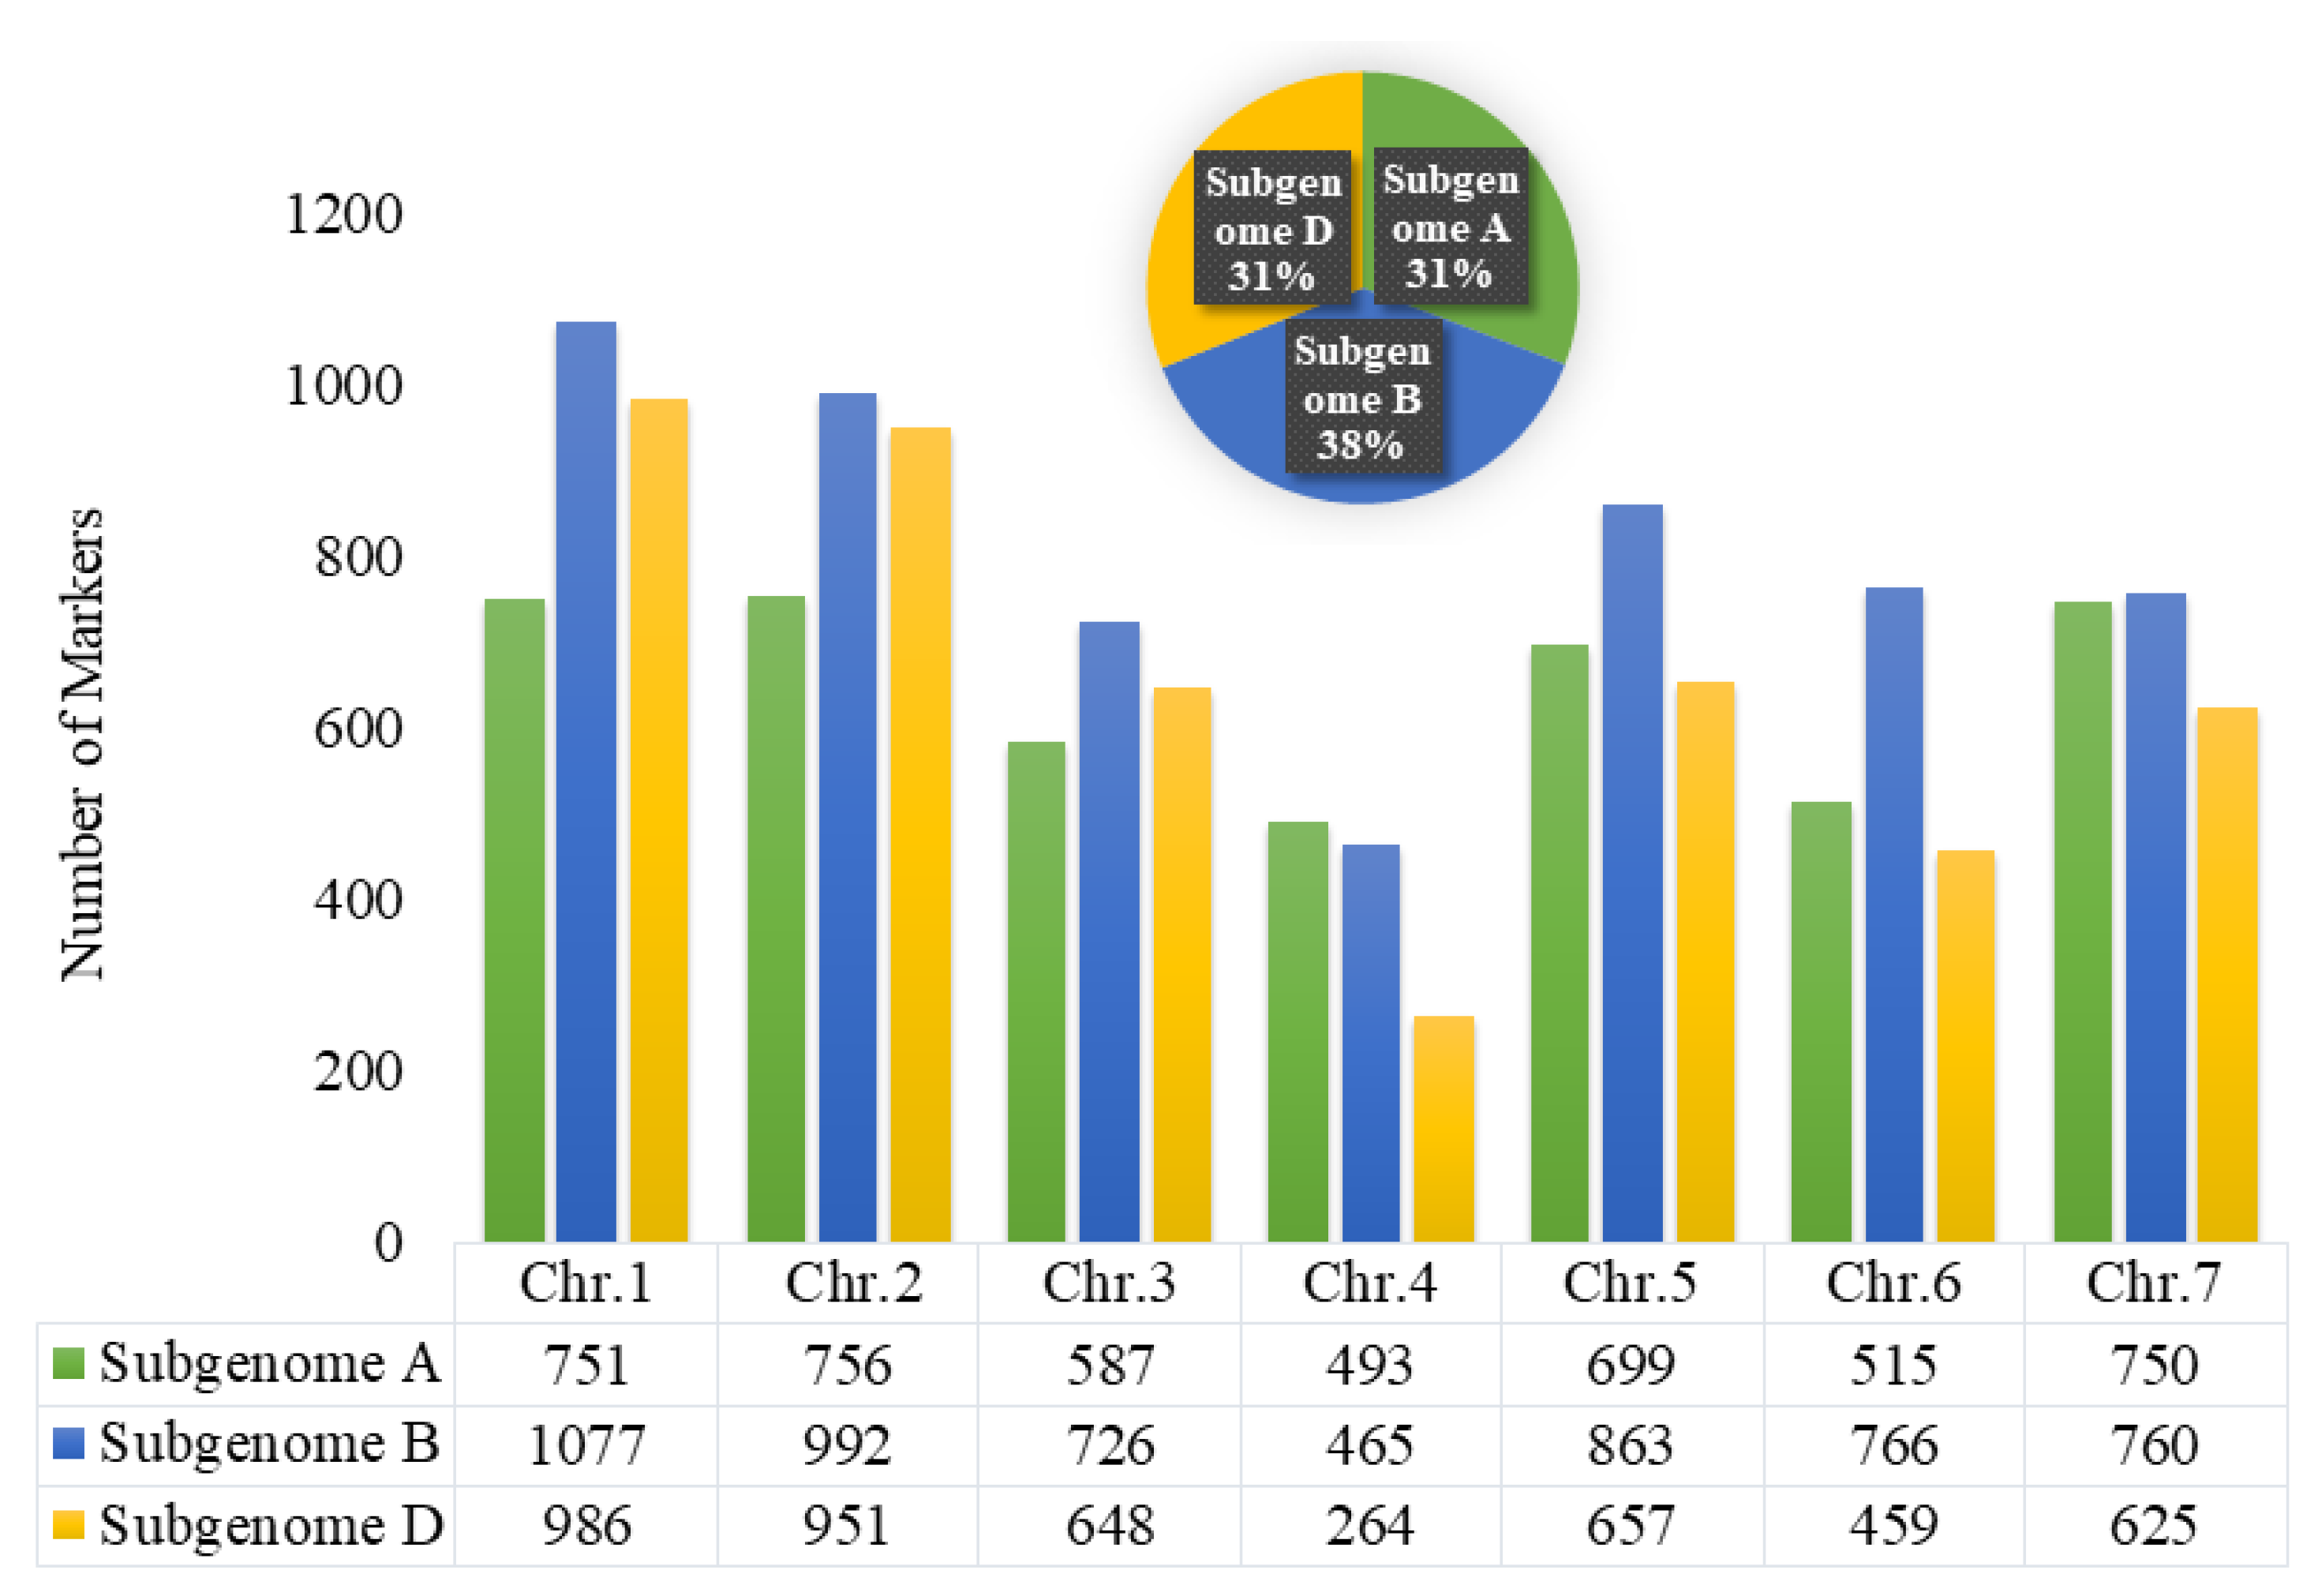
3.2. Marker Statistics

The genome-wide distribution of SNPs is illustrated in Figure 5. After a thorough quality check on the 35K SNP array, 14,790 high-quality markers were chosen. These markers that qualify for quality control are further utilized to identify MTAs through GWAS analysis. The subgenome-wise distribution of SNPs was highest with 5649 on subgenome B, whereas, the other two subgenomes were represented similarly with 4590 (subgenome D) and 4551 (subgenome A). Similarly, chromosome-wise maximum SNPs of 1077 were identified on 1B chromosome, whereas, the lowest number of 264 SNPs were identified on the 4D chromosome.

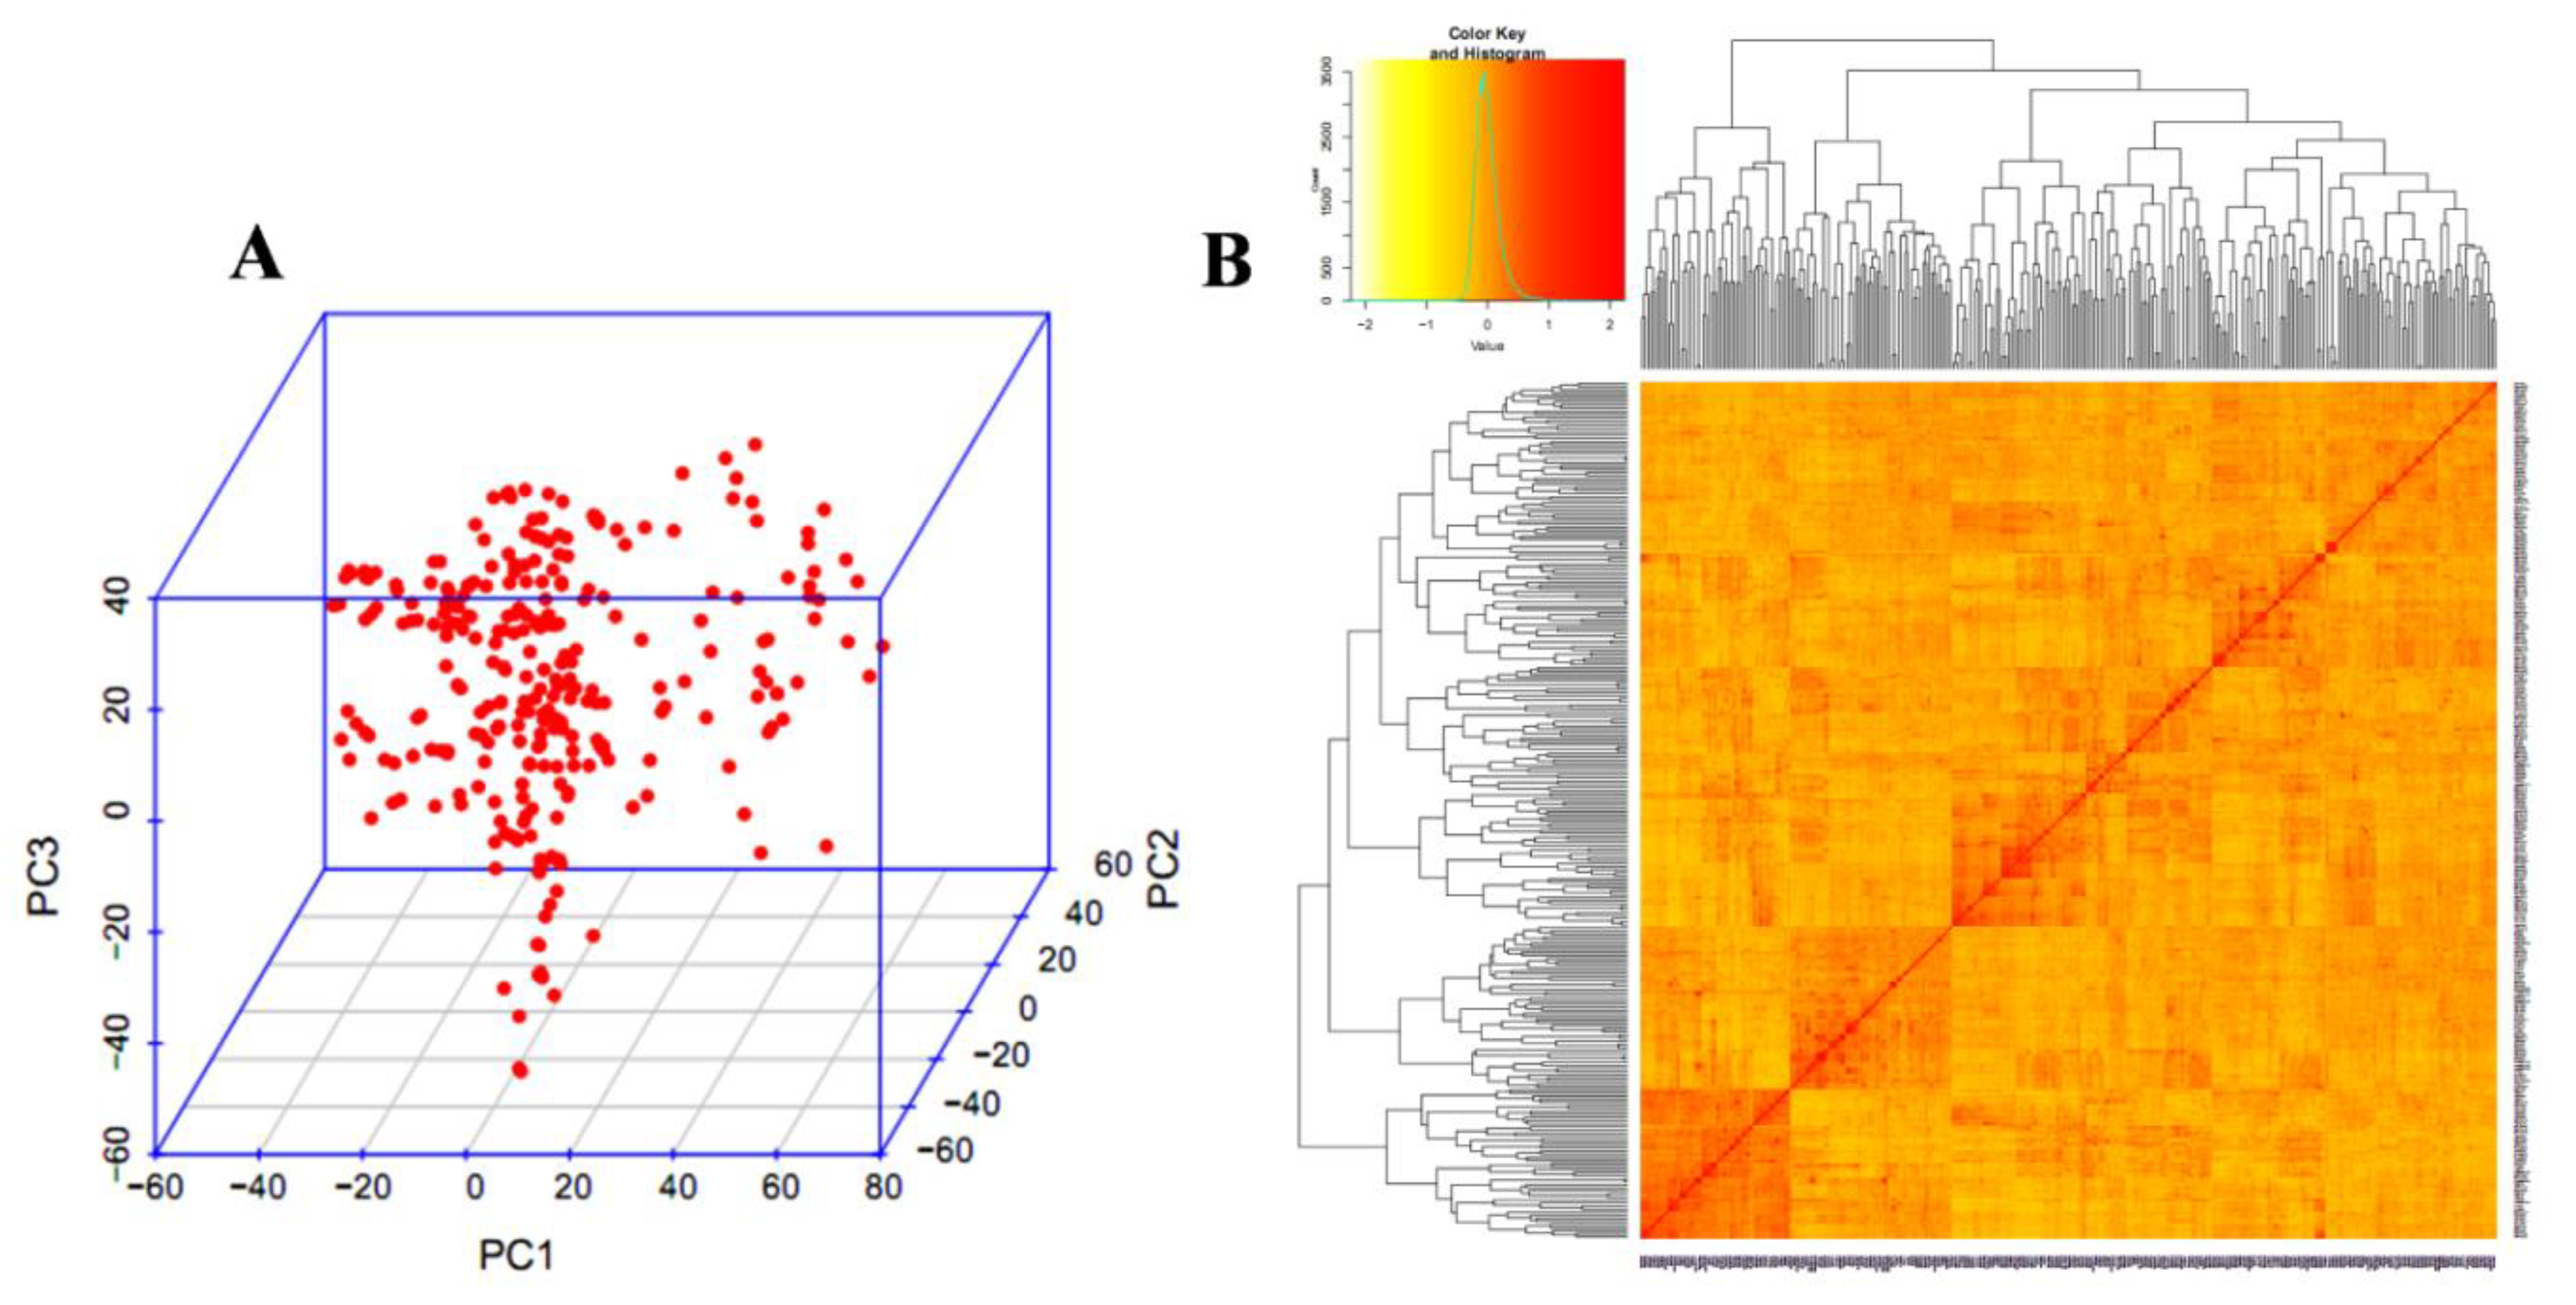
3.3. Population Structure and LD

The PCA and kinship relationship of the GWAS panel is illustrated in Figure 6, which reveals the absence of clear-cut sub-groups. The LD was calculated by using the squared correlation co-efficient (r2) of all the SNPs. The LD decay was rapid with 3.6 cM in A subgenome, followed by 5.2 cM in D subgenome and 5.7 cm in B subgenome, whereas, the whole genome LD decay was 4.9 cM.

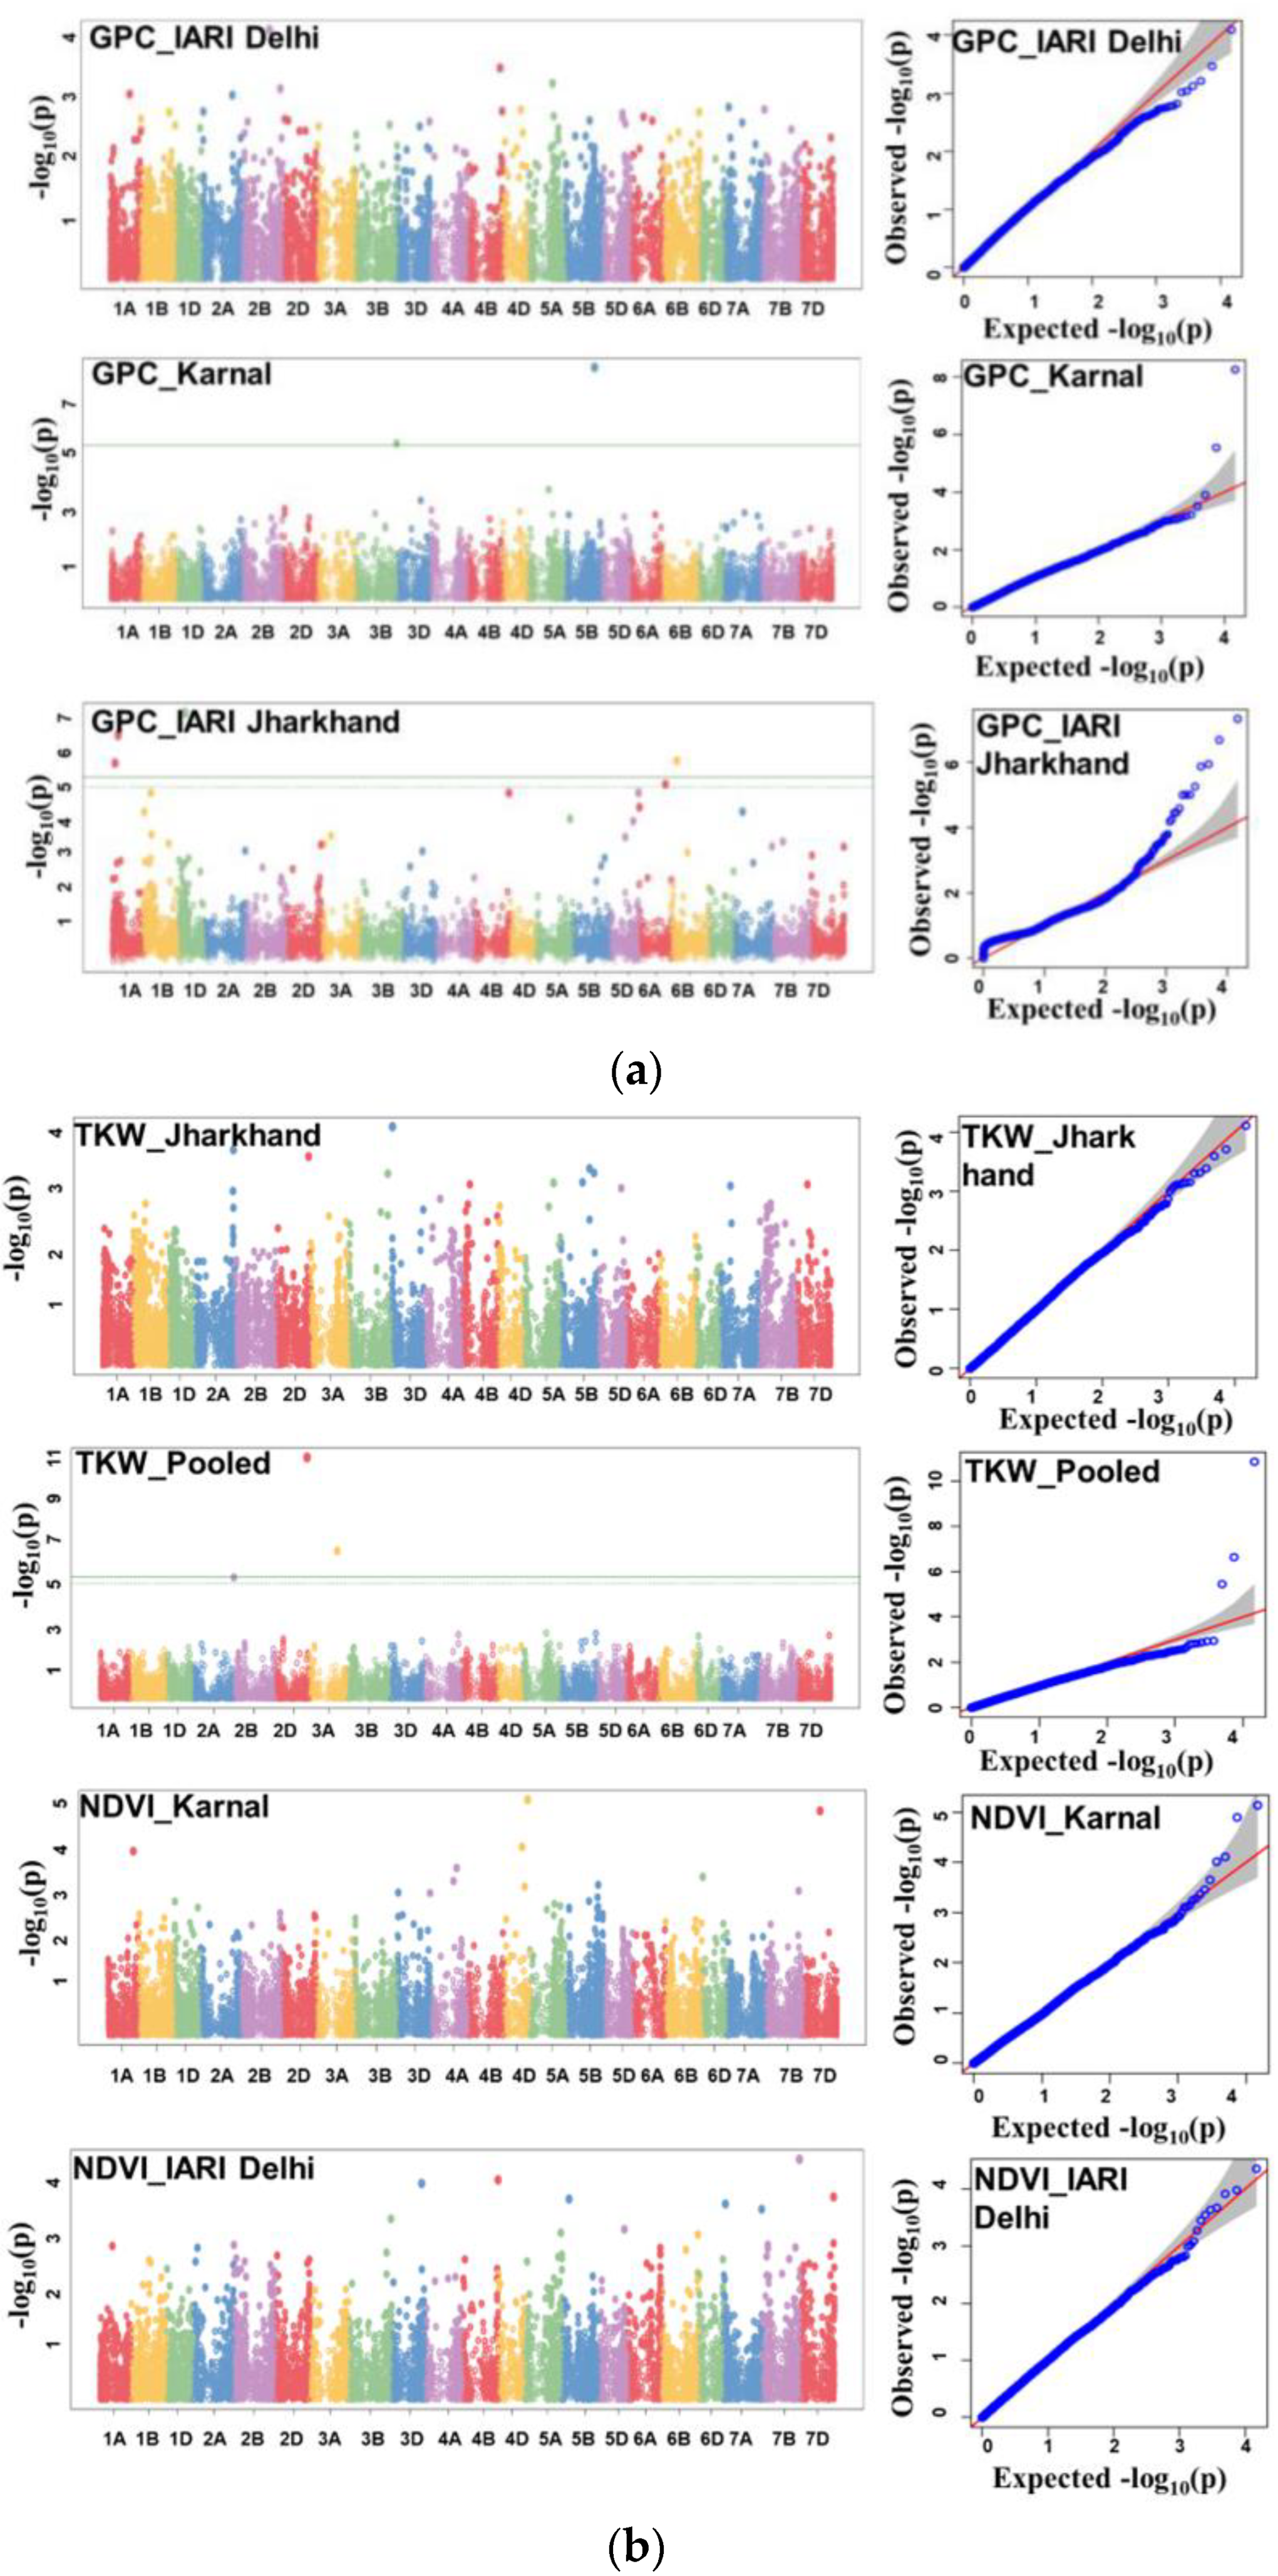
3.4. Genome-Wide Association Studies

A set of 26 significant MTAs was detected including 16 for GPC, 4 for TKW, and 6 for NDVI (Table 2). The details of the detected MTAs are presented in Table 2 and illustrated as Manhattan plots in Figure 7a,b. The Q–Q plots depicting the observed associations of SNPs of GPC, TKW, and NDVI compared to the expected associations after accounting for population structure are presented in Figure 7a,b.
A set of 16 significant MTAs was detected for GPC in E1, E2, and E3 on 1A, 1B, 1D, 2B, 3B, 4B, 5A, 5B, 5D, 6A, 6B, and 7A and PVE ranged from 6.2% (AX-94749397) to 11.4% (AX-95248629). Out of 16 MTAs, AX-95248629 (5B), AX-94746929(3B), AX-94714023 (2B), and AX-94520919 (5D) explained more than 10.0% PVE, which were located at 580.4 Mb, 800.9 Mb, 536.3 Mb, and 550.1 Mb, respectively. The highest number of MTAs (13 nos.) were identified in E2 for GPC. The highest number of seven MTAs, i.e., AX-94714023 (2B), AX-94412218 (6B), AX-94770504 (4B), AX-95082115 (1B), AX-94749397 (1B), AX-95248629 (5B), and AX-94746929 (3B) were identified on B subgenome and located at 536.3 Mb, 100.2 Mb, 667.6 Mb, 144.1 Mb, 16.4 Mb, 58.4 Mb, and 800.9 Mb, respectively. PVE ranged from 6.2% (AX-94749397) to 11.4% (AX-95248629). Similarly, six MTAs, i.e., AX-94825050 (1A), AX-95107750 (1A), AX-94384140 (5A), AX-94537786 (6A), AX-95186193 (6A), and AX-95199688 (7A) were identified on A subgenome and located at 531.8 Mb, 112.9 Mb, 659.1 Mb, 501.1 Mb, 33.1 Mb, and 171.3 Mb, respectively. The PVE ranged from 6.6% (AX-95107750) to 7.7% (AX-94825050). However, only three MTAs, i.e., AX-94675928 (1D), AX-94520919 (5D), and AX-94617912 (5D), were mapped and located at 112.3 Mb, 550.1 Mb, and 450.6 Mb, respectively. The PVE ranged from 6.3% (AX-94617912) to 10.1% (AX-94520919).
For TKW, one major MTA (AX-94651901) on 3D was detected in E2 at 40.1 Mb and explained 13.8% PVE. The remaining three MTAs, i.e., AX-94454052 (2D), AX-94861851 (3A), and AX-95194336 (2B), were detected for pooled mean, located at 617.0 Mb, 544.3 Mb, and 96.2 Mb, respectively with PVE ranging from 8.7% (AX-95194336) to 13.4% (AX-94454052). For NDVI, six MTAs, viz., AX-94826552 (7B), AX-95111632 (4B), AX-94978133 (4D), AX-94493107(7D), AX-94736370 (4D), AX-95006755 (1A), were identified and located at 717.2 Mb, 667.8 Mb, 465.7 Mb, 306.7 Mb, 359.1 Mb, and 485.3 Mb, respectively with the explained PVE ranging from 6.2% (AX-95006755) to 12.1% (AX-94826552).

3.5. Putative Candidate Genes Associated with MTAs

The SNPs linked to GPC, TKW, and NDVI were further utilized to detect the putative genes using the annotated wheat reference sequence (Wheat Chinese Spring IWGSC Ref Seq v2.1 genome assembly (2021)) and are given in Table 3. SNPs, i.e., AX-94537786, AX-94520919, AX-94770504, AX-95199688, and AX-95107750, associated with GPC were found to encode lateral organ boundaries, LOB (TraesCS1A02G111700), Zinc finger, RING-H2-type (TraesCS6A02G274400), Zinc finger, RING-H2-type (TraesCS6A02G274400),NAC domain (TraesCS5D02G537600), Folylpolyglutamate synthase (TraesCS4B02G392600), and Aspartic peptidase domain (TraesCS7A02G208600), respectively. One SNP, i.e., AX-94651901 associated with TKW was found to encode serine/threonine-protein kinase LRK10-like (TraesCS3D02G011300) and Pentatricopeptide repeat (TraesCS3D02G011200). Similarly, AX-94454052 associated with TKW encodes protein kinase-like domain superfamily (TraesCS2D02G530900). In addition, two SNPs, i.e., AX-95111632 and AX-94978133 associated with NDVI, were found to encode Cytochrome P450 (TraesCS4B02G393700) and Expansin (TraesCS4D02G296100).

4. Discussion

Although yield enhancement has been the main focus of crop improvement programs across the globe for a long time, wheat quality enhancement is gaining importance only in the recent past. Wheat improvement for quality is a tedious, expensive, and time-taking process, which makes quality improvement programs slow and protracted. Further, yield and quality enhancement in wheat was mostly phenotype-based selection through conventional breeding for many years. However, genotype-based approaches can complement conventional methods in cultivar development programs. Moreover, recent efforts that led to the sequencing of the wheat genome could further enhance the potential of marker-based breeding in wheat. Several MTAs/QTLs were detected for various economic traits in wheat. However, further genetic studies are suggested using different germplasm or populations as mapping has not reached a saturation level [52]. Further, hexaploid wheat has three subgenomes with a large genome size of ~17 Gb, and there is always a possibility to map new QTLs/MTAs for quality traits. In addition, ample genetic diversity is present in the unexplored gene bank accessions and elite breeding materials, which make suitable candidates to dissect the genetic basis and to identify novel MTAs through GWAS analysis.

4.1. Variability, Correlation, and GEI

The expression of GPC, TKW, and NDVI has been greatly influenced by the effects of the environment and GEI. GPC was relatively more environment-sensitive, whereas, TKW was a largely stable trait. Significant effects of environment and GEI have been described in earlier reports [5,6,7,8,79]. The GWAS panel has been evaluated in multi-environments, as GEI is an important factor to identify environment-specific and consistent QTLs. The trait’s environmental sensitivity was also reflected in the trend of broad sense heritability, as TKW recorded high heritability as compared to TKW and NDVI. Similarly, TKW has recorded the lowest percent CV and highest GCV compared to the other two traits.
The negative association between TKW and GPC observed in the current study was also reported previously in several reports [42,80]. This well-established negative correlation between GPC and TKW was partly explained by the dilution effect [17,18]. This negative association may also be attributed to nutrition (particularly nitrogen) competition between TKW and GPC. Although the correlation between GPC and TKW was not significant, the direction of association was positive. The positive and significant association between GPC and NDVI was also observed in the previous studies [81]. However, the correlation between TKW and NDVI was significant and negative. Previously a significant and negative correlation between TKW and NDVI was also reported [49].

4.2. Linkage Disequilibrium

The PCA analysis of the high-quality SNPs that exhibited allelic frequency was evenly distributed without any separate sub-populations. Allelic frequency of equal distribution was obtained through the careful selection of elite breeding lines for different agro-ecological zones. Wheat being a self-pollinated crop generally has a larger LD block size and, hence, slowly decays [82], compared to cross-pollinated crop plants like maize, where the LD decay is rapid [83]. QTL mapping resolution may be reduced due to presence of large LD blocks and vice versa [84]. The LD decay distance of ~3 cM of A subgenome is shorter than the B and D subgenomes, which have a decay distance of ~5 cM. A similar LD decay pattern was also recorded previously in wheat GWAS studies [44,84,85]. The LD among the populations may vary due to various factors including population size, non-random mating, random genetic drift, selection, admixtures, mutation, pollination pattern, and recombination frequency [86,87].

4.3. MTAs

A set of 26 MTAs was identified for GPC (16), TKW (4), and NDVI (6). A maximum of 10 MTAs were mapped on the B subgenome, whereas, 8 MTAs each were mapped on the A and D subgenomes. The pattern of subgenome-wise marker distribution is also similar, as maximum markers were located on subgenome B, and an approximately similar number of markers were mapped on A and D subgenomes. In earlier studies also, a similar pattern of QTL and marker distribution among the subgenomes for grain-quality traits was reported [21,26]. Krishnappa et al. [22] studied a RIL population wherein none of the QTL was identified on the D subgenome due to a very less distribution of markers; however, the enrichment of the D genome with additional SNP markers in the same mapping population has significantly increased the power of QTL identification. Therefore, marker frequency and distribution along with the type and size of the mapping population are important determinants of QTL mapping.
The total of 16 MTAs detected for GPC on different chromosomes in the present study is new, as the previously reported MTAs/QTLs were identified at different locations of the same chromosomes. In previous studies, MTAs for GPC were also reported in different mapping populations on 1A [25,27,46,88], 1B [24,25,27,80,87,88], 1D [46], 2B [24,25,27,41,49], 3B [24,41,80], 3D [25,27,41,46,88,89], 5A [24,88], 5B [41], 5D [46,80,90], 6A [27,88,89,90], 7A [22,41], and 7B [41]. Similarly, four MTAs were identified on 3D, 2D, 3A, and 2B for TKW. MTAs for TKW on the same chromosomes in different mapping populations were also identified in earlier reports on 1B [27], 2B [28,91], 2D [25,80,91,92,93], 3A [88,93,94,95] at different chromosomal locations. Cabral et al. [27] identified a QTL, i.e., QGwt.crc-2B-2, on the 2B chromosome, located at a confidence interval of 92.9–96.0 cM, which was similar to the MTA (AX-95194336) detected in the current study on the same chromosome at 96.2 Mb. For NDVI, six MTAs were mapped on 1A, 4B, 4D, 7B, and 7D. Earlier studies also reported the MTAs for NDVI on the same chromosomes like 1A and 4B [31] and 4B and 4D [32].

4.4. Putative Candidate Genes

Through BLAST search, several putative candidate genes underlying MTAs for GPC, TKW, and NDVI were identified (Table 3). The MTAs identified on different chromosomes of wheat are present in the gene coding regions associated with different transcription factors, transmembrane proteins, zinc finger superfamilies, etc. For instance, AX-94520919 linked to GPC encodes NAC domain (TraesCS5D02G537600) genes, which regulate protein accumulation in wheat grains. A NAC transcription factor (NAM-B1) that enhances nutrient redistribution from source to sink and accelerates senescence is encoded by the ancestral wild wheat allele [14]. Another transcription factor, i.e., the OsNAC-like transcription factor, is reported to regulate seed-storage protein concentration in rice [62]. An NAC transcription factor (HvNAM1) controls anthesis time, senescence, and grain protein content in barley [63]. NAM proteins control the movement of nitrogen, zinc, and iron from vegetative tissues to developing grains in wheat [64]. NAC transcription factors enhance the acceleration of leaf senescence, and thereby remobilize iron and zinc to seeds in rice [65]. An SNP, i.e., AX-94770504 linked to GPC, encodes folylpolyglutamate synthase (TraesCS4B02G392600) found to have a role in nitrogen utilization. In the early seedling development stage, the gene for mitochondrial folylpolyglutamate synthetase regulates nitrogen utilization in Arabidopsis [66]. Similarly, another SNP, i.e., AX-94537786 associated with GPC, encodes zinc finger, RING-H2-type (TraesCS6A02G274400), that controls the protein accumulation in wheat. In rice, the CCCH-type zinc finger protein (OsGZF1) regulates the GluB-1 promoter, a seed storage protein, and controls the accumulation of glutelin protein during grain development [60]. The C2H2 zinc finger family transcription factor regulated grain-related traits in maize [61]. Further, AX-95199688 associated with GPC encodes the aspartic peptidase domain (TraesCS7A02G208600) and was found to have a role in gluten breakdown. Gluten aspartic proteinase (GlAP 2) is associated with gluten breakdown in wheat [67].
Few putative candidate genes were also identified for TKW; for example, one SNP, i.e., AX-94651901, encodes serine/threonine-protein kinase LRK10-like (TraesCS3D02G011300), which has a role in grain weight regulation. A pentatricopeptide repeat protein that influences photosynthesis and grain filling is encoded by the kernel size-related QTL (qKW9I) [69]. The mitochondrion targeted pentatricopeptide repeat 5 regulates endosperm development in rice [70]. Two important pentatricopeptide repeat genes (GRMZM2G353195 and GRMZM2G141202) are regarded as key candidate genes associated with maize kernel-related traits, including thousand kernel weight [71]. Pentatricopeptide repeat protein DEK45 [72], PPR18 [73], and ZmSMK9 [74] are required for mitochondrial function and kernel development in maize. The same SNP also encodes serine/threonine-protein kinase LRK10-like (TraesCS3D02G011300). The serine/threonine protein kinase encoding gene KERNEL NUMBER PER ROW6 (KNR6) regulates kernel number and ear length [68]. Another SNP, i.e., AX-94454052, encodes the protein kinase-like domain superfamily (TraesCS2D02G530900). OstMAPKKK5 controls plant height and yield in rice [75]. The wheat protein kinase gene TaSnRK2.95A has a role in the regulation of high thousand kernel weight and grains per spike [76]. For NDVI, two putative candidate genes, i.e., cytochrome P450 (TraesCS4B02G393700) and expansin (TraesCS4D02G296100) were identified. The expansin regulates grain size in wheat [77]. In transgenic tobacco plants, the wheat expansin gene (TaEXPA2) increased drought tolerance [78].

5. Conclusions

The study with a set of 280 diverse bread-wheat genotypes revealed that GPC, TKW, and NDVI are quantitative traits. The negative association of GPC and TKW suggests that there is a trade-off between grain protein content and grain weight. However, GPC and NDVI are positively correlated, as both these traits are much influenced by the soil nitrogen status. A total of 26 MTAs, including 16 for GPC, six for NDVI, and four for TKW, were identified. Several putative candidate genes encoding main functions such as zinc, iron, and protein remobilization, increased nitrogen use efficiency, photosynthesis regulation, endosperm development, mitochondrial function, and stress tolerance are reported. Further, functional characterization of these putative genes to understand their role in wheat growth and development is envisaged.

Supplementary Materials

The following supporting information can be downloaded at: https://www.mdpi.com/article/10.3390/genes14030637/s1, Table S1: List of genotypes.

Author Contributions

Conceptualization, H.K. (Hanif Khan) and G.P.S.; data curation, G.K. and H.K. (Hanif Khan); formal analysis, G.K. and N.B.D.; funding acquisition, G.P.S.; investigation, G.K., H.K. (Hanif Khan), H.K. (Hari Krishna), S.K. (Satish Kumar), C.N.M., O.P., S.K. (Sachin Kumar) and M.K.; methodology, S.K. (Satish Kumar) and H.M.M.; project administration, G.P.S.; resources, H.K. (Hari Krishna), G.P.S. and G.S.; supervision, G.S.; writing—original draft, G.K.; writing—review and editing, H.K. (Hanif Khan), H.K. (Hari Krishna), C.N.M., H.M.M. and G.S. All authors have read and agreed to the published version of the manuscript.

Funding

This study was supported with funding provided by the Indian Council of Agricultural Research (ICAR) and Bill Melinda Gate Foundation (BMGF) under the project Application of next-generation breeding, genotyping and digitalization approaches for improving the genetic gain in Indian staple crops. ICAR-BMGF (Grant number # OPP1194767).

Institutional Review Board Statement

Not applicable.

Informed Consent Statement

Not applicable.

Data Availability Statement

Data is contained within the article.

Conflicts of Interest

The authors declare no conflict of interest.

References

  1. Schaible, U.E.; Kaufmann, S.H.E. Malnutrition and infection: Complex mechanisms and global impacts. PLoS Med. 2007, 4, e115. [Google Scholar] [CrossRef] [PubMed] [Green Version]
  2. Kar, B.R.; Rao, S.L.; Chandramouli, B.A. Cognitive development in children with chronic protein energy malnutrition. Behav. Brain Funct. 2008, 4, 31. [Google Scholar] [CrossRef] [PubMed] [Green Version]
  3. Shewry, P.R.; Halford, N.G. Cereal seed storage proteins: Structure, properties and role in grain utilization. J. Exp. Bot. 2002, 53, 947–958. [Google Scholar] [CrossRef] [Green Version]
  4. Delwiche, S.R. Chapter 11. In Cereal Grains: Assessing and Managing Quality; Wrigley, C.W., Batey, I.L., Eds.; Woodhead Publishing: Cambridge, UK, 2010; Volume 1, pp. 267–310. [Google Scholar]
  5. Karaman, M. Evaluation of the physiological and agricultural properties of some of the bread wheat (Triticum aestivum L.) genotypes registered in turkey using biplot analysis. Pak. J. Bot. 2020, 52, 1989–1997. [Google Scholar] [CrossRef]
  6. Krishnappa, G.; Ahlawat, A.K.; Shukla, R.B.; Singh, S.K.; Singh, S.K.; Singh, A.M.; Singh, G.P. Multi-environment analysis of grain quality traits in recombinant inbred lines of a biparental cross in bread wheat (Triticum aestivum L.). Cereal Res. Commun. 2019, 47, 334–344. [Google Scholar] [CrossRef]
  7. Hernandez-Espinosa, N.; Mondal, S.; Autrique, E.; Gonzalez-Santoyo, H.; Crossa, J.; Huerta-Espino, J.; Singh, R.P.; Guzman, C. Milling, processing and end-use quality traits of CIMMYT spring bread wheat germplasm under drought and heat stress. Field Crops Res. 2018, 215, 104–112. [Google Scholar] [CrossRef]
  8. Studnicki, M.; Wijata, M.; Sobczynski, G.; Samborski, S.; Gozdowski, D.; Rozbicki, J. Effect of genotype, environment and crop management on yield and quality traits in spring wheat. J. Cereal Sci. 2016, 72, 30–37. [Google Scholar] [CrossRef]
  9. Suhalia, A.; Sharma, A.; Kaur, S.; Sarlach, R.S.; Shokat, S.; Singh, S.; Rehman Arif, M.A.; Singh, S. Characterization of wheat Mexican landraces for drought and salt stress tolerance potential for future breeding. Cereal Res. Commun. 2022, 1–12. [Google Scholar] [CrossRef]
  10. Johnson, V.A.; Mattern, P.J.; Peterson, C.J.; Kuhr, S.L. Improvement of wheat protein by traditional breeding and genetic techniques. Cereal Chem. 1985, 62, 350–355. [Google Scholar]
  11. Avivi, L. High grain protein content in wild tetraploid wheat Triticum dicoccoides Korn. In Proceedings of the Fifth International Wheat Genetics Symposium, New Delhi, India, 23–28 February 1978; pp. 372–380. [Google Scholar]
  12. Distelfeld, A.; Uauy, C.; Fahima, T.; Dubcovsky, J. Physical map of the wheat high-grain protein content gene Gpc-B1 and development of a high-throughput molecular marker. New Phytol. 2006, 169, 753–763. [Google Scholar] [CrossRef] [Green Version]
  13. Distelfeld, A.; Cakmak, I.; Peleg, Z.; Ozturk, L.; Yazici, A.M.; Budak, H.; Saranga, Y.; Fahima, T. Multiple QTL-effects of wheat Gpc-B1 locus on grain protein and micronutrient concentrations. Plant Physiol. 2007, 129, 635–643. [Google Scholar] [CrossRef] [Green Version]
  14. Uauy, C.; Distelfeld, A.; Fahima, T.; Blechl, A.; Dubcovsky, J.A. NAC gene regulating senescence improves grain protein, zinc, and iron content in wheat. Science 2006, 314, 1298–1301. [Google Scholar] [CrossRef] [PubMed] [Green Version]
  15. Crain, J.; Ortiz-Monasterio, I.; Raun, B. Evaluation of a reduced cost active NDVI sensor for crop nutrient management. J. Sens. 2012, 2012, 582028. [Google Scholar] [CrossRef] [Green Version]
  16. Araus, J.L.; Slafer, G.A.; Royo, C.; Serret, M.D. Breeding for yield potential and stress. Adaptation in cereals. Crit. Rev. Plant Sci. 2008, 27, 377–412. [Google Scholar] [CrossRef]
  17. Poudel, R.; Bhinderwala, F.; Morton, M.; Powers, R.; Rose, D.J. Metabolic profiling of historical and modern wheat cultivars using proton nuclear magnetic resonance spectroscopy. Sci. Rep. 2021, 11, 3080. [Google Scholar] [CrossRef] [PubMed]
  18. Zorb, C.; Ludewig, U.; Hawkesford, M.J. Perspective on wheat yield and quality with reduced nitrogen supply. Trends Plant Sci. 2018, 23, 1029–1037. [Google Scholar] [CrossRef] [Green Version]
  19. Rehman Arif, M.A.; Shokat, S.; Plieske, J.; Lohwasser, U.; Chesnokov, Y.V.; Kumar, N.; Kulwal, P.; McGuire, P.; Sorrells, M.; Qualset, C.O.; et al. A SNP-based genetic dissection of versatile traits in bread wheat (Triticum aestivum L.). Plant J. 2021, 108, 960–976. [Google Scholar] [CrossRef]
  20. Akram, S.; Rehman Arif, M.A.; Hameed, A. A GBS-based GWAS analysis of adaptability and yield traits in bread wheat (Triticum aestivum L.). J. Appl. Genet. 2020, 62, 27–41. [Google Scholar] [CrossRef]
  21. Jadon, V.; Sharma, S.; Krishna, H.; Krishnappa, G.; Gajghate, R.; Devate, N.B.; Panda, K.K.; Jain, N.; Singh, P.K.; Singh, G.P. Molecular Mapping of Biofortification Traits in Bread Wheat (Triticum aestivum L.) Using a High-Density SNP Based Linkage Map. Genes 2023, 14, 221. [Google Scholar] [CrossRef]
  22. Krishnappa, G.; Rathan, N.D.; Sehgal, D.; Ahlawat, A.K.; Singh, S.K.; Singh, S.K.; Shukla, R.B.; Jaiswal, J.P.; Solanki, I.S.; Singh, G.P.; et al. Identification of novel genomic regions for biofortification traits using an SNP marker-enriched linkage map in wheat (Triticum aestivum L.). Front. Nutr. 2021, 8, 669444. [Google Scholar] [CrossRef]
  23. Chen, H.; Bemister, D.H.; Iqbal, M.; Strelkov, S.E.; Spaner, D.M. Mapping genomic regions controlling agronomic traits in spring wheat under conventional and organic managements. Crop Sci. 2020, 60, 2038–2052. [Google Scholar] [CrossRef]
  24. Marcotuli, I.; Gadaleta, A.; Mangini, M.; Signorile, A.M.; Zacheo, S.A.; Blanco, A.; Simeone, R.; Colasuonno, P. Development of a High-Density SNP-Based Linkage Map and Detection of QTL for β-Glucans, Protein Content, Grain Yield per Spike and Heading Time in Durum Wheat. Int. J. Mol. Sci. 2017, 18, 1329. [Google Scholar] [CrossRef] [PubMed] [Green Version]
  25. Cui, F.; Fan, X.; Chen, M.; Zhang, N.; Zhao, C.; Zhang, W.; Han, J.; Ji, J.; Zhao, X.; Yang, L.; et al. QTL detection for wheat kernel size and quality and the responses of these traits to low nitrogen stress. Theor. Appl. Genet. 2016, 129, 469–484. [Google Scholar] [CrossRef]
  26. Rathan, N.D.; Krishnappa, G.; Singh, A.-M.; Govindan, V. Mapping QTL for Phenological and Grain-Related Traits in a Mapping Population Derived from High-Zinc-Biofortified Wheat. Plants 2023, 12, 220. [Google Scholar] [CrossRef]
  27. Cabral, A.L.; Jordan, M.C.; Larson, G.; Somers, D.J.; Humphreys, D.G.; McCartney, C.A. Relationship between QTL for grain shape, grain weight, test weight, milling yield, and plant height in the spring wheat cross RL4452/‘AC Domain’. PLoS ONE 2018, 13, e0190681. [Google Scholar] [CrossRef] [Green Version]
  28. Krishnappa, G.; Singh, A.M.; Chaudhary, S.; Ahlawat, A.K.; Singh, S.K.; Shukla, R.B.; Jaiswal, J.P.; Singh, G.P.; Solanki, I.S. Molecular mapping of the grain iron and zinc concentration, protein content and thousand kernel weight in wheat (Triticum aestivum L.). PLoS ONE 2017, 12, e0174972. [Google Scholar] [CrossRef] [Green Version]
  29. Cuthbert, J.L.; Somers, D.J.; Brule-Babel, A.L.; Brown, P.D.; Crow, G.H. Molecular mapping of quantitative trait loci for yield and yield components in spring wheat (Triticum aestivum L.). Theor. Appl. Genet. 2008, 117, 595–608. [Google Scholar] [CrossRef]
  30. Sunil, H.; Upadhyay, D.; Gajghate, R.; Shashikumara, P.; Chouhan, D.; Singh, S.; Sunilkumar, V.P.; Manu, B.; Sinha, N.; Singh, S.; et al. QTL mapping for heat tolerance related traits using backcross inbred lines in wheat (Triticum aestivum L.). Indian J. Genet. 2020, 80, 242–249. [Google Scholar]
  31. Condorelli, G.E.; Maccaferri, M.; Newcomb, M.; Andrade-Sanchez, P.; White, J.W.; French, A.N.; Sciara, G.; Ward, R.; Tuberosa, R. Comparative Aerial and Ground Based High Throughput Phenotyping for the Genetic Dissection of NDVI as a Proxy for Drought Adaptive Traits in Durum Wheat. Front. Plant Sci. 2018, 9, 893. [Google Scholar] [CrossRef] [PubMed] [Green Version]
  32. Gao, F.; Wen, W.; Liu, J.; Rasheed, A.; Yin, G.; Xia, X.; Wu, X.; He, Z. Genome-Wide Linkage Mapping of QTL for Yield Components, Plant Height and Yield-Related Physiological Traits in the Chinese Wheat Cross Zhou 8425B/Chinese Spring. Front. Plant Sci. 2015, 6, 1099. [Google Scholar] [CrossRef] [Green Version]
  33. Flintgarcia, S.A.; Tornsberry, J.M.; And, E.S.; Buckler, I.V. Structure of linkage disequilibrium in plants. Annu. Rev. Plant Biol. 2003, 54, 357–374. [Google Scholar] [CrossRef] [PubMed] [Green Version]
  34. Zondervan, K.T.; Cardon, L.R. The complex interplay among factors that influence allelic association. Nat. Rev. Genet. 2004, 5, 89–100. [Google Scholar] [CrossRef] [PubMed]
  35. Korte, A.; Farlow, A. The advantages and limitations of trait analysis with GWAS: A review. Plant Methods 2013, 9, 29–38. [Google Scholar] [CrossRef] [Green Version]
  36. Pang, Y.; Liu, C.; Wang, D.; Amand, P.S.; Bernardo, A.; Li, W.; He, F.; Li, L.; Wang, L.; Yuan, X.; et al. High-resolution genome-wide association study identifies genomic regions and candidate genes for important agronomic traits in wheat. Mol. Plant 2020, 13, 1311–1327. [Google Scholar] [CrossRef] [PubMed]
  37. Brachi, B.; Morris, G.P.; Borevitz, J.O. Genome-wide association studies in plants: The missing heritability is in the field. Genome Biol. 2011, 12, 232. [Google Scholar] [CrossRef] [Green Version]
  38. Kaler, A.S.; Gillman, J.D.; Beissinger, T.; Purcell, L.C. Comparing different statistical models and multiple testing corrections for association mapping in soybean and maize. Front. Plant Sci. 2020, 25, 1794. [Google Scholar] [CrossRef] [Green Version]
  39. Huang, M.; Liu, X.; Zhou, Y.; Summers, R.M.; Zhang, Z. Blink: A package for the next level of genome-wide association studies with both individuals and markers in the millions. Gigascience 2019, 8, giy154. [Google Scholar] [CrossRef] [Green Version]
  40. Suliman, S.; Alemu, A.; Abdelmula, A.A.; Badawi, G.H.; Al-Abdallat, A.; Tadesse, W. Genome-wide association analysis uncovers stable QTLs for yield and quality traits of spring bread wheat (Triticum aestivum) across contrasting environments. Plant Gene 2021, 25, 100269. [Google Scholar] [CrossRef]
  41. Nigro, D.; Gadaleta, A.; Mangini, G.; Colasuonno, P.; Marcotuli, I.; Giancaspro, A.; Giove, S.L.; Simeone, R.; Blanco, A. Candidate genes and genome-wide association study of grain protein content and protein deviation in durum wheat. Planta 2019, 249, 1157–1175. [Google Scholar] [CrossRef]
  42. Kumar, J.; Saripalli, G.; Gahlaut, V.; Goel, N.; Meher, P.K.; Mishra, K.K.; Mishra, P.C.; Sehgal, D.; Vikram, P.; Sansaloni, C.; et al. Genetics of Fe, Zn, b-carotene, GPC and yield traits in bread wheat (Triticum aestivum L.) using multi-locus and multi-traits GWAS. Euphytica 2018, 214, 219. [Google Scholar] [CrossRef]
  43. Alemu, A.; Suliman, S.; Hagras, A.; Thabet, S.; Al-Abdallat, A.; Abdelmula, A.A.; Tadesse, W. Multi-model genome-wide association and genomic prediction analysis of 16 agronomic, physiological and quality related traits in ICARDA spring wheat. Euphytica 2021, 217, 205. [Google Scholar] [CrossRef]
  44. Rahimi, Y.; Bihamta, M.R.; Taleei, A.; Alipour, H.; Ingvarsson, P.K. Genome-wide association study of agronomic traits in bread wheat reveals novel putative alleles for future breeding programs. BMC Plant Biol. 2019, 19, 541. [Google Scholar] [CrossRef] [PubMed] [Green Version]
  45. Sukumaran, S.; Reynolds, M.P.; Sansaloni, C. Genome-wide association analyses identify QTL hotspots for yield and component traits in durum wheat grown under yield potential, drought, and heat stress environments. Front. Plant Sci. 2018, 9, 81. [Google Scholar] [CrossRef] [Green Version]
  46. Sun, C.; Zhang, F.; Yan, X.; Zhang, X.; Dong, Z.; Cui, D.; Chen, F. Genome-wide association study for 13 agronomic traits reveals distribution of superior alleles in bread wheat from the Yellow and Huai Valley of China. Plant Biotech. J. 2017, 15, 953–969. [Google Scholar] [CrossRef] [Green Version]
  47. Rufo, R.; Lopez, A.; Lopes, M.S.; Bellvert, J.; Soriano, J.M. Identification of Quantitative Trait Loci Hotspots Affecting Agronomic Traits and High-Throughput Vegetation Indices in Rainfed Wheat. Front. Plant Sci. 2021, 12, 735192. [Google Scholar] [CrossRef] [PubMed]
  48. Pradhan, S.; Babar, M.A.; Bai, G.; Khan, J.; Shahi, D.; Avci, M.; Guo, J.; McBreen, J.; Asseng, S.; Gezan, S.; et al. Genetic dissection of heat-responsive physiological traits to improve adaptation and increase yield potential in soft winter wheat. BMC Genom. 2020, 21, 315. [Google Scholar] [CrossRef] [PubMed]
  49. Shi, S.; Azam, F.I.; Li, H.; Chang, X.; Li, B.; Jing, R. Mapping QTL for stay-green and agronomic traits in wheat under diverse water regimes. Euphytica 2017, 213, 246. [Google Scholar] [CrossRef] [Green Version]
  50. Hitz, K.; Clark, A.J.; Sanford, D.A.V. Identifying nitrogen-use efficient soft red winter wheat lines in high and low nitrogen environments. Field Crops Res. 2017, 200, 1–9. [Google Scholar] [CrossRef] [Green Version]
  51. Pinto, R.S.; Reynolds, M.P.; Mathews, K.; McIntyre, C.L.; Olivares-Villegas, J.J.; Chapman, S.C. Heat and drought adaptive QTL in a wheat population designed to minimize confounding agronomic effects. Theor. Appl. Genet. 2010, 121, 1001–1021. [Google Scholar] [CrossRef] [Green Version]
  52. Singh, K.; Batra, R.; Sharma, S.; Saripalli, G.; Gautam, T.; Singh, R.; Pal, S.; Malik, P.; Kumar, M.; Jan, I.; et al. WheatQTLdb: A QTL database for wheat. Mol. Genet. Genom. 2021, 296, 1051–1056. [Google Scholar] [CrossRef]
  53. Zimin, A.V.; Puiu, D.; Hall, R.; Kingan, S.; Clavijo, B.J.; Salzberg, S.L. The first near-complete assembly of the hexaploid bread wheat genome, Triticum aestivum. Gigascience 2017, 6, gix097. [Google Scholar] [CrossRef] [PubMed] [Green Version]
  54. Aravind, J.; Mukesh Sankar, S.; Wankhede, D.P.; Kaur, V. AugmentedRCBD: Analysis of Augmented Randomised Complete Block Designs. R Package Version 0.1.5.9000. 2021. Available online: https://aravind-j.github.io/augmentedRCBD (accessed on 18 November 2022).
  55. Murray, M.G.; Thompson, W.F. Rapid isolation of high molecular weight plant DNA. Nucleic Acids Res. 1980, 8, 4321–4325. [Google Scholar] [CrossRef] [PubMed] [Green Version]
  56. Bradbury, P.J.; Zhang, Z.; Kroon, D.E.; Casstevens, T.M.; Ramdoss, Y.; Buckler, E.S. Tassel: Software for association mapping of complex traits in diverse samples. Bioinformatics 2007, 23, 2633–2635. [Google Scholar] [CrossRef] [PubMed]
  57. Lipka, A.E.; Tian, F.; Wang, Q.; Peiffer, J.; Li, M.; Bradbury, P.J.; Gore, M.A.; Buckler, E.S.; Zhang, Z. GAPIT: Genome association and prediction integrated tool. Bioinformatics 2012, 28, 2397–2399. [Google Scholar] [CrossRef] [Green Version]
  58. Wang, J.; Zhang, Z. GAPIT version 3: Boosting power and accuracy for genomic association and prediction. Genom. Proteom. Bioinform. 2021, 19, 629–640. [Google Scholar] [CrossRef] [PubMed]
  59. Wang, Z.; Zhang, R.; Cheng, Y.; Lei, P.; Song, W.; Zheng, W.; Nie, X. Genome-wide identification, evolution, and expression analysis of LBD transcription factor family in bread wheat (Triticum aestivum L.). Front. Plant Sci. 2021, 12, 721253. [Google Scholar] [CrossRef]
  60. Chen, Y.; Sun, A.; Wang, M.; Zhu, Z.; Ouwerkerk, P.B. Functions of the CCCH type zinc finger protein OsGZF1 in regulation of the seed storage protein GluB-1 from rice. Plant Mol. Biol. 2014, 84, 621–634. [Google Scholar] [CrossRef]
  61. Li, J.; Zhang, L.; Yuan, Y.; Wang, Q.; Elbaiomy, R.G.; Zhou, W.; Wu, H.; Soaud, S.A.; Abbas, M.; Chen, B.; et al. In Silico Functional Prediction and Expression Analysis of C2H2 Zinc-Finger Family Transcription Factor Revealed Regulatory Role of ZmZFP126 in Maize Growth. Front. Genet. 2021, 12, 770427. [Google Scholar] [CrossRef]
  62. Sharma, G.; Upadyay, A.K.; Biradar, H.; Hittalmani, S. OsNAC-like transcription factor involved in regulating seed-storage protein content at different stages of grain filling in rice under aerobic conditions. J. Genet. 2019, 98, 18. [Google Scholar] [CrossRef]
  63. Alptekin, B.; Mangel, D.; Pauli, D.; Blake, T.; Lachowiec, J.; Hoogland, T.; Fischer, A.; Sherman, J. Combined effects of a glycine-rich RNA-binding protein and a NAC transcription factor extend grain fill duration and improve malt barley agronomic performance. Theor. Appl. Genet. 2021, 134, 351–366. [Google Scholar] [CrossRef]
  64. Waters, B.M.; Uauy, C.; Dubcovsky, J.; Grusak, M.A. Wheat (Triticum aestivum) NAM proteins regulate the translocation of iron, zinc, and nitrogen compounds from vegetative tissues to grain. J. Exp. Bot. 2009, 60, 4263–4274. [Google Scholar] [CrossRef] [PubMed] [Green Version]
  65. Ricachenevsky, F.K.; Menguer, P.K.; Sperotto, R.A. kNACking on heaven’s door: How important are NAC transcription factors for leaf senescence and Fe/Zn remobilization to seeds? Front. Plant Sci. 2013, 4, 226. [Google Scholar] [CrossRef] [PubMed] [Green Version]
  66. Jiang, L.; Liu, Y.; Sun, H.; Han, Y.; Li, J.; Li, C.; Guo, W.; Meng, H.; Li, S.; Fan, Y.; et al. The mitochondrial folylpolyglutamate synthetase gene is required for nitrogen utilization during early seedling development in Arabidopsis. Plant Physiol. 2013, 161, 971–989. [Google Scholar] [CrossRef] [Green Version]
  67. Bleukx, W.; Delcour, J.A. A Second Aspartic Proteinase Associated with Wheat Gluten. J. Cereal Sci. 2000, 32, 31–42. [Google Scholar] [CrossRef]
  68. Jia, H.; Li, M.; Li, W.; Liu, L.; Jian, Y.; Yang, Z.; Shen, X.; Ning, Q.; Du, Y.; Zhao, R.; et al. A serine/threonine protein kinase encoding gene KERNEL NUMBER PER ROW6 regulates maize grain yield. Nat. Commun. 2020, 11, 988. [Google Scholar] [CrossRef] [Green Version]
  69. Huang, J.; Lu, G.; Liu, L.; Raihan, M.S.; Xu, J.; Jian, L.; Zhao, L.; Tran, T.M.; Zhang, Q.; Liu, J.; et al. The Kernel Size-Related Quantitative Trait Locus qKW9 Encodes a Pentatricopeptide Repeat Protein That Affects Photosynthesis and Grain Filling. Plant Physiol. 2020, 183, 1696–1709. [Google Scholar] [CrossRef]
  70. Zhang, L.; Qi, Y.; Wu, M.; Zhao, L.; Zhao, Z.; Lei, C.; Hao, Y.; Yu, X.; Sun, Y.; Zhang, X.; et al. Mitochondrion-targeted PENTATRICOPEPTIDE REPEAT5 is required for cis-splicing of nad4 intron 3 and endosperm development in rice. Crop J. 2021, 9, 282–296. [Google Scholar] [CrossRef]
  71. Chen, L.; Li, Y.X.; Li, C.; Shi, Y.; Song, Y.; Zhang, D.; Li, Y.; Wang, T. Genome-wide analysis of the pentatricopeptide repeat gene family in different maize genomes and its important role in kernel development. BMC Plant Biol. 2018, 18, 366. [Google Scholar] [CrossRef]
  72. Ren, R.C.; Lu, X.; Zhao, Y.J.; Wei, Y.M.; Wang, L.L.; Zhang, L.; Zhang, W.T.; Zhang, C.; Zhang, X.S.; Zhao, X.Y. Pentatricopeptide repeat protein DEK40 is required for mitochondrial function and kernel development in maize. J. Exp. Bot. 2019, 70, 6163–6179. [Google Scholar] [CrossRef]
  73. Liu, R.; Cao, S.-K.; Sayyed, A.; Xu, C.; Sun, F.; Wang, F.; Tan, B.-C. The Mitochondrial Pentatricopeptide Repeat Protein PPR18 Is Required for the cis-Splicing of nad4 Intron 1 and Essential to Seed Development in Maize. Int. J. Mol. Sci. 2020, 21, 4047. [Google Scholar] [CrossRef]
  74. Pan, Z.; Liu, M.; Xiao, Z.; Ren, X.; Zhao, H.; Gong, D.; Liang, K.; Tan, Z.; Shao, Y.; Qiu, F. ZmSMK9, a pentatricopeptide repeat protein, is involved in the cis-splicing of nad5, kernel development and plant architecture in maize. Plant Sci. 2019, 288, 110205. [Google Scholar] [CrossRef] [PubMed]
  75. Liu, Y.; Zhu, Y.; Xu, X.; Sun, F.; Yang, J.; Cao, L.; Luo, X. OstMAPKKK5, a truncated mitogen-activated protein kinase kinasekinase 5, positively regulates plant height and yield in rice. Crop J. 2019, 7, 707–714. [Google Scholar] [CrossRef]
  76. Ur Rehman, S.; Wang, J.; Chang, X.; Zhang, X.; Mao, X.; Jing, R. A wheat protein kinase gene TaSnRK2.9-5A associated with yield contributing traits. Theor. Appl. Genet. 2019, 132, 907–919. [Google Scholar] [CrossRef] [PubMed] [Green Version]
  77. Ma, M.; Wang, Q.; Li, Z.; Cheng, H.; Li, Z.; Liu, X.; Song, W.; Appels, R.; Zhao, H. Expression of TaCYP78A3, a gene encoding cytochrome P450 CYP78A3 protein in wheat (Triticum aestivum L.), affects seed size. Plant J. 2015, 83, 312–325. [Google Scholar] [CrossRef]
  78. Chen, Y.; Han, Y.; Zhang, M.; Zhou, S.; Kong, X.; Wang, W. Overexpression of the wheat expansin gene TaEXPA2 improved seed production and drought tolerance in transgenic tobacco plants. PLoS ONE 2016, 11, e0153494. [Google Scholar] [CrossRef] [Green Version]
  79. Gopalareddy, K.; Singh, A.M.; Ahlawat, A.K.; Singh, G.P.; Jaiswal, J.P. Genotype-environment interaction for grain iron and zinc concentration in recombinant inbred lines of a bread wheat (Triticum aestivum L.) cross. Indian J. Genet. Plant Breed. 2015, 75, 307–313. [Google Scholar] [CrossRef]
  80. Goel, S.; Singh, K.; Singh, B.; Grewal, S.; Dwivedi, N.; Alqarawi, A.A.; Abd Allah, E.F.; Ahmad, P.; Singh, N.K. Analysis of genetic control and QTL mapping of essential wheat grain quality traits in a recombinant inbred population. PLoS ONE 2019, 14, e0200669. [Google Scholar] [CrossRef] [Green Version]
  81. Tan, C.; Zhou, X.; Zhang, P.; Wang, Z.; Wang, D.; Guo, W.; Yun, F. Predicting grain protein content of field-grown winter wheat with satellite images and partial least square algorithm. PLoS ONE 2020, 15, e0228500. [Google Scholar] [CrossRef]
  82. Yu, H.; Deng, Z.; Xiang, C.; Tian, J. Analysis of diversity and linkage disequilibrium mapping of agronomic traits on B-genome of wheat. J. Genom. 2014, 2, 20–30. [Google Scholar] [CrossRef] [Green Version]
  83. Dinesh, A.; Patil, A.; Zaidi, P.H.; Kuchanur, P.H.; Vinayan, M.T.; Seetharam, K. Genetic diversity, linkage disequilibrium and population structure among CIMMYT maize inbred lines, selected for heat tolerance study. Maydica 2016, 61, 1–7. [Google Scholar]
  84. Dadshani, S.; Mathew, B.; Ballvora, A.; Mason, A.S.; Leon, J. Detection of breeding signatures in wheat using a linkage disequilibrium-corrected mapping approach. Sci. Rep. 2021, 11, 5527. [Google Scholar] [CrossRef]
  85. Sheoran, S.; Jaiswal, S.; Kumar, D.; Raghav, N.; Sharma, R.; Pawar, S.; Paul, S.; Iquebal, M.A.; Jaiswar, A.; Sharma, P.; et al. Uncovering genomic regions associated with 36 agro-morphological traits in Indian spring wheat using GWAS. Front. Plant Sci. 2019, 10, 527. [Google Scholar] [CrossRef] [PubMed] [Green Version]
  86. Vos, P.G.; Paulo, M.J.; Voorrips, R.E.; Visser, R.G.; van Eck, H.J.; van Eeuwijk, F.A. Evaluation of LD decay and various LD-decay estimators in simulated and SNP-array data of tetraploid potato. Theor. Appl. Genet. 2017, 130, 123–135. [Google Scholar] [CrossRef] [PubMed] [Green Version]
  87. Gupta, P.K.; Rustgi, S.; Kulwal, P.L. Linkage disequilibrium and association studies in higher plants: Present status and future prospects. Plant Mol. Biol. 2005, 57, 461–485. [Google Scholar] [CrossRef]
  88. Fatiukha, A.; Filler, N.; Lupo, I.; Lidzbarsky, G.; Klymiuk, V.; Korol, A.B.; Pozniak, C.; Fahima, T.; Krugman, T. Grain protein content and thousand kernel weight QTLs identified in a durum × wild emmer wheat mapping population tested in five environments. Theor. Appl. Genet. 2020, 133, 119–131. [Google Scholar] [CrossRef] [PubMed]
  89. Guo, Y.; Zhang, G.; Guo, B.; Qu, C.; Zhang, M.; Kong, F.; Zhao, Y.; Li, S. QTL mapping for quality traits using a high-density genetic map of wheat. PLoS ONE 2020, 15, e0230601. [Google Scholar] [CrossRef] [PubMed]
  90. Muqaddasi, Q.H.; Brassac, J.; Ebmeyer, E.; Kollers, S.; Korzun, V.; Argillier, O.; Stiewe, G.; Plieske, J.; Ganal, M.W.; Röder, M.S. Prospects of GWAS and predictive breeding for European winter wheat’s grain protein content, grain starch content, and grain hardness. Sci. Rep. 2020, 10, 12541. [Google Scholar] [CrossRef] [PubMed]
  91. Zhang, H.; Chen, J.; Li, R.; Deng, Z.; Zhang, K.; Liu, B.; Tian, J. Conditional QTL mapping of three yield components in common wheat (Triticum aestivum L.). Crop J. 2016, 4, 220–228. [Google Scholar] [CrossRef] [Green Version]
  92. Halder, J.; Gill, H.S.; Zhang, J.; Altameemi, R.; Olson, E.; Turnipseed, B.; Sehgal, S.K. Genome-wide association analysis of spike and kernel traits in the U.S. hard winter wheat. Plant Genome 2023, 13, e20300. [Google Scholar] [CrossRef]
  93. Huang, X.Q.; Kempf, H.; Ganal, M.W.; Roder, M.S. Advanced backcross QTL analysis in progenies derived from a cross between a German elite winter wheat variety and a synthetic wheat (Triticum aestivum L.). Theor. Appl. Genet. 2004, 109, 933–943. [Google Scholar] [CrossRef]
  94. Lv, D.; Zhang, C.; Yv, R.; Yao, J.; Wu, J.; Song, X.; Jian, J.; Song, P.; Zhang, Z.; Han, D.; et al. Utilization of a Wheat50K SNP Microarray-Derived High-Density Genetic Map for QTL Mapping of Plant Height and Grain Traits in Wheat. Plants 2021, 10, 1167. [Google Scholar] [CrossRef] [PubMed]
  95. Giancaspro, A.; Giove, S.L.; Zacheo, S.A.; Blanco, A.; Gadaleta, A. Genetic Variation for Protein Content and Yield-Related Traits in a Durum Population Derived from an Inter-Specific Cross between Hexaploid and Tetraploid Wheat Cultivars. Front. Plant Sci. 2019, 10, 1509. [Google Scholar] [CrossRef] [PubMed] [Green Version]
Figure 1. Weather parameters of the experimental sites during crop season 2021–2022.
Genes 14 00637 g001
Figure 2. Boxplots of GPC, TKW, and NDVI in a set of 280 genotypes.
Genes 14 00637 g002
Figure 3. Frequency distribution in GWAS panel.
Genes 14 00637 g003
Figure 4. Phenotypic correlation coefficients for GPC, TKW, and NDVI in GWAS panel. * Significant at p < 0.05, *** Significant at p < 0.001. GPC: grain protein content; TKW: 1000 kernel weight; NDVI: normalized difference vegetation index.
Genes 14 00637 g004
Figure 5. Chromosome-wise distribution of polymorphic markers; pie-chart represents the percentage of marker distribution on subgenome A, B and D.
Genes 14 00637 g005
Figure 6. Population structure of 280 genotypes. (A) Principal component analysis (B) Heat map.
Genes 14 00637 g006
Figure 7. (a) Manhattan and respective Q–Q plots for grain protein content in GWAS panel; (b) Manhattan and respective Q–Q plots for thousand kernel weight, and normalized difference vegetative index in GWAS panel.
Genes 14 00637 g007
Table 1. Genetic parameters of GPC, TKW, and NDVI.
TraitEnv.Mean ± SDRangeCV (%)LSDh2BSGCVECV
GPC
(%)
E113.5 ± 1.1810.81–16.714.771.9470.287.324.76
E213.9 ± 0.8411.88–16.625.472.2968.536.615.47
E311.8 ± 0.9109.59–14.813.421.2372.806.963.46
TKW (gm)E140.55 ± 0.2131.01–50.413.143.8386.567.953.13
E243.36 ± 0.2629.48–55.983.855.0284.158.853.84
E342.81 ± 0.2628.38–52.982.373.0594.649.952.37
NDVIE10.49 ± 0.060.32–0.696.580.1072.699.756.59
E20.60 ± 0.050.44–0.717.650.1468.187.287.64
E30.57 ± 0.040.46–0.687.200.1270.956.537.21
E1: IARI Delhi; E2: IARI Jharkhand; E3: Karnal; SD: standard deviation; CV: coefficient of variation; h2BS: broad sense heritability; GCV: genotypic coefficient of variability; ECV: environmental coefficient of variability.
Table 2. MTAs for grain protein, 1000 kernel weight, and normalized difference vegetation index.
TraitEnvironmentSNPsChr.Positionp ValuePVE (%)
Grain protein content (%)E1AX-947140232B5363164708.12 × 10−510.2
E2AX-951077501A1129416902.09 × 10−76.6
AX-948250501A531885001.35 × 10−67.7
AX-950821151B1441222411.00 × 10−57.7
AX-947493971B164787423.53 × 10−56.2
AX-946759281D1123541074.71 × 10−87.2
AX-947705044B6676803089.97 × 10−67.0
AX-943841405A6591658555.65 × 10−56.9
AX-946179125D4506349756.54 × 10−56.3
AX-945209195D5501858489.88 × 10−610.1
AX-945377866A5011767935.53 × 10−67.7
AX-951861936A33110062.59 × 10−57.0
AX-944122186B1002911911.14 × 10−67.9
AX-951996887A1713879943.47 × 10−56.9
E3AX-947469293B8009333462.88 × 10−610.9
AX-952486295B5804315985.61 × 10−911.4
Thousand kernel weightE2AX-946519013D40129157.79 × 10−513.8
PooledAX-951943362B96209433.54 × 10−68.7
AX-944540522D6170734351.41 × 10−1113.4
AX-948618513A5443852952.31 × 10−710.7
Normalized difference vegetation indexE1AX-951116324B6678591191.06 × 10−410.6
AX-948265527B7172027194.46 × 10−512.1
E3AX-950067551A4853555179.70 × 10−56.2
AX-949781334D4657718177.36 × 10−610.1
AX-947363704D3591189687.80 × 10−511.7
AX-944931077D3067571461.28 × 10−511.5
E1: IARI Delhi; E2: IARI Jharkhand; E3: Karnal; PVE%: percent phenotypic variation explained.
Table 3. Putative candidate genes for GPC, TKW, and NDVI.
TraitSNP IDPositionChrTrace IDPutative Candidate GenesFunction
GPCAX-951077501129416901ATraesCS1A02G111700Lateral organ boundaries, LOBStress tolerance in wheat [59]
AX-945377865011767936ATraesCS6A02G274300P-loop containing nucleoside triphosphate hydrolase
TraesCS6A02G274400Zinc finger, RING-H2-typeRegulates glutelin protein accumulation in Rice via controlling of Glu B-1 promoter [60]. Regulation of grain-related traits in maize [61]
AX-945209195501858485DTraesCS5D02G537600NAC domain superfamilyProtein, iron, and zinc remobilization in wheat [14]. Regulation of seed-storage protein content in rice [62]. Controls percent grain protein in barley [63]. Remobilization of iron, zinc, and nitrogen from vegetative tissues to developing grains in wheat [64]. Iron and zinc remobilization to seeds in Rice [65]
AX-947705046676803084BTraesCS4B02G392600Folylpolyglutamate synthaseNitrogen utilization in Arabidopsis [66]
AX-951996881713879947ATraesCS7A02G208600Aspartic peptidase domainGluten aspartic proteinase (GlAP 2) is associated with gluten breakdown in wheat [67]
TraesCS7A02G208700Aluminum-activated malate transporter
TKWAX-9465190140129153DTraesCS3D02G011300Serine/threonine-protein kinase LRK10-likeRegulates kernel number and ear length in Maize [68]
TraesCS3D02G011200Pentatricopeptide repeatControls photosynthesis and grain filling in maize [69]. Endosperm development in Rice [70]. Maize kernel-related traits including thousand kernel weight [71]. Pentatricopeptide repeat protein DEK45 [72], PPR18 [73] and ZmSMK9 [74] are required for mitochondrial function and kernel development in maize
AX-944540526170734352DTraesCS2D02G530900Protein kinase-like domain superfamilyOstMAPKKK5 controls plant height and yield in rice [75]. TaSnRK2.9-5A has a role in high TKW and grains per spike [76]
NDVIAX-951116326678591194BTraesCS4B02G393700Cytochrome P450Regulates grain size in wheat [77]
AX-949781334657718174DTraesCS4D02G296100ExpansinTaEXPA2 regulates drought responsiveness in transgenic tobacco [78]
Disclaimer/Publisher’s Note: The statements, opinions and data contained in all publications are solely those of the individual author(s) and contributor(s) and not of MDPI and/or the editor(s). MDPI and/or the editor(s) disclaim responsibility for any injury to people or property resulting from any ideas, methods, instructions or products referred to in the content.

