
Seasonal Adaptation: Geographic Photoperiod–Temperature Patterns Explain Genetic Variation in the Common Vole Tsh Receptor
 , , , , , and
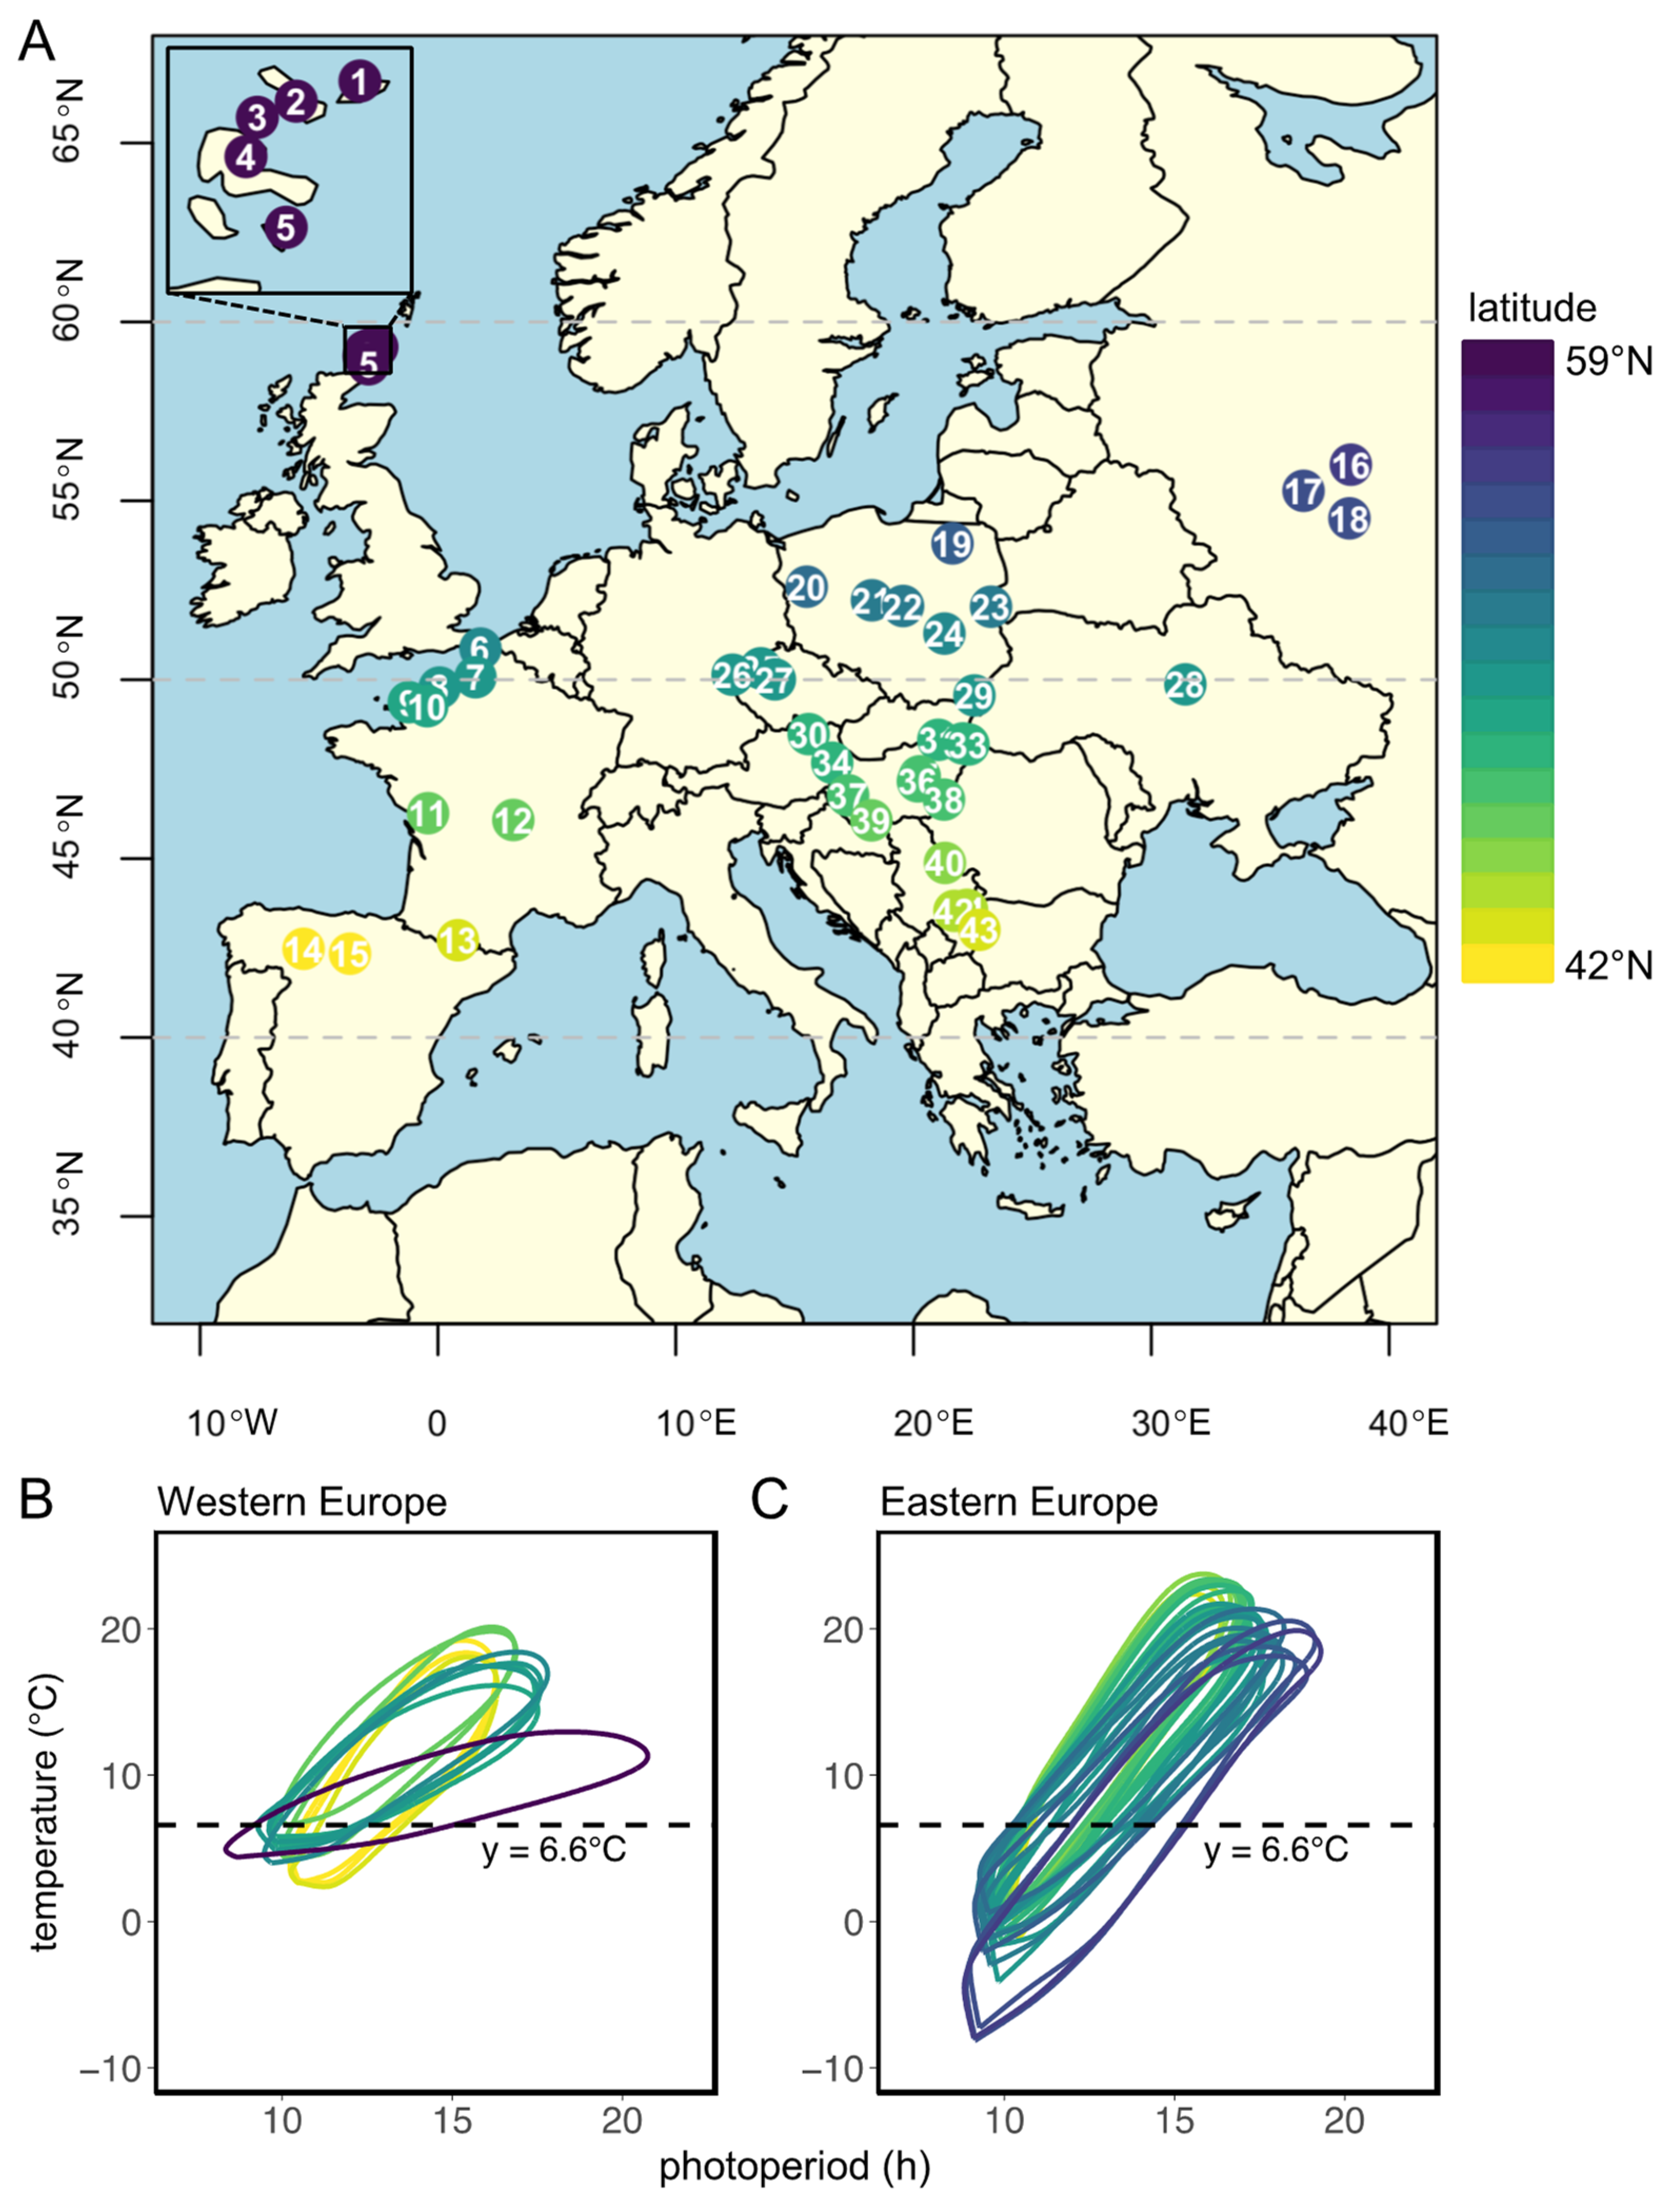
Abstract
:1. Introduction
2. Materials and Methods
2.1. Tissue Samples
2.2. DNA Isolation, PCR and Sanger Sequencing
2.3. Data Analysis and Statistical Analysis
3. Results
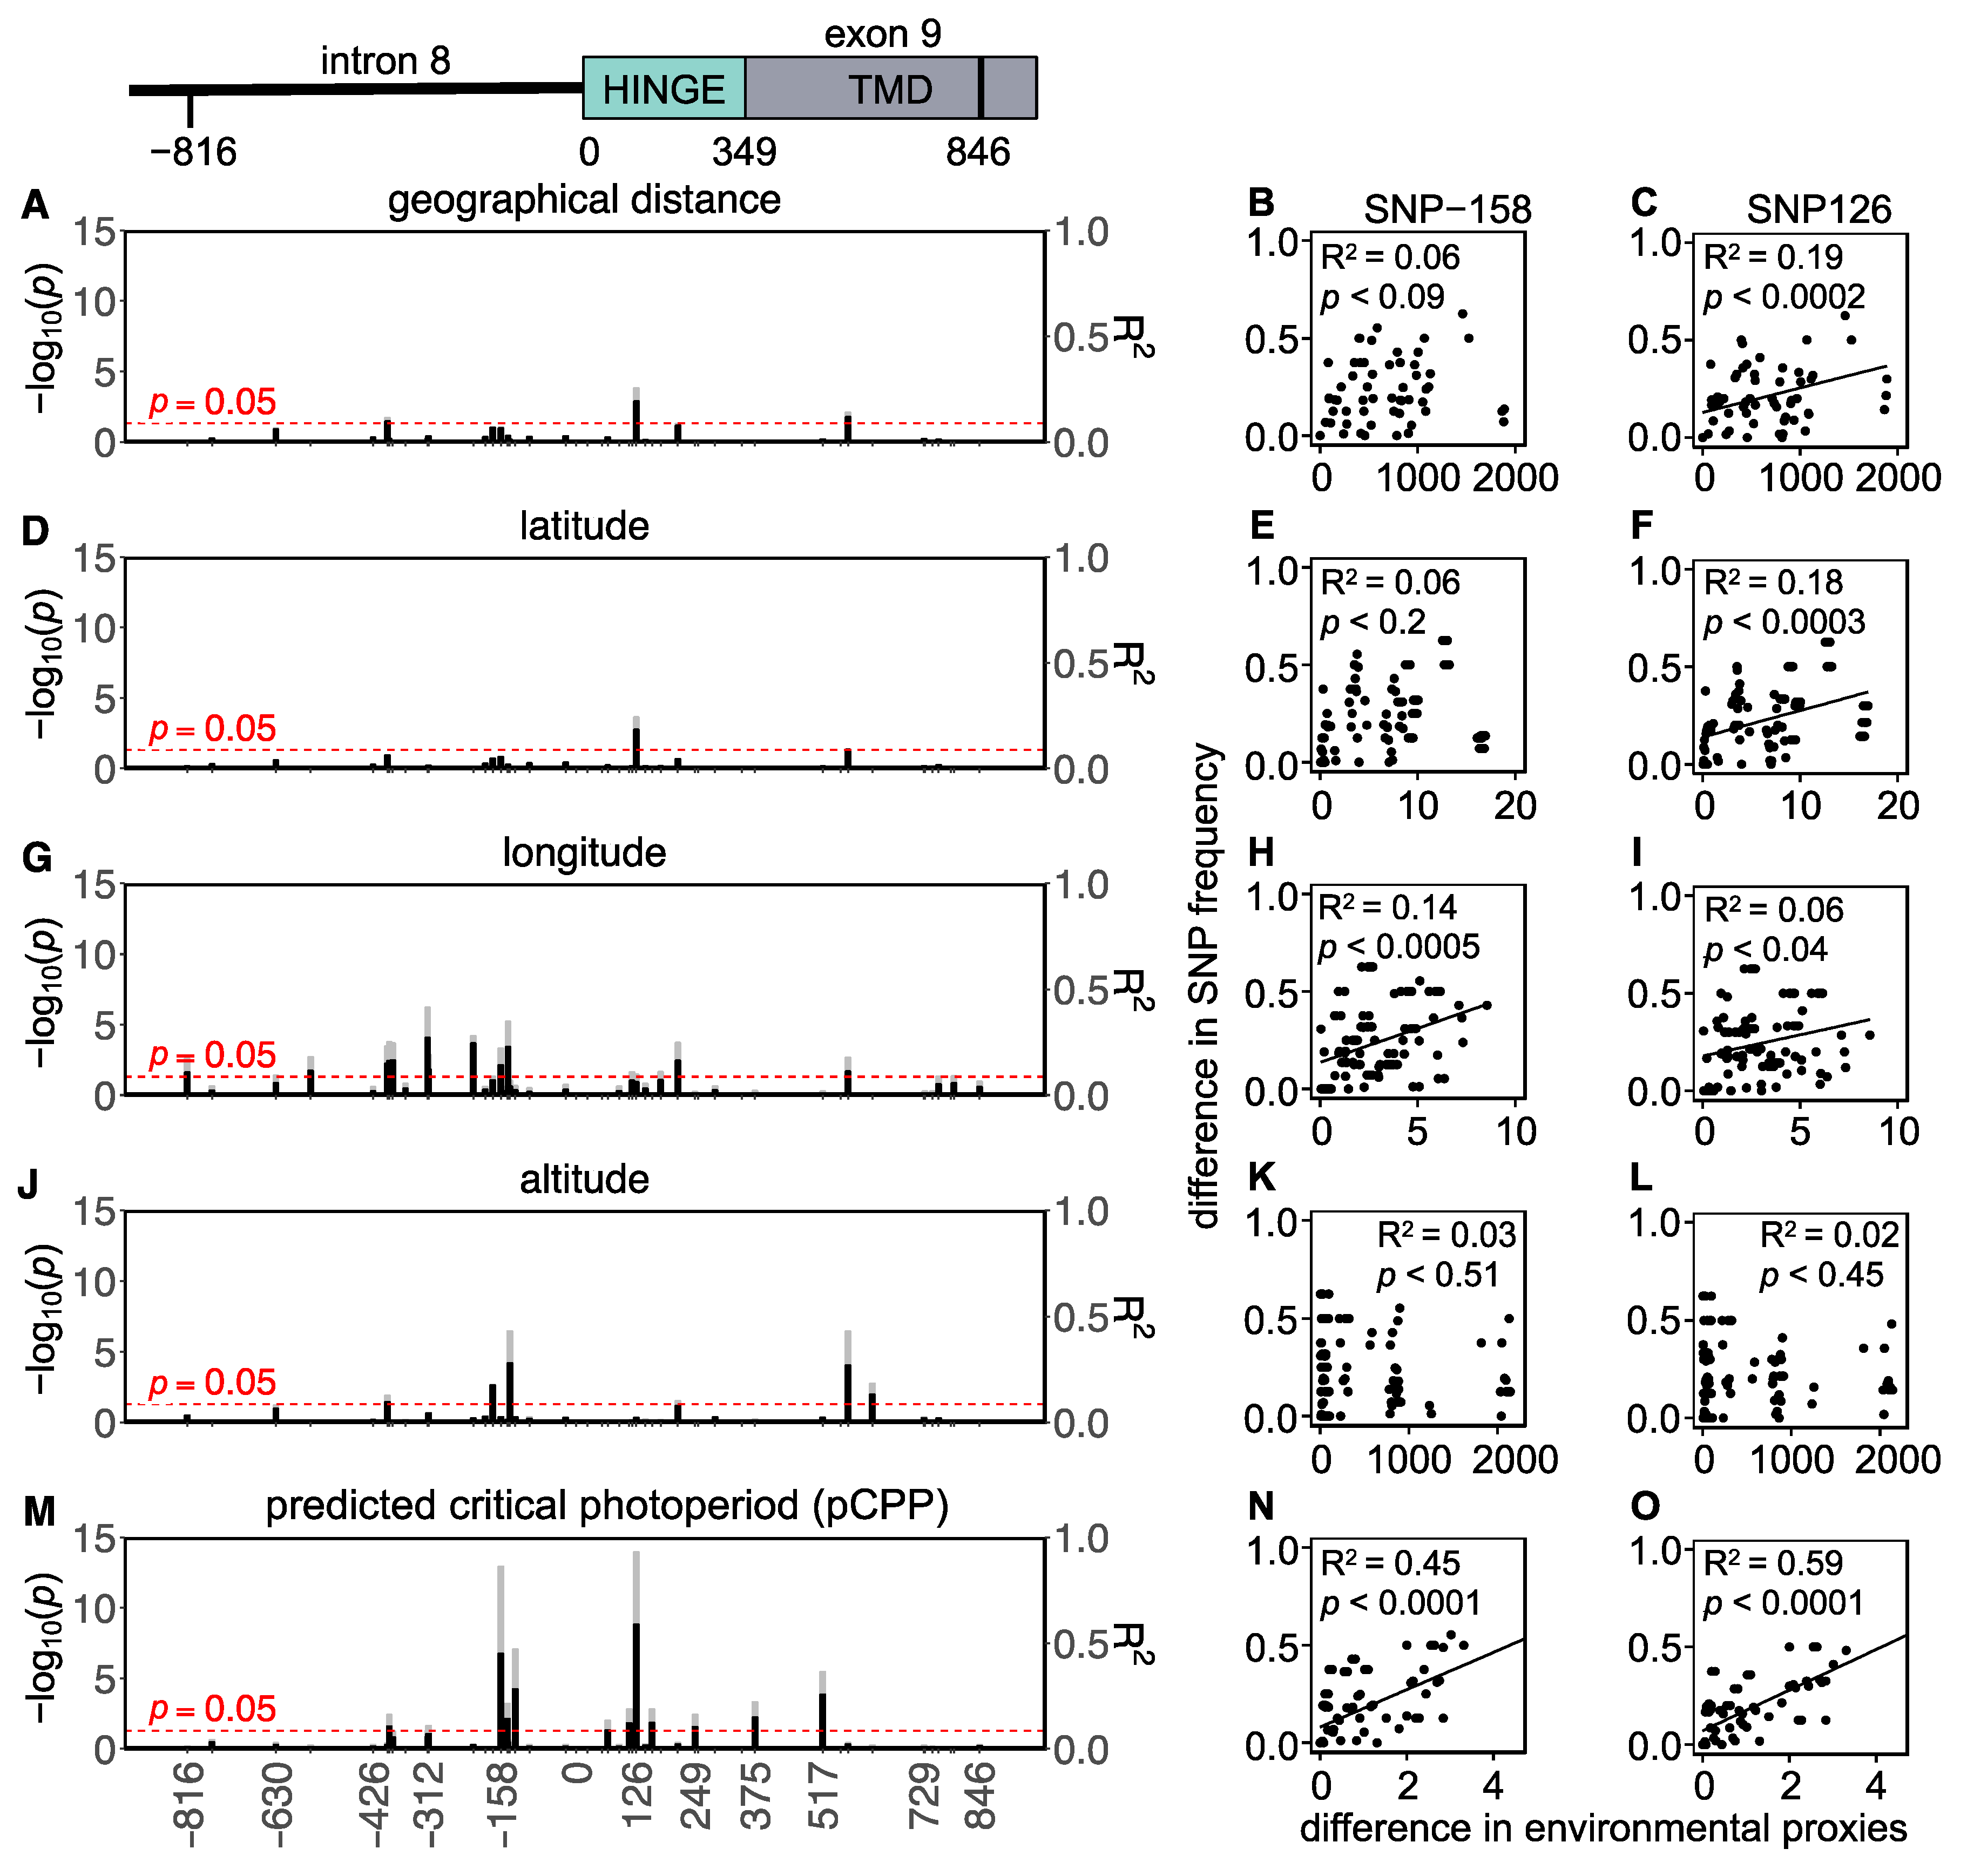
3.1. Western European Lineage
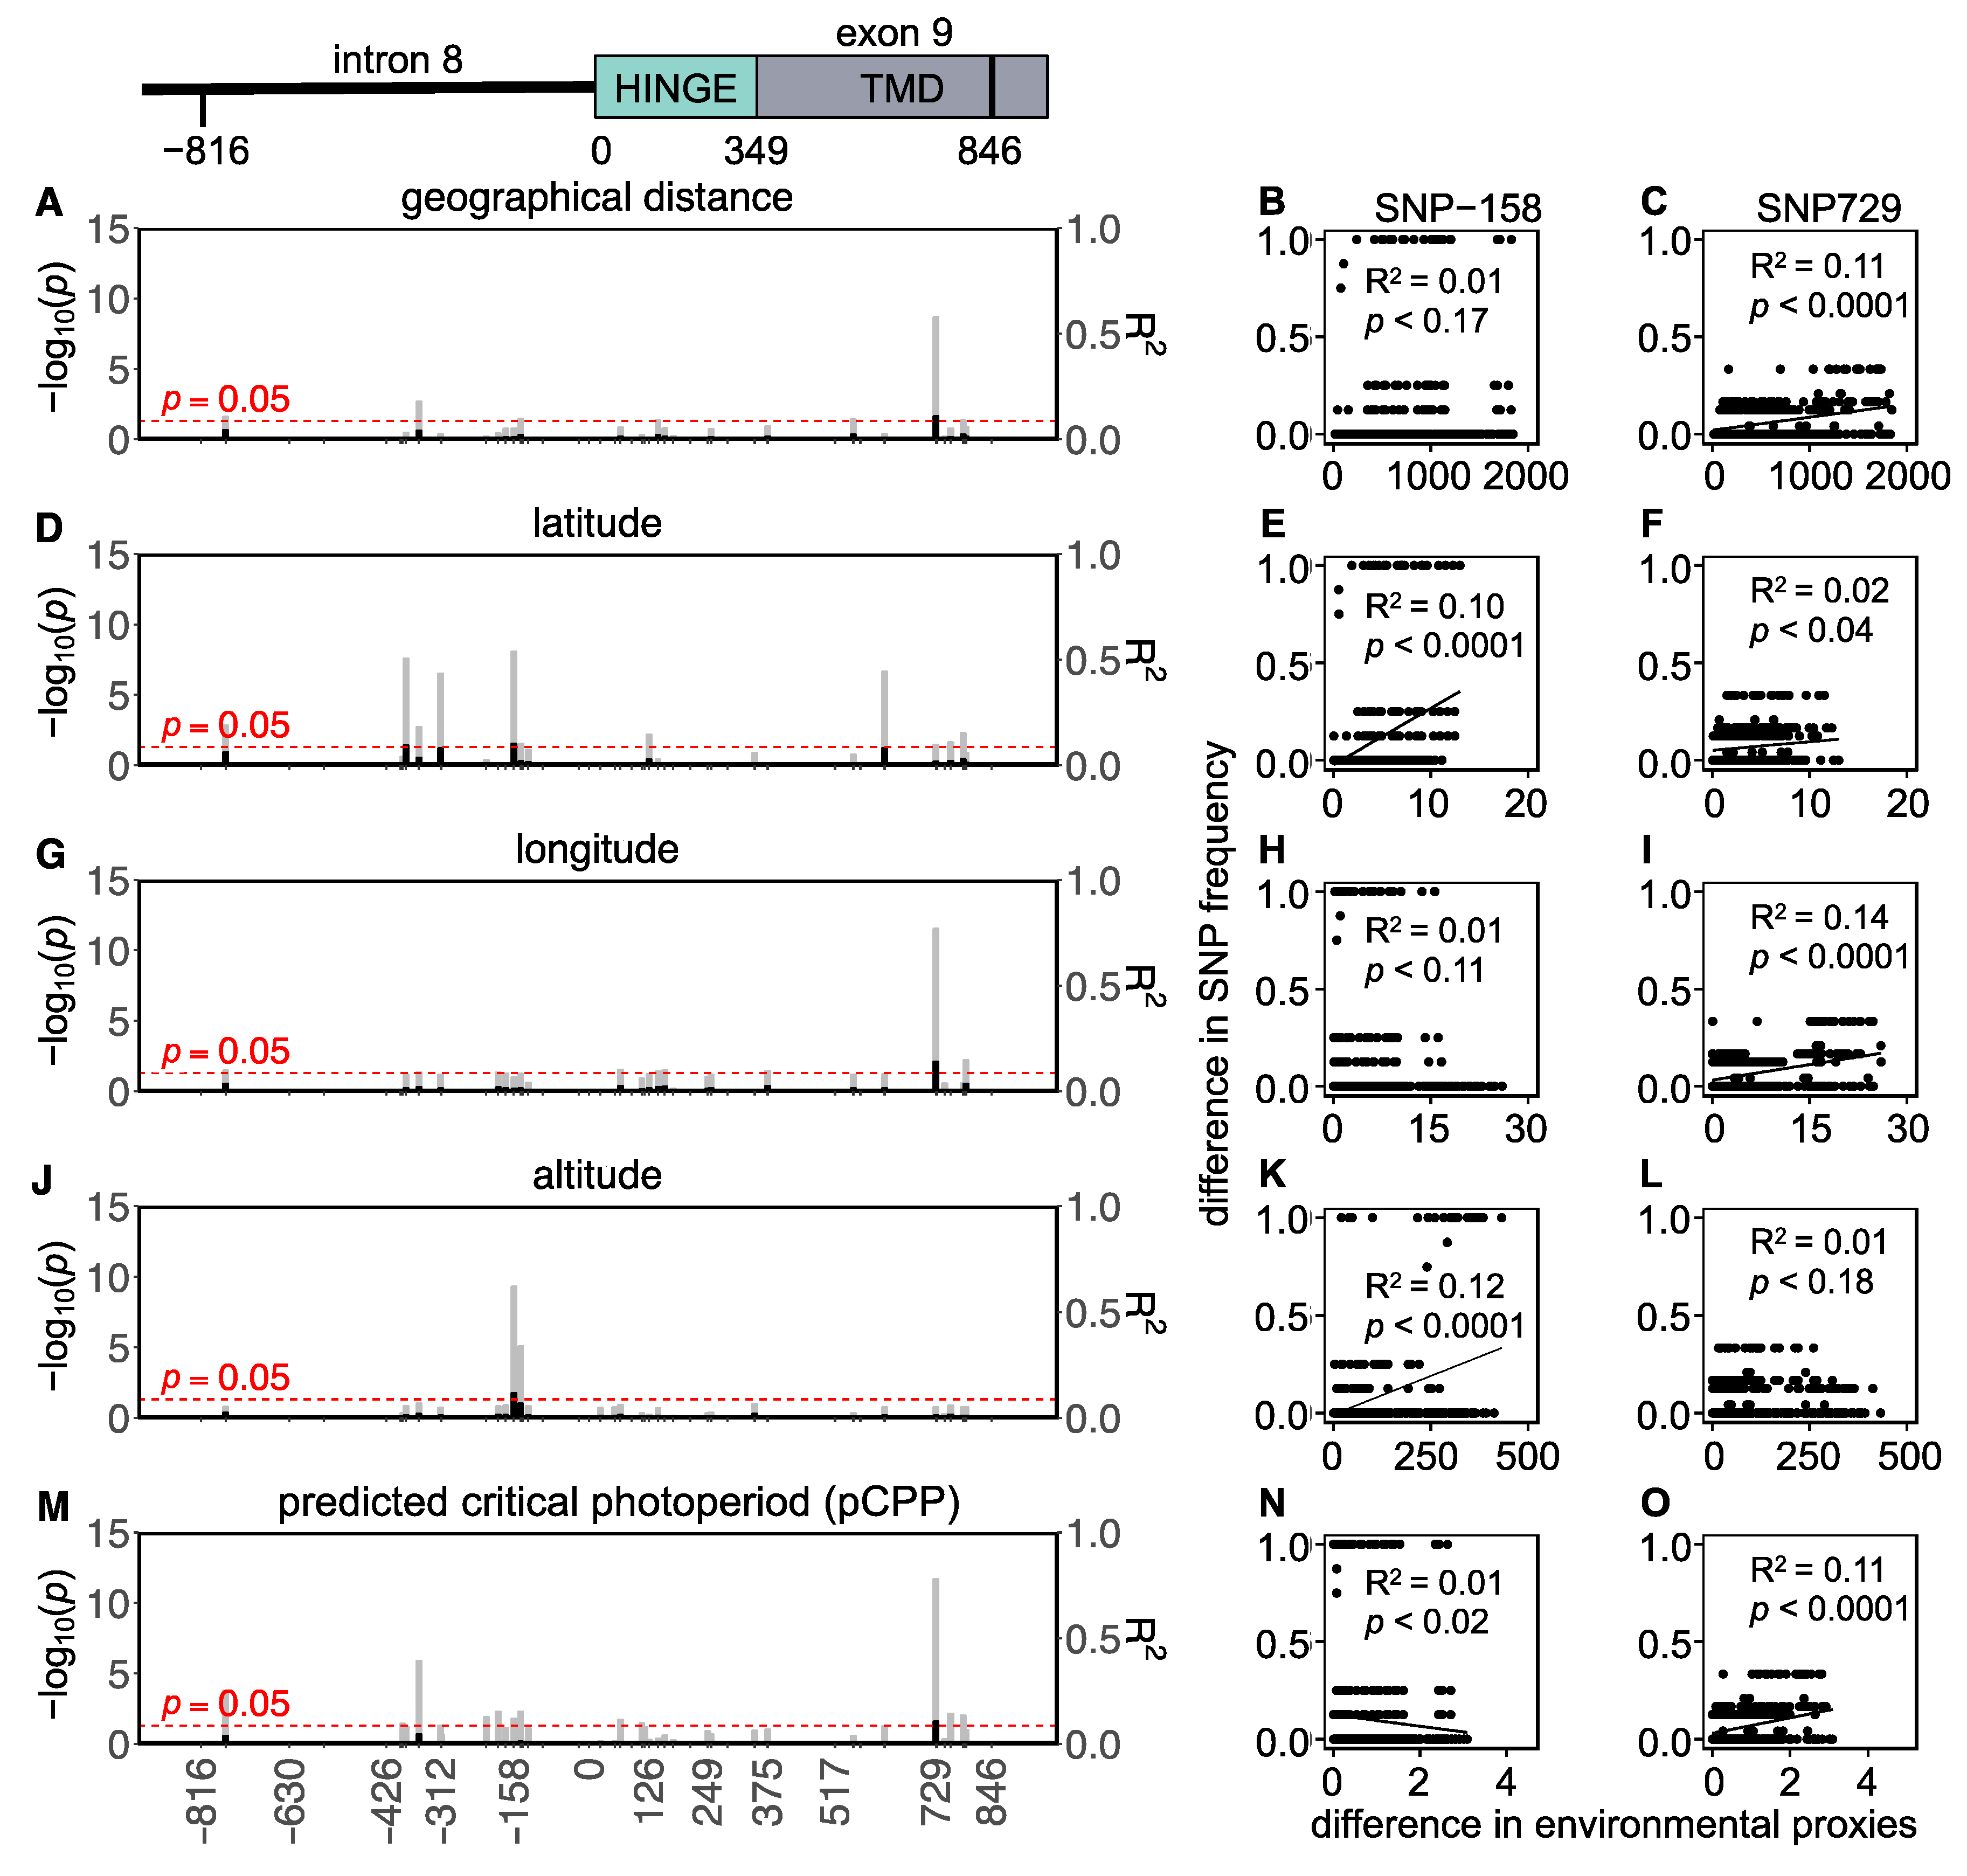
3.2. Eastern European Lineage
4. Discussion
Supplementary Materials
Author Contributions
Funding
Institutional Review Board Statement
Informed Consent Statement
Data Availability Statement
Acknowledgments
Conflicts of Interest
References
- Baker, J. The Evolution of Breeding Seasons. In Evolution, Essays on Aspects of Ev. Biology; Oxford University Press: New York, NY, USA, 1938; pp. 161–177. [Google Scholar]
- Robson, M.J. A Comparison of British and North African Varieties of Tall Fescue (Festuca arundinacea). I. Leaf Growth during Winter and the Effects on it of Temperature and Daylength. J. Appl. Ecol. 1967, 4, 475–484. [Google Scholar] [CrossRef]
- Peacock, J.M. Temperature and Leaf Growth in Four Grass Species. J. Appl. Ecol. 1976, 13, 225–232. [Google Scholar] [CrossRef]
- Malyshev, A.V.; Henry, H.A.L.; Kreyling, J. Relative Effects of Temperature vs Photoperiod on Growth and Cold Acclimation of Northern and Southern Ecotypes of the Grass Arrhenatherum elatius. Environ. Exp. Bot. 2014, 106, 189–196. [Google Scholar] [CrossRef]
- Hut, R.A.; Paolucci, S.; Dor, R.; Kyriacou, C.P.; Daan, S. Latitudinal Clines: An Evolutionary View on Biological Rhythms. Proc. R. Soc. B Biol. Sci. 2013, 280, 20130433. [Google Scholar] [CrossRef] [PubMed] [Green Version]
- Paolucci, S.; van de Zande, L.; Beukeboom, L.W. Adaptive Latitudinal Cline of Photoperiodic Diapause Induction in the Parasitoid Nasonia vitripennis in Europe. J. Evol. Biol. 2013, 26, 705–718. [Google Scholar] [CrossRef] [Green Version]
- Saunders, D.S. Thermoperiodic Control of Diapause in an Insect: Theory of Internal Coincidence. Science 1973, 181, 358–360. [Google Scholar] [CrossRef]
- Bradshaw, W.E.; Holzapfel, C.M.; Mathias, D. Circadian Rhythmicity and Photoperiodism in the Pitcher-Plant Mosquito: Can the Seasonal Timer Evolve Independently of the Circadian Clock? Am. Nat. 2006, 167, 601–605. [Google Scholar] [CrossRef]
- Bradshaw, W.E.; Lounibos, L.P. Evolution of Dormancy and Its Photoperiodic Control in Pitcher-Plant Mosquitoes. Evolution 1977, 31, 546–567. [Google Scholar]
- Bradshaw, W.E.; Holzapfel, C.M. What Season Is It Anyway? Circadian Tracking vs. Photoperiodic Anticipation in Insects. J. Biol. Rhythm. 2010, 25, 155–165. [Google Scholar] [CrossRef]
- Paolucci, S.; Salis, L.; Vermeulen, C.J.; Beukeboom, L.W.; van de Zande, L. QTL Analysis of the Photoperiodic Response and Clinal Distribution of Period Alleles in Nasonia vitripennis. Mol. Ecol. 2016, 25, 4805–4817. [Google Scholar] [CrossRef]
- Benetta, E.D.; Beukeboom, L.W.; van de Zande, L. Adaptive Differences in Circadian Clock Gene Expression Patterns and Photoperiodic Diapause Induction in Nasonia vitripennis. Am. Nat. 2019, 193, 881–896. [Google Scholar] [CrossRef] [PubMed]
- Mathias, D.; Jacky, L.; Bradshaw, W.E.; Holzapfel, C.M. Quantitative Trait Loci Associated with Photoperiodic Response and Stage of Diapause in the Pitcher-Plant Mosquito, Wyeomyia smithii. Genetics 2007, 176, 391–402. [Google Scholar] [CrossRef] [PubMed] [Green Version]
- Mathias, D.; Jacky, L.; Bradshaw, W.E.; Holzapfel, C.M. Geographic and Developmental Variation in Expression of the Circadian Rhythm Gene, Timeless, in the Pitcher-Plant Mosquito, Wyeomyia smithii. J. Insect Physiol. 2005, 51, 661–667. [Google Scholar] [CrossRef]
- Bradshaw, W.E.; Holzapfel, C.M. Phenotypic Evolution and Genetic Architecture Underlying Photoperiodic Time Measurement. J. Insect Physiol. 2001, 47, 809–820. [Google Scholar] [CrossRef]
- Heideman, P.; Bronson, F. Characteristics of a Genetic Polymorphism for Reproductive Photoresponsiveness in the White-Footed Mouse (Peromyscus leucopus). Biol. Reprod. 1991, 44, 1189–1196. [Google Scholar] [CrossRef] [Green Version]
- Desjardines, C.; Bronson, F.H.; Blank, J.L. Genetic Selection for Reproductive Photoresponsiveness in Deer Mice. Nature 1986, 322, 172–173. [Google Scholar] [CrossRef]
- Kliman, R.M.; Lynch, R.G. Evidence for Genetic Variation in the Occurrence of the Photoresponse of the Djungarian Hamster, Phodopus sungorus. J. Biol. Rhythm. 1992, 7, 161–173. [Google Scholar] [CrossRef]
- Lynch, G.R.; Lynch, C.B.; Kliman, R.M. Genetic Analyses of Photoresponsiveness in the Djungarian Hamster, Phodopus sungorus. J. Comp. Physiol. A 1989, 164, 475–481. [Google Scholar] [CrossRef]
- Dark, J.; Johnston, P.G.; Healy, M.; Zucker, I. Latitude of Origin Influences Photoperiodic Control of Reproduction of Deer Mice (Peromyscus maniculatus). Biol. Reprod. 1983, 28, 213–220. [Google Scholar] [CrossRef] [Green Version]
- Nakane, Y.; Yoshimura, T. Photoperiodic Regulation of Reproduction in Vertebrates. Annu. Rev. Anim. Biosci. 2019, 7, 173–194. [Google Scholar] [CrossRef]
- Król, E.; Douglas, A.; Dardente, H.; Birnie, M.J.; van der Vinne, V.; Eijer, W.G.; Gerkema, M.P.; Hazlerigg, D.G.; Hut, R.A. Strong Pituitary and Hypothalamic Responses to Photoperiod but Not to 6-Methoxy-2-Benzoxazolinone in Female Common Voles (Microtus arvalis). Gen. Comp. Endocrinol. 2012, 179, 289–295. [Google Scholar] [CrossRef] [PubMed]
- Van Rosmalen, L.; van Dalum, J.; Hazlerigg, D.G.; Hut, R.A. Gonads or Body? Differences in Gonadal and Somatic Photoperiodic Growth Response in Two Vole Species. J. Exp. Biol. 2020, 223, jeb.230987. [Google Scholar] [CrossRef] [PubMed]
- Van Rosmalen, L.; van Dalum, J.; Appenroth, D.; Roodenrijs, R.; de Witt, L.; Hazlerigg, D.; Hut, R. Mechanisms of Temperature Modulation in Mammalian Seasonal Timing. FASEB J. 2021, 35, e21605. [Google Scholar] [CrossRef] [PubMed]
- Van Rosmalen, L.; Riedstra, B.; Beemster, N.; Dijkstra, C.; Hut, R.A. Differential Temperature Effects on Photoperiodism in Female Voles: A Possible Explanation for Declines in Vole Populations. Mol. Ecol. 2022, 31, 3360–3373. [Google Scholar] [CrossRef]
- Hoffman, R.A.; Reiter, R.J. Pineal Gland: Influence on Gonads of Male Hamsters. Science 1965, 148, 1609–1611. [Google Scholar] [CrossRef]
- Carter, D.S.; Goldman, B.D. Antigonadal Effects of Timed Melatonin Infusion in Pinealectomized Male Djungarian Hamsters (Phodopus sungorus): Duration Is the Critical Parameter. Endocrinology 1983, 113, 1261–1267. [Google Scholar] [CrossRef]
- Bittman, E.L.; Dempsey, R.J.; Karsch, F.J. Pineal Melatonin Secretion Drives the Reproductive Response to Daylength in the Ewe. Endocrinology 1983, 113, 2276–2283. [Google Scholar] [CrossRef]
- Masumoto, K.H.; Ukai-Tadenuma, M.; Kasukawa, T.; Nagano, M.; Uno, K.D.; Tsujino, K.; Horikawa, K.; Shigeyoshi, Y.; Ueda, H.R. Acute Induction of Eya3 by Late-Night Light Stimulation Triggers TSHβ Expression in Photoperiodism. Curr. Biol. 2010, 20, 2199–2206. [Google Scholar] [CrossRef] [Green Version]
- Dardente, H.; Wyse, C.A.; Birnie, M.J.; Dupré, S.M.; Loudon, A.S.I.; Lincoln, G.A.; Hazlerigg, D.G. A Molecular Switch for Photoperiod Responsiveness in Mammals. Curr. Biol. 2010, 20, 2193–2198. [Google Scholar] [CrossRef] [Green Version]
- Magner, J.A. Thyroid-Stimulating Hormone: Biosynthesis, Cell Biology, and Bioactivity. Endocr. Rev. 1990, 11, 354–385. [Google Scholar] [CrossRef]
- Guerra, M.; Blázquez, J.L.; Peruzzo, B.; Peláez, B.; Rodríguez, S.; Toranzo, D.; Pastor, F.; Rodríguez, E.M. Cell Organization of the Rat Pars Tuberalis. Evidence for Open Communication between Pars Tuberalis Cells, Cerebrospinal Fluid and Tanycytes. Cell Tissue Res. 2010, 339, 359–381. [Google Scholar] [CrossRef] [PubMed]
- Hanon, E.A.; Lincoln, G.A.; Fustin, J.-M.; Dardente, H.; Masson-Pévet, M.; Morgan, P.J.; Hazlerigg, D.G. Ancestral TSH Mechanism Signals Summer in a Photoperiodic Mammal. Curr. Biol. 2008, 18, 1147–1152. [Google Scholar] [CrossRef] [PubMed] [Green Version]
- Nakao, N.; Ono, H.; Yamamura, T.; Anraku, T.; Takagi, T.; Higashi, K.; Yasuo, S.; Katou, Y.; Kageyama, S.; Uno, Y.; et al. Thyrotrophin in the Pars Tuberalis Triggers Photoperiodic Response. Nature 2008, 452, 317–322. [Google Scholar] [CrossRef]
- Yoshimura, T.; Yasuo, S.; Watanabe, M.; Iigo, M.; Yamamura, T.; Hirunagi, K.; Ebihara, S. Light-Induced Hormone Conversion of T4 to T3 Regulates Photoperiodic Response of Gonads in Birds. Nature 2003, 426, 178–181. [Google Scholar] [CrossRef] [PubMed]
- Ono, H.; Hoshino, Y.; Yasuo, S.; Watanabe, M.; Nakane, Y.; Murai, A.; Ebihara, S.; Korf, H.-W.; Yoshimura, T. Involvement of Thyrotropin in Photoperiodic Signal Transduction in Mice. Proc. Natl. Acad. Sci. USA 2008, 105, 18238–18242. [Google Scholar] [CrossRef] [PubMed] [Green Version]
- Lechan, R.M.; Fekete, C. Role of Thyroid Hormone Deiodination in the Hypothalamus. Thyroid 2005, 15, 883–897. [Google Scholar] [CrossRef]
- Ho, S.C.; Sande, J.V.A.N.; Lefort, A.; Vassart, G.; Costagliola, S. Effects of Mutations Iinvolving the Highly Conserved S281HCC Motif in the Extracellular Domain of the Thyrotropin (TSH) Receptor on TSH Binding and Constitutive Activity. Endocrinology 2001, 142, 2760–2767. [Google Scholar] [CrossRef]
- Rubin, C.J.; Zody, M.C.; Eriksson, J.; Meadows, J.R.S.; Sherwood, E.; Webster, M.T.; Jiang, L.; Ingman, M.; Sharpe, T.; Ka, S.; et al. Whole-Genome Resequencing Reveals Loci under Selection during Chicken Domestication. Nature 2010, 464, 587–591. [Google Scholar] [CrossRef] [Green Version]
- Kijas, J.W.; Lenstra, J.A.; Hayes, B.; Boitard, S.; Neto, L.R.; Cristobal, M.S.; Servin, B.; McCulloch, R.; Whan, V.; Gietzen, K.; et al. Genome-Wide Analysis of the World’s Sheep Breeds Reveals High Levels of Historic Mixture and Strong Recent Selection. PLoS Biol. 2012, 10, e1001258. [Google Scholar] [CrossRef] [Green Version]
- Fariello, M.I.; Servin, B.; Tosser-Klopp, G.; Rupp, R.; Moreno, C.; Cristobal, M.S.; Boitard, S.; Arranz, J.J.; Banos, G.; Barendse, W.; et al. Selection Signatures in Worldwide Sheep Populations. PLoS ONE 2014, 9, e103813. [Google Scholar] [CrossRef] [Green Version]
- Karlsson, A.C.; Fallahshahroudi, A.; Johnsen, H.; Hagenblad, J.; Wright, D.; Andersson, L.; Jensen, P. A Domestication Related Mutation in the Thyroid Stimulating Hormone Receptor Gene (TSHR) Modulates Photoperiodic Response and Reproduction in Chickens. Gen. Comp. Endocrinol. 2016, 228, 69–78. [Google Scholar] [CrossRef] [PubMed]
- Smits, G.; Campillo, M.; Govaerts, C.; Janssens, V.; Richter, C.; Vassart, G.; Pardo, L.; Costagliola, S. Glycoprotein Hormone Receptors: Determinants in Leucine-Rich Repeats Responsible for Ligand Specificity. EMBO J. 2003, 22, 2692–2703. [Google Scholar] [CrossRef] [PubMed] [Green Version]
- Kleinau, G.; Neumann, S.; Grüters, A.; Krude, H.; Biebermann, H. Novel Insights on Thyroid-Stimulating Hormone Receptor Signal Transduction. Endocr. Rev. 2013, 34, 691–724. [Google Scholar] [CrossRef] [Green Version]
- Wittkopp, P.J.; Kalay, G. Cis-Regulatory Elements: Molecular Mechanisms and Evolutionary Processes Underlying Divergence. Nat. Rev. Genet. 2012, 13, 59–69. [Google Scholar] [CrossRef] [PubMed]
- Graves, P.N.; Tomer, Y.; Davies, T.F. Cloning and Sequencing of a 1.3 Kb Variant of Human Thyrotropin Receptor mRNA Lacking the Transmembrane Domain. Biochem. Biophys. Res. Commun. 1992, 187, 1135–1143. [Google Scholar] [CrossRef]
- Mizutori, Y.; Chen, C.R.; McLachlan, S.M.; Rapoport, B. The Thyrotropin Receptor Hinge Region Is Not Simply a Scaffold for the Leucine-Rich Domain but Contributes to Ligand Binding and Signal Transduction. Mol. Endocrinol. 2008, 22, 1171–1182. [Google Scholar] [CrossRef] [Green Version]
- Daan, S.; Aschoff, J. Circadian Rhythms of Locomotor Activity in Captive Birds and Mammals: Their Variations with Season and Latitude. Oecologia 1975, 18, 269–316. [Google Scholar] [CrossRef] [Green Version]
- Nielsen, E.T. Twilight and the “crep” Unit. Nature 1961, 190, 878–879. [Google Scholar] [CrossRef]
- Stojak, J.; McDevitt, A.D.; Herman, J.S.; Searle, J.B.; Wójcik, J.M. Post-Glacial Colonization of Eastern Europe from the Carpathian Refugium: Evidence from Mitochondrial DNA of the Common Vole Microtus arvalis. Biol. J. Linn. Soc. 2015, 115, 927–939. [Google Scholar] [CrossRef] [Green Version]
- Haynes, S.; Jaarola, M.; Searle, J.B. Phylogeography of the Common Vole (Microtus arvalis) with Particular Emphasis on the Colonzaition of the Orkney Archipelago. Mol. Ecol. 2003, 12, 951–956. [Google Scholar] [CrossRef]
- South, A. Rworldmap: A New R Package for Mapping Global Data. R J. 2011, 3, 35–43. [Google Scholar] [CrossRef]
- South, A. Rworldxtra: Country Boundaries at High Resolution, R Package Version 1.01. 2012. Available online: https://rdrr.io/cran/rworldxtra/ (accessed on 7 December 2022).
- Neuwirth, E. RColorBrewer: ColorBrewer Palettes, R Package Version 1.1-2. 2014. Available online: https://cran.r-project.org/web/packages/RColorBrewer/index.html (accessed on 7 December 2022).
- Bivand, R.; Lewin-Koh, N. Maptools: Tools for Handling Spatial Objects, R Package Version 0.9-5. 2019. Available online: https://cran.r-project.org/web/packages/maptools/index.html (accessed on 7 December 2022).
- Bivand, R. ClassInt: Choose Univariate Class Intervals, R Package Version 0.3-3. 2019. Available online: https://r-spatial.github.io/classInt/reference/classIntervals.html (accessed on 7 December 2022).
- Peacock, J.M. Temperature and Leaf Growth in Lolium perenne. II. The Site of Temperature Perception. J. Appl. Ecol. 1975, 12, 115–123. [Google Scholar] [CrossRef]
- Cooper, J.P. Climatic Variation in Forage Grasses. I. Leaf Development in Climatic Races of Lolium and Dactylis. J. Appl. Ecol. 1964, 1, 45–61. [Google Scholar] [CrossRef]
- Kelley, L.A.; Mezulis, S.; Yates, C.M.; Wass, M.N.; Sternberg, M.J. The Phyre2 Web Portal for Protein Modeling, Prediction and Analysis. Nat. Protoc. 2015, 10, 845–858. [Google Scholar] [CrossRef] [PubMed] [Green Version]
- Grabe, N. AliBaba2: Context Specific Identification of Transcription Factor Binding Sites. In Silico Biol. 2002, 2, S1–S15. [Google Scholar] [PubMed]
- Rellstab, C.; Gugerli, F.; Eckert, A.J.; Hancock, A.M.; Holderegger, R. A Practical Guide to Environmental Association Analysis in Landscape Genomics. Mol. Ecol. 2015, 24, 4348–4370. [Google Scholar] [CrossRef] [Green Version]
- Benjamini, Y.; Hochberg, Y. Controlling the False Discovery Rate: A Practical and Powerful Approach to Multiple Testing. J. R. Stat. Soc. Ser. B 1995, 57, 289–300. [Google Scholar] [CrossRef]
- Yekutieli, D.; Benjamini, Y. Resampling-Based False Discovery Rate Controlling Multiple Test Procedures for Correlated Test Statistics. J. Stat. Plan. Inference 1999, 82, 171–196. [Google Scholar] [CrossRef]
- Shin, J.-H.; Blay, S.; McNeney, B.; Graham, J. LDheatmap: An R Function for Graphical Display of Pairwise Linkage Disequilibria between Single Nucleotide Polymorphisms. J. Stat. Softw. 2006, 16, 1–9. [Google Scholar] [CrossRef] [Green Version]
- Saitou, N.; Nei, M. The Neighbor-Joining Method: A New Method for Reconstructing Phylogenetic Trees. Mol. Biol. Evol. 1987, 4, 406–425. [Google Scholar]
- Takezaki, N.; Nei, M.; Tamura, K. POPTREEW: Web Version of POPTREE for Constructing Population Trees from Allele Frequency Data and Computing Some Other Quantities. Mol. Biol. Evol. 2014, 31, 1622–1624. [Google Scholar] [CrossRef] [Green Version]
- Wickham, H. Ggplot2: Elegant Graphics for Data Analysis; Springer: New York, NY, USA, 2016. [Google Scholar]
- Martínková, N.; Barnett, R.; Cucchi, T.; Struchen, R.; Pascal, M.; Pascal, M.; Fischer, M.C.; Higham, T.; Brace, S.; Ho, S.Y.W.; et al. Divergent Evolutionary Processes Associated with Colonization of Offshore Islands. Mol. Ecol. 2013, 22, 5205–5220. [Google Scholar] [CrossRef] [PubMed]
- Heckel, G.; Burri, R.; Fink, S.; Desmet, J.-F.; Excoffier, L. Genetic Structure and Colonization Processes in European Populations of the Common Vole, Microtus arvalis. Evolution 2005, 59, 2231. [Google Scholar] [CrossRef] [PubMed]
- Nei, M. Estimation of Average Heterozygosity and Genetic Distance from a Small Number of Individuals. Genetics 1978, 89, 583–590. [Google Scholar] [CrossRef] [PubMed]
- Hutchison, D.W.; Templeton, A.R. Correlation of Pairwise Genetic and Geographic Distance Measures: Inferring the Relative Influences of Gene Flow and Drift on the Distribution of Genetic Variability. Evolution 1999, 53, 1898–1914. [Google Scholar] [CrossRef] [PubMed]
- Endler, J.A. Geographic Variation, Speciation, and Clines; Princeton University Press: Princeton, NJ, USA, 1977. [Google Scholar]
- Stojak, J.; McDevitt, A.D.; Herman, J.S.; Krystufek, B.; Uhlikova, J.; Purger, J.J.; Lavrenchenko, L.A.; Searle, J.B.; Wójcik, J.M. Between the Balkans and the Baltic: Phylogeography of a Common Vole Mitochondrial DNA Lineage Limited to Central Europe. PLoS ONE 2016, 11, e0168621. [Google Scholar] [CrossRef] [PubMed] [Green Version]
- Stojak, J.; Borowik, T.; Górny, M.; McDevitt, A.D.; Wójcik, J.M. Climatic Influences on the Genetic Structure and Distribution of the Common Vole and Field Vole in Europe. Mammal Res. 2019, 64, 19–29. [Google Scholar] [CrossRef] [Green Version]
- Baca, M.; Popović, D.; Lemanik, A.; Bañuls-Cardona, S.; Conard, N.J.; Cuenca-Bescós, G.; Desclaux, E.; Fewlass, H.; Garcia, J.T.; Hadravova, T.; et al. Ancient DNA Reveals Interstadials as a Driver of Common Vole Population Dynamics during the Last Glacial Period. J. Biogeogr. 2022, 50, 183–196. [Google Scholar] [CrossRef]
- Stojak, J.; Wójcik, J.M.; Ruczyńska, I.; Searle, J.B.; McDevitt, A.D. Contrasting and Congruent Patterns of Genetic Structuring in Two Microtus Vole Species Using Museum Specimens. Mammal Res. 2016, 61, 141–152. [Google Scholar] [CrossRef] [Green Version]
- Hewitt, G.M. Post-Glacial Re-Colonization of European Biota. Biol. J. Linn. Soc. 1999, 68, 87–112. [Google Scholar] [CrossRef]
- Stojak, J.; Tarnowska, E. Polish Suture Zone as the Goblet of Truth in Post-Glacial History of Mammals in Europe. Mammal Res. 2019, 64, 463–475. [Google Scholar] [CrossRef] [Green Version]
- Phifer-Rixey, M.; Bi, K.; Ferris, K.G.; Sheehan, M.J.; Lin, D.; Mack, K.L.; Keeble, S.M.; Suzuki, T.A.; Good, J.M.; Nachman, M.W. The Genomic Basis of Environmental Adaptation in House Mice. PLoS Genet. 2018, 14, e1007672. [Google Scholar] [CrossRef] [PubMed]
- Ferris, K.G.; Chavez, A.S.; Suzuki, T.A.; Beckman, E.J.; Bi, K.; Nachman, M.W. The Genomics of Rapid Climatic Adaptation and Parallel Evolution in North American House Mice. PLoS Genet. 2021, 17, e1009495. [Google Scholar] [CrossRef] [PubMed]
- Bradshaw, W.E. Geography of Photoperiodic Response in Diapausing Mosquito. Nature 1976, 262, 384–386. [Google Scholar] [CrossRef]
- Millar, J.S.; Innes, D.G.L. Breeding by Peromyscus maniculatus over an Elevational Gradient. Can. J. Zool. 1985, 63, 124–129. [Google Scholar] [CrossRef]
- Ji, C.; Casinghino, S.; McCarthy, T.L.; Centrella, M. Multiple and Essential Sp1 Binding Sites in the Promoter for Transforming Growth Factor-β Type I Receptor. J. Biol. Chem. 1997, 272, 21260–21267. [Google Scholar] [CrossRef] [Green Version]
- Höller, M.; Westin, G.; Jiricny, J.; Schaffner, W. Sp1 Transcription Factor Binds DNA and Activates Transcription Even When the Binding Site Is CpG Methylated. Genes Dev. 1988, 2, 1127–1135. [Google Scholar] [CrossRef] [Green Version]
- Chamary, J.V.; Parmley, J.L.; Hurst, L.D. Hearing Silence: Non-Neutral Evolution at Synonymous Sites in Mammals. Nat. Rev. Genet. 2006, 7, 98–108. [Google Scholar] [CrossRef]
- Hunt, R.; Sauna, Z.E.; Ambudkar, S.V.; Gottesman, M.M.; Kimchi-Sarfaty, C. Silent (Synonymous) SNPs: Should We Care about Them? Methods Mol. Biol. 2009, 578, 23–39. [Google Scholar] [CrossRef]
- Goodenbour, J.M.; Pan, T. Diversity of tRNA Genes in Eukaryotes. Nucleic Acids Res. 2006, 34, 6137–6146. [Google Scholar] [CrossRef] [Green Version]
- Dittmar, K.A.; Goodenbour, J.M.; Pan, T. Tissue-Specific Differences in Human Transfer RNA Expression. PLoS Genet. 2006, 2, e221. [Google Scholar] [CrossRef] [PubMed]
- Quax, T.E.F.; Claassens, N.J.; Soll, D.; Oost, J. van der Codon Bias as a Means to Fine-Tune Gene Expression. Cell Press 2015, 59, 149–161. [Google Scholar] [CrossRef]
- Shinomiya, A.; Shimmura, T.; Nishiwaki-Ohkawa, T.; Yoshimura, T. Regulation of Seasonal Reproduction by Hypothalamic Activation of Thyroid Hormone. Front. Endocrinol. 2014, 5, 12. [Google Scholar] [CrossRef] [Green Version]
- Ikegami, K.; Liao, X.H.; Hoshino, Y.; Ono, H.; Ota, W.; Ito, Y.; Nishiwaki-Ohkawa, T.; Sato, C.; Kitajima, K.; Iigo, M.; et al. Tissue-Specific Posttranslational Modification Allows Functional Targeting of Thyrotropin. Cell Rep. 2014, 9, 801–809. [Google Scholar] [CrossRef] [PubMed] [Green Version]
- Pinkard, O.; McFarland, S.; Sweet, T.; Coller, J. Quantitative tRNA-Sequencing Uncovers Metazoan Tissue-Specific tRNA Regulation. Nat. Commun. 2020, 11, 4104. [Google Scholar] [CrossRef] [PubMed]
- Bradshaw, W.E.; Holzapfel, C.M. Genetic Shift in Photoperiodic Response Correlated with Global Warming. Proc. Natl. Acad. Sci. USA 2001, 98, 14187–14744. [Google Scholar] [CrossRef] [Green Version]
- Bradshaw, W.E.; Holzapfel, C.M. Evolutionary Response to Rapid Climate Change. Science 2006, 312, 1477–1478. [Google Scholar] [CrossRef] [PubMed] [Green Version]
- Bradshaw, W.E.; Holzapfel, C.M. Genetic Response to Rapid Climate Change: It’s Seasonal Timing That Matters. Mol. Ecol. 2008, 17, 157–166. [Google Scholar] [CrossRef]
- Bradshaw, W.E.; Zani, P.A.; Holzapfel, C.M. Adaptation to Temperate Climates. Evolution 2004, 58, 1748–1762. [Google Scholar] [CrossRef]
- Tkadlec, E. The Effects of Seasonality on Variation in the Length of Breeding Season in Arvicoline Rodents. Folia Zool. 2000, 49, 269–286. [Google Scholar]
- Stojak, J.; Jędrzejewska, B. Extinction and Replacement Events Shaped the Historical Biogeography of Arctic Mammals in Europe: New Models of Species Response. Mamm. Rev. 2022, 52, 507–518. [Google Scholar] [CrossRef]


Disclaimer/Publisher’s Note: The statements, opinions and data contained in all publications are solely those of the individual author(s) and contributor(s) and not of MDPI and/or the editor(s). MDPI and/or the editor(s) disclaim responsibility for any injury to people or property resulting from any ideas, methods, instructions or products referred to in the content. |
© 2023 by the authors. Licensee MDPI, Basel, Switzerland. This article is an open access article distributed under the terms and conditions of the Creative Commons Attribution (CC BY) license (https://creativecommons.org/licenses/by/4.0/).
Share and Cite
van Rosmalen, L.; Schepers, R.; Hao, W.; Przybylska-Piech, A.S.; Herman, J.S.; Stojak, J.; Wójcik, J.M.; van de Zande, L.; Searle, J.B.; Hut, R.A. Seasonal Adaptation: Geographic Photoperiod–Temperature Patterns Explain Genetic Variation in the Common Vole Tsh Receptor. Genes 2023, 14, 292. https://doi.org/10.3390/genes14020292
van Rosmalen L, Schepers R, Hao W, Przybylska-Piech AS, Herman JS, Stojak J, Wójcik JM, van de Zande L, Searle JB, Hut RA. Seasonal Adaptation: Geographic Photoperiod–Temperature Patterns Explain Genetic Variation in the Common Vole Tsh Receptor. Genes. 2023; 14(2):292. https://doi.org/10.3390/genes14020292
Chicago/Turabian Stylevan Rosmalen, Laura, Robin Schepers, Wensi Hao, Anna S. Przybylska-Piech, Jeremy S. Herman, Joanna Stojak, Jan M. Wójcik, Louis van de Zande, Jeremy B. Searle, and Roelof A. Hut. 2023. "Seasonal Adaptation: Geographic Photoperiod–Temperature Patterns Explain Genetic Variation in the Common Vole Tsh Receptor" Genes 14, no. 2: 292. https://doi.org/10.3390/genes14020292