Article

Genome-Wide Analysis of Aquaporin Gene Family in Triticum turgidum and Its Expression Profile in Response to Salt Stress

Faculty of Agriculture, Shahrood University of Technology, Shahrood 3619995161, Iran
*
Author to whom correspondence should be addressed.
Genes 2023, 14(1), 202; https://doi.org/10.3390/genes14010202
Submission received: 13 December 2022 / Revised: 7 January 2023 / Accepted: 10 January 2023 / Published: 12 January 2023
(This article belongs to the Section Plant Genetics and Genomics)

Abstract

:
During the response of plants to water stresses, aquaporin (AQP) plays a prominent role in membrane water transport based on the received upstream signals. Due to the importance of the AQP gene family, studies have been conducted that investigate the function and regulatory system of these genes. However, many of their molecular aspects are still unknown. This study aims to carry out a genome-wide investigation of the AQP gene family in Triticum turgidum using bioinformatics tools and to investigate the expression patterns of some members in response to salt stress. Our results show that there are 80 TtAQP genes in T. turgidum, which are classified into four main groups based on phylogenetic analysis. Several duplications were observed between the members of the TtAQP gene family, and high diversity in response to post-translational modifications was observed between TtAQP family members. The expression pattern of TtAQP genes disclosed that these genes are primarily upregulated in response to salt stress. Additionally, the qPCR data revealed that TtAQPs are more induced in delayed responses to salinity stress. Overall, our findings illustrate that TtAQP members are diverse in terms of their structure, regulatory systems, and expression levels.

1. Introduction

Aquaporin proteins (AQPs) include a group of major intrinsic proteins (MIPs) that facilitate the transport of water and other small neutral molecules through the cell membrane by forming channels in the membrane, and play an important role in plants’ growth and responses to abiotic stress [1,2]. AQP channels facilitate bidirectional flow across a concentration gradient in all cells [3]. In addition, some AQP isoforms play the role of peroxyporins and contribute to cellular redox signaling by transporting hydrogen peroxide [4]. Moreover, AQPs in plants have multiple functions, such as the hydraulic control of plant tissue, as well as seed germination and the emergence of lateral roots [2]. Based on structural analysis, AQP family genes can be divided into five main evolutionary subfamilies in plants, including plasma membrane intrinsic proteins (PIP); tonoplast internal proteins (TIP); Nodulin-26 intrinsic proteins such as NIPs, which are small major intrinsic proteins (SIPs); and X intrinsic proteins (XIPs) [5]. Plant AQPs have two fundamental factors; they are extraordinary divers [6], and some are multifunctional channel proteins that allow some small neutral solutes to cross the cell membrane, such as glycerol, CO2, ammonia (NH 3), urea, boron, and hydrogen peroxide [7].
In recent years, the function of AQPs has been investigated in relation to plant responses to biotic and abiotic stresses [8,9,10,11]. It has been shown that AQP can improve plant tolerance to abiotic stresses (such as drought, osmosis, cold, salt, and high temperature) [12]. Furthermore, previous studies show that AQP plays a positive role in responses to biotic stresses. It has also been found that the expression of AQP genes differs depending on the organs and tissues, as well as plant growth regulators and abiotic stress such as drought, heat, and cold [13,14]. Between AQP subfamilies, the function of PIPs and TIPs, which have high transporter activity, is investigated more under adverse conditions [15]. The downregulation of PIPs and TIPs was reported in response to drought and salt stress [1,16,17,18]. Additionally, it was stated that the NIP subfamily is the only AQP able to transport Si (silicon) that can improve plant tolerance in response to various environmental stresses [5,19].
Today, cereals are considered major crops, and wheat is considered a strategic crop among cereals across the globe. Wheat genotypes exist in three ploidy levels, which include diploid, tetraploid, and hexaploid [20]. Durum wheat, T. turgidum L. ssp. durum (Desf.), is a tetraploid wheat (2n = 4x = 28). T. turgidum is best adapted to areas with a relatively dry climate with warm days and cool nights during the growing season (corresponding to a Mediterranean and temperate climate) [21]. As mentioned above, AQPs are critical in transporting water and maintaining cell balance in response to stresses such as drought and salinity. However, the structure and function of AQP gene family members in response to salinity are largely unknown in T. turgidum. In the current study, we aimed to identify and characterize AQPs in T. turgidum (TtAQPs), and the expression levels of several TtAQPs were evaluated at different salinity concentrations. As the first report on this topic, new perspectives related to the structure, process of evolution, and function of members of this gene family are presented.

2. Materials and Methods

2.1. Identification and Sequence Analysis of TtAQPs

To identify the AQP genes in T. turgidum L. ssp. durum (Desf.) (TtAQPs) [22], the protein sequences of putative AQPs in Arabidopsis (AtAQPs) and rice (OsAQPs) were applied as the query sequences against the complete protein sequence of T. turgidum using the BLASTP tool of the EnsemblPlants database (Accessed on 24 November 2022) [23]. In the next step, the extracted sequences were confirmed using the Conserved Domains Database (CDD) (Accessed on 24 November 2022) [24], and Pfam [25]. Then, short sequences (less than 150 amino acids in length) were removed from the list. The identified sequences were analyzed using the Expasy website and their physicochemical properties, such as molecular weight (MW), isoelectric point (pI), instability index, and GRAVY index were estimated using the ProtParam tool [26].

2.2. Investigating Phylogenetics of TtAQPs

To study the relationships of TtAQP proteins in T. turgidum, a phylogenetic tree was constructed with the complete protein sequences of the TtAQP gene family members along with their orthologues from Arabidopsis, rice, barley, corn, and sorghum plants. AQP genes were identified in Arabidopsis (Arabidopsis thaliana), barley (Hordeum vulgare), corn (Zea mays), and rice (Oryza sativa japonica) using the EnsemblPlants database, as was T. turgidum. The sequence of AQP proteins was aligned using the ClustalW program using an online tool, Clustal Omega [27]. Then, the phylogenetic tree of AQPs was constructed based on the maximum likelihood (ML) method with 1000 bootstrap replications using the IQ tree website [28]. The iTOL tool [29] was used to illustrate the phylogenetic tree. Additionally, ten conserved motifs in TtAQPs were identified using the MEME motif finder tool [30] based on the default setting.

2.3. Determining the Duplication Genes and Estimating Ka and Ks Values

The duplication events between TtAQP genes were identifiedbased on similarity, more than 80% between pairs of TtAQP genes [31]. In addition, synonymous (Ks) and non-synonymous (Ka) values at each site among pairs of duplicated genes were calculated using TBtools software (v1.068) [32]. Then, the Ka/Ks ratio was estimated to identify the effect of evolution pressure on the function of duplicated genes. The division time of pairs of duplicated TtAQP genes was estimated using the synonymous mutation rate of substitution λ per synonymous site per year, as T = (Ks/2λ (λ = 6.5 × 10⁻⁹)) × 10−6 [33].

2.4. Prediction of Phosphorylation Site in TtAQP Proteins

Phosphorylation is one of the most important types of post-translational modification. The sites of phosphorylation are serine, tyrosine, and threonine residues on proteins. The potential phosphorylation regions of TtAQP proteins were predicted through the NetPhos 3-1 site, with a potential value higher than 0.80 [34].

2.5. Prediction of 3D Structures and Pocket Sites of AQP Proteins

The three-dimensional structure of TtAQP proteins was predicted using the Phyre2 database [35]. The validity of the predicted protein model was evaluated through Ramachandran plot analysis [36]. The analysis of ligand binding regions (pocket sites) in the predicted protein models was also performed through the Phyre investigator tool of the Phyre2 server.

2.6. TtAQP Gene Promoter Analysis

To identify the regulatory regions in the promoter region, a region 1500 nucleotides upstream of the TtAQP genes was investigated as the promoter region. The sequence of the promoter region was analyzed to recognize the putative cis-regulatory elements using the PlantCARE database [37]. Finally, the identified cis-regulatory elements were grouped based on their functions.

2.7. Interaction Network of TtAQPs

In the present study, we constructed an interaction network of TtAQP proteins based on their homologs in T. aestivum using the String database (https://string-db.org, accessed on 24 November 2022). Additionally, gene ontology (GO) enrichment analysis of proteins presented in the network was performed. To identify the significant GO terms, the FDR (false discovery rate) was adjusted to <0.01.

2.8. Plant Materials and Treatments

Seeds of T. turgidum L. ssp. durum (Desf.) cultivar Yavaros were sterilized with 3% sodium hypochlorite for 10 min. Then, they were cultivated in pots containing sterilized perlite and peat moss (2:1). Five seeds were planted in each pot, and after germination, three of the best seedlings were left in each pot. The cultivation conditions were kept with a photoperiod of 16 h of light and 8 h of darkness and a temperature of 25 °C. Forty-day-old seedlings were subjected to salt treatment via irrigation. In the current study, two salt concentrations, 150 and 250 mM of NaCl, were applied twice at 24 h intervals. Some pots were also considered as controls (without using salt stress). After applying salt stress, the leaves of seedlings were sampled at different exposure periods of 6, 24, and 72 h. The collected samples were immediately placed in liquid nitrogen, and then, were transferred to a −80 °C freezer for other analyses.

2.9. Primer Design to Study Gene Expression

To investigate gene expression, six TtAQP genes, including TtAQP18, TtAQP29, TtAQP34, TtAQP79TtAQP58, and TtAQP42, were selected based on the phylogenetic result. The primers of the selected TtAQP genes were designed based on the coding region (CDS) using Primer3 online software [38]. In this study, Actin7 was used as a reference gene (Table S1).

2.10. RNA Extraction and Real-Time PCR

An RNX plus kit (Sinaclon, Tehran, Iran) was used for RNA extraction based on the manufacturer’s instructions. The quality and quantity of the extracted RNA were checked using a NanoPhotometer (Implen N50, IMPLEN, München, Germany). Complementary DNA (cDNA) was synthesized by reverse transcriptase (Roche, Mannheim, Germany) based on the manufacturer’s protocols. The expression levels of TtAQP genes were investigated using Maxima SYBR Green/ROX qPCR (quantitative real-time PCR) Master Mix (Thermo Fisher, Illkirch-Graffenstaden, France) based on the manufacturer’s protocol and ABI Step One. The cycling patterns of qPCR were 95 °C for 10 min, then 35 cycles at 95 °C for 15 s, and 60 °C for 60 s. The relative expression of each gene was calculated using the delta delta Ct method [39]. The expression difference between the treatments and the control sample was calculated based on a t-test. All experiments were performed in three biological replicates.

3. Results

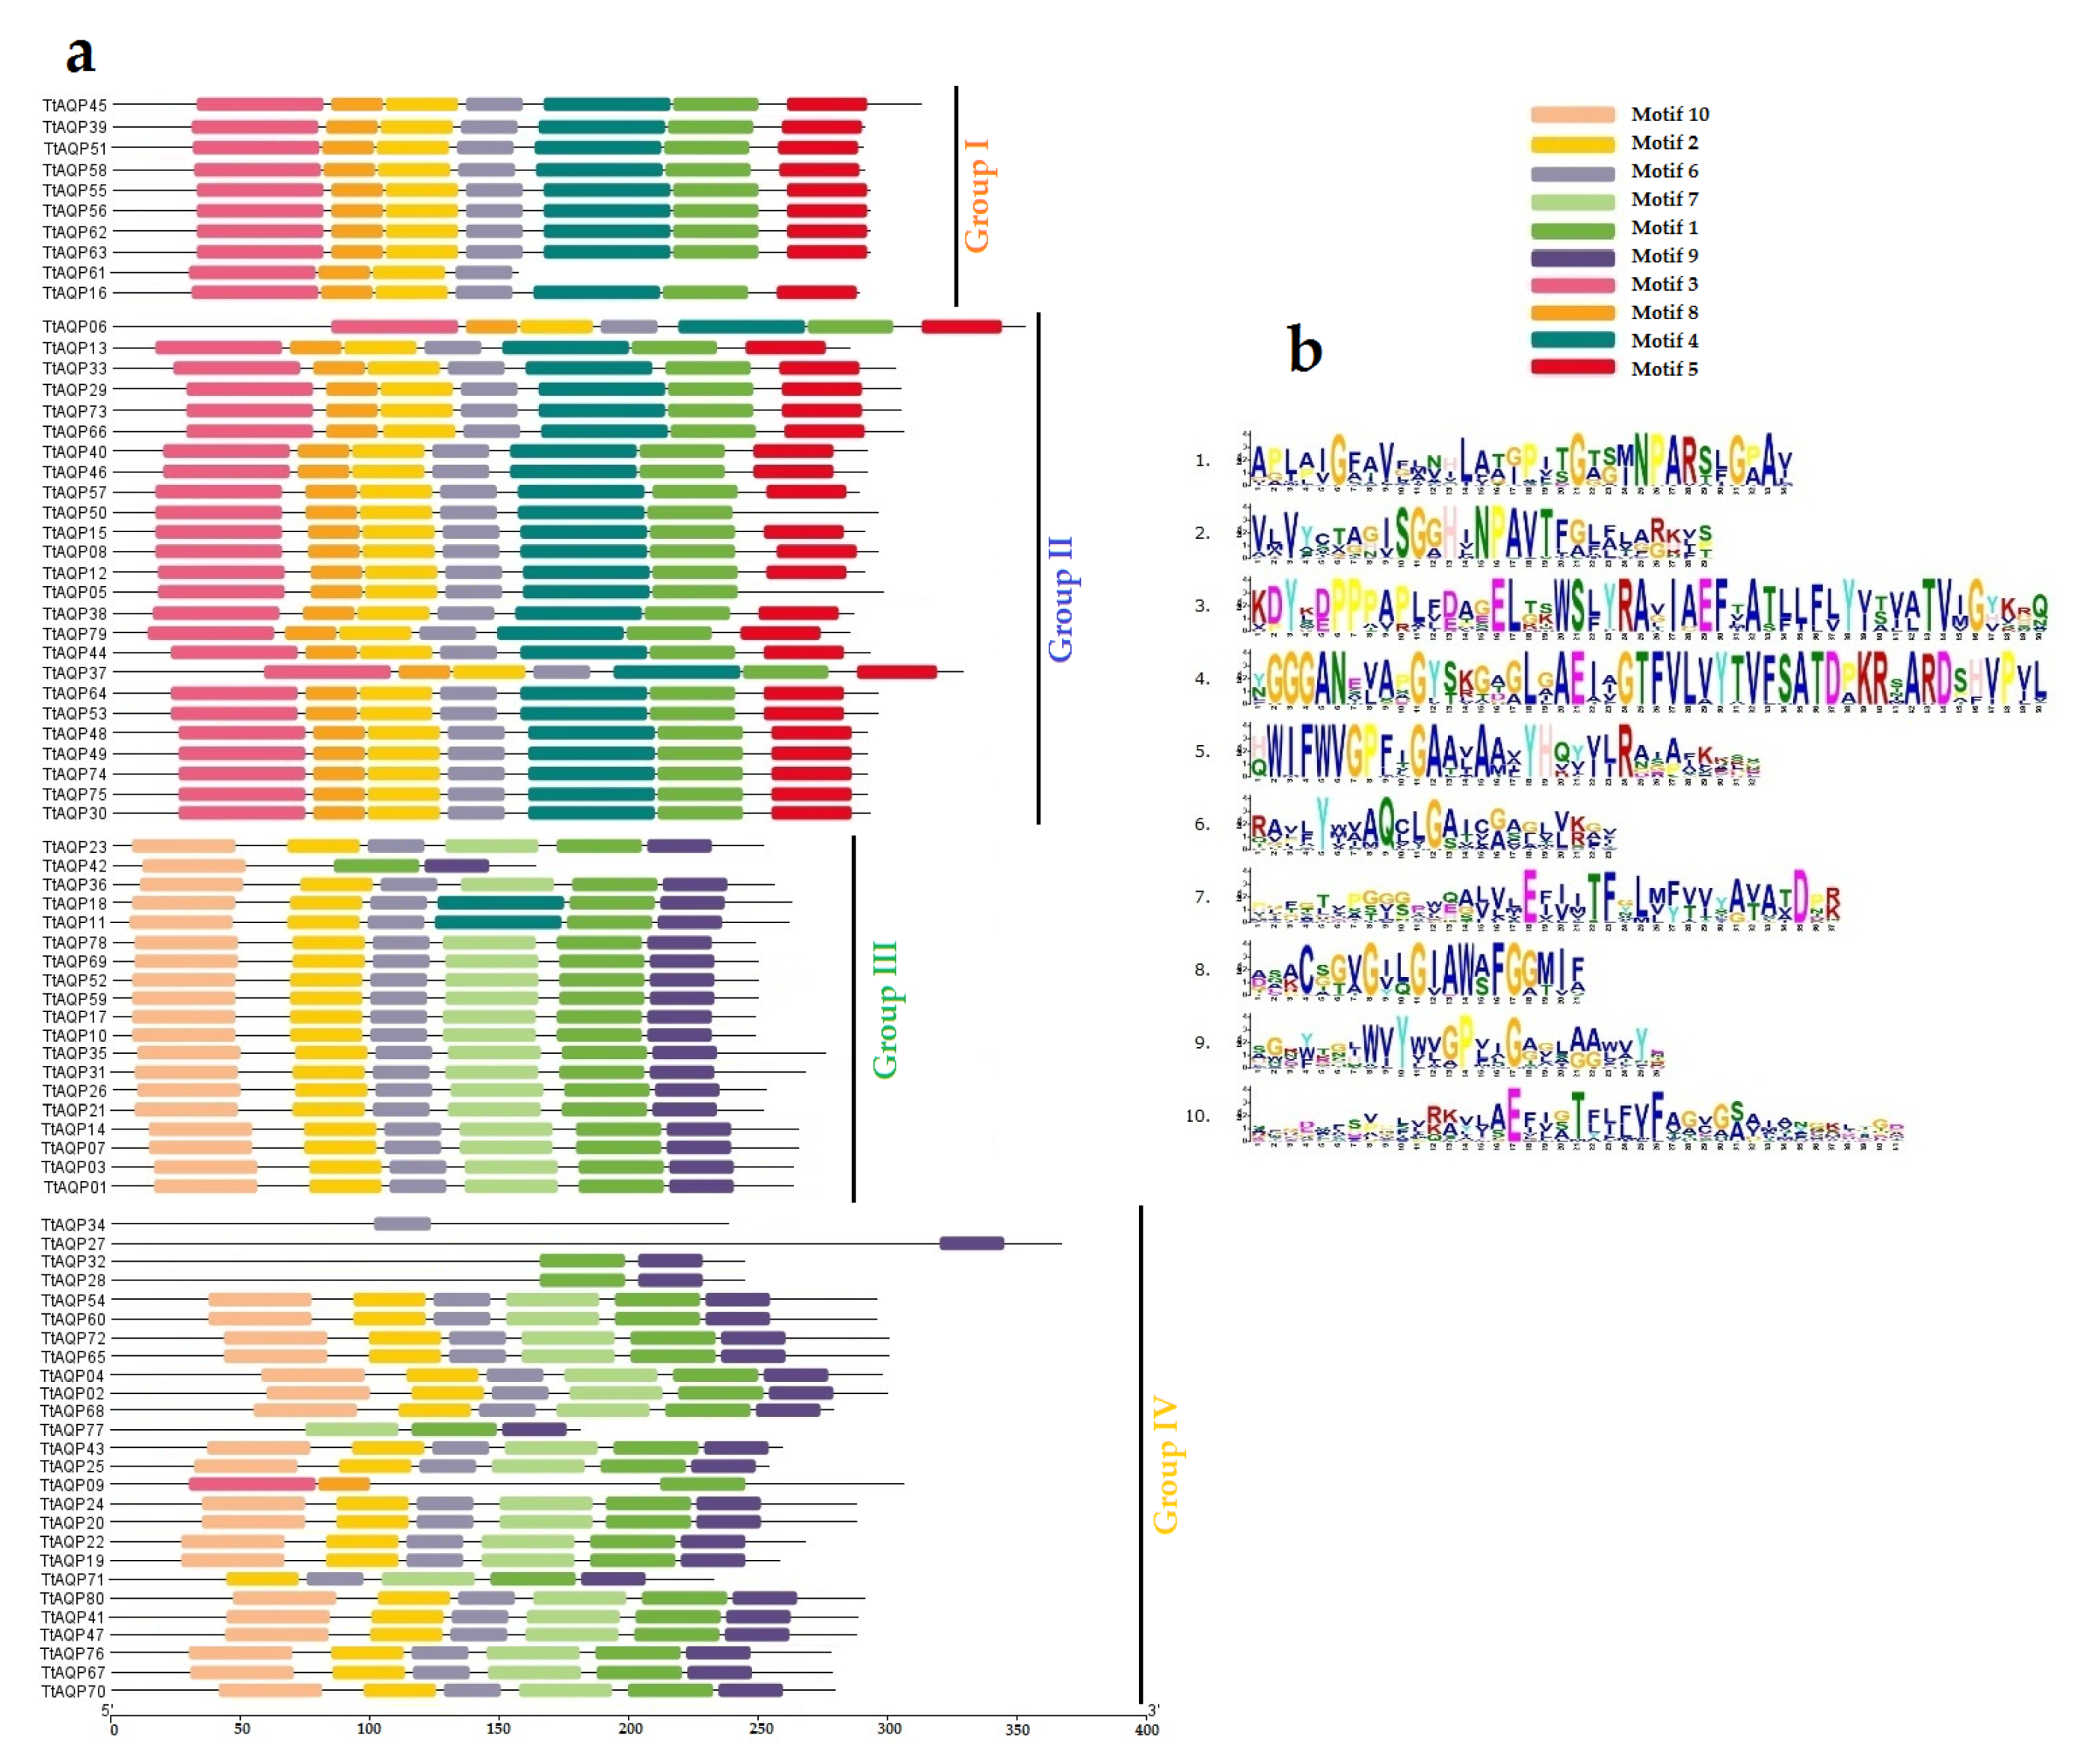
3.1. Identification and Characterization of AQPs

In the current study, 80 putative TtAQP genes were identified in the genome of T. turgidum. Detailed information on the 80 TtAQPs is provided in Table S2. In addition, TtAQPs were compared with their orthologues in A. thaliana, H. vulgare, O. sativa, and Z. mays based on their physicochemical properties (Table 1). It was observed that the AQPs of the studied plants varied based on their physicochemical properties. In T. turgidum, TtAQPs varied between 157 (TtAQP61) and 392 (TtAQP27) amino acids, and their pI ranged between 4.65 (TtAQP42) and 11.05 (TtAQP09). The exon number of the deduced proteins varied from 1 (most members of the PIP2 subfamily) to 6 and their MWs ranged from 16.7 (TtAQP42) to 41.5 (TtAQP27) kDa. In addition, the GRAVY value of TtAQPs varied between −0.46 and 0.94, and 96% of the deduced proteins were predicted as stable proteins (Table 1 and Table S2).

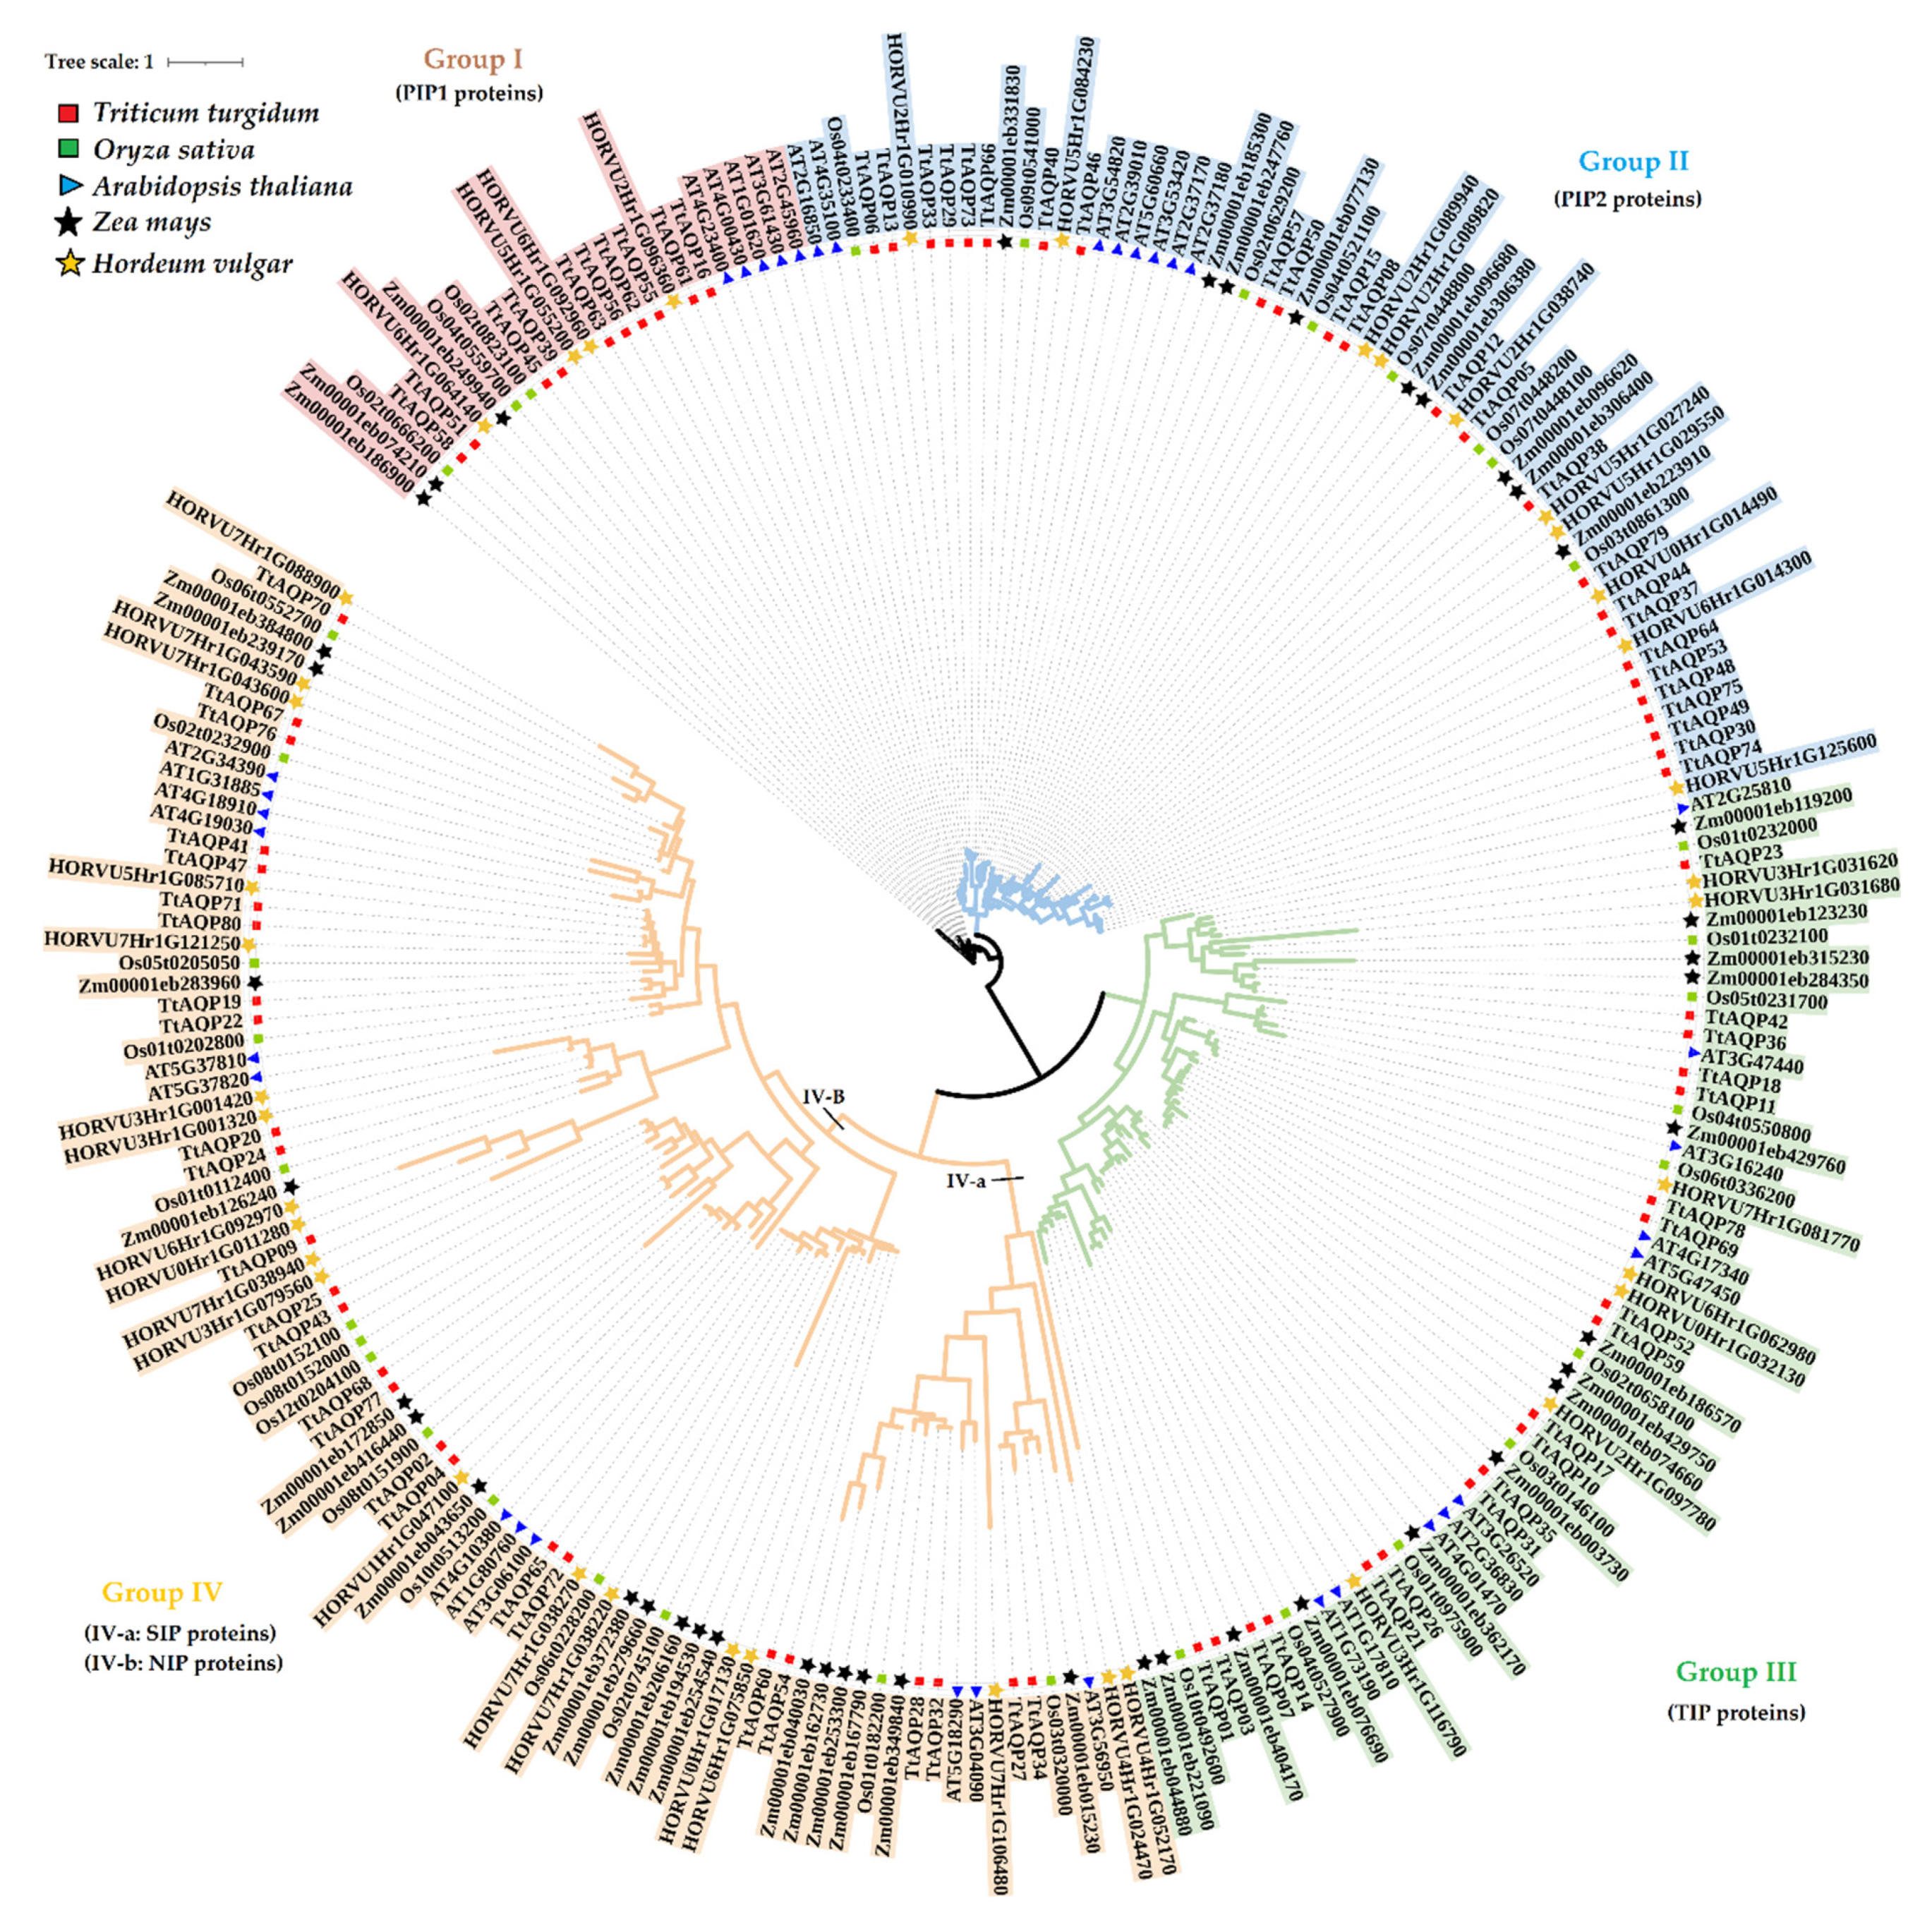
3.2. Evolutionary Analysis

To investigate the relationships of TtAQPs, 237 AQP proteins, including 80 T. turgidum AQPs, 39 H. vulgare AQPs (HvAQPs), 35 Arabidopsis AQPs (AtAQPs), 39 rice AQPs (OsAQPs), and 44 maize AQPs (ZmAQPs), were used to design a phylogenetic tree. According to the phylogenetic tree, all AQPs were classified into four main groups (Figure 1). All PIP1 proteins were located in group 1, PIP2 proteins were placed in group 2, and TIPs were in group 3. In addition, SIPs were located in group 4-a, and NIPs were placed in group 4-b. Ten TtAQPs were present in group 1 with five TtAQPs, four HvAQPs, three OsAQPs, and three ZmAQPs. Additionally, 25 TtAQPs with 8 AtAQPs, 10 HvAQPs, 8 OsAQPs, and 9 ZmAQPs were located in group 2. In addition, 19 TtAQPs with 10 AtAQPs, 7 HvAQPs, 10 OsAQPs, and 14 ZmAQPs were present in group 4. Finally, 26 TtAQPs with 12 AtAQPs, 19 HvAQPs, 14 OsAQPs, and 18 ZmAQPs were located in group 4. Based on the phylogenetic analysis, TtAQPs showed a close relationship with their orthologues in barley. Moreover, AQPs from group 1 showed more genetic distance from the other members. Ten conserved domains were identified in TtAQPs (Figure 2). Motifs 3, 4, 5, and 8 were present in proteins from groups 1 and 2, including PIP1 and PIP2 proteins. Additionally, motifs 10, 7, and 9 were observed in proteins groups 3 and 4. These conserved motifs can be used to identify each subfamily of TtAQPs.

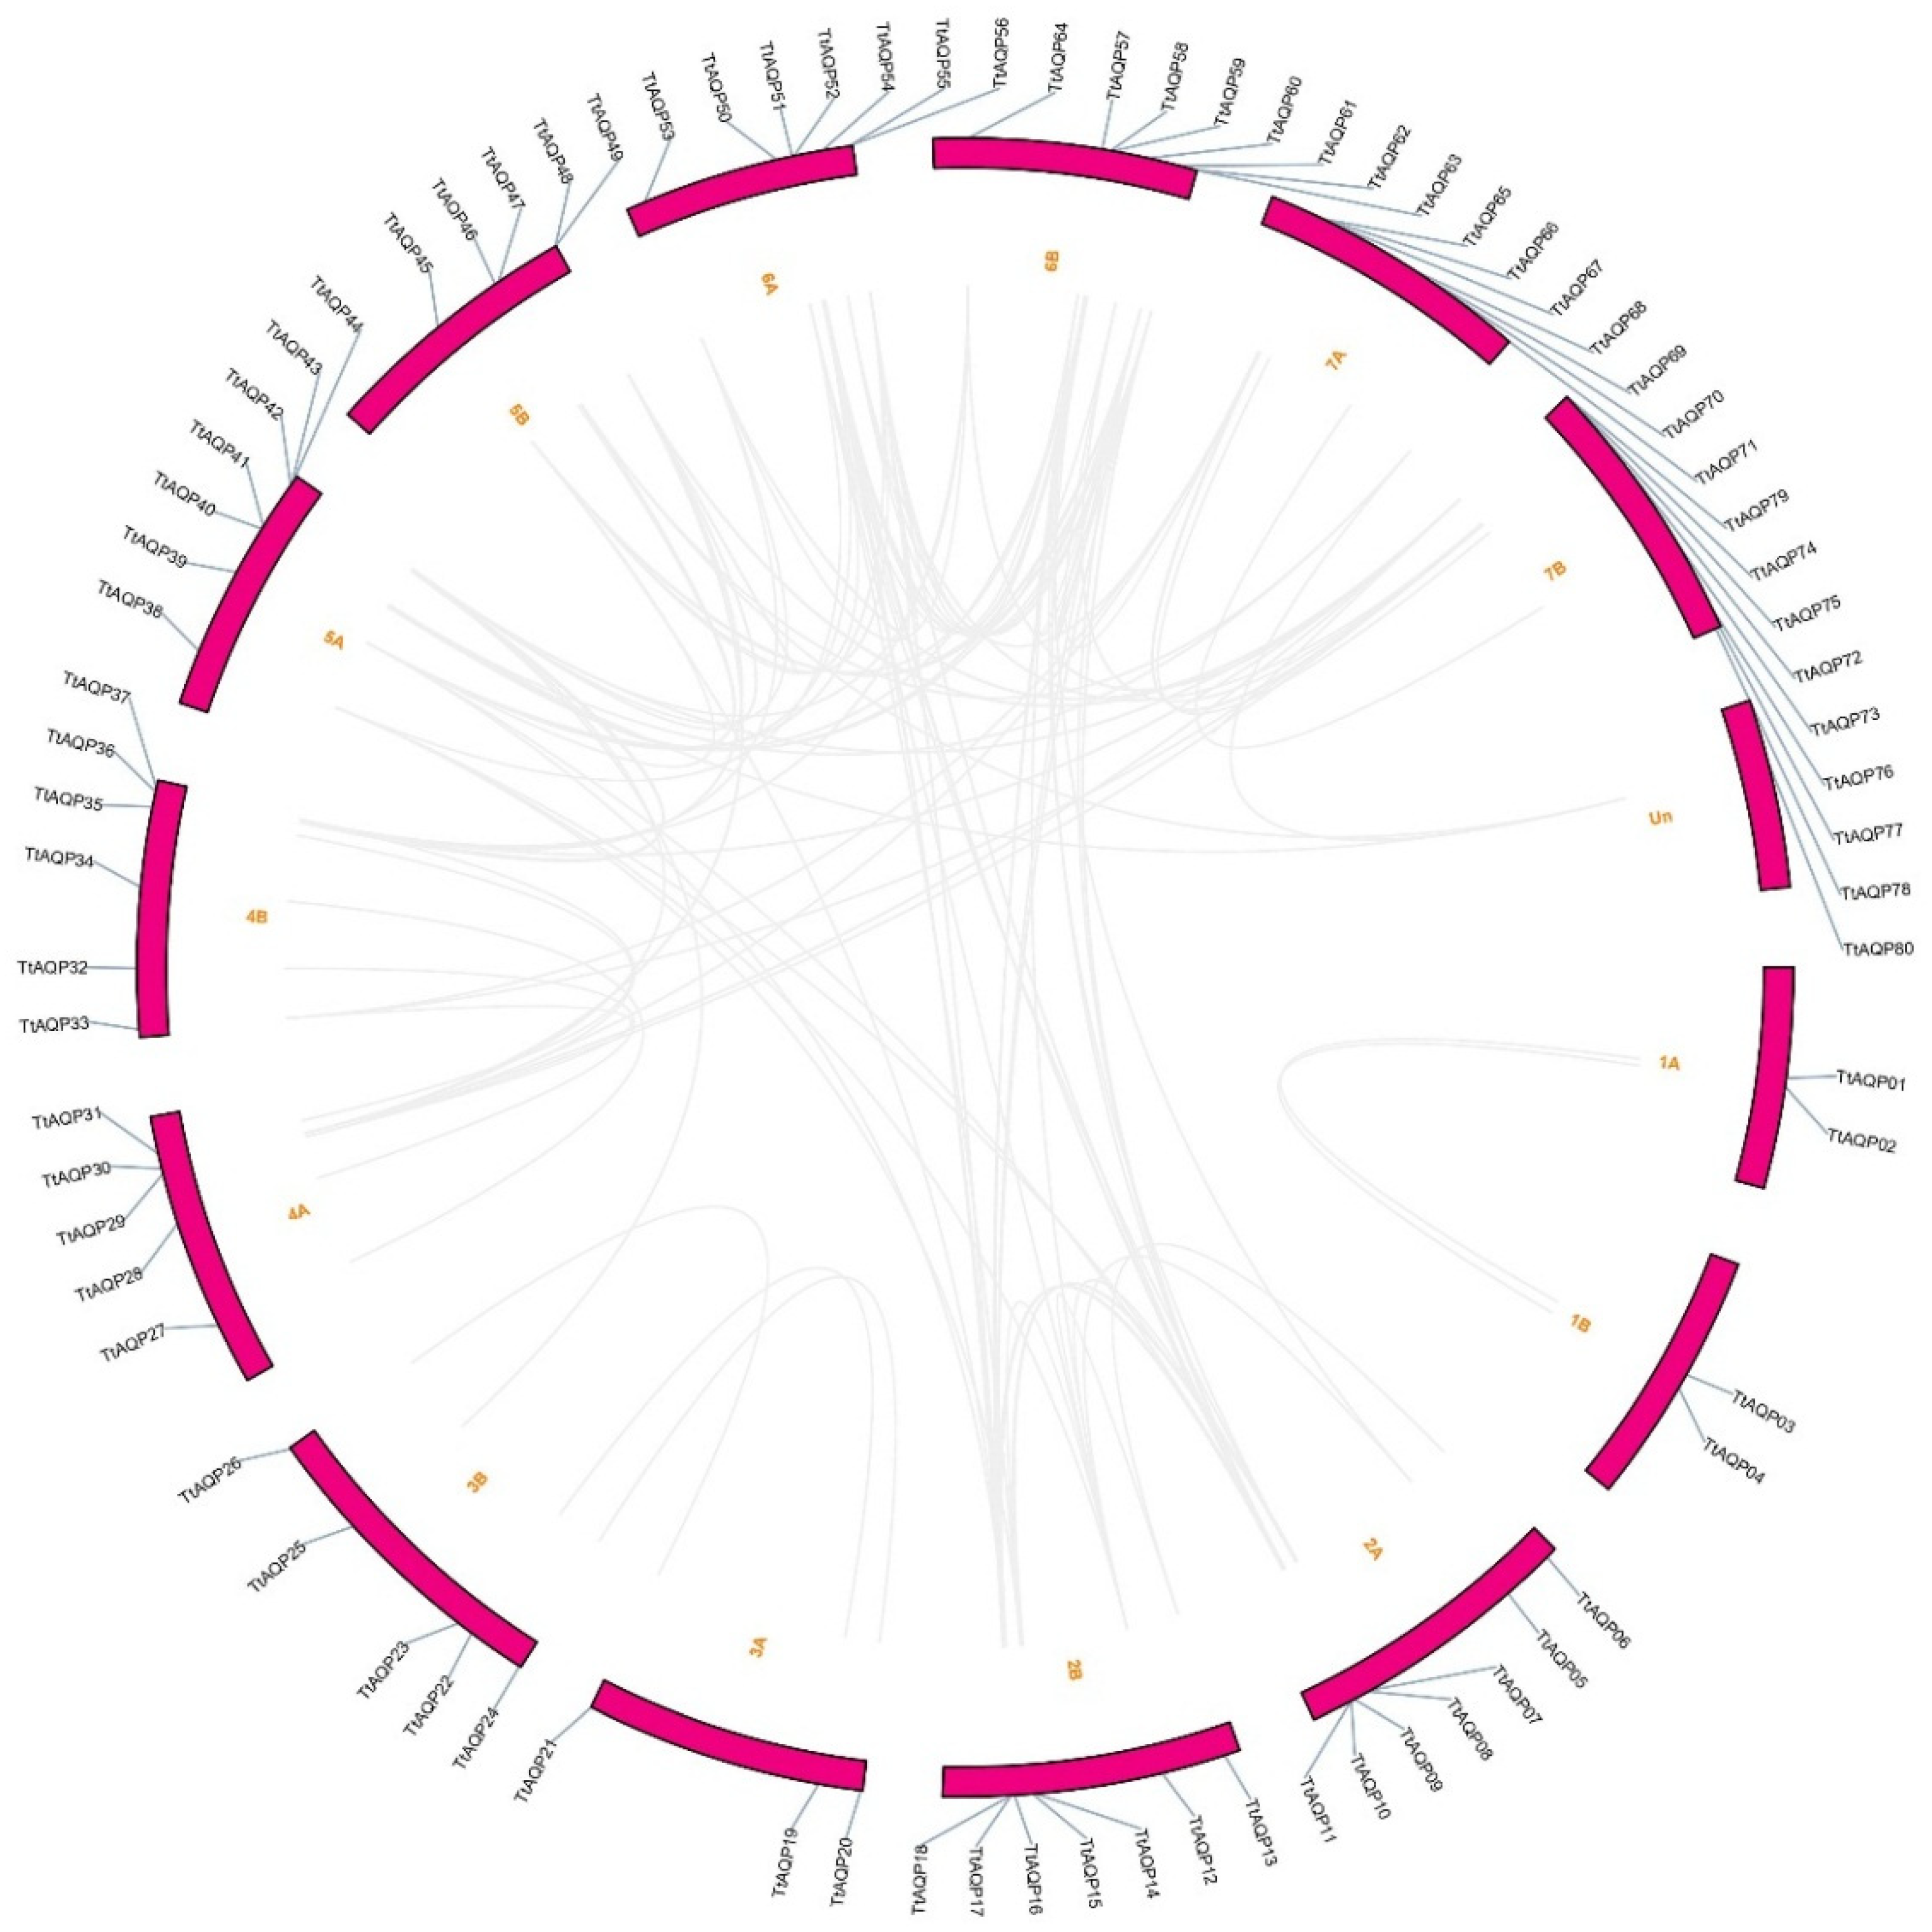
3.3. Duplication Events in TtAQPs

The genomic distribution of each TtAQP was investigated in the T. turgidum genome (Figure 3). Eighty TtAQP genes were located on 14 chromosomes and one chromosome was unknown (UN). In terms of the gene distribution on chromosomes, Chr6B and Chr7B had the highest distribution and frequency, with eight TtAQP genes on each. After these two chromosomes, Chr2A, Chr2B, Chr5A, Chr6A, and Chr7A were more abundant, with seven TtAQP genes on each. In addition, Chr1A and Chr1B, each with two genes, included the lowest number of genes. Finally, a TtAQP gene was located in unknown chromosomal positions. These results determined that TtAQPs are not uniformly distributed on T. turgidum chromosomes, and probably during the evolution and polyploidy processes, these genes increased randomly. Additionally, the investigation of the duplication process between TtAQP genes showed that many duplications occurred between members in the TtAQP family during evolution (Figure 3 and Table S3). Accordingly, 5% tandem duplication was observed for the TtAQP family (Table S3), and most duplications were of the segmental type, which indicates gene transfer and a change in the chromosome set. Additionally, based on the ka/ks ratio, the duplicated events between TtAQP family members were under purifying selection, which caused a decrease in diversity (Figure 4a). Moreover, the first duplication probably occurred around 59 million years ago between TtAQP09 and TtAQP51 (Figure 4b).

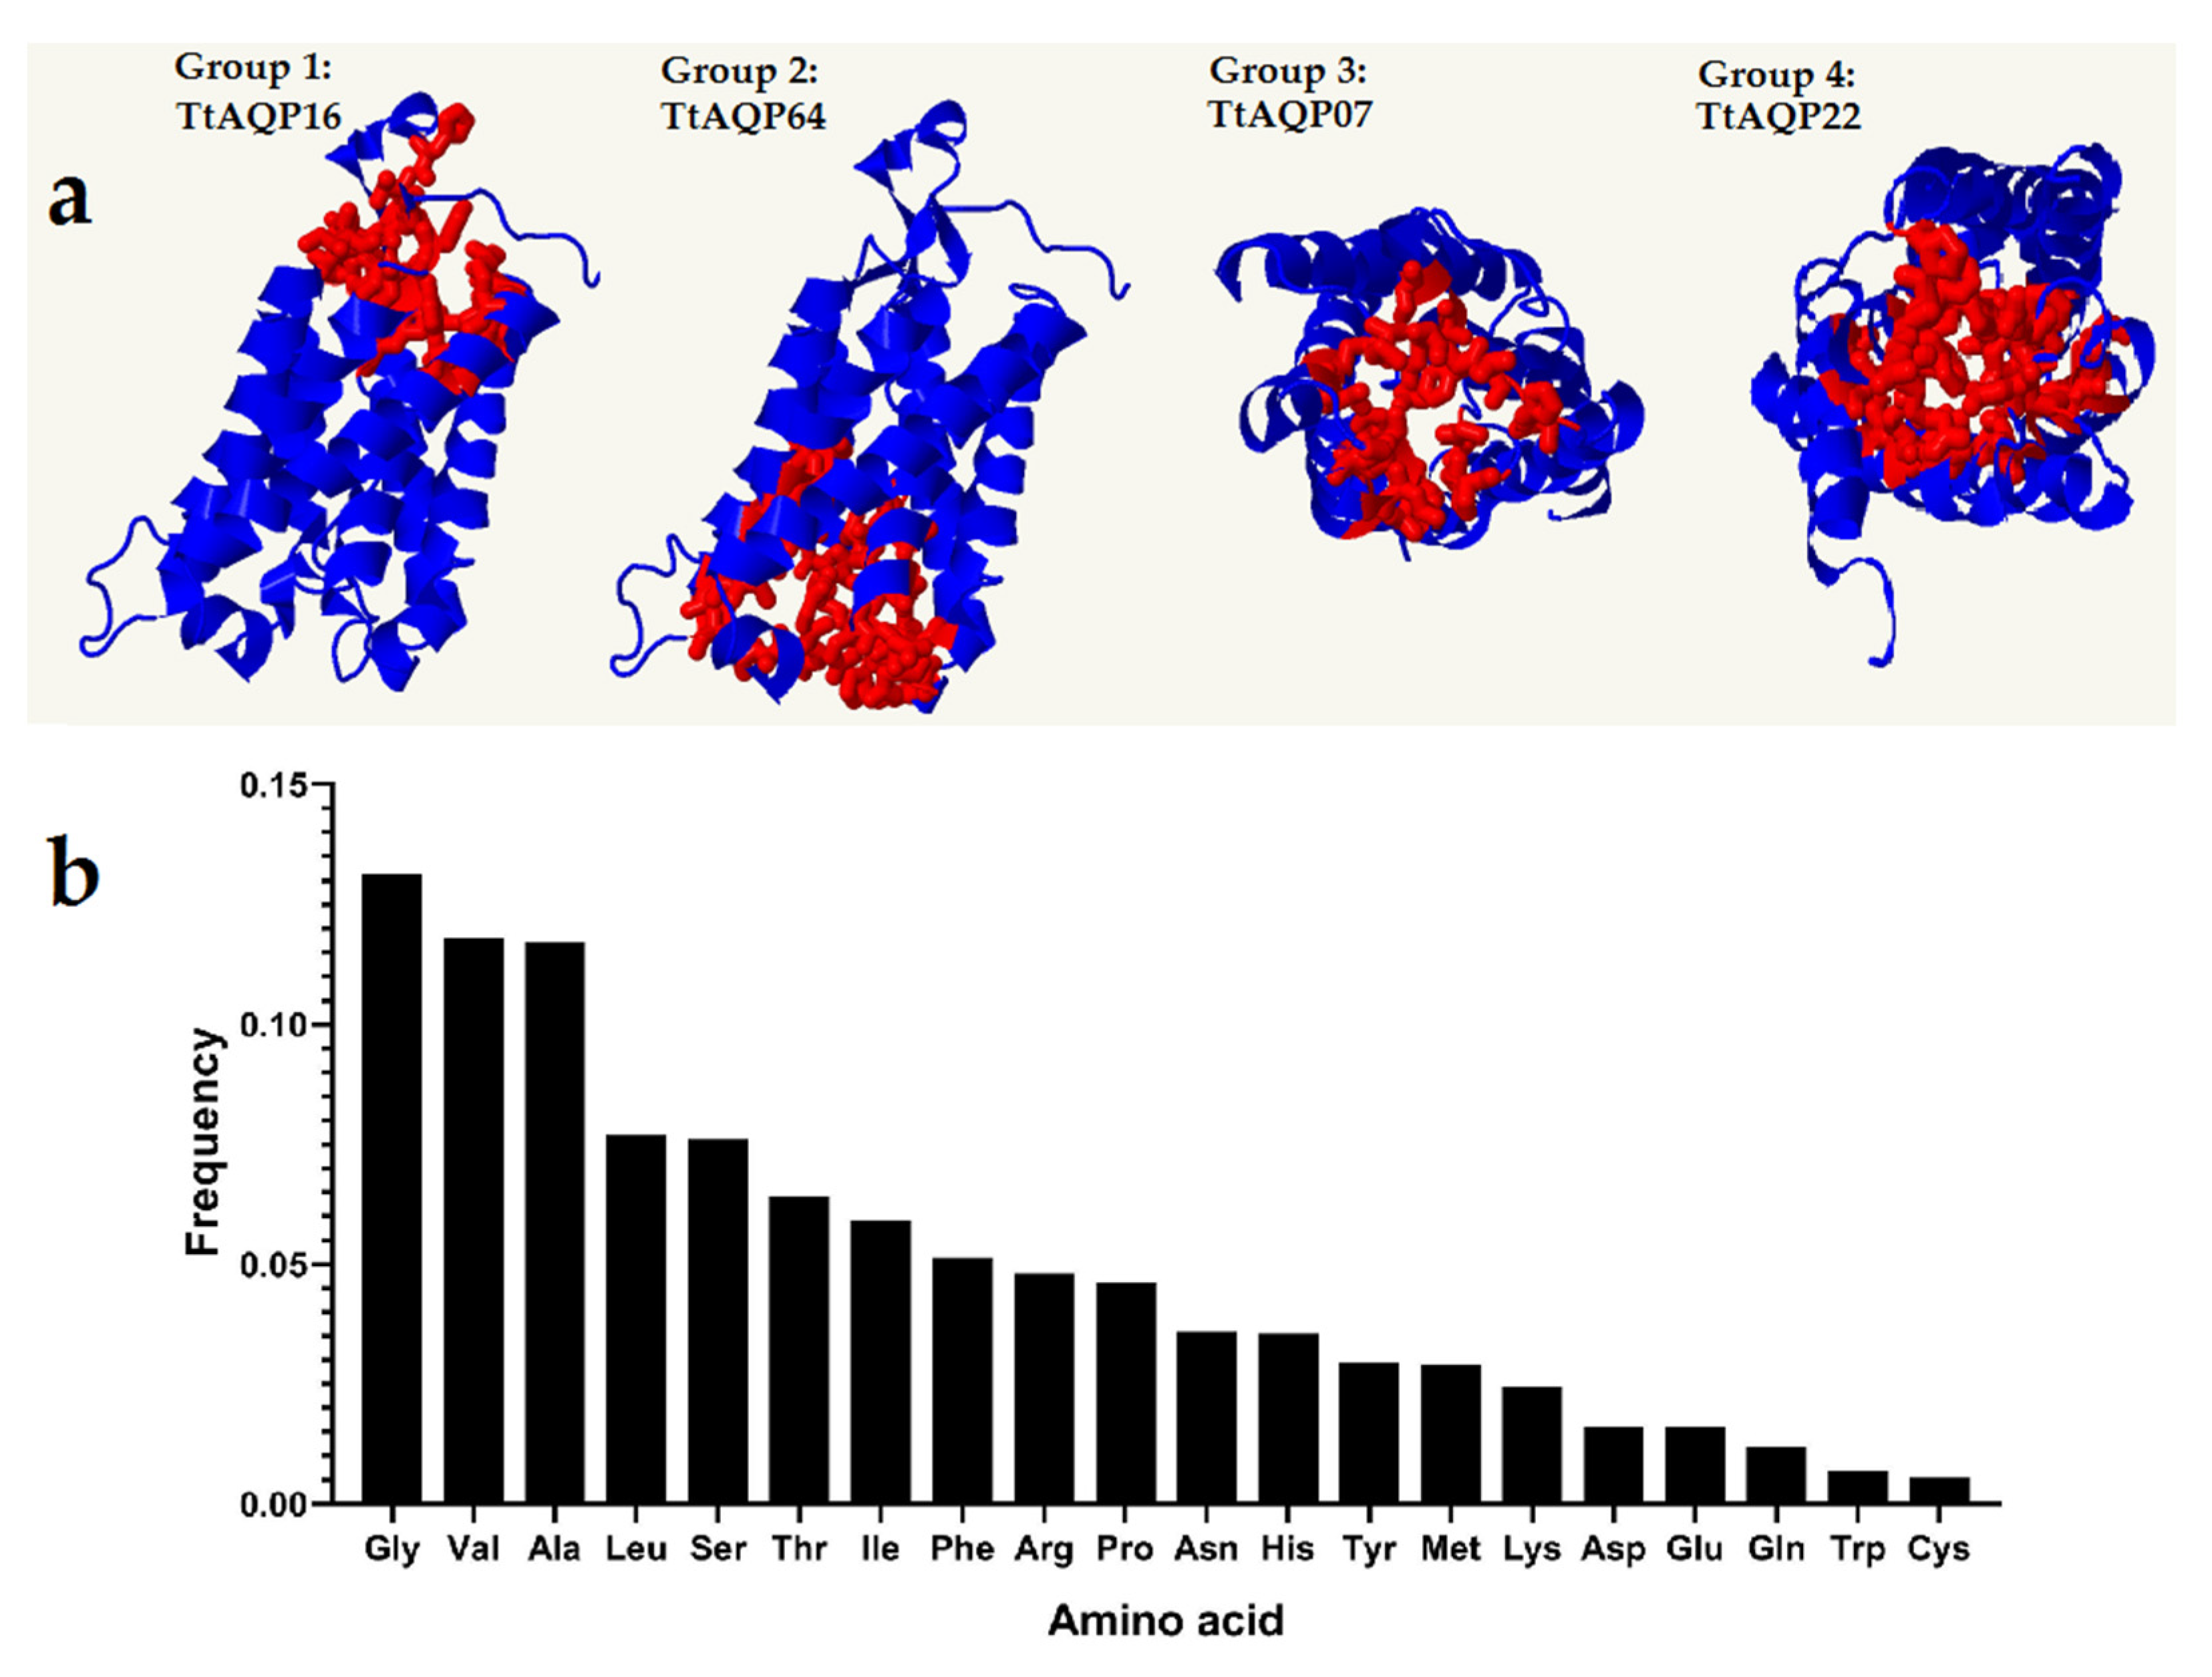
3.4. Protein Structure Analysis of TtAQPs

The prediction results of the three-dimensional structure of TtAQP proteins showed that these proteins have different interaction areas (Figure 5a). Based on their three-dimensional structure, TtAQPs from group 1 and group 2, including PIP proteins, had similar structures. However, they differed in their location and type of binding region (pocket sites) (Figure 5a,b). The abundance of amino acids in the interaction and binding regions of TtAQP proteins was also determined (Figure 5b). The amino acids, including glycine, alanine, and valine, had the highest frequency in the binding region of TtAQP proteins. These areas could be considered more in functional studies.

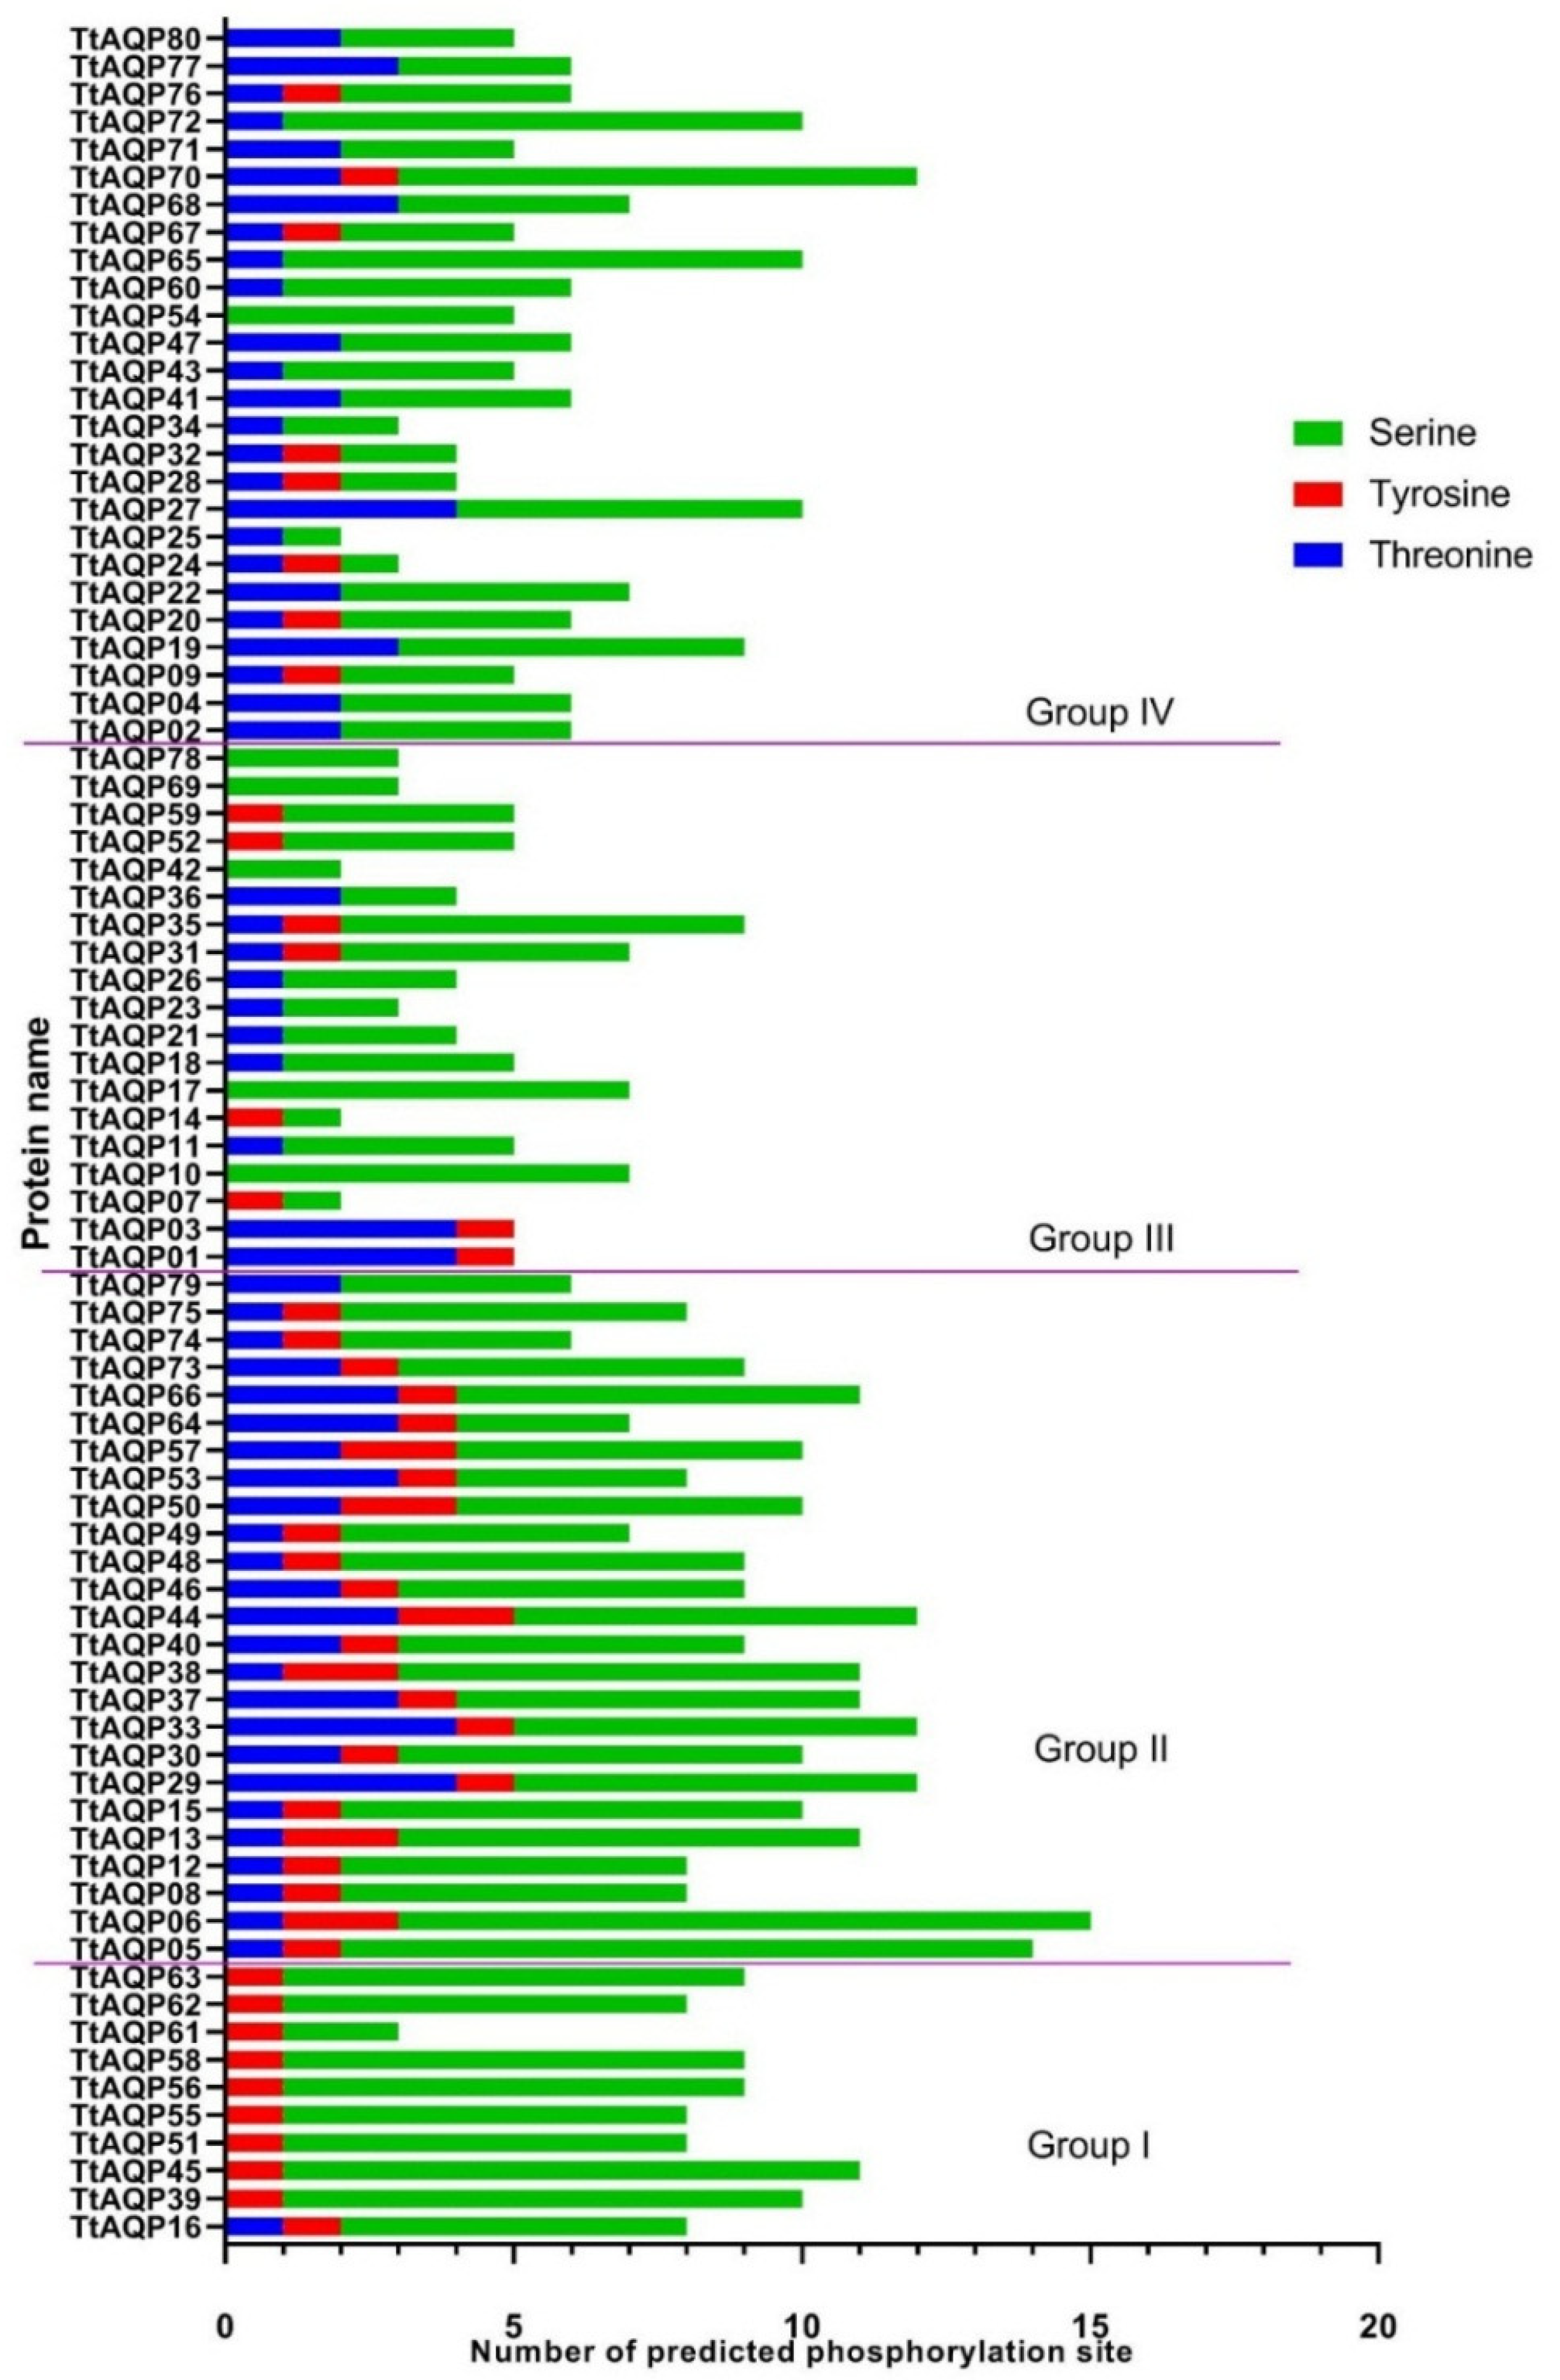
3.5. Phosphorylation Analysis of TtAQPs

The phosphorylation regions, in terms of the three amino acids serine, tyrosine, and threonine in TtAQP proteins, were predicted. According to the analysis, it was found that the amount of serine compared to tyrosine and threonine is more subjected to post-translational phosphorylation modifications (Figure 6). The number of predicted phosphorylation areas in TtAQPs from group 2 showed higher potential for phosphorylation. Phosphorylation is one of the most important post-translational modifications that affect protein function, durability, and interaction [40,41]. It seems that TtAQP proteins in the second group (PIP2 subfamily) are more involved in cell signaling pathways.

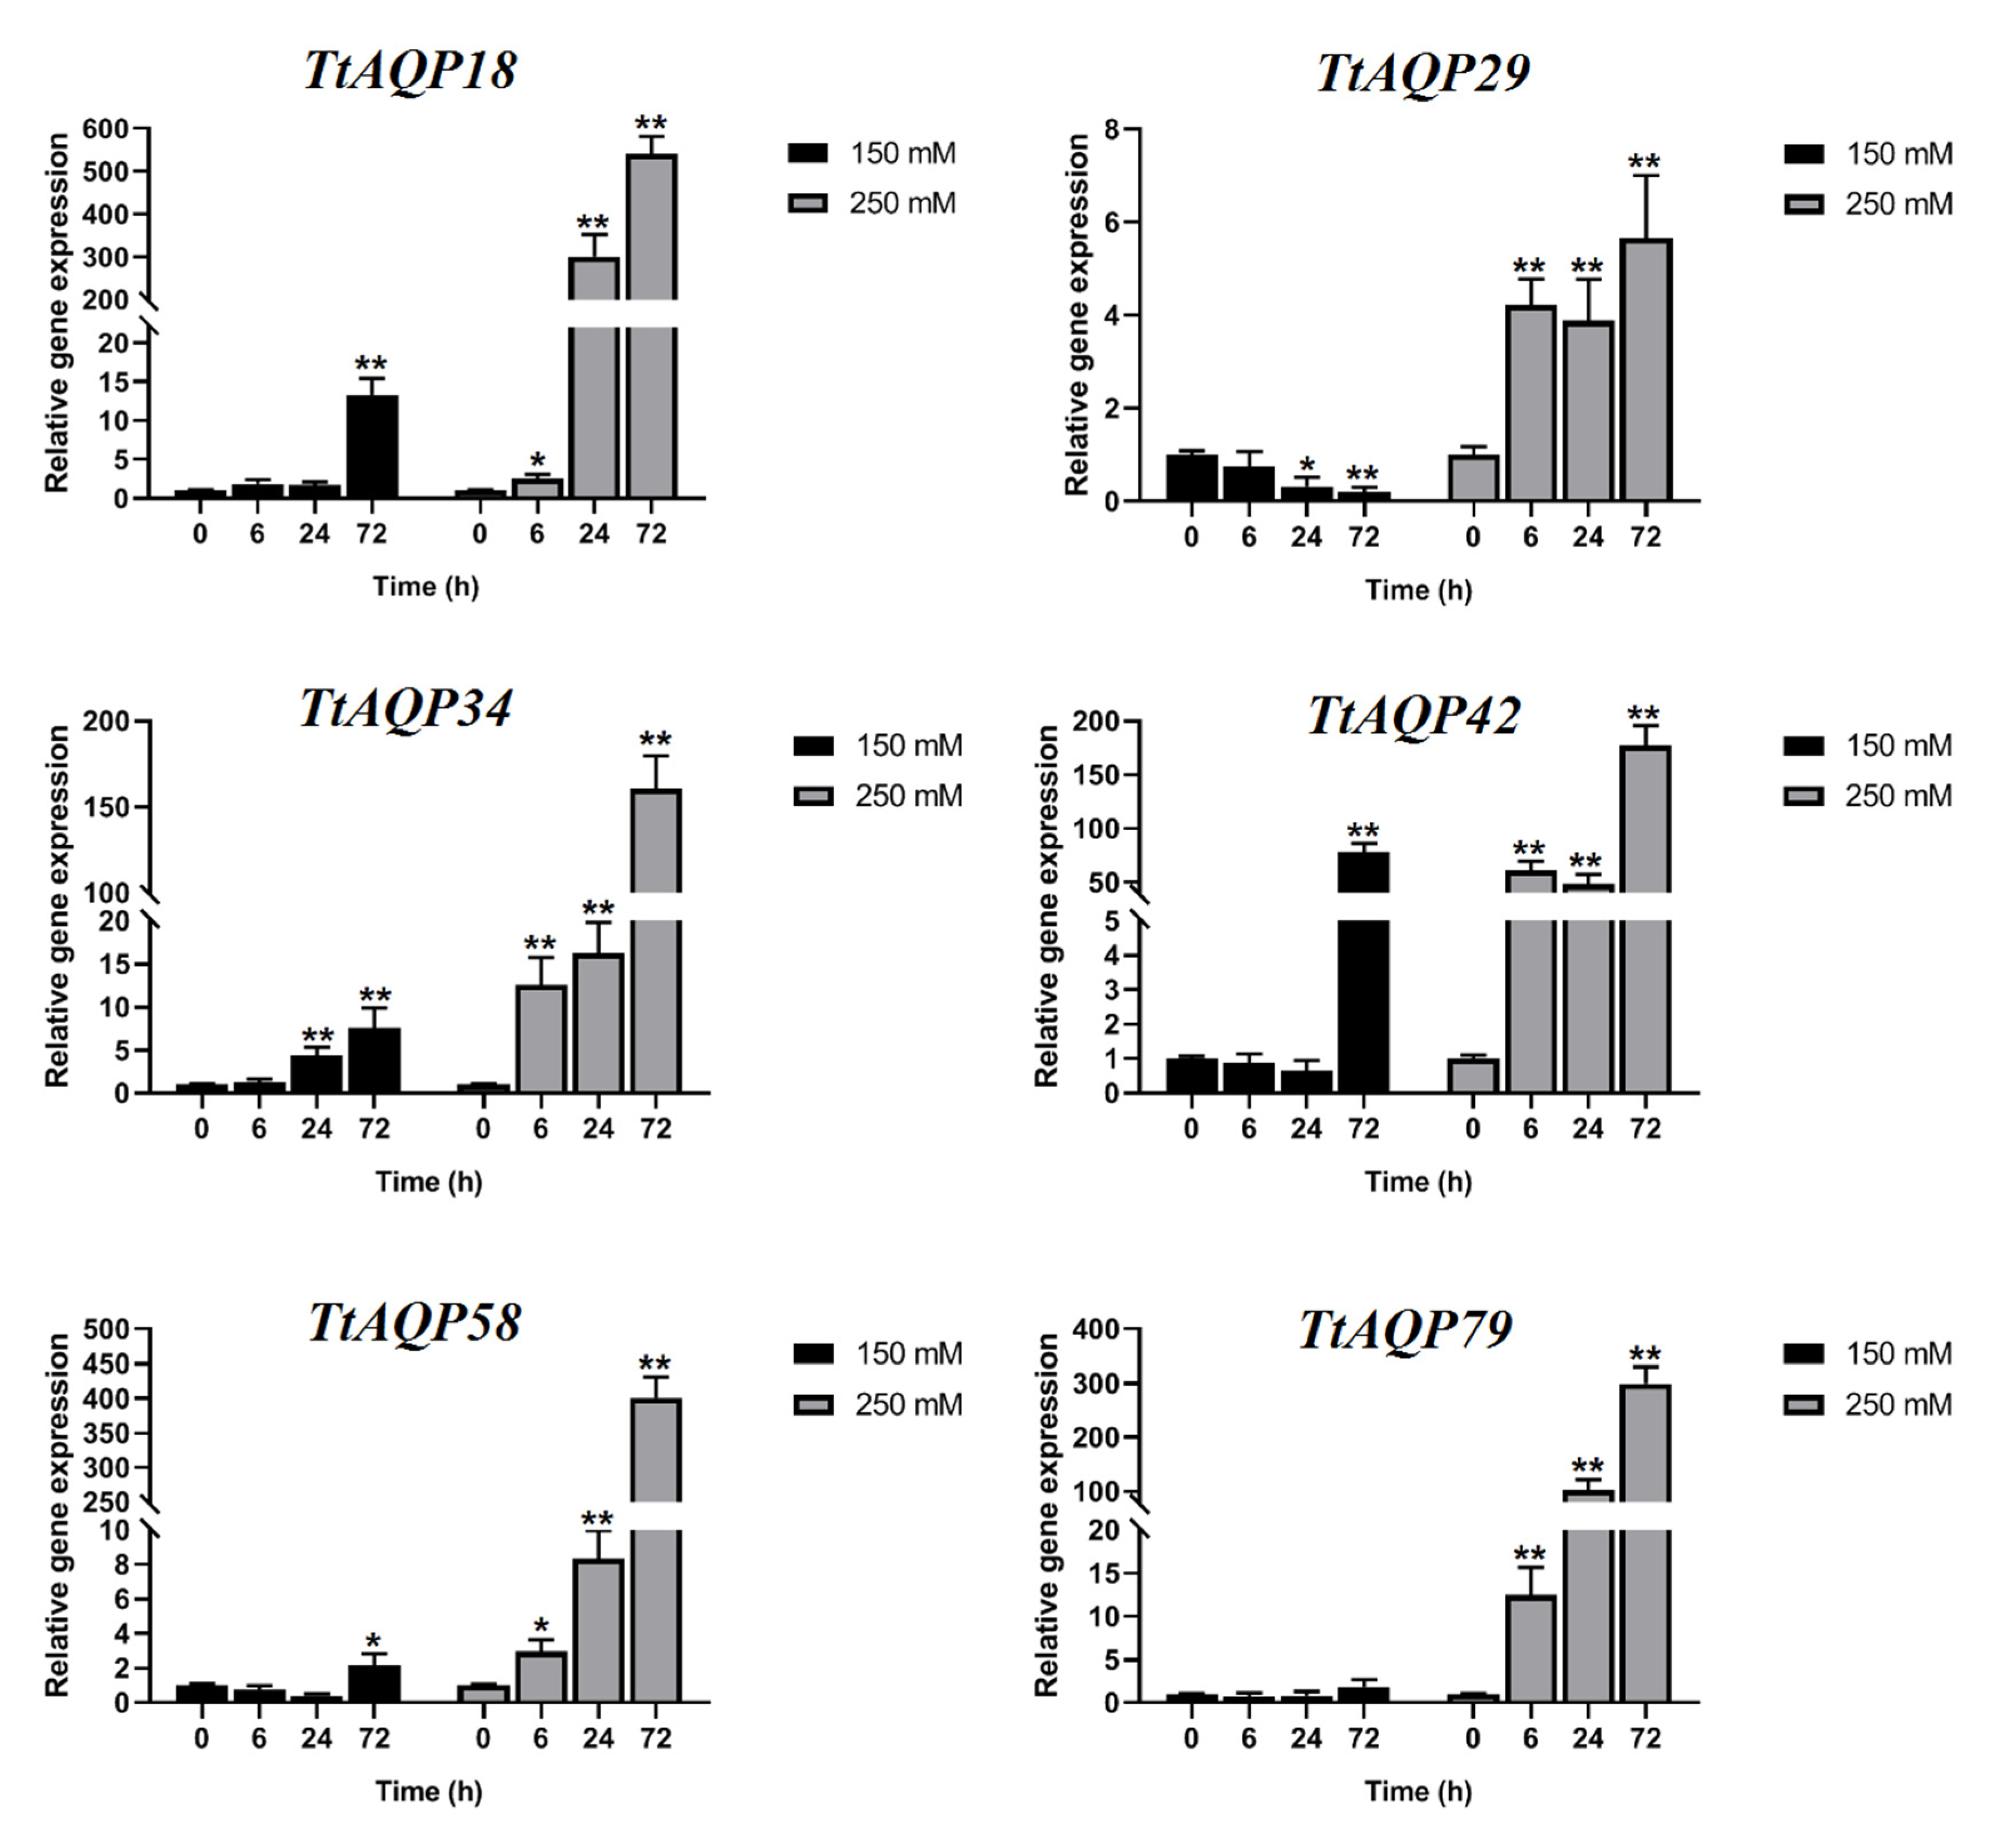
3.6. Expression Profile of TtAQPs in Response to Salinity

The expression pattern of selected genes showed that TtAQP genes have different degrees of expression in response to salt stress (Figure 7). Most of the TtAQP genes were induced by salinity. In response to 150 mM NaCl treatment, TtAQP58, as a PIP1 gene from group 1, TtAQP18 and TtAQP42, as the TIP genes from group 3, and TtAQP34, as a SIP gene from group 4, were sharply upregulated after 72 h, while two PIP2 genes from group 2, including TtAQP29 and TtAQP79, were not induced. However, TtAQP29 showed downregulation after 72 h of 150 mM NaCl. Interestingly, all selected TtAQPs were significantly upregulated in response to a high salinity concentration (250 mM of NaCl), and the highest expression levels were observed after 72h of salt stress. Overall, the expression patterns of the six selected TtAQP genes in durum wheat showed that TtAQPs are mostly involved in the group with late responses to salinity stress.

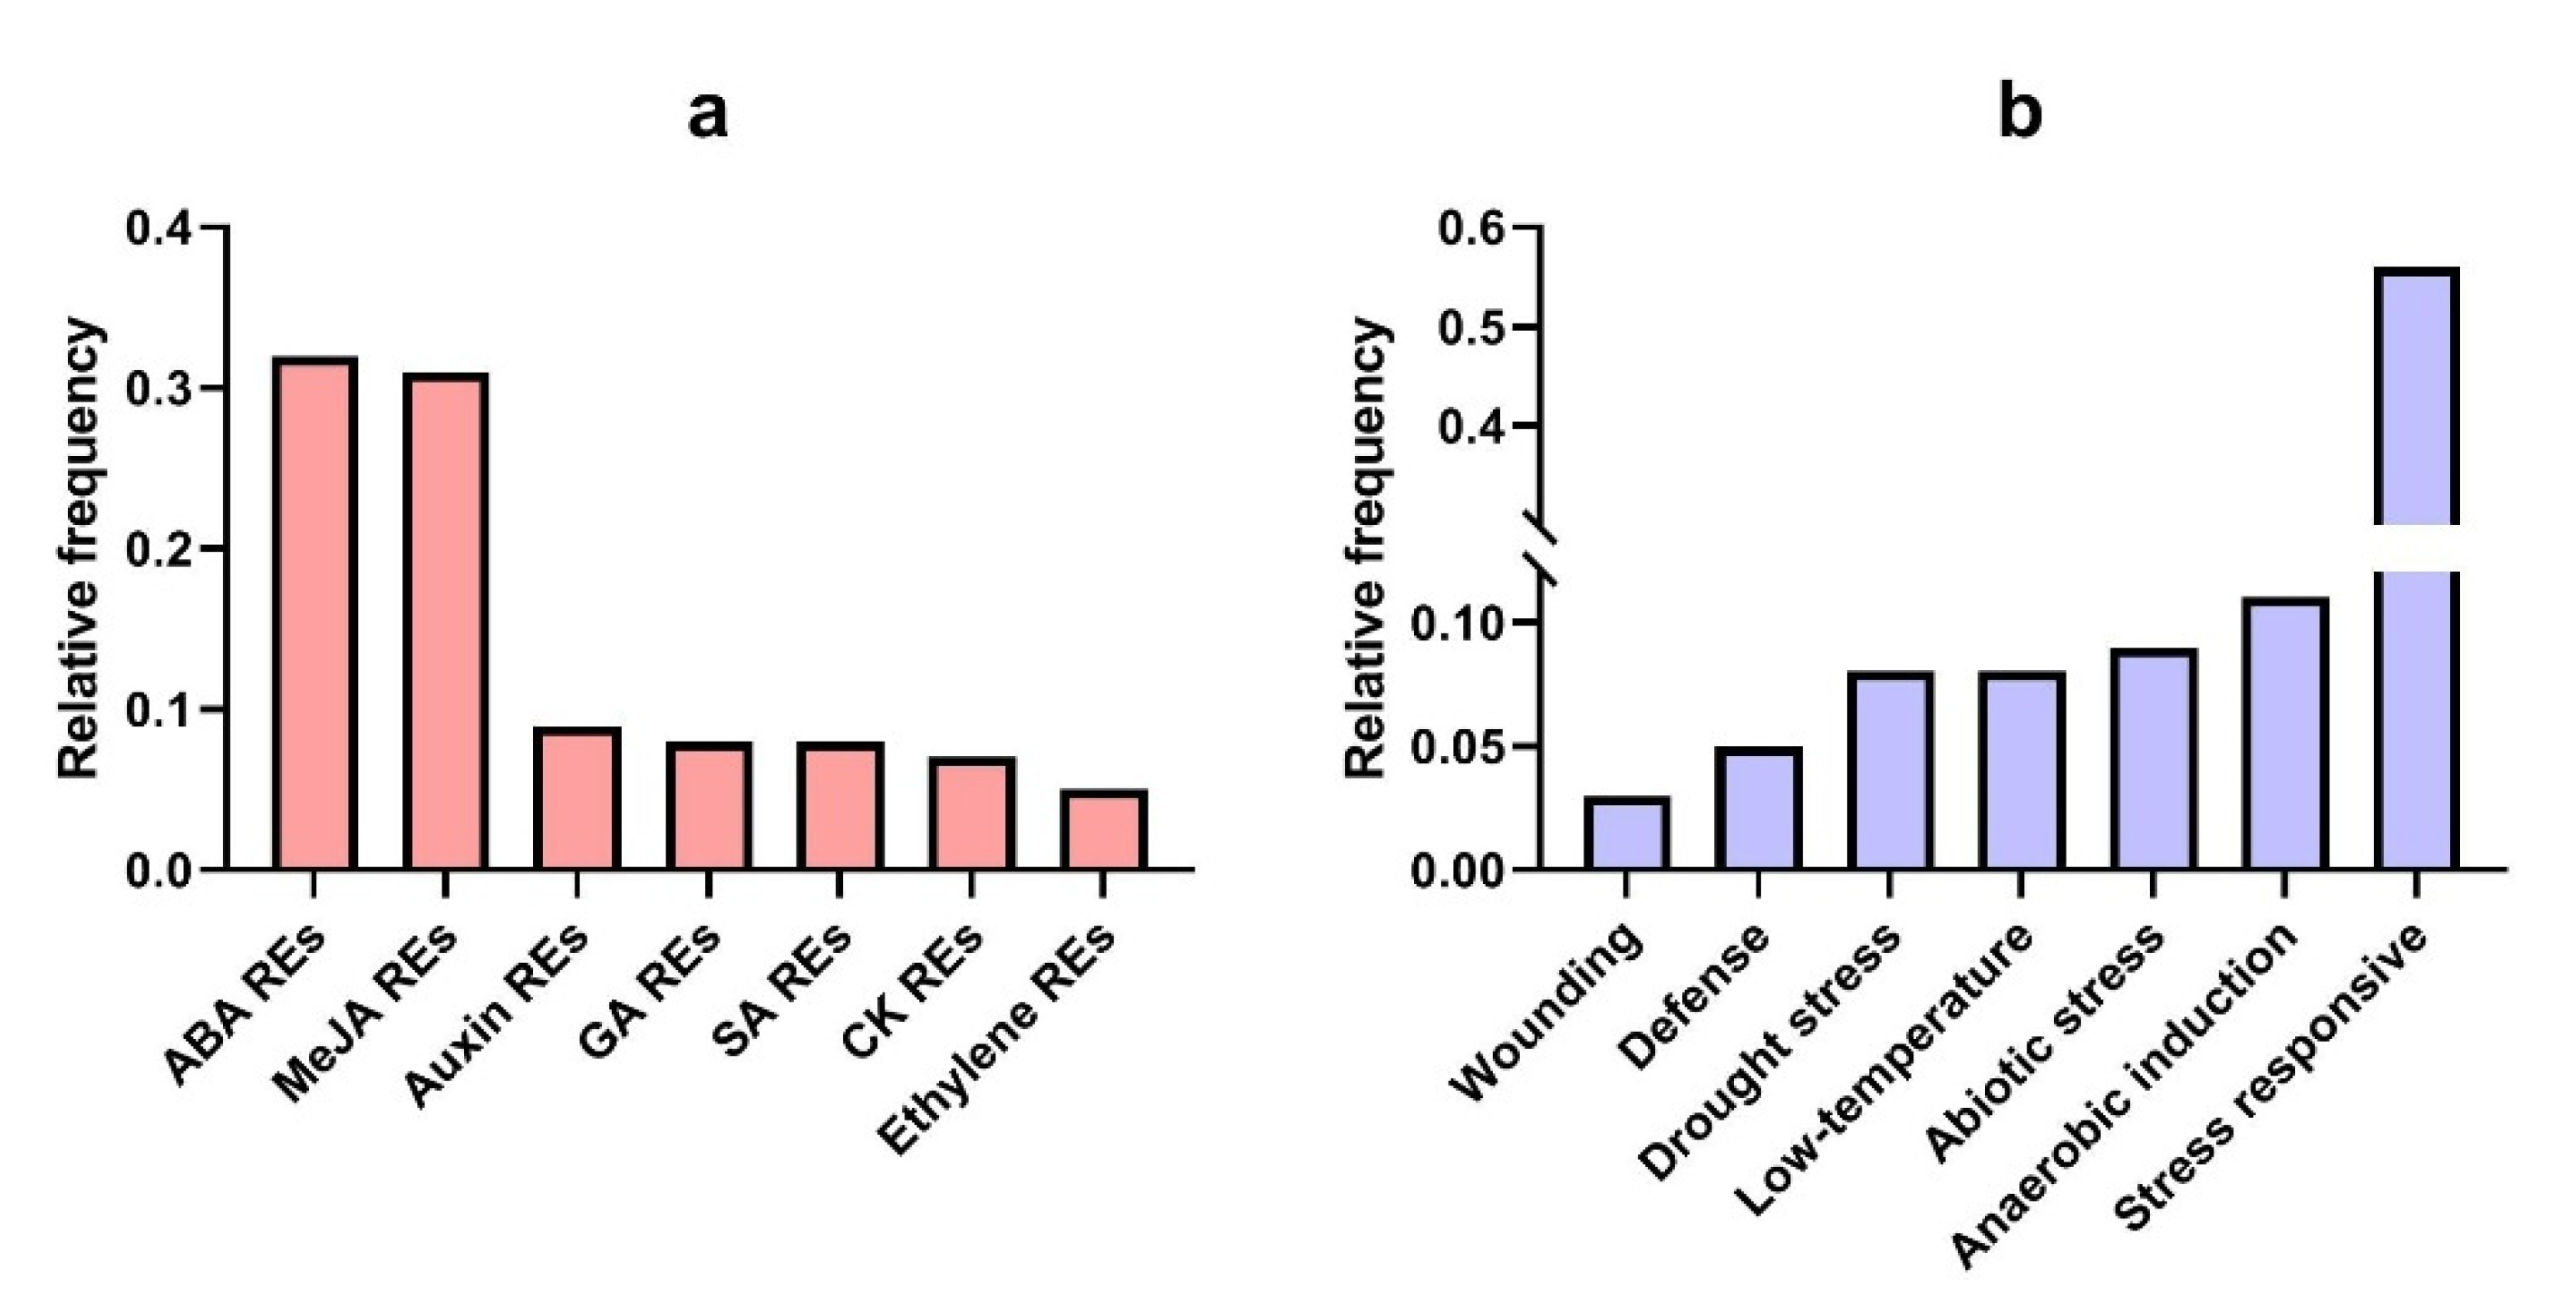
3.7. Promotor Analysis of TtAQP Genes

The promoter region of TtAQP genes was screened to identify the putative cis-regulatory elements. The results disclose that important key regions involved in response to biotic and abiotic stresses, as well as phytohormones, are located in the upstream region of TtAQP genes (Figure 8). Moreover, it was found that MYB elements, which are involved in the response to stresses, had the highest frequency in the promoter of TtAQP genes (Table S4). Then, CAT-box elements—which are dependent on meristem expression, and ABRE elements, which are regulatory elements involved in response to abscisic acid (ABA)—had the highest frequency in the promoter site of TtAQP genes. In addition, MRE elements, which are present in the MYB binding site and play a role in response to light, had the lowest frequency in the promoter site of TtAQP genes. Following that, the WUN-motif, which is an element involved in the response to abiotic stresses, and AuxRR-core, which is involved in the response to auxin, had the lowest frequency in the promoter site of TtAQP genes. In general, the identified regulatory elements can be classified into four groups, including hormone-responsive, stress, light, and growth elements. The highest of regulatory elements upstream of TtAQPs was predicted in the field of stress and hormone-related functions. The presence of these important regulatory elements in the promoter sites indicates that TtAQP genes are involved in the response of plants to stress conditions. Overall, TtAQP genes showed high potential to participate in various cellular processes, so it is recommended that focus be placed on this gene family in molecular works related to durum wheat breeding.

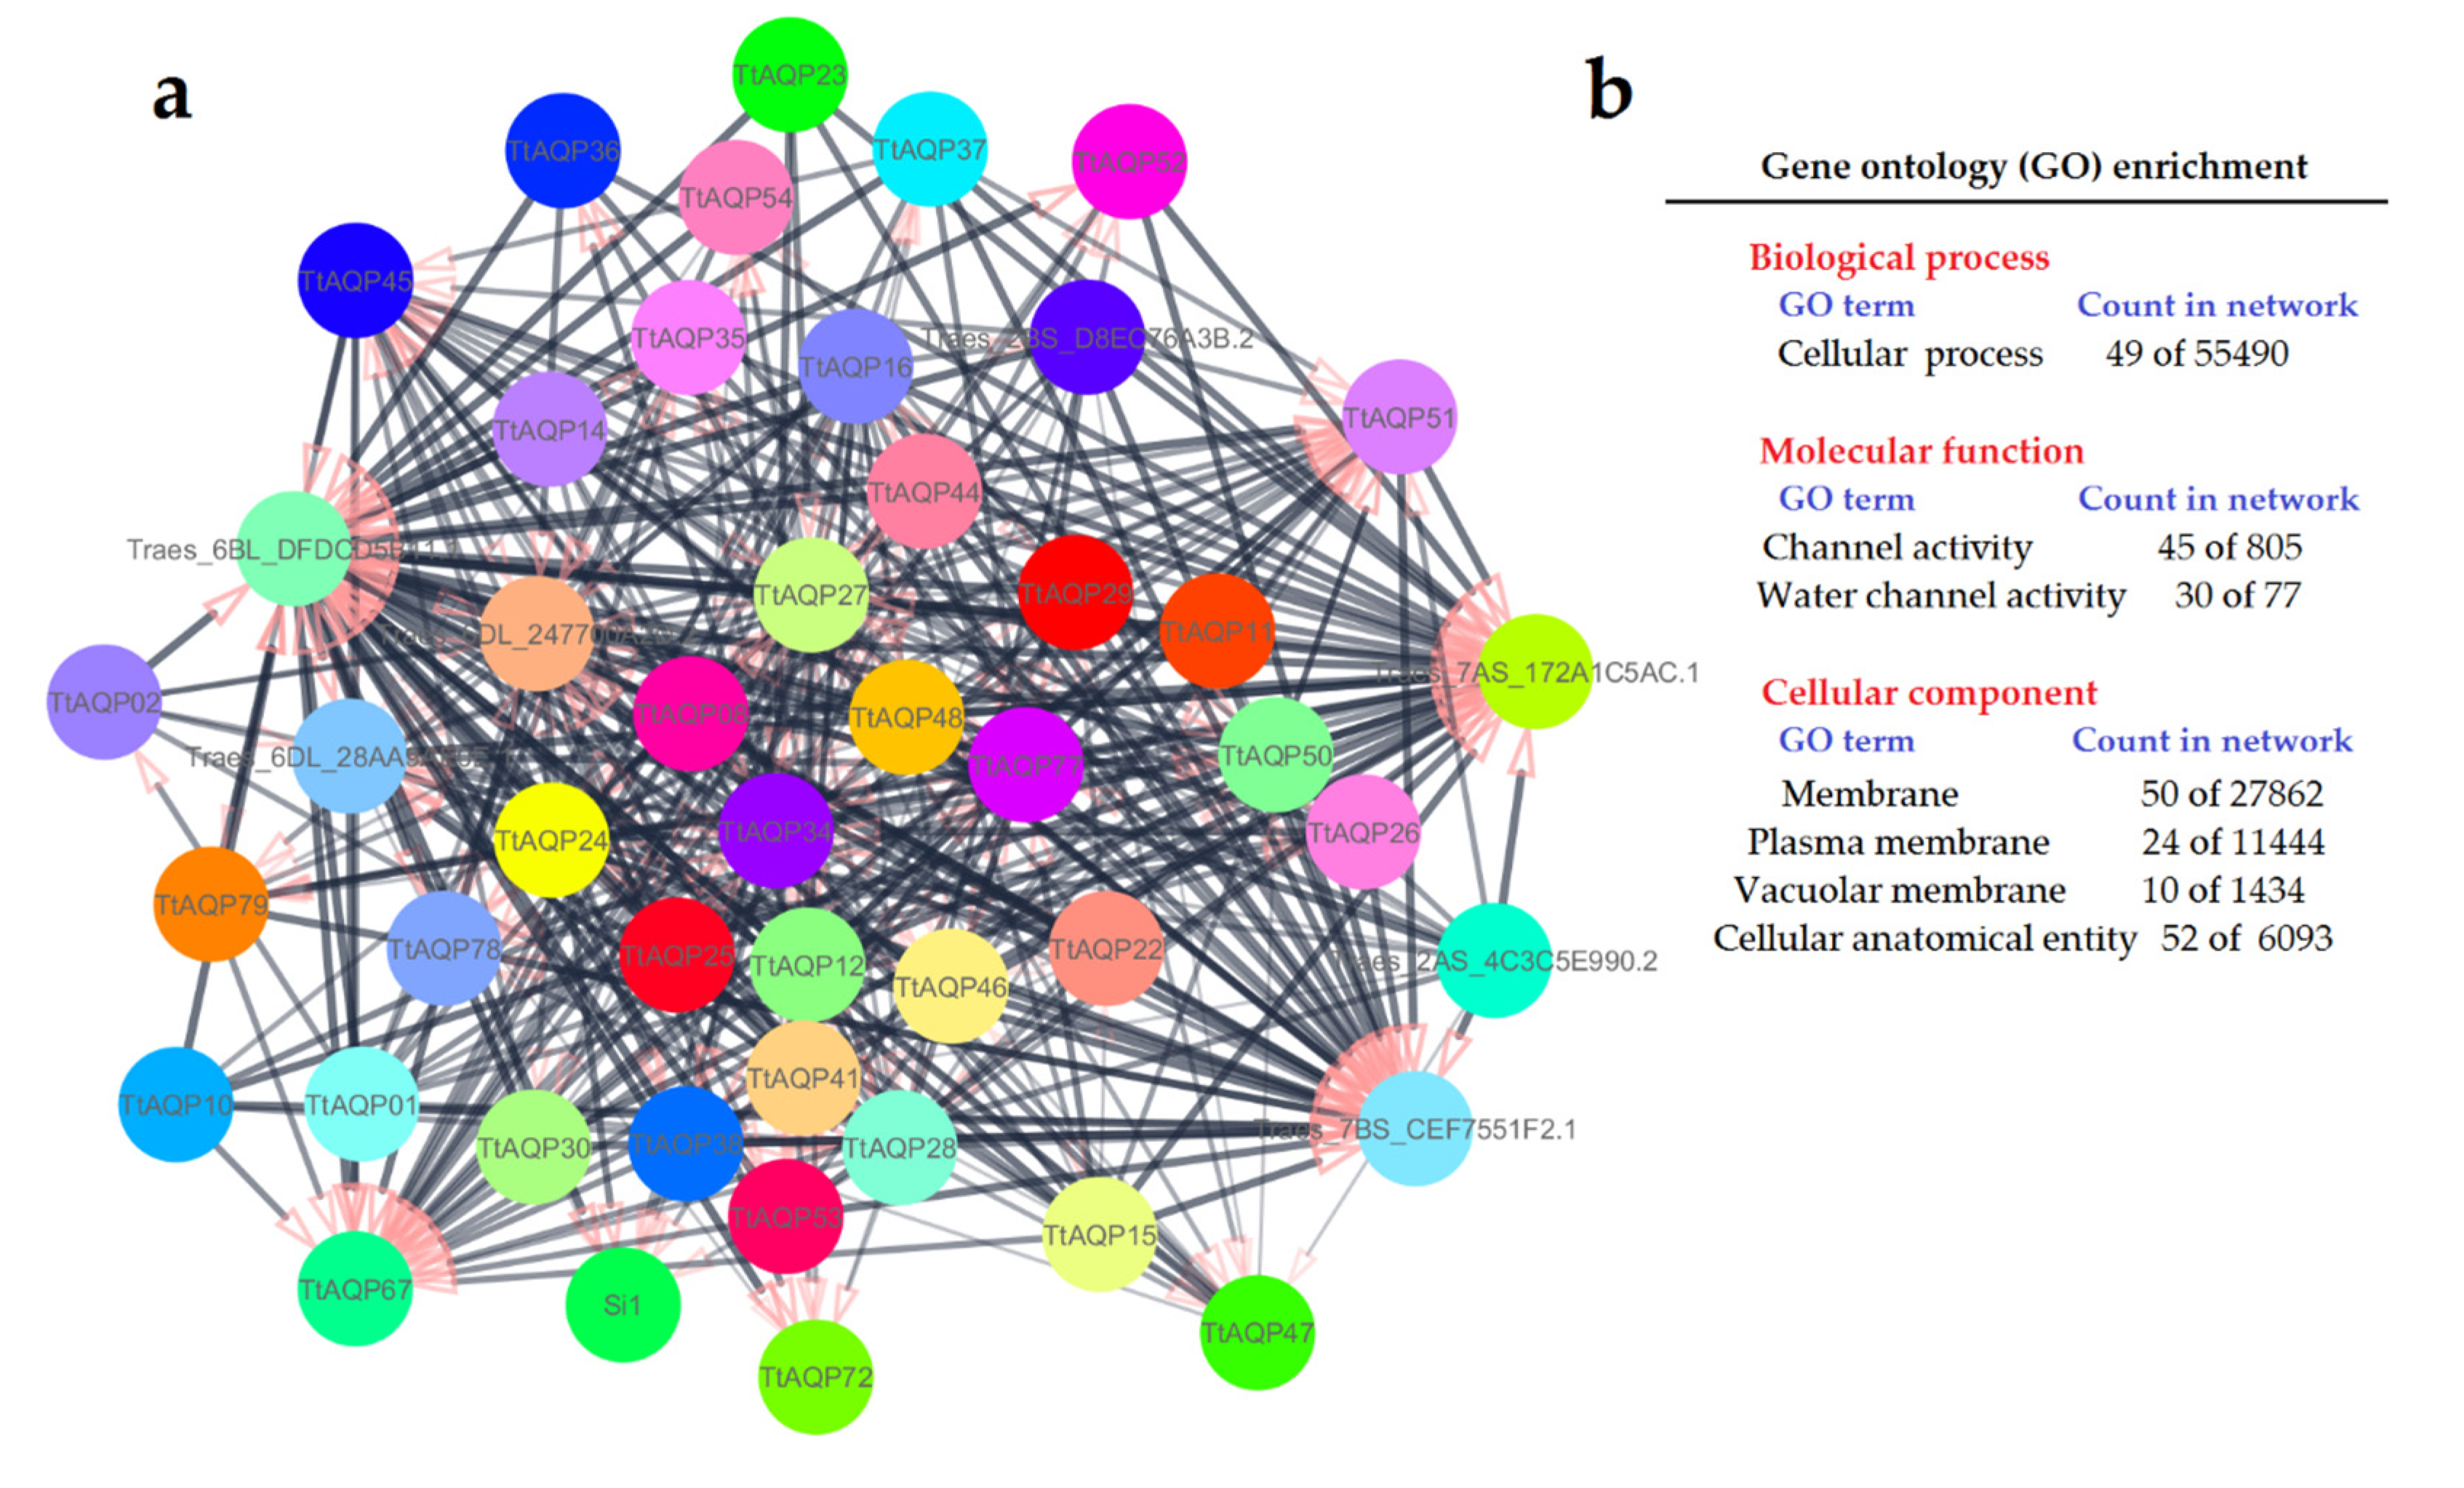
3.8. Protein–Protein Interaction of TtAQPs

The interaction network of TtAQPs was constructed based on their orthologues in T. aestivum using the STRING database (Figure 9a). According to the predicted network, two PIP1 proteins (TtAQP51 and TtAQP45), two SIP proteins (TtAQP27 and TtAQP34), and two NIP proteins (TtAQP67 and TtAQP47) showed high interaction with other elements in the network (Figure 9a). Moreover, all proteins present in the network were analyzed to identify the significant (FDR < 0.001) gene ontology (GO) terms (Figure 9b). The cellular process in biological process terms, and channel activity and water channel activity in molecular function terms, were significantly enriched. The cellular component GO terms, including the membrane, plasma membrane, vacuolar membrane, and cellular anatomical entity, were significantly enriched. These results reveal that TtAQPs are located in cell membranes and vacuoles and are more involved in the process of transferring water and ions. These results suggest that AQPs interact more with each other, which probably affects their activity levels.

4. Discussion

The role of AQPs in regulating cell homeostasis by controlling the flow of water and some ions in the cell membrane is well known [1]. The function of AQP family members has been studied in several plants, although the structure, evolutionary process, and function of this gene family have not been investigated in T. turgidum, so far. In the present study, 80 putative TtAQP genes were identified and characterized in the genome of T. turgidum, as in the first report. Based on previous studies, the number of AQP family members has been variable. For example, 32 AQPs were identified in Physic nut [42], 35 in Arabidopsis [43], 41 in potato [44], 26 in bamboo [45], 45 in cassava [46], 71 in cotton [47], 67 in Brassica oleracea [48], and 51 in flax [49]. The number of AQPs was higher in T. turgidum; there is a hypothesis that this gene family is more affected by polyploidy and duplication events under the evolution process [50,51]. Additionally, a large number of segmental duplications was observed between TtAQP family members, indicating that segmental duplication has been the main factor responsible for expansion in the TtAQP family under evolution. However, we know that T. turgidum underwent an allopolyploid event, which led to extension of the homolog genes in the wheat genome. Moreover, according to the Ka/Ks index, the duplicated members of TtAQPs have been under negative selection; as a result, the functional diversity among TtAQPs has decreased. The exon/intron number was varied between TtAQP subfamilies, suggesting that each subfamily has had a different evolutionary process and each AQP subfamily was created before the derivation of monocotyledonous and dicotyledonous plants [52]. Furthermore, it has been reported that the intron/exon number can affect gene expression in plant species [51]. According to our phylogenetic analysis, AQP proteins were separated into four main groups, and the subfamilies PIP1 and PIP2 showed more genetic distance than the subfamilies TIP, SIP, and NIP. Previously, it was reported that the NIP subfamily originated from the bacterial genome [53,54]. It seems that this gene family has been subjected to evolutionary pressure and extended via duplication, polyploidy, and horizontal transmission.
Post-translational modifications tightly regulate the activity of aquaporin [55]. In the current study, the PIP2 subfamily proteins showed a high potential for phosphorylation events. PIP2 proteins have higher water channel efficiency than PIP1 proteins [56]. It is hypothesized that phosphorylation affects the channel activity of this subfamily. Phosphorylation is one of the most important post-translational modifications and affects protein function, durability, and interaction [50,57]. Additionally, previous studies revealed that the channel opening of AQPs is influenced by phosphorylation at its C terminal sites [14,58,59]. In addition, it was stated that ethylene can regulate the C terminal phosphorylation of Arabidopsis PIP2;1 (AtPIP2;1) [60]. Moreover, abiotic stresses such as salinity affect the phosphorylation of AtPIP2;1 [61]. Identifying more potential phosphorylation sites in TtAQP proteins could suggest that this subfamily has more channel activity and is more affected by upstream signaling pathways related to phosphorylation events.
The candidate TtAQP genes showed diverse expression patterns in response to salinity. In 150 mM NaCl conditions, candidate genes from the PIP2 subfamily showed downregulation, unlike the other selected genes from the PIP1, TIP, and SIP subfamilies. However, with increasing salinity concentration and duration of treatment, all TtAQPs were induced, and they showed the highest expression levels. Our results disclose that TtAQPs are a part of durum wheat responses to salt stress. The TIP and PIP subfamilies, which are more studied than others [15], are mostly downregulated in response to abiotic stresses such as drought and salt stress [1,16,17]. Additionally, two PIP genes in durum wheat, TdPIP1;1 and TdPIP2;1, were identified as being involved in the response to abiotic stresses [62]. In addition, the overexpression of TdPIP1;1 and TdPIP2;1 could improve drought and salt tolerance in durum wheat [63]. We speculated that TtAQPs are involved in the group of durum wheat with late responses to salinity stress.

5. Conclusions

In the present study, 80 putative TtAQP genes from the genome of T. turgidum were characterized. The results disclosed that subfamilies of TtAQP, including PIP1, PIP2, TIP, NIP, and SIP, have high genetic distances relative to each other. Furthermore, it was found that segmental duplications have played a major role in the extension of the TtAQP family. In addition, we predicted that PIP2 subfamily members have more potential to be influenced by phosphorylation modification and they are probably involved in signaling pathways related to kinases. According to their expression profiles, we conclude that TtAQPs are associated with late responses to salt stress. Overall, we conclude that TtAQPs are diverse proteins, based on their structure, regulatory systems, and expression. The results of this research can be used in further studies related to salt tolerance in durum wheat.

Supplementary Materials

The following supporting information can be downloaded at: https://www.mdpi.com/article/10.3390/genes14010202/s1, Table S1: List of TtAQP gene primers used in real-time PCR; Table S2: Accession number and physicochemical properties of TtAQP gene family members in T. turgidum; Table S3: List of the duplicated gene pairs in the TtAQP gene family; Table S4: Functional category of the putative cis-regulatory elements in TtAQP promoter.

Author Contributions

Conceptualization, P.H.; methodology, M.Y. and P.H.; software, M.Y. and P.H.; validation, P.H.; formal analysis, M.Y.; investigation, P.H.; writing—original draft preparation, M.Y. and P.H.; writing—review and editing, P.H. All authors have read and agreed to the published version of the manuscript.

Funding

This research received no external funding.

Institutional Review Board Statement

Not applicable.

Informed Consent Statement

Not applicable.

Data Availability Statement

Not applicable.

Conflicts of Interest

The authors declare no conflict of interest.

References

  1. Afzal, Z.; Howton, T.C.; Sun, Y.; Mukhtar, M.S. The roles of aquaporins in plant stress responses. J. Dev. Biol. 2016, 4, 9. [Google Scholar] [CrossRef] [PubMed] [Green Version]
  2. Maurel, C.; Boursiac, Y.; Luu, D.-T.; Santoni, V.; Shahzad, Z.; Verdoucq, L. Aquaporins in plants. Physiol. Rev. 2015, 95, 1321–1358. [Google Scholar] [CrossRef] [PubMed]
  3. Kruse, E.; Uehlein, N.; Kaldenhoff, R. The aquaporins. Genome Biol. 2006, 7, 1–6. [Google Scholar] [CrossRef] [PubMed] [Green Version]
  4. Nordzieke, D.E.; Medraño-Fernandez, I. The plasma membrane: A platform for intra-and intercellular redox signaling. Antioxidants 2018, 7, 168. [Google Scholar] [CrossRef] [PubMed] [Green Version]
  5. Zhu, Y.-X.; Yang, L.; Liu, N.; Yang, J.; Zhou, X.-K.; Xia, Y.-C.; He, Y.; He, Y.-Q.; Gong, H.-J.; Ma, D.-F. Genome-wide identification, structure characterization, and expression pattern profiling of aquaporin gene family in cucumber. BMC Plant Biol. 2019, 19, 1–23. [Google Scholar] [CrossRef] [Green Version]
  6. Maurel, C.; Chrispeels, M.J. Aquaporins. A molecular entry into plant water relations. Plant Physiol. 2001, 125, 135–138. [Google Scholar] [CrossRef] [Green Version]
  7. Hachez, C.; Zelazny, E.; Chaumont, F. Modulating the expression of aquaporin genes in planta: A key to understand their physiological functions? Biochim. Biophys. Acta (BBA)-Biomembr. 2006, 1758, 1142–1156. [Google Scholar] [CrossRef] [Green Version]
  8. Hu, W.; Yuan, Q.; Wang, Y.; Cai, R.; Deng, X.; Wang, J.; Zhou, S.; Chen, M.; Chen, L.; Huang, C. Overexpression of a wheat aquaporin gene, TaAQP8, enhances salt stress tolerance in transgenic tobacco. Plant Cell Physiol. 2012, 53, 2127–2141. [Google Scholar] [CrossRef] [Green Version]
  9. Hu, W.; Hou, X.; Huang, C.; Yan, Y.; Tie, W.; Ding, Z.; Wei, Y.; Liu, J.; Miao, H.; Lu, Z. Genome-wide identification and expression analyses of aquaporin gene family during development and abiotic stress in banana. Int. J. Mol. Sci. 2015, 16, 19728–19751. [Google Scholar] [CrossRef] [Green Version]
  10. Li, G.; Chen, T.; Zhang, Z.; Li, B.; Tian, S. Roles of aquaporins in plant-pathogen interaction. Plants 2020, 9, 1134. [Google Scholar] [CrossRef]
  11. Xu, Y.; Hu, W.; Liu, J.; Zhang, J.; Jia, C.; Miao, H.; Xu, B.; Jin, Z. A banana aquaporin gene, MaPIP1; 1, is involved in tolerance to drought and salt stresses. BMC Plant Biol. 2014, 14, 1–14. [Google Scholar] [CrossRef] [Green Version]
  12. Madrid-Espinoza, J.; Brunel-Saldias, N.; Guerra, F.P.; Gutiérrez, A.; Del Pozo, A. Genome-wide identification and transcriptional regulation of aquaporin genes in bread wheat (Triticum aestivum L.) under water stress. Genes 2018, 9, 497. [Google Scholar] [CrossRef] [Green Version]
  13. Kapilan, R.; Vaziri, M.; Zwiazek, J.J. Regulation of aquaporins in plants under stress. Biol. Res. 2018, 51, 1–11. [Google Scholar] [CrossRef]
  14. Maurel, C.; Verdoucq, L.; Luu, D.-T.; Santoni, V. Plant aquaporins: Membrane channels with multiple integrated functions. Annu. Rev. Plant Biol. 2008, 59, 595–624. [Google Scholar] [CrossRef] [Green Version]
  15. Javot, H.; Maurel, C. The role of aquaporins in root water uptake. Ann. Bot. 2002, 90, 301–313. [Google Scholar] [CrossRef] [Green Version]
  16. Zhu, Y.-X.; Xu, X.-B.; Hu, Y.-H.; Han, W.-H.; Yin, J.-L.; Li, H.-L.; Gong, H.-J. Silicon improves salt tolerance by increasing root water uptake in Cucumis sativus L. Plant Cell Rep. 2015, 34, 1629–1646. [Google Scholar] [CrossRef]
  17. Sutka, M.; Li, G.; Boudet, J.; Boursiac, Y.; Doumas, P.; Maurel, C. Natural variation of root hydraulics in Arabidopsis grown in normal and salt-stressed conditions. Plant Physiol. 2011, 155, 1264–1276. [Google Scholar] [CrossRef] [Green Version]
  18. Boursiac, Y.; Chen, S.; Luu, D.-T.; Sorieul, M.; van den Dries, N.; Maurel, C. Early effects of salinity on water transport in Arabidopsis roots. Molecular and cellular features of aquaporin expression. Plant Physiol. 2005, 139, 790–805. [Google Scholar] [CrossRef] [Green Version]
  19. Yin, J.; Jia, J.; Lian, Z.; Hu, Y.; Guo, J.; Huo, H.; Zhu, Y.; Gong, H. Silicon enhances the salt tolerance of cucumber through increasing polyamine accumulation and decreasing oxidative damage. Ecotoxicol. Environ. Saf. 2019, 169, 8–17. [Google Scholar] [CrossRef]
  20. Dubcovsky, J.; Dvorak, J. Genome plasticity a key factor in the success of polyploid wheat under domestication. Science 2007, 316, 1862–1866. [Google Scholar] [CrossRef]
  21. Bozzini, A. Origin, distribution, and production of durum wheat in the world. In Durum Wheat: Chemistry and Technology; American Association of Cereal Chemists: Eagan, MN, USA, 1988; pp. 1–16. [Google Scholar]
  22. Maccaferri, M.; Harris, N.S.; Twardziok, S.O.; Pasam, R.K.; Gundlach, H.; Spannagl, M.; Ormanbekova, D.; Lux, T.; Prade, V.M.; Milner, S.G.; et al. Durum wheat genome highlights past domestication signatures and future improvement targets. Nat Genet 2019, 51, 885–895. [Google Scholar] [CrossRef] [PubMed] [Green Version]
  23. Bolser, D.M.; Staines, D.M.; Perry, E.; Kersey, P.J. Ensembl plants: Integrating tools for visualizing, mining, and analyzing plant genomic data. In Plant Genomics Databases; Springer: Berlin/Heidelberg, Germany, 2017; pp. 1–31. [Google Scholar]
  24. Marchler-Bauer, A.; Derbyshire, M.K.; Gonzales, N.R.; Lu, S.; Chitsaz, F.; Geer, L.Y.; Geer, R.C.; He, J.; Gwadz, M.; Hurwitz, D.I. CDD: NCBI’s conserved domain database. Nucleic Acids Res. 2015, 43, D222–D226. [Google Scholar] [CrossRef] [PubMed] [Green Version]
  25. Finn, R.D.; Bateman, A.; Clements, J.; Coggill, P.; Eberhardt, R.Y.; Eddy, S.R.; Heger, A.; Hetherington, K.; Holm, L.; Mistry, J. Pfam: The protein families database. Nucleic Acids Res. 2014, 42, D222–D230. [Google Scholar] [CrossRef] [PubMed] [Green Version]
  26. Gasteiger, E.; Hoogland, C.; Gattiker, A.; Duvaud, S.; Wilkins, M.R.; Appel, R.D.; Bairoch, A. Protein identification and analysis tools on the ExPASy server. In The Proteomics Protocols Handbook; Humana Press: Totowa, NJ, USA, 2005; pp. 571–607. [Google Scholar]
  27. Sievers, F.; Wilm, A.; Dineen, D.; Gibson, T.J.; Karplus, K.; Li, W.; Lopez, R.; McWilliam, H.; Remmert, M.; Söding, J.; et al. Fast, scalable generation of high-quality protein multiple sequence alignments using Clustal Omega. Mol. Syst. Biol. 2011, 7, 539. [Google Scholar] [CrossRef] [PubMed]
  28. Nguyen, L.-T.; Schmidt, H.A.; von Haeseler, A.; Minh, B.Q. IQ-TREE: A fast and effective stochastic algorithm for estimating Maximum-likelihood phylogenies. Mol. Biol. Evol. 2015, 32, 268–274. [Google Scholar] [CrossRef]
  29. Letunic, I.; Bork, P. Interactive Tree of Life (iTOL) v5: An online tool for phylogenetic tree display and annotation. Nucleic Acids Res. 2021, 49, W293–W296. [Google Scholar] [CrossRef]
  30. Bailey, T.L.; Boden, M.; Buske, F.A.; Frith, M.; Grant, C.E.; Clementi, L.; Ren, J.; Li, W.W.; Noble, W.S. MEME SUITE: Tools for motif discovery and searching. Nucleic Acids Res. 2009, 37, W202–W208. [Google Scholar] [CrossRef]
  31. Musavizadeh, Z.; Najafi-Zarrini, H.; Kazemitabar, S.K.; Hashemi, S.H.; Faraji, S.; Barcaccia, G.; Heidari, P. Genome-Wide Analysis of Potassium Channel Genes in Rice: Expression of the OsAKT and OsKAT Genes under Salt Stress. Genes 2021, 12, 784. [Google Scholar] [CrossRef]
  32. Chen, C.; Chen, H.; Zhang, Y.; Thomas, H.R.; Frank, M.H.; He, Y.; Xia, R. TBtools: An Integrative Toolkit Developed for Interactive Analyses of Big Biological Data. Mol. Plant 2020, 13, 1194–1202. [Google Scholar] [CrossRef]
  33. Yang, S.; Zhang, X.; Yue, J.-X.; Tian, D.; Chen, J.-Q. Recent duplications dominate NBS-encoding gene expansion in two woody species. Mol. Genet. Genom. 2008, 280, 187–198. [Google Scholar] [CrossRef]
  34. Blom, N.; Gammeltoft, S.; Brunak, S. Sequence and structure-based prediction of eukaryotic protein phosphorylation sites. J. Mol. Biol. 1999, 294, 1351–1362. [Google Scholar] [CrossRef]
  35. Kelley, L.A.; Mezulis, S.; Yates, C.M.; Wass, M.N.; Sternberg, M.J.E. The Phyre2 web portal for protein modeling, prediction and analysis. Nat. Protoc. 2015, 10, 845–858. [Google Scholar] [CrossRef] [Green Version]
  36. Lovell, S.C.; Davis, I.W.; Arendall III, W.B.; De Bakker, P.I.W.; Word, J.M.; Prisant, M.G.; Richardson, J.S.; Richardson, D.C. Structure validation by Cα geometry: ϕ, ψ and Cβ deviation. Proteins Struct. Funct. Bioinform. 2003, 50, 437–450. [Google Scholar] [CrossRef]
  37. Lescot, M.; Déhais, P.; Thijs, G.; Marchal, K.; Moreau, Y.; Van de Peer, Y.; Rouzé, P.; Rombauts, S. PlantCARE, a database of plant cis-acting regulatory elements and a portal to tools for in silico analysis of promoter sequences. Nucleic Acids Res. 2002, 30, 325–327. [Google Scholar] [CrossRef]
  38. Untergasser, A.; Cutcutache, I.; Koressaar, T.; Ye, J.; Faircloth, B.C.; Remm, M.; Rozen, S.G. Primer3—New capabilities and interfaces. Nucleic Acids Res. 2012, 40, e115. [Google Scholar] [CrossRef] [Green Version]
  39. Livak, K.J.; Schmittgen, T.D. Analysis of relative gene expression data using real-time quantitative PCR and the 2− ΔΔCT method. Methods 2001, 25, 402–408. [Google Scholar] [CrossRef]
  40. Rezaee, S.; Ahmadizadeh, M.; Heidari, P. Genome-wide characterization, expression profiling, and post- transcriptional study of GASA gene family. Gene Rep. 2020, 20, 100795. [Google Scholar] [CrossRef]
  41. Ahmadizadeh, M.; Chen, J.-T.; Hasanzadeh, S.; Ahmar, S.; Heidari, P. Insights into the genes involved in the ethylene biosynthesis pathway in Arabidopsis thaliana and Oryza sativa. J. Genet. Eng. Biotechnol. 2020, 18, 1–20. [Google Scholar] [CrossRef]
  42. Zou, Z.; Yang, L.; Gong, J.; Mo, Y.; Wang, J.; Cao, J.; An, F.; Xie, G. Genome-wide identification of Jatropha curcas aquaporin genes and the comparative analysis provides insights into the gene family expansion and evolution in Hevea brasiliensis. Front. Plant Sci. 2016, 7, 395. [Google Scholar] [CrossRef] [Green Version]
  43. Johanson, U.; Karlsson, M.; Johansson, I.; Gustavsson, S.; Sjovall, S.; Fraysse, L.; Weig, A.R.; Kjellbom, P. The complete set of genes encoding major intrinsic proteins in Arabidopsis provides a framework for a new nomenclature for major intrinsic proteins in plants. Plant Physiol. 2001, 126, 1358–1369. [Google Scholar] [CrossRef]
  44. Venkatesh, J.; Yu, J.-W.; Park, S.W. Genome-wide analysis and expression profiling of the Solanum tuberosum aquaporins. Plant Physiol. Biochem. 2013, 73, 392–404. [Google Scholar] [CrossRef] [PubMed]
  45. Sun, H.; Li, L.; Lou, Y.; Zhao, H.; Gao, Z. Genome-wide identification and characterization of aquaporin gene family in moso bamboo (Phyllostachys edulis). Mol. Biol. Rep. 2016, 43, 437–450. [Google Scholar] [CrossRef] [PubMed]
  46. Putpeerawit, P.; Sojikul, P.; Thitamadee, S.; Narangajavana, J. Genome-wide analysis of aquaporin gene family and their responses to water-deficit stress conditions in cassava. Plant Physiol. Biochem. 2017, 121, 118–127. [Google Scholar] [CrossRef] [PubMed]
  47. Park, W.; Scheffler, B.E.; Bauer, P.J.; Campbell, B.T. Identification of the family of aquaporin genes and their expression in upland cotton (Gossypium hirsutum L.). BMC Plant Biol. 2010, 10, 1–17. [Google Scholar] [CrossRef] [PubMed] [Green Version]
  48. Diehn, T.A.; Pommerrenig, B.; Bernhardt, N.; Hartmann, A.; Bienert, G.P. Genome-wide identification of aquaporin encoding genes in Brassica oleracea and their phylogenetic sequence comparison to Brassica crops and Arabidopsis. Front. Plant Sci. 2015, 6, 166. [Google Scholar] [CrossRef] [Green Version]
  49. Shivaraj, S.M.; Deshmukh, R.K.; Rai, R.; Bélanger, R.; Agrawal, P.K.; Dash, P.K. Genome-wide identification, characterization, and expression profile of aquaporin gene family in flax (Linum usitatissimum). Sci. Rep. 2017, 7, 1–17. [Google Scholar] [CrossRef] [Green Version]
  50. Faraji, S.; Heidari, P.; Amouei, H.; Filiz, E.; Poczai, P. Investigation and Computational Analysis of the Sulfotransferase (SOT) Gene Family in Potato (Solanum tuberosum): Insights into Sulfur Adjustment for Proper Development and Stimuli Responses. Plants 2021, 10, 2597. [Google Scholar] [CrossRef]
  51. Heidari, P.; Puresmaeli, F.; Mora-Poblete, F. Genome-Wide Identification and Molecular Evolution of the Magnesium Transporter (MGT) Gene Family in Citrullus lanatus and Cucumis sativus. Agronomy 2022, 12, 2253. [Google Scholar] [CrossRef]
  52. Faraji, S.; Filiz, E.; Kazemitabar, S.K.; Vannozzi, A.; Palumbo, F.; Barcaccia, G.; Heidari, P. The AP2/ERF Gene Family in Triticum durum: Genome-Wide Identification and Expression Analysis under Drought and Salinity Stresses. Genes 2020, 11, 1464. [Google Scholar] [CrossRef]
  53. Rivers, R.L.; Dean, R.M.; Chandy, G.; Hall, J.E.; Roberts, D.M.; Zeidel, M.L. Functional analysis of nodulin 26, an aquaporin in soybean root nodule symbiosomes. J. Biol. Chem. 1997, 272, 16256–16261. [Google Scholar] [CrossRef]
  54. Dean, R.M.; Rivers, R.L.; Zeidel, M.L.; Roberts, D.M. Purification and functional reconstitution of soybean nodulin 26. An aquaporin with water and glycerol transport properties. Biochemistry 1999, 38, 347–353. [Google Scholar] [CrossRef]
  55. Singh, R.K.; Deshmukh, R.; Muthamilarasan, M.; Rani, R.; Prasad, M. Versatile roles of aquaporin in physiological processes and stress tolerance in plants. Plant Physiol. Biochem. 2020, 149, 178–189. [Google Scholar] [CrossRef]
  56. Chaumont, F.; Barrieu, F.; Jung, R.; Chrispeels, M.J. Plasma membrane intrinsic proteins from maize cluster in two sequence subgroups with differential aquaporin activity. Plant Physiol. 2000, 122, 1025–1034. [Google Scholar] [CrossRef] [Green Version]
  57. Abdullah; Faraji, S.; Mehmood, F.; Malik, H.M.T.; Ahmed, I.; Heidari, P.; Poczai, P. The GASA Gene Family in Cacao (Theobroma cacao, Malvaceae): Genome Wide Identification and Expression Analysis. Agronomy 2021, 11, 1425. [Google Scholar] [CrossRef]
  58. Törnroth-Horsefield, S.; Wang, Y.; Hedfalk, K.; Johanson, U.; Karlsson, M.; Tajkhorshid, E.; Neutze, R.; Kjellbom, P. Structural mechanism of plant aquaporin gating. Nature 2006, 439, 688–694. [Google Scholar] [CrossRef]
  59. Frick, A.; Järvå, M.; Ekvall, M.; Uzdavinys, P.; Nyblom, M.; Törnroth-Horsefield, S. Mercury increases water permeability of a plant aquaporin through a non-cysteine-related mechanism. Biochem. J. 2013, 454, 491–499. [Google Scholar] [CrossRef] [Green Version]
  60. Qing, D.; Yang, Z.; Li, M.; Wong, W.S.; Guo, G.; Liu, S.; Guo, H.; Li, N. Quantitative and functional phosphoproteomic analysis reveals that ethylene regulates water transport via the C-terminal phosphorylation of aquaporin PIP2; 1 in Arabidopsis. Mol. Plant 2016, 9, 158–174. [Google Scholar] [CrossRef] [Green Version]
  61. Prak, S.; Hem, S.; Boudet, J.; Viennois, G.; Sommerer, N.; Rossignol, M.; Maurel, C.; Santoni, V. Multiple phosphorylations in the C-terminal tail of plant plasma membrane aquaporins: Role in subcellular trafficking of AtPIP2; 1 in response to salt stress. Mol. Cell. Proteom. 2008, 7, 1019–1030. [Google Scholar] [CrossRef] [Green Version]
  62. Ayadi, M.; Cavez, D.; Miled, N.; Chaumont, F.; Masmoudi, K. Identification and characterization of two plasma membrane aquaporins in durum wheat (Triticum turgidum L. subsp. durum) and their role in abiotic stress tolerance. Plant Physiol. Biochem. 2011, 49, 1029–1039. [Google Scholar]
  63. Ayadi, M.; Brini, F.; Masmoudi, K. Overexpression of a wheat aquaporin gene, Td PIP2; 1, enhances salt and drought tolerance in transgenic durum wheat cv. Maali. Int. J. Mol. Sci. 2019, 20, 2389. [Google Scholar] [CrossRef]
Figure 1. Phylogenetic analysis of AQP gene family in T. turgidum (TtAQPs), O. sativa (starting with Os), Z. mays (starting with Zm), H. vulgare (starting with HOR), and A. thaliana (starting with AT).
Genes 14 00202 g001
Figure 2. Conserved motifs in TtAQP proteins. Distribution of 10 conserved motifs in TtAQPs in four groups based on phylogenetic analysis (a), and conserved logos of identified motifs (b).
Genes 14 00202 g002
Figure 3. The location of TtAQP genes in the genome of T. turgidum. Duplicated genes are connected with gray lines.
Genes 14 00202 g003
Figure 4. The Ka/Ks ratio for duplicated TtAQP genes (a), and time of divergence (MYA: million years ago) of the duplicated TtAQP genes (b).
Genes 14 00202 g004
Figure 5. Three-dimensional structure analysis of TtAQP proteins (a), and frequency of amino acids present in binding sites of TtAQPs (b). Red balls show the binding sites in the structure of selected proteins.
Genes 14 00202 g005
Figure 6. Prediction of phosphorylation site in TtAQPs based on three amino acids, including serine, tyrosine, and threonine. The potential value is >0.80.
Genes 14 00202 g006
Figure 7. Expression profiles of selected TtAQP genes under different concentrations of salinity (150 and 250 mM of NaCl) and four time-points, including 0 (as a normal condition), 6, 24, and 72 h after salt stress. * and ** indicate significant differences between the experimental treatments and control treatment (according to Student’s t-test) at p < 0.05 and p < 0.01, respectively.
Genes 14 00202 g007
Figure 8. Grouping the cis-regulatory elements related to responsive elements (REs) to phytohormones (a), and REs to stress (b). Full details are provided in Table S4.
Genes 14 00202 g008
Figure 9. Interaction network of TtAQP proteins (a), and list of GO enrichment of proteins presented in the network (b). The network was constructed based on their homologs of TtAQPs in T. aestivum using the String database.
Genes 14 00202 g009
Table 1. Summary of AQP properties in T. turgidum, A. thaliana, H. vulgare, O. sativa, and Z. mays. Full details of physicochemical properties of TtAQPs are shown in Table S2.
Plant SpeciesPeptide (aa)ExonpIMW (kDa)GRAVYStability
T. turgidum157–3921–64.65–11.0516.7–41.5−0.46, 0.9496%
A. thaliana220–3281–54.50–10.6023.9–35.40.28, 1.02100%
H. vulgare150–6231–195.48–12.8016.3–69.2−0.88, 0.9071%
O. sativa165–3141–55.91–12.3517.5–33.50.14, 0.9288%
Z. mays151–5641–75.42–12.1118.8–62.8−0.25, 0.9586%
Disclaimer/Publisher’s Note: The statements, opinions and data contained in all publications are solely those of the individual author(s) and contributor(s) and not of MDPI and/or the editor(s). MDPI and/or the editor(s) disclaim responsibility for any injury to people or property resulting from any ideas, methods, instructions or products referred to in the content.

