Article

Identification and Association of Single Nucleotide Polymorphisms of the FTO Gene with Indicators of Overweight and Obesity in a Young Mexican Population

by
Alonso Chama-Avilés
1,†,
Karla Lucero Flores-Viveros
2,
Jorge Alberto Cabrera-Ayala
3,
Adriana Aguilar-Galarza
4,
Willebaldo García-Muñoz
5,
Lorenza Haddad-Talancón
5,
Ma. de Lourdes Anzures-Cortés
5,
Claudia Velázquez-Sánchez
5,
Jorge Luis Chávez-Servín
1,
Miriam Aracely Anaya-Loyola
1,
Teresa García-Gasca
1,
Víctor Manuel Rodríguez-García
6,* and
Ulisses Moreno-Celis
1,*
1
Facultad de Ciencias Naturales, Universidad Autónoma de Querétaro, Juriquilla, Querétaro 76230, Mexico
2
Facultad de Enfermería, Universidad Autónoma de Querétaro, Las Campanas, Querétaro 76010, Mexico
3
Facultad de Medicina, Unidad Saltillo, Universidad Autónoma de Coahuila, Coahuila 25000, Mexico
4
Servicio Universitario de Salud, Secretaria de Atención a la Comunidad Universitaria, Universidad Autónoma de Querétaro, Las Campanas, Querétaro 76010, Mexico
5
Laboratorio de Genética Humana, Código 46, S.A. de C.V., Cuernavaca 62498, Mexico
6
Tecnologico de Monterrey, Escuela de Ingeniería y Ciencias, San Pablo, Querétaro 76130, Mexico
*
Authors to whom correspondence should be addressed.
This is the first author.
Genes 2023, 14(1), 159; https://doi.org/10.3390/genes14010159
Submission received: 4 November 2022 / Revised: 29 December 2022 / Accepted: 4 January 2023 / Published: 6 January 2023
(This article belongs to the Special Issue Nutrigenomics and Cellular Metabolism)

Abstract

:
(1) Background: obesity is a global public health problem; various factors have been associated with this disease, and genetic factors play a very important role. Previous studies in multiple populations have associated a gene with fat mass and obesity (FTO). Thus, the present work aims to identify and determine associations between genetic variants of FTO with indicators of overweight and obesity in the Mexican population. (2) Methods: a total of 638 subjects were evaluated to compile data on body mass index (BMI), the percentage of body fat (%BF), the waist circumference (WC), the serum levels of triglycerides (TG), and food consumption. A total of 175 genetic variants in the FTO gene were sampled by a microarray in the evaluated population, followed by association statistical analyses and comparisons of means. (3) Results: a total of 34 genetic variants were associated with any of the 6 indicators of overweight and obesity, but only 15 showed mean differences using the recessive model after the Bonferroni correction. The present study shows a wide evaluation of FTO genetic variants associated with a classic indicator of overweight and obesity, which highlights the importance of genetic analyses in the study of obesity.

1. Introduction

Obesity is a global health problem [1]. Studies in various populations have shown the importance of the genetic component in obesity. Studies in twins have revealed that 80% of variations in the body mass index (BMI) are related to a genetic component [2]; other studies have reported that adopted children have more BMI alterations compared to those shown by their biological parents, indicating that 63% of these alterations resulted from a hereditary component and 31% from environmental factors. Furthermore, studies based on single nucleotide polymorphisms (SNP) have only been able to attribute 3% of BMI variation to a genetic effect [3,4]. Available data suggest a susceptibility of some populations to have higher figures of obesity, as in the case of the Latin American population, where obesity statistics have increased alarmingly and Mexico is considered the country with the highest rate of obesity. Both adult and child populations [5,6] are susceptible to being diagnosed as obese in the same proportion. Several independent studies have shown an association between FTO SNPs and fat mass and obesity [7,8,9].
FTO has been studied for several years and is known to encode for an enzyme nucleic acid methylase, dependent on α-ketoglutarate and iron (Fe II), which is ubiquitous in human tissues. Understanding the exact mechanism by which it is associated with obesity has been difficult [10,11]. However, a loss of function in homozygous FTO carriers has been observed to cause growth retardation and central nervous system disorders. Likewise, there are thin and obese heterozygous individuals, which indicates that the loss or gain of the FTO function is not a condition for the development of obesity but rather specific modifications in their activity. Such modifications can be due to subtle changes in the gene sequence, such as SNPs [11].
In a study investigating adipocytes derived from human adipose tissue, the researchers observed that the presence of the risk allele of SNP rs1421085 promoted a greater darkening of fat cells [12]. On the other hand, in studies looking directly at humans, the association of various SNPs has been observed in different populations in recent decades. Such is the case for SNPs rs9939609, rs6499640, rs8050136, and rs1558902 in the Chinese population [13]. A positive association was also observed with high BMI in the Korean population for SNPs rs1421085 and rs17817449 [13]. Furthermore, rs1421085, rs17817449, and rs9939609 have been associated with obesity in European populations, while these relationships differed in Melanesian, Micronesian, and Polynesian populations [14].
In the Mexican population, some associations of FTO SNPs with obesity of the SNPs rs1121980, rs17817449, rs3751812, and rs9930506 have been observed in the mestizo population [7], and rs9939609 and rs1421085 were associated with obesity in the Mayan population [15].
As these previous studies have not been able to analyze a greater number of genetic variants associated with phenotypic obesity markers, the present work focuses on the evaluation of 175 FTO SNPs filtered from a microarray to investigate their potential associations with common indicators of obesity phenotypes.

2. Materials and Methods

2.1. Subjects and Genetic Sampling

A total of 638 subjects were included in this study from the SUSALUD-UAQ, an initiative that seeks to determine the risk factors of the main non-communicable diseases in the young population. Participants who met the following criteria were included: men and women with an age range of 18 to 22 years, who agreed to sign the informed consent letter and who had a complete evaluation. Likewise, those with previously diagnosed chronic diseases such as cancer, diabetes, cardiovascular disease, women with polycystic ovarian syndrome, pregnant or lactating women, and those who had thyroid problems were excluded from the study; those who did not have complete evaluation information were eliminated.
From this evaluation, the anthropometric parameters of height (m) and weight (Kg) were selected for the calculation of the BMI (kg/m2) and waist circumference (cm) in the same way as the percentage of body fat, determined by 4-pole multifrequency bioelectrical impedance, using the mBCA Mod. 514 equipment (SECA, Hamburg, Germany). Likewise, biochemical parameters of glucose, TG, cholesterol, and HDL were determined from a blood sample extracted by venipuncture, enzymatic methods (SPINREACT, Girona, Spain), and using the Chemistry Analyzer Mod. BS 120 automated equipment (Mindray, Shenzhen, China).
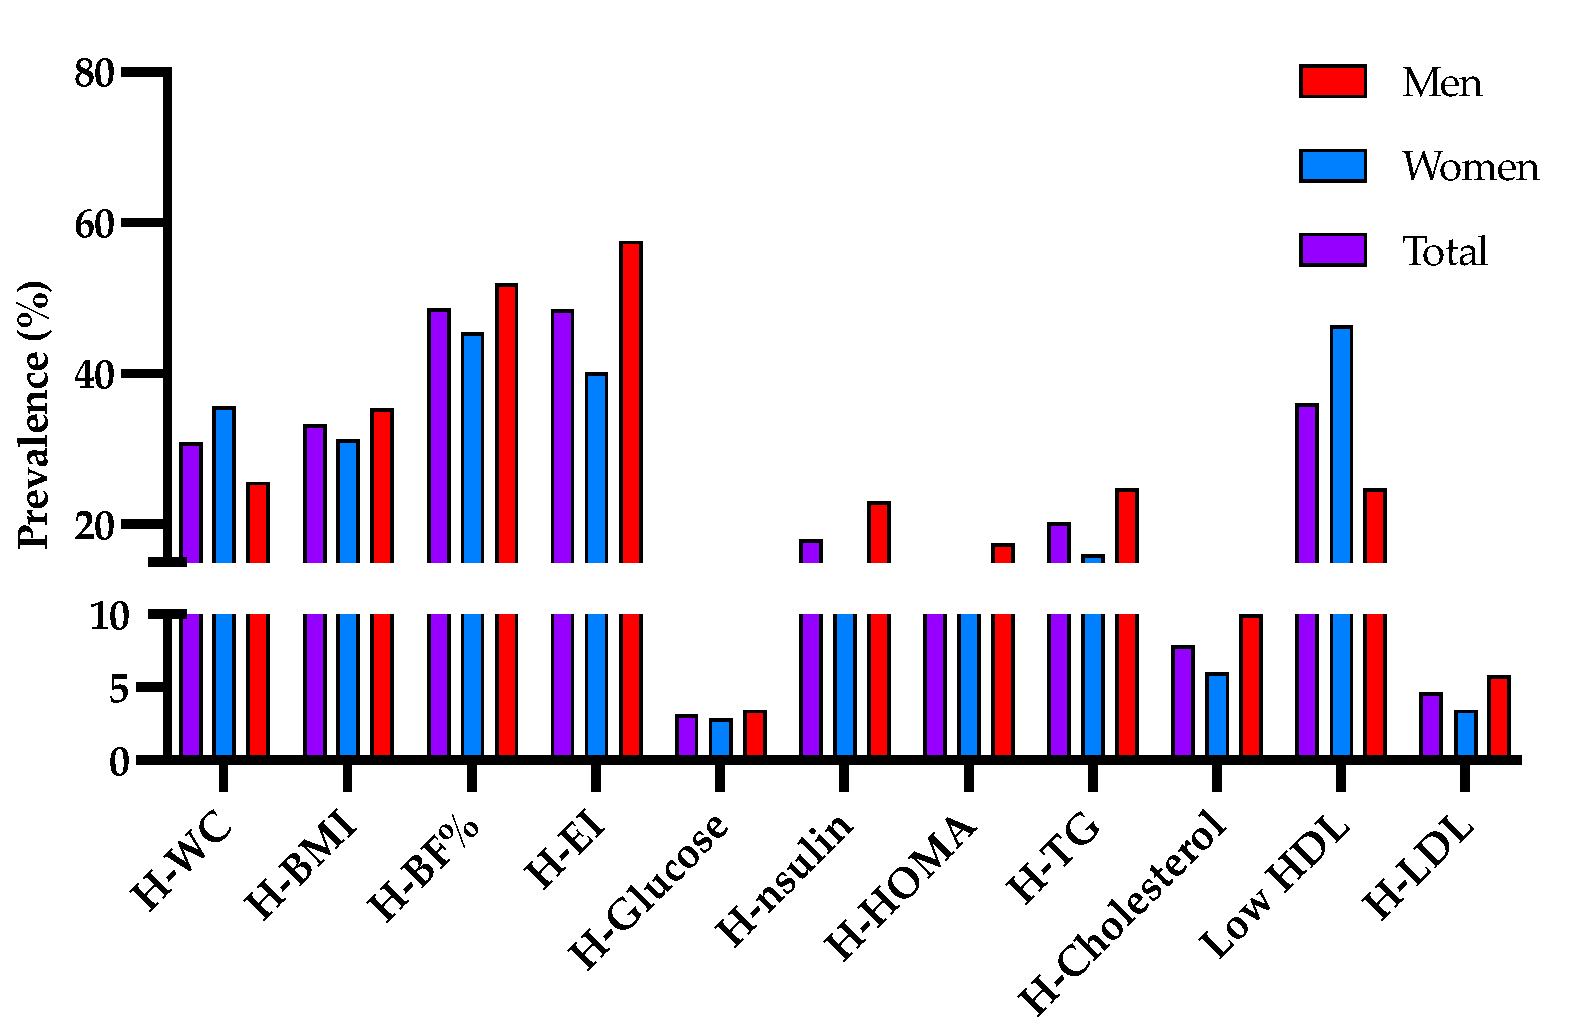
Since there is no accurate diagnosis of obesity, this study took as markers of obesity those that have been found to be the best predictors of obesity and its comorbidities: body mass index (BMI), waist circumference (WC), and body fat percentage (BF%) [16], as well as elevated triglyceride levels [17] and high energy intake [18]. The following values were used as obesity parameters: body mass index > 25.0 kg/m2; WC in women > 80 cm and in men > 90 cm; percentage of body fat in women > 35% and in men > 20%; TG > 150 mg/dL; and energy intake > population median (>2400 Kcal). Fasting glucose < 100 mg/dL was used to rule out diabetes mellitus.

2.2. Analysis of Genetic Material

Subjects’ DNA samples were obtained from whole blood, using the QIAamp 96 DNA blood kit (QIAGEN, Illumina, CA, USA) and following the supplier’s specifications. The Illumina Infinium HTS Automated protocol, along with the Beadchip Global Screening Array microarray (GSA-24 v1.0), were used for human genotyping [19,20] in the Código 46 Genetics Laboratories. Data from 216 genetic variants on the FTO gene were initially recovered from the whole 669,672 variants on the Illumina microarray. We applied two data filters using PLINK, the percentage of missing variants per sample below 0.05, and the quality per individual with a call rate above 0.95 [21], which resulted in 175 variants on FTO fulfilling these filters. Genotypic and allelic frequencies were determined with GenAlEx 6.51 [22]. Null alleles were excluded from the dataset prior to further analyses; all markers were analyzed for the Hardy–Weinberg equilibrium (HWE) (Table S1).

2.3. Statistical Analysis

Statistical and descriptive analyses were performed to determine the general characteristics of the population. For the present study, the genotypes were grouped according to the additive model. For the recessive model, the alternative homozygous (xx) and reference homozygous plus heterozygous (XX + Xx) models were used, while for the dominant model, the reference homozygote (XX) and the set of heterozygote and alternative homozygotes were used. Binary logistic regressions were performed to determine significant associations (p ≤ 0.05) between genetic variants and indicators of obesity. Student’s t-tests (p ≤ 0.05) were performed to compare the means of the indicators of obesity for each of the models. One-way ANOVAs were performed to describe the mean differences between the homozygous reference, heterozygous, and homozygous risk populations, followed by the Bonferroni adjustment (p ≤ 0.05). All statistical analyses were performed using the Statistical Package for the Social Sciences (IBM SPSS Statistics for Macintosh, Version 23.0., Armonk, NY, USA: IBM Corp) [23].

3. Results

3.1. Description of the Population

From the studied population, 307 were men (48.27%) and 329 were women (51.73%); the mean age of the population was 19.34 years: 19.58 years for men and 19.12 years for women. Data from the variables related to obesity showed that the mean WC for men was 84.03 ± 11.46 cm and for women 77.88 ± 11.53 cm; the mean BMI for men was 24.03 ± 4.09 Kg/m2, and for women it was 23.41 ± 4.38 Kg/m2. The BF% data presented a mean of 21.13 ± 7.94% in men and 31.21 ± 7.31% in women; the average value of TG in serum was 114.34 ± 72.45 mg/dL in men and 96.67 ± 9.16 mg/dL in women; the calorie consumption values for men were 2584.6 ± 952.97 Kcal/day and 2227.6 ± 815.60 Kcal/day for women (Table 1).
Likewise, a prevalence of high waist circumference was observed in the population of 30.8%, being 25.6% for men and 35.6% for women; according to the BMI > 25 Kg/m2, 33.23% of the population was overweight or obese, being higher in men than in women. On the other hand, the percentage of high body fat was shown in 48.55% of the population, and the energy consumption was greater than the population average (2400 Kcal/day) was observed high in 57.5% of men and 40.18% of women. Hyperglycemia was observed in 3.1% of the population, while hypercholesterolemia was observed in 7.89%. Hypertriglyceridemia (20.3%) and low HDL (36.02) were the most prevalent biochemical markers in the studied population (Figure 1).

3.2. Associations of FTO SNPs with Indicators of Obesity

According to the used model (xx − (Xx + XX)), significant associations (p = 0.05) between 34 genetic variants were associated with the risk (OR > 1) to 6 obesity indicators (WC, BMI > 25 Kg/m2, BMI > 30 Kg/m2, BF%, TG, and energy intake > 2400 Kcal). The genetic variants rs17219983, rs1966435, and rs12051261 showed a protective effect (OR < 1) for BMI > 25 Kg/m2, as well as the rs2111650, rs1966435, and rs12051261 to the BF%. This was the same with rs3751813 for serum TG, but energy consumption (>2400 Kcal) was negatively associated with the SNPs rs1075440 and rs7191566. Significant risk associations (OR > 1) were also observed between high WC and rs17817964 and rs6499662. Similarly, significant risk associations were found for between BMI > 25 Kg/m2 and SNPs rs8043785, rs35510800, rs6499662, and rs12931859. On the contrary, BMI > 30 Kg/m2 was positively associated with the genetic variants rs16945088, rs17817449, rs8043757, rs12931859, and rs7194243, and rs4389136, rs8043785, rs12232391, rs7194243, and energy consumption greater than 2400 Kcal/Day were associated with high BF%, as well as rs9939973, rs9940128, rs1421085, rs3751812, rs9936385, rs11075990, rs9939609, rs7202116, rs7185735, rs9941349, rs17817964, rs9922619, rs12149832, rs12149832, rs12149832, and rs9929152 (Table 2).
On the other hand, according to the analysis of the dominant model (XX − (Xx + xx)), rs1421091, rs4389136, rs12232391, rs7200972, rs12931859, and rs7194243 resulted in significant associations for risk at a high percentage of fat, while rs10852523, rs61743972, rs3826169, and rs7203572 were associated with obesity (BMI >30 Kg/m2) and rs4389136 with hypertriglyceridemia. Protective effects were also observed of rs7205986, rs7203521, rs6499640, rs2111650, rs17819033, rs17219983, rs9934504, rs56335873, rs12933996, rs35090620, and rs16952686 for high fat percentage, and rs9934504, rs12933996, rs16952686, and rs1966435 for BMI > 25 Kg/m2; while rs9934504 turned out to be a protective factor for high waist circumference, and rs74018195, rs74449711, rs7191566, rs17820328, and rs16952657 for calorie intake greater than the median of the studied population (Table 3).

3.3. Comparison of Means BMI, %BF, WC, TG, and Energy Consumption with Additive Models and Genotype

Mean comparisons by Student’s t-test showed statistically significant differences (p ≤ 0.05) only among WC, BMI, and BF% and 16 genetic variants. Specifically, WC with rs12232391; BMI with rs12232391 and rs12051261; and percentage of body fat with rs12232391 and rs12051261; rs9939973, rs9940128, rs1421085, rs17817449, rs3751812, rs9936385, rs11075990, rs9939609, rs7206629, rs7202116, rs7185735, rs9941349, rs17817964, and rs12051261 (Table 4).
According to the results of Student’s t-test for the dominant model (XX − (Xx + xx)), differences can be observed in the means of waist circumference in the SNPs rs1421091, rs4389136, and rs16952686, as well as in the BMI means in the variants rs9934504, rs56335873, rs12232391, and rs16952686. Likewise, significant statistical differences for the percentage of fat were observed in rs7191566, rs1421085, rs3751812, rs17817964, rs2111650, rs11642841, rs9934504, rs56335873, rs12232391, and rs7200972; in the same way as for triglyceride levels, the variants rs17817449, rs8043757, rs9936385, rs11075990, rs9939609, rs7202116, and rs7185735 affected the means of the studied population; likewise, the average energy consumption was affected in this model by the variants rs74449711, rs16952657, and rs35510800 (Table 5).
The results showed significant statistical differences (p ≤ 0.05, ANOVA) between the means of 12 of the determined genetic variants for WC of the SNPs rs12232391 and rs17817449, while for BMI, the variants that showed differences were rs17817449 and rs12232391. For the percentage of body fat, the differences were observed with rs7191566, rs1421085, rs17817449, rs3751812, rs17817964, rs2111650, and rs12232391. On the other hand, energy consumption also showed significant statistical differences (p ≤ 0.05) in the variants rs9936385, rs11075990, rs9939609, rs7202116, and rs7185735 (Table 6).
It is important to mention that only four variants passed the Bonferroni adjustment: rs12232391 for WC, rs17817449 and rs12232391 for BMI, and rs17817449, rs3751812, rs2111650, and rs12232391 for %BF. None of the variants associated with energy consumption passed the Bonferroni adjustment (Table 6, highlighted in bold).

4. Discussion

Recent studies have shown the importance of the FTO gene in the development of the organism. Studies in experimental mice showed that suppression of FTO leads to reduced body weight and body mass, while overexpression promotes an increase in body mass, fat mass, and food consumption [24]. Therefore, FTO and downstream genes regulated from non-coding regions, mainly IRX3 and IRX5, which are genes related to neural development in areas associated with food consumption and may be valuable therapeutic targets for obesity [25,26] The effects of SNPs have been observed to be differential between populations; such is the case of rs9930506, which was observed to have risk associations with BMI in the European population but not in the Asian population [27].
The present work analyzed 175 genetic variants of FTO, of which only 34 were associated with any of the indicators of overweight and obesity, while only 16 of these variants showed differences in means according to the recessive model of the minor allele and 12 differences in the average of the indicators of overweight and obesity according to the genotype present, whereas only 4 passed the Bonferroni adjustment. From these last variants, rs12232391 showed differences between the population means in WC, BMI, and BF%; however, it has not been reported in association with any condition.
The variant rs17817449 has been extensively studied, and its effects have been observed in different populations, such as in the case of a study in an Iranian population with type 2 diabetes mellitus [28] and obesity [29]. This has also been replicated in Chinese women [30]. In the current study, the association of this marker with BMI >30 Kg/m2 and with higher energy consumption was observed, while differences were observed in the means of WC, BMI, and percentage of body fat. The genetic variant rs7191566 was observed in a population study in Mexico but not included in further analyses because it was not in Hardy-Weinberg equilibrium [7]. Interestingly, in the current work, this marker showed a different genotype when compared with the mean percentage of fat in the population.
In our results, variant rs1421085 was found to be associated with high consumption of Kcal, and mean differences were observed in the percentage of body fat. This marker has been extensively studied, and recent studies have found higher allelic frequencies in people with obesity as well as its associations with higher triglyceride and cholesterol levels in Turkish children [31]. Likewise, rs1421085 was previously reported with higher allelic frequencies in the Iranian population, showing its association with obesity markers [32]. In the adult Mexican obese population, rs1421085 has also been considered a genetic marker of risk [15]. On the other hand, rs3751812 has been associated with obesity in the Taiwanese population, as well as the reduction of its effects by increasing the physical activity for this population [33], while in a population of Greek adults, when analyzing the same SNP, it was not found in Hardy–Weinberg equilibrium, explaining why it had to be discarded from the study [34]. Similarly, in a study in the Polish population, it was observed that people carrying this polymorphism tended to have higher levels in the blood lipid profile [35].
Our findings show a positive association between energy consumption greater than 2400 Kcal and the said marker, in addition to differences in the means of body fat, both in the additive model and in the complete genotype. Similarly, rs17817964 in this study was associated with WC and energy consumption greater than the population median. It should be noted that this genetic marker was also associated with obesity in African-American women over 18 years of age with low birth weight [36], and it was generally observed as associated with obesity in people with African-American ancestry [37]. The variant rs2111650 was associated with the percentage of body fat and showed differences in the means of %BF related to its polymorphism; however, it has not been identified as a risk or protective variant in any other population. Furthermore, rs2111650 has been associated in various genome-wide association studies, mainly with obesity markers [38,39].
The rs9936385, rs7202116, and rs11075990 did not pass the Bonferroni adjustment and associations with obesity markers have not been observed in other studies. Interestingly, rs9939609 is one of the variants of the FTO gene that has been most researched for its relationship with clinical obesity markers in various populations, including the Mexican child and adult populations [40,41]. It was also associated with hyperglycemia in women from southern Mexico with metabolic syndrome [42]. In the current study, rs9939609 showed mean differences in the percentage of body fat according to the recessive model and with a higher energy intake, without exceeding the Bonferroni adjustment.
Finally, although FTO is a possible genetic marker for obesity as we have discussed throughout the previous lines when comparing the results of various studies in different populations, further population studies are required to corroborate it as a genetic marker for obesity risk.

5. Conclusions

Some genetic variants of FTO showed a strong relationship with indicators of obesity in the studied population, opening the possibility for specific studies on a population previously diagnosed as obese to confirm the specific influence of the genetic variants identified in this study, since the results obtained were carried out in a young population of mestizo Mexicans without diagnosed diseases.

Supplementary Materials

The following supporting information can be downloaded at: https://www.mdpi.com/article/10.3390/genes14010159/s1, Table S1: Genetic variants analyzed. Genotypes, reference and alternative alleles show their respective frequencies. HWE p-values are also included.

Author Contributions

A.C.-A.: both authors completed the total analysis of the data and participated in the draft writing; K.L.F.-V.: participated in obtaining the clinical data; J.L.C.-S. participated in revising the manuscript, J.A.C.-A. participated in data analysis, A.A.-G.: participated in obtaining the clinical data and writing the manuscript; W.G.-M.: participated in the genetic analysis of the samples and data curation; L.H.-T.: participated in the genetic analysis of the samples; M.d.L.A.-C.: participated in the genetic analysis of the samples; C.V.-S.: participated in the genotyping of the samples; M.A.A.-L.: participated in obtaining clinical data and revising the manuscript; T.G.-G.: participated in obtaining the data and samples and in data analysis; V.M.R.-G. and U.M.-C.: participated in obtaining the samples and data, data analysis, and direction of the entire work. All authors participated in the writing, discussion, and structuring of the manuscript. All authors have read and agreed to the published version of the manuscript.

Funding

This research was partially financed by funds provided by the Universidad Autónoma de Querétaro, and the genetic analysis of the samples was carried out by CÓDIGO 46 S.A. of C.V.

Institutional Review Board Statement

The study was conducted in accordance with the Declaration of Helsinki and approved by the Ethics Committee of the Facultad de Ciencias Naturales, Universidad Autónoma de Querétaro (protocol number 58FCN2020 and date of approval 1 October 2020).

Informed Consent Statement

Informed consent was obtained from all subjects involved in the study.

Data Availability Statement

The data presented in this study are available upon request from the corresponding author. The data is not publicly available as the overall project continues to analyze the results.

Acknowledgments

To the UAQ Health System (SUSALUD-UAQ), to the “Carlos Alcocer Cuarón” FCN-UAQ Nutrition Clinic, Human Nutrition Laboratory (FCN-UAQ), to the program “Summer of science in the central region, Mexico 2022”. To the academic group of Biomedical Research and Functional Foods (UAQ-CA-140) and CÓDIGO 46 S.A. de C.V., for their support with the technological facilities for the development of this project; and to Mark Arcuri for reviewing the manuscript language.

Conflicts of Interest

The authors declare no conflict of interest.

References

  1. WHO. Obesity and Overweight. Available online: https://www.who.int/news-room/fact-sheets/detail/obesity-and-overweight (accessed on 28 July 2022).
  2. Elks, C.E.; Den Hoed, M.; Zhao, J.H.; Sharp, S.J.; Wareham, N.J.; Loos, R.J.F.; Ong, K.K. Variability in the heritability of body mass index: A systematic review and meta-regression. Front. Endocrinol. 2012, 3, 29. [Google Scholar] [CrossRef] [PubMed] [Green Version]
  3. Tavalire, H.F.; Budd, E.L.; Natsuaki, M.N.; Neiderhiser, J.M.; Reiss, D.; Shaw, D.S.; Ganiban, J.M.; Leve, L.D. Using a sibling-adoption design to parse genetic and environmental influences on children’s body mass index (BMI). PLoS ONE 2020, 15, e0236261. [Google Scholar] [CrossRef]
  4. Rohde, K.; Keller, M.; la Cour Poulsen, L.; Blüher, M.; Kovacs, P.; Böttcher, Y. Genetics and epigenetics in obesity. Metabolism 2019, 92, 37–50. [Google Scholar] [CrossRef] [Green Version]
  5. Swinburn, B.A.; Sacks, G.; Hall, K.D.; McPherson, K.; Finegood, D.T.; Moodie, M.L.; Gortmaker, S.L. The global obesity pandemic: Shaped by global drivers and local environments. Lancet 2011, 378, 804–814. [Google Scholar] [CrossRef] [PubMed]
  6. Cominato, L.; Finardi, G.; Biagio, D.; Lellis, D.; Franco, R.R.; Mancini, M.C.; Melo, M.E. De Obesity Prevention: Strategies and Challenges in Latin America. Curr. Obes. Rep. 2018, 7, 97–104. [Google Scholar] [CrossRef]
  7. Saldaña-Alvarez, Y.; Salas-Martínez, M.G.; García-Ortiz, H.; Luckie-Duque, A.; García-Cárdenas, G.; Vicenteño-Ayala, H.; Cordova, E.J.; Esparza-Aguilar, M.; Contreras-Cubas, C.; Carnevale, A.; et al. Gender-dependent association of FTO polymorphisms with body mass index in Mexicans. PLoS ONE 2016, 11, e0145984. [Google Scholar] [CrossRef] [Green Version]
  8. González-Herrera, L.; Zavala-Castro, J.; Ayala-Cáceres, C.; Pérez-Mendoza, G.; López-González, M.J.; Pinto-Escalante, D.; Canto-Cetina, T.; García-Escalante, M.G.; Rubi-Castellanos, R.; Contreras-Capetillo, S.; et al. Genetic variation of FTO: rs1421085 T>C, rs8057044 G>A, rs9939609 T>A, and copy number (CNV) in Mexican Mayan school-aged children with obesity/overweight and with normal weight. Am. J. Hum. Biol. 2019, 31, e23192. [Google Scholar] [CrossRef] [PubMed] [Green Version]
  9. Zermeño-Rivera, J.J.; Astocondor-Pérez, J.P.; Valle, Y.; Padilla-Gutiérrez, J.R.; Orozco-Castellanos, R.; Figuera, L.E.; Gutiérrez-Amavizca, B.E. Association of the FTO gene SNP rs17817449 with body fat distribution in Mexican women. Genet. Mol. Res. 2014, 13, 8561–8567. [Google Scholar] [CrossRef]
  10. Speakman, J.R. The “Fat Mass and Obesity Related” (FTO) gene: Mechanisms of Impact on Obesity and Energy Balance. Curr. Obes. Rep. 2015, 4, 73–91. [Google Scholar] [CrossRef]
  11. Zhao, X.; Yang, Y.; Sun, B.F.; Zhao, Y.L.; Yang, Y.G. FTO and obesity: Mechanisms of association. Curr. Diab. Rep. 2014, 14, 486. [Google Scholar] [CrossRef] [PubMed]
  12. Tóth, B.B.; Arianti, R.; Shaw, A.; Vámos, A.; Veréb, Z.; Póliska, S.; Győry, F.; Bacso, Z.; Fésüs, L.; Kristóf, E. FTO Intronic SNP Strongly Influences Human Neck Adipocyte Browning Determined by Tissue and PPARγ Specific Regulation: A Transcriptome Analysis. Cells 2020, 9, 987. [Google Scholar] [CrossRef] [PubMed] [Green Version]
  13. Cha, S.W.; Choi, S.M.; Kim, K.S.; Park, B.L.; Kim, J.R.; Kim, J.Y.; Shin, H.D. Replication of genetic effects of FTO polymorphisms on BMI in a Korean population. Obesity 2008, 16, 2187–2189. [Google Scholar] [CrossRef] [PubMed]
  14. Ohashi, J.; Naka, I.; Kimura, R.; Natsuhara, K.; Yamauchi, T.; Furusawa, T.; Nakazawa, M.; Ataka, Y.; Patarapotikul, J.; Nuchnoi, P.; et al. FTO polymorphisms in oceanic populations. J. Hum. Genet. 2007, 52, 1031–1035. [Google Scholar] [CrossRef] [PubMed] [Green Version]
  15. Villalobos-Comparán, M.; Teresa Flores-Dorantes, M.; Teresa Villarreal-Molina, M.; Rodríguez-Cruz, M.; García-Ulloa, A.C.; Robles, L.; Huertas-Vázquez, A.; Saucedo-Villarreal, N.; López-Alarcón, M.; Sánchez-Muñoz, F.; et al. The FTO gene is associated with adulthood obesity in the Mexican population. Obesity 2008, 16, 2296–2301. [Google Scholar] [CrossRef]
  16. O’Neill, D. Measuring obesity in the absence of a gold standard. Econ. Hum. Biol. 2015, 17, 116–128. [Google Scholar] [CrossRef] [PubMed] [Green Version]
  17. Abbasalizad Farhangi, M.; Nikniaz, L.; Nikniaz, Z. Higher dietary acid load potentially increases serum triglyceride and obesity prevalence in adults: An updated systematic review and meta-analysis. PLoS ONE 2019, 14, e0216547. [Google Scholar] [CrossRef] [Green Version]
  18. Fernández-Verdejo, R.; Marlatt, K.L.; Ravussin, E.; Galgani, J.E. Contribution of brown adipose tissue to human energy metabolism. Mol. Asp. Med. 2019, 68, 82–89. [Google Scholar] [CrossRef]
  19. Ilumina Inc. (Ed.) Infinium HTS Assay: Reference Guide; Illumina Way: San Diego, CA, USA, 2019; Volume 2, pp. 1–83. ISBN 1000000074604. [Google Scholar]
  20. Cadena-López, R.O.; Hernández-Rodríguez, L.V.; Aguilar-Galarza, A.; García-Muñoz, W.; Haddad-Talancón, L.; Anzures-Cortes, M.d.L.; Velázquez-Sánchez, C.; Flores-Viveros, K.L.; Anaya-Loyola, M.A.; García-Gasca, T.; et al. Association between SNPs in Leptin Pathway Genes and Anthropometric, Biochemical, and Dietary Markers Related to Obesity. Genes 2022, 13, 945. [Google Scholar] [CrossRef]
  21. Purcell, S.; Neale, B.; Todd-Brown, K.; Thomas, L.; Ferreira, M.A.R.; Bender, D.; Maller, J.; Sklar, P.; De Bakker, P.I.W.; Daly, M.J.; et al. PLINK: A tool set for whole-genome association and population-based linkage analyses. Am. J. Hum. Genet. 2007, 81, 559–575. [Google Scholar] [CrossRef] [Green Version]
  22. Peakall, R.; Smouse, P.E. GenAlEx 6.5: Genetic analysis in Excel. Population genetic software for teaching and research--an update. Bioinformatics 2012, 28, 2537–2539. [Google Scholar] [CrossRef]
  23. IBM Corp. IBM SPSS Statistics for Windows; IBM: Armonk, NY, USA, 2015. [Google Scholar]
  24. Chang, J.Y.; Park, J.H.; Park, S.E.; Shon, J.; Park, Y.J. The Fat Mass- and Obesity-Associated (FTO) Gene to Obesity: Lessons from Mouse Models. Obesity 2018, 26, 1674–1686. [Google Scholar] [CrossRef] [PubMed] [Green Version]
  25. Chauhdary, Z.; Rehman, K.; Akash, M.S.H. The composite alliance of FTO locus with obesity-related genetic variants. Clin. Exp. Pharmacol. Physiol. 2021, 48, 954–965. [Google Scholar] [CrossRef] [PubMed]
  26. Littleton, S.H.; Berkowitz, R.I.; Grant, S.F.A. Genetic Determinants of Childhood Obesity. Mol. Diagn. Ther. 2020, 24, 653–663. [Google Scholar] [CrossRef] [PubMed]
  27. Doaei, S.; Mosavi Jarrahi, S.A.; Sanjari Moghadam, A.; Akbari, M.E.; Javadi Kooshesh, S.; Badeli, M.; Azizi Tabesh, G.; Abbas Torki, S.; Gholamalizadeh, M.; Zhu, Z.H.; et al. The effect of rs9930506 FTO gene polymorphism on obesity risk: A meta-analysis. Biomol. Concepts 2020, 10, 237–242. [Google Scholar] [CrossRef]
  28. Younus, L.A.; Algenabi, A.H.A.; Abdul-Zhara, M.S.; Hussein, M.K. FTO gene polymorphisms (rs9939609 and rs17817449) as predictors of Type 2 Diabetes Mellitus in obese Iraqi population. Gene 2017, 627, 79–84. [Google Scholar] [CrossRef]
  29. Hosseini-Esfahani, F.; Koochakpoor, G.; Mirmiran, P.; Daneshpour, M.S.; Azizi, F. Dietary patterns modify the association between fat mass and obesity-associated genetic variants and changes in obesity phenotypes. Br. J. Nutr. 2019, 121, 1247–1254. [Google Scholar] [CrossRef] [PubMed]
  30. Chen, B.; Li, Z.; Chen, J.; Ji, J.; Shen, J.; Xu, Y.; Zhao, Y.; Liu, D.; Shen, Y.; Zhang, W.; et al. Association of fat mass and obesity-associated and retinitis pigmentosa guanosine triphosphatase (GTpase) regulator-interacting protein-1 like polymorphisms with body mass index in Chinese women. Endocr. J. 2018, 65, 783–791. [Google Scholar] [CrossRef] [Green Version]
  31. Inandiklioğlu, N.; Yaşar, A. Association between rs1421085 and rs9939609 Polymorphisms of Fat Mass and Obesity-Associated Gene with High-Density Lipoprotein Cholesterol and Triglyceride in Obese Turkish Children and Adolescents. J. Pediatr. Genet. 2021, 10, 009–015. [Google Scholar] [CrossRef]
  32. Sedaghati-khayat, B.; Barzin, M.; Akbarzadeh, M.; Guity, K.; Fallah, M.S.; Pourhassan, H.; Azizi, F.; Daneshpour, M.S. Lack of association between FTO gene variations and metabolic healthy obese (MHO) phenotype: Tehran Cardio-metabolic Genetic Study (TCGS). Eat. Weight Disord. 2020, 25, 25–35. [Google Scholar] [CrossRef]
  33. Liaw, Y.C.; Liaw, Y.P.; Lan, T.H. Physical activity might reduce the adverse impacts of the FTO gene variant rs3751812 on the body mass index of adults in Taiwan. Genes 2019, 10, 354. [Google Scholar] [CrossRef]
  34. Goutzelas, Y.; Kotsa, K.; Vasilopoulos, Y.; Tsekmekidou, X.; Stamatis, C.; Yovos, J.G.; Sarafidou, T.; Mamuris, Z. Association analysis of FTO gene polymorphisms with obesity in Greek adults. Gene 2017, 613, 10–13. [Google Scholar] [CrossRef] [PubMed]
  35. Czajkowski, P.; Adamska-Patruno, E.; Bauer, W.; Krasowska, U.; Fiedorczuk, J.; Moroz, M.; Gorska, M.; Kretowski, A. Dietary fiber intake may influence the impact of FTO genetic variants on obesity parameters and lipid profile—A cohort study of a caucasian population of Polish origin. Antioxidants 2021, 10, 1793. [Google Scholar] [CrossRef] [PubMed]
  36. Ruiz-Narváez, E.A.; Haddad, S.A.; Rosenberg, L.; Palmer, J.R. Birth weight modifies the association between central nervous system gene variation and adult body mass index. J. Hum. Genet. 2016, 61, 193–198. [Google Scholar] [CrossRef] [PubMed] [Green Version]
  37. Monda, K.L.; Chen, G.K.; Taylor, K.C.; Palmer, C.; Edwards, T.L.; Lange, L.A.; Ng, M.C.Y.; Adeyemo, A.A.; Allison, M.A.; Bielak, L.F.; et al. A meta-analysis identifies new loci associated with body mass index in individuals of African ancestry. Nat. Genet. 2013, 45, 690–696. [Google Scholar] [CrossRef] [PubMed] [Green Version]
  38. Tan, L.J.; Zhu, H.; He, H.; Wu, K.H.; Li, J.; Chen, X.D.; Zhang, J.G.; Shen, H.; Tian, Q.; Krousel-Wood, M.; et al. Replication of 6 obesity genes in a meta-analysis of genome-wide association studies from diverse ancestries. PLoS ONE 2014, 9, e96149. [Google Scholar] [CrossRef] [Green Version]
  39. Paternoster, L.; Evans, D.M.; Aagaard Nohr, E.; Holst, C.; Gaborieau, V.; Brennan, P.; Prior Gjesing, A.; Grarup, N.; Witte, D.R.; Jørgensen, T.; et al. Genome-wide population-based association study of extremely overweight young adults-the GOYA study. PLoS ONE 2011, 6, e24303. [Google Scholar] [CrossRef] [Green Version]
  40. López-Rodríguez, G.; Estrada-Neria, A.; Suárez-Diéguez, T.; Tejero, M.E.; Fernández, J.C.; Galván, M. Common polymorphisms in MC4R and FTO genes are associated with BMI and metabolic indicators in Mexican children: Differences by sex and genetic ancestry. Gene 2020, 754, 144840. [Google Scholar] [CrossRef]
  41. León-Mimila, P.; Villamil-Ramírez, H.; Villalobos-Comparán, M.; Villarreal-Molina, T.; Romero-Hidalgo, S.; López-Contreras, B.; Gutiérrez-Vidal, R.; Vega-Badillo, J.; Jacobo-Albavera, L.; Posadas-Romeros, C.; et al. Contribution of Common Genetic Variants to Obesity and Obesity-Related Traits in Mexican Children and Adults. PLoS ONE 2013, 8, e70640. [Google Scholar] [CrossRef] [Green Version]
  42. Ortega, P.E.N.; Meneses, M.E.; Delgado-Enciso, I.; Irecta-Nájera, C.A.; Castro-Quezada, I.; Solís-Hernández, R.; Flores-Guillén, E.; García-Miranda, R.; Valladares-Salgado, A.; Locia-Morales, D.; et al. Association of rs9939609-FTO with metabolic syndrome components among women from Mayan communities of Chiapas, Mexico. J. Physiol. Anthropol. 2021, 40, 11. [Google Scholar] [CrossRef]
Figure 1. Prevalence of clinical markers associated with indicators of overweight and obesity. Total prevalence (purple bar); of women (blue bar) and men (red bar) with high waist circumference (H-WC); body mass index greater than 25 kg/m2 (H-BMI); high body fat percentage (H-BF%); energy intake greater than 2400 Kcal/day (H-EI); hyperglycemia (H-Glucose); hyperinsulinemia (H-Insulin); elevated HOMA index (H-HOMA); hypertriglyceridemia (H-TG); hypercholesterolemia (H-Cholesterol); low levels of HDL (Low-HDL); and elevated levels of LDL (H-LDL).
Genes 14 00159 g001
Table 1. General characteristics of the population.
Men (307)Women (329)Total
MeanS.D.MeanS.D.MeanS.D.
Age (years)19.583.4619.121.9419.342.78
Weight (Kg)70.7513.1559.5511.881.6538.95
Height (m)1.7157.031.5956.2464.9513.7
Waist circumference (cm)84.0311.4677.8811.5380.8511.89
BMI(Kg/m2)24.034.0923.414.3823.714.25
Body fat (%)21.137.9431.217.3126.359.13
Energy intake (Kcal)2584.6952.972227.6815.602406.1902.51
Glucose (mg/dL)85.038.9782.449.1683.689.16
Insulin (mg/dL)7.715.127.926.037.825.62
HOMA-Index1.621.141.611.231.621.94
Triglycerides (mg/dL)114.3472.4596.679.16105.1463.79
Total cholesterol (mg/dL)157.5732.65157.8827.76157.7430.17
LDL (mg/dL)86.6224.9685.4122.6685.7923.78
HLD (mg/dL)48.05311.0253.2713.2850.7612.51
BMI—Body mass index; HOMA—Homeostatic model assessment; LDL—Low density lipoprotein; and HDL—High density lipoprotein.
Table 2. Association of FTO SNPs with indicators of overweight and obesity, recessive model.
Clinical MarkerSNPModelORCI95%p-ValueEffect
Hight waist circumference (cm)rs17817964CC + CT2.3871.0565.3940.037Risk
TT *
rs6499662AA + AG2.4121.0515.5370.038Risk
GG *
BMI > 25 Kg/m2rs8043785AA + AG1.8631.0783.2190.026Risk
GG *
rs35510800GG + GA1.9201.0703.4440.029Risk
AA *
rs6499662AA + AG2.5141.1015.7370.029Risk
GG *
rs12931859CC + CT1.6441.0572.5590.028Risk
TT *
rs17219983CC + CT0.4770.2310.9860.046Protective
TT *
rs1966435TT + TC0.6410.4180.9810.041Protective
CC *
rs12051261CC + CT0.4750.2460.9170.026Protective
TT *
BMI > 30 Kg/m2rs16945088AA + AG3.5351.2539.9740.017Risk
GG *
rs17817449TT + TG2.4141.1545.0500.019Risk
GG *
rs8043757AA + AT2.1671.0424.5050.038Risk
TT *
rs12931859CC + CT2.1811.1044.3100.025Risk
TT *
rs7194243CC + CT1.9601.0623.6180.031Risk
TT *
Hight body fat (%)rs4389136AA + AG1.6161.0982.380.015Risk
GG *
rs8043785AA + AG1.9021.0913.3170.023Risk
GG *
rs12232391TT + TG1.4361.0062.0500.046Risk
GG *
rs7194243CC + CT1.5181.0542.1860.025Risk
TT *
rs2111650TT + TC0.3070.0950.9920.048Protective
CC *
rs1966435TT + TC0.6350.4310.9360.022Protective
CC *
rs12051261CC + CT0.5340.3060.9320.027Protective
TT *
Hight triglycerides (mg/dL)rs3751813GG + GT0.4770.2380.9570.037Protective
TT *
Energy intake > 2400 Kcalrs9939973GG + GA1.8661.0003.4840.050Risk
AA *
rs9940128GG + GA1.8661.0003.4840.050Risk
AA *
rs1421085TT + TC1.9661.0053.8420.048Risk
CC *
rs3751812GG + GT2.7721.1126.9120.029Risk
TT *
rs9936385TT + TC2.7381.1606.4620.022Risk
CC *
rs11075990AA + AG2.7381.1606.4620.022Risk
GG *
rs9939609TT + TA2.7381.1606.4620.022Risk
AA *
rs7206629TT + TC1.8660.9993.4820.050Risk
CC *
rs7202116AA + AG2.7381.1606.4620.022Risk
GG *
rs7185735AA + AG2.7381.1606.4620.022Risk
GG *
rs9941349CC + CT2.2131.1214.3660.022Risk
TT *
rs17817964CC + CT2.5601.0186.4390.046Risk
TT *
rs9922619GG + GT2.1021.0864.0720.028Risk
TT *
rs12149832GG + GA2.4271.0225.7650.045Risk
AA *
rs11642841CC + CA3.3301.1859.3630.023Risk
AA *
rs9929152GG + GA1.4441.0192.0480.039Risk
AA *
rs1075440GG + GA0.6310.4040.9840.042Protective
AA *
rs7191566AA + AG0.2430.0670.8790.031Protective
GG *
BMI—Body mass index; OR—Odds ratio; CI95%—Confidence interval; (*) indicates the genotype considered at risk in the analysis; and p-value = 0.05.
Table 3. Association of FTO SNPs with indicators of overweight and obesity, dominant model.
Clinical MarkerSNPModelORCI95%p-ValueEffect
Hight body fat (%)rs1421091AA1.6831.1582.4440.006Risk
CC + AC *
rs4389136AA1.6161.1252.3210.009Protective
GG + AG *
rs12232391TT1.5791.0712.3270.021Risk
GG + TG *
rs7200972GG2.0941.2563.4910.005Risk
AA + GA *
rs12931859CC1.4261.0221.9910.037Risk
TT + CT *
rs7194243CC1.4861.0372.1280.031Risk
TT + CT *
rs7205986AA0.6720.4790.9430.021Protective
GG + AG *
rs7203521GG0.6980.5060.9630.028Protective
AA + GA *
rs6499640GG0.6980.5060.9630.028Protective
AA + GA *
rs2111650TT0.6550.4480.9580.029Protective
CC + TC *
rs17819033GG0.5760.3890.8530.006Protective
TT + GT *
rs17219983CC0.6150.4450.8490.003Protective
TT + CT *
rs9934504GG0.5600.3590.8730.011Protective
AA + GA *
rs56335873TT0.5900.3790.9170.019Protective
AA + TA *
rs12933996GG0.6810.4730.9800.038Protective
AA + GA *
rs35090620TT0.6030.4220.8610.005Protective
CC + TC *
rs16952686AA0.4660.2360.9210.028Protective
GG + AG *
Hight waist circumference (cm)rs9934504GG0.5900.3570.9750.040Protective
AA + GA *
Energy intake > 2400 Kcalrs35510800GG1.5301.0992.1300.012Risk
AA + GA *
rs71392011CC4.1141.12015.1040.033Risk
AA + CA *
rs74018195TT0.1130.0140.9160.041Protective
CC + TC *
rs74449711TT0.0800.0100.6310.017Protective
GG + TG *
rs7191566AA0.6930.4860.9880.042Protective
GG + AG *
rs17820328AA0.4140.1760.9710.043Protective
GG + AG *
rs16952657CC0.5870.3490.9870.045Protective
TT + CT *
BMI > 25 Kg/m2rs9934504GG0.5770.3520.9470.030Protective
AA + GA *
rs12933996GG0.6860.4720.9990.049Protective
AA + GA *
rs16952686AA0.3790.1640.8750.023Protective
GG + AG *
rs1966435TT0.6850.4810.9750.036Protective
CC + CT *
BMI > 30 Kg/m2rs10852523TT2.9981.4206.3280.004Risk
CC + CT *
rs61743972GG2.3951.0515.4580.038Risk
CC + GC *
rs3826169GG4.4591.06218.7250.041Risk
AA + GA *
rs7203572AA1.8981.0423.4560.036Risk
CC + AC *
Hight triglycerides (mg/dL)rs4389136AA1.6921.0332.7700.037Risk
GG + AG *
BMI—Body mass index; OR—Odds ratio; CI95%—Confidence interval; (*) indicates the genotype considered at risk in the analysis; and p-value = 0.05.
Table 4. Comparison of indicators of overweight and obesity means in recessive model.
Clinical MarkerSNPModelMeanS.D.p-Value
Waist circumference (cm)rs12232391(TT + TG)80.3511.90.043
GG82.4711.78
BMI Kg/m2rs12232391(TT + TG)23.474.210.024
GG24.334.41
rs12051261(CC + TC)23.874.310.012
TT22.423.86
Body fat (%)rs9939973(GG + GA)26.199.260.027
AA28.797.46
rs9940128(GG + GA)26.199.260.027
AA28.797.46
rs1421085(TT + TC)26.189.230.033
CC29.297.63
rs17817449(TT + TG)26.029.140.007
GG29.078.87
rs3751812(GG + GT)26.219.170.018
TT30.637.8
rs9936385(TT + TC)26.229.190.038
CC29.97.73
rs11075990(AA + AG)26.229.190.038
GG29.97.73
rs9939609(TT+ TA)26.229.190.038
AA29.97.73
rs7206629(TT + TC)26.179.260.040
CC28.997.5
rs7202116(AA + AG)26.229.190.038
GG29.97.73
rs7185735(AA + AG)26.229.190.038
GG29.97.73
rs9941349(CC + CT)26.199.230.044
TT29.137.72
rs17817964(CC + CT)26.239.180.031
TT30.347.84
rs12051261(CC + TC)26.739.170.006
TT23.338.56
BMI: body mass index; S.D. = Standard deviation; p-value = 0.05.
Table 5. Comparison of indicators of overweight and obesity means in dominant model.
Clinical MarkerSNPModelMeanS.D.p-Value
Waist circumference (cm)rs1421091AA79.5010.450.049
(AC + CC)81.4612.33
rs4389136AA79.5310.410.042
(AG + GG)81.5112.40
rs16952686AA81.21512.05150.011
(AG + GG)77.3688.8911
BMI Kg/m2rs9934504GG23.904.340.022
(GA + AA)22.843.90
rs56335873TT23.874.340.046
(TA + AA)22.953.94
rs12232391TT22.993.770.021
(TG + GG)23.934.40
rs16952686AA23.8184.34410.011
(AG + GG)22.4383.1919
Body fat (%)rs7191566AA27.049.220.013
(AG + GG)25.098.92
rs1421085TT25.829.120.040
(TC + CC)27.409.16
rs3751812GG25.829.130.031
(GT + TT)27.509.13
rs17817964CC25.869.110.048
(CT + TT)27.419.19
rs2111650TT26.959.100.007
(CT + CC)24.649.14
rs11642841CC25.869.090.042
(CA + AA)27.469.22
rs9934504GG26.809.210.013
(GA + AA)24.328.64
rs56335873TT26.769.220.023
(TA + AA)24.498.62
rs12232391TT24.738.920.015
(TG + GG)26.889.18
rs7200972GG24.32128.877980.036
(GA + AA)26.68779.17234
Triglycerides (mg/dL)rs17817449TT107.5870.100.028
(TG + GG)96.4352.05
rs8043757AA107.6870.170.025
(AT + TT)96.3051.96
rs9936385TT107.6770.170.025
(TC + CC)96.3151.96
rs11075990AA107.6770.170.025
(AG + GG)96.3151.96
rs9939609TT107.6770.170.025
(TA + AA)96.3151.96
rs7202116AA107.6770.170.025
(AG + GG)96.3151.96
rs7185735AA107.6770.170.025
(AG + GG)96.3151.96
Energy intake (Kcal/day)rs74449711TT2518.26906.910.001
(TG + GG)1731.67404.54
rs16952657CC2534.22914.660.020
(CT + TT)2265.71808.14
rs35510800GG2430.1252891.442870.049
(GA + AA)2577.7083916.83851
BMI—Body mass index; S.D.—Standard deviation; and p-value = 0.05.
Table 6. Association of the genotype with indicators of overweight and obesity.
Clinical MarkerSNPGenotypeMeanS.D.p-Valuep. adj
Waist circumference (cm)rs12232391TT79.3211.760.0580.052
TG80.8411.96
GG82.4711.78
rs17817449TT81.5111.940.0420.061
TG78.8910.54
GG82.213.74
BMI (Kg/m2)rs17817449TT23.824.330.040.047
TG23.073.95
GG24.524.54
rs12232391TT22.993.770.0210.016
TG23.74.39
GG24.334.41
Body fat (%)rs7191566AA27.049.220.0270.089
AG25.298.96
GG22.828.36
rs1421085TT25.829.120.040.059
TC26.969.45
CC29.297.63
rs17817449TT26.129.080.0260.033
TG25.789.32
GG29.078.87
rs3751812GG25.829.130.0190.032
GT27.089.24
TT30.637.8
rs17817964CC25.869.110.0350.059
CT27.029.3
TT30.347.84
rs2111650TT26.959.10.0270.041
TC24.739.32
CC23.957.61
rs12232391TT24.738.920.0270.022
TG26.59.28
GG27.528.99
Energy intake (Kcal/Day)rs9936385TT2530.51886.20.0440.067
TC2399.05897.45
CC2831.741154.44
rs11075990AA2350.51886.20.0440.067
AG2399.05897.45
GG2831.741154.44
rs9939609TT2530.51886.20.0440.067
TA2399.05897.45
AA2831.741154.44
rs7202116AA2530.51886.20.0440.067
AG2399.05897.45
GG2831.741154.44
rs7185735AA2530.51886.20.0440.067
AG2399.05897.45
GG2831.741154.44
BMI—Body mass index; S.D.—Standard deviation; p-value = 0.05; and p-adj. = p-value adjustment by Bonferroni correction. In bold type, the p values that were statistically significant in the Bonferroni correction
Disclaimer/Publisher’s Note: The statements, opinions and data contained in all publications are solely those of the individual author(s) and contributor(s) and not of MDPI and/or the editor(s). MDPI and/or the editor(s) disclaim responsibility for any injury to people or property resulting from any ideas, methods, instructions or products referred to in the content.

