
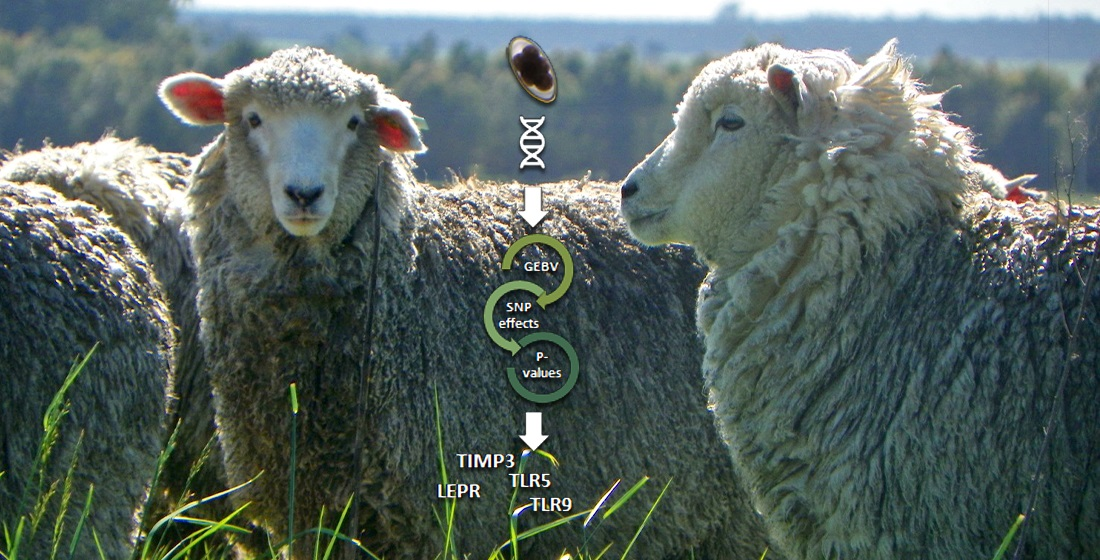
Genome-Wide Association Study of Parasite Resistance to Gastrointestinal Nematodes in Corriedale Sheep


Abstract
:
1. Introduction
2. Materials and Methods
2.1. Phenotypic and Pedigree Data
2.2. Genotypic Data
2.3. Statistical Analysis
- Establish the diagonal matrix of weights for SNP variances as an identity matrix: D = I
- Construct G matrix = ZDZ′q
- Estimate GEBVs for all animals included in the pedigree using ssGBLUP
- Convert GEBVs to SNP effects: , where is genotyped animals GEBV
- Estimate each SNP weight (i):
- Normalize the SNP weights for the total additive genetic variance to remain constant
- Exit or return to step 3.
2.4. Functional Gene Annotation
3. Results
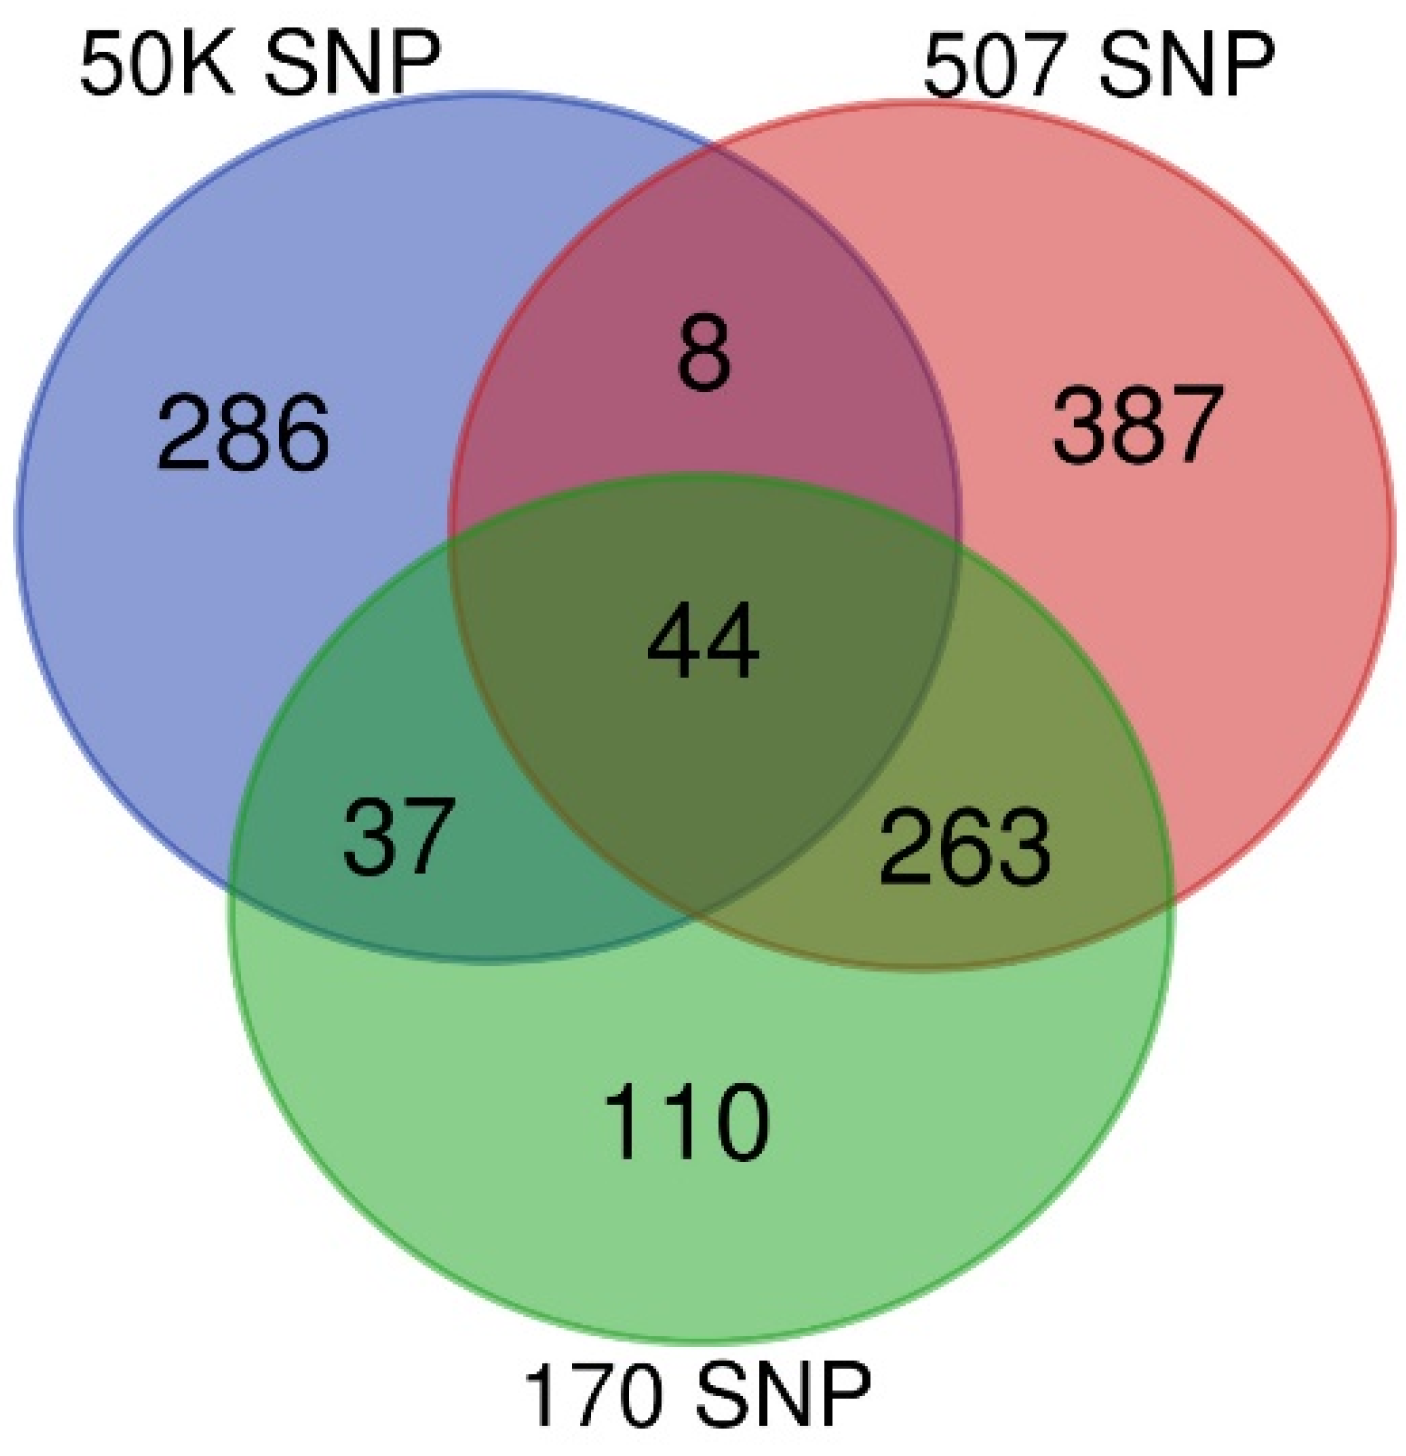
3.1. GWAS
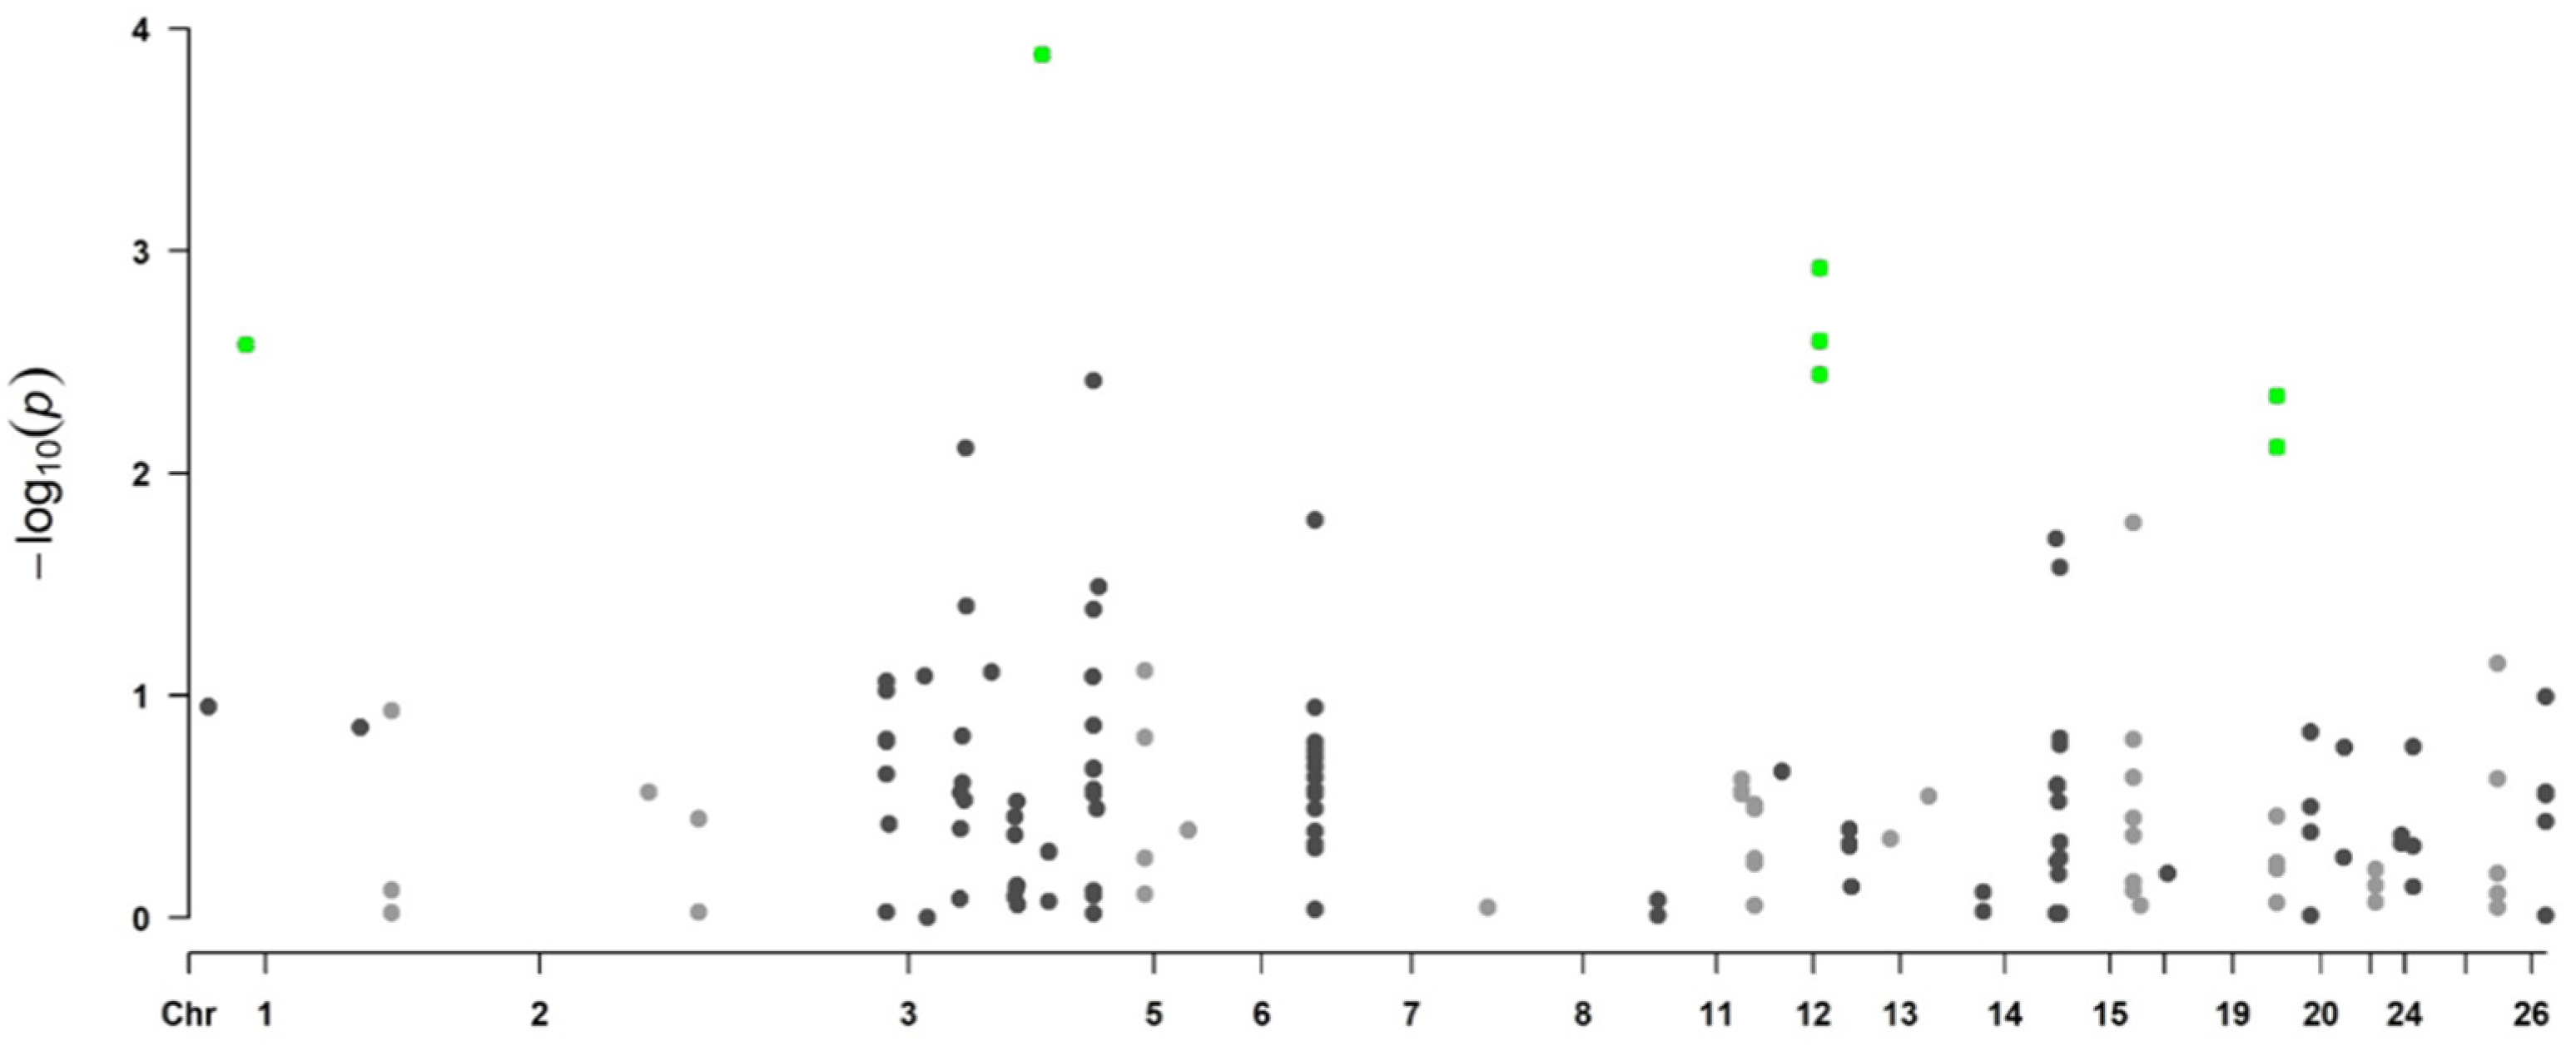
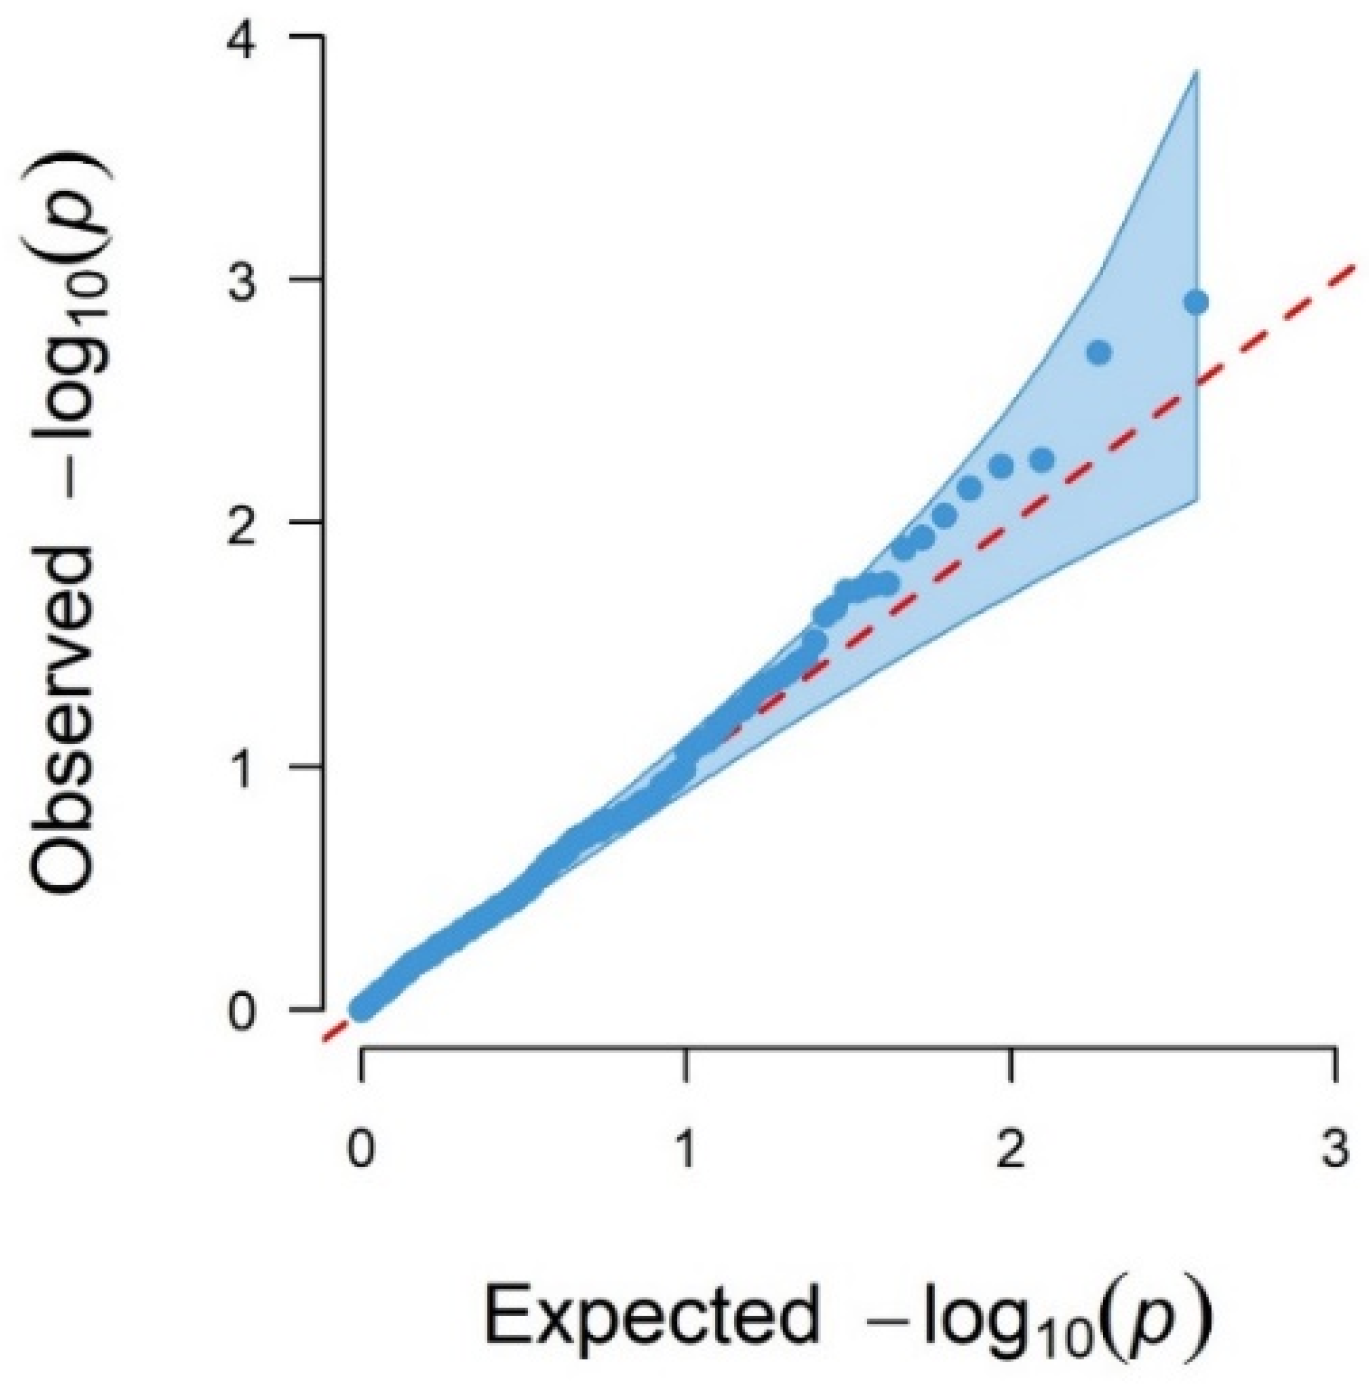
3.1.1. Genome-Wide Associations Using 170 SNPs
3.1.2. Genome-Wide Associations Using the 507 SNP Chip
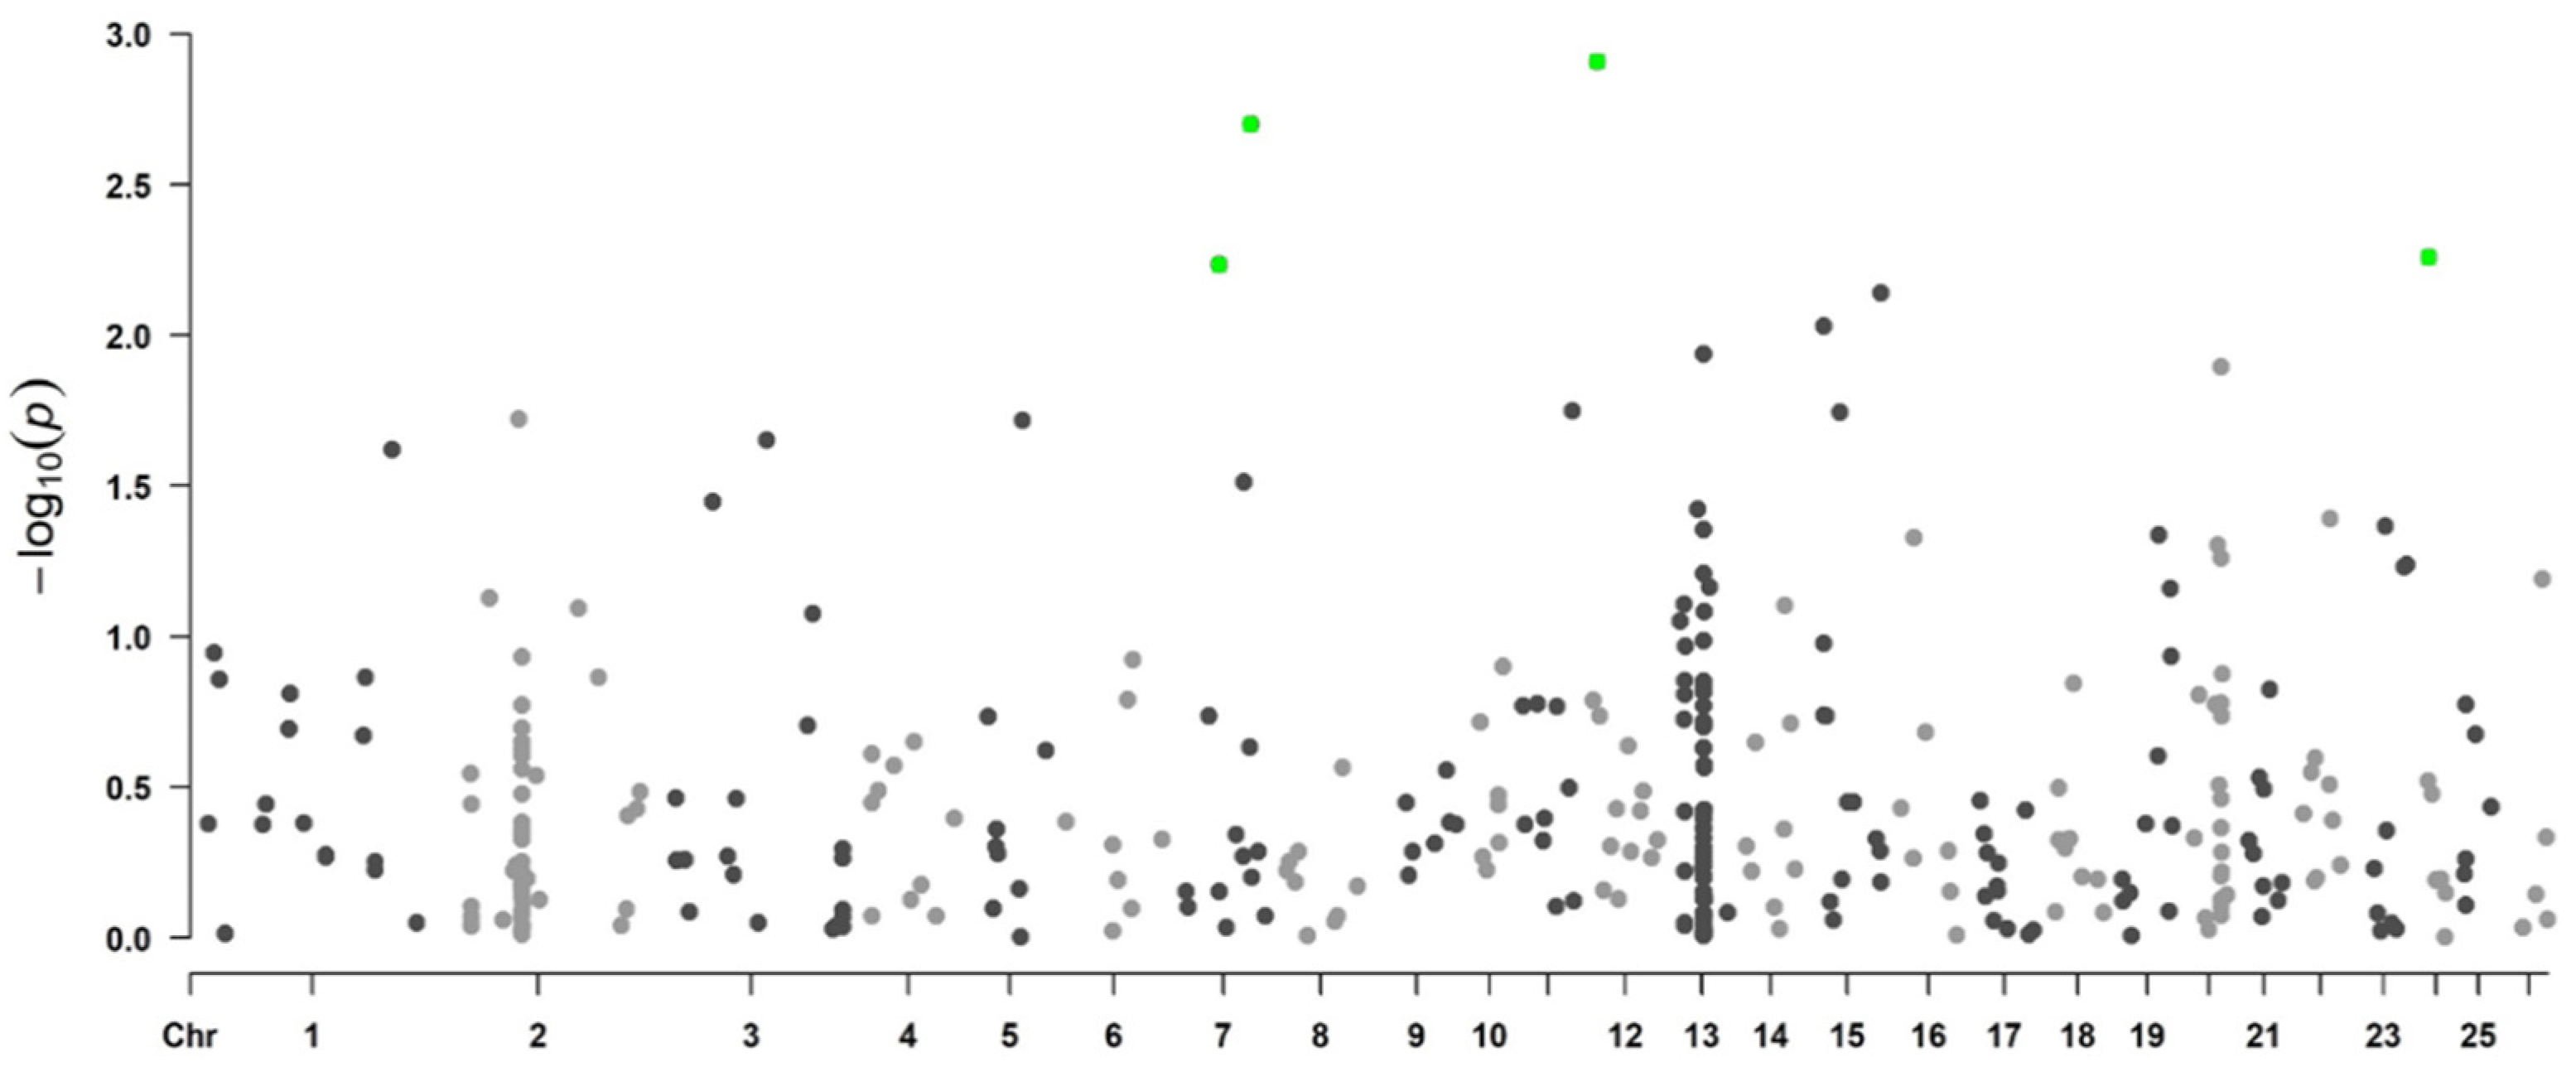
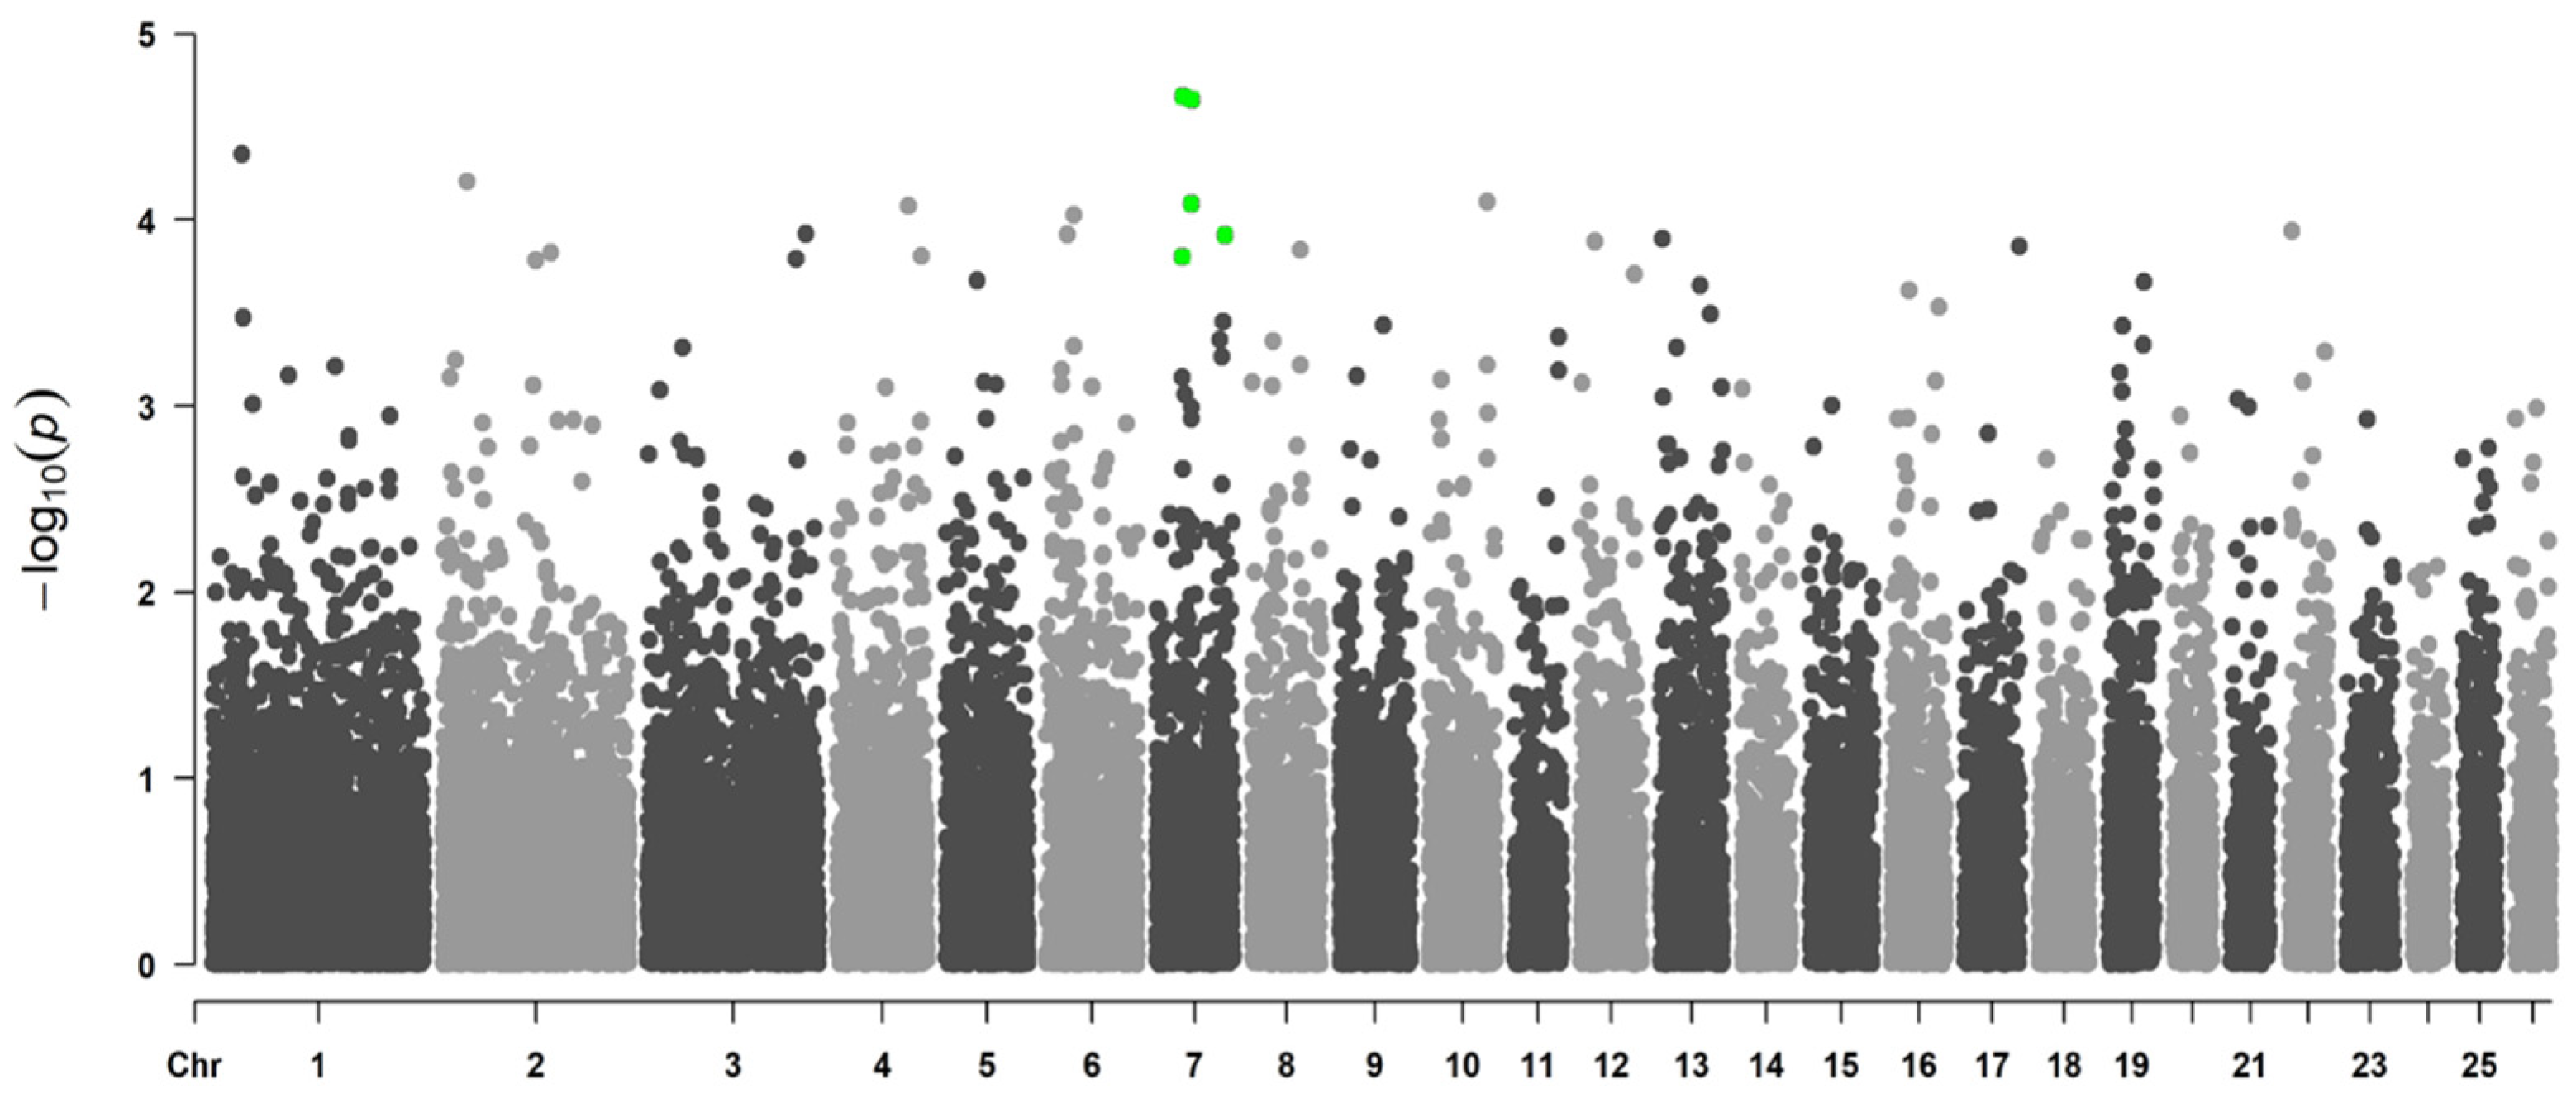
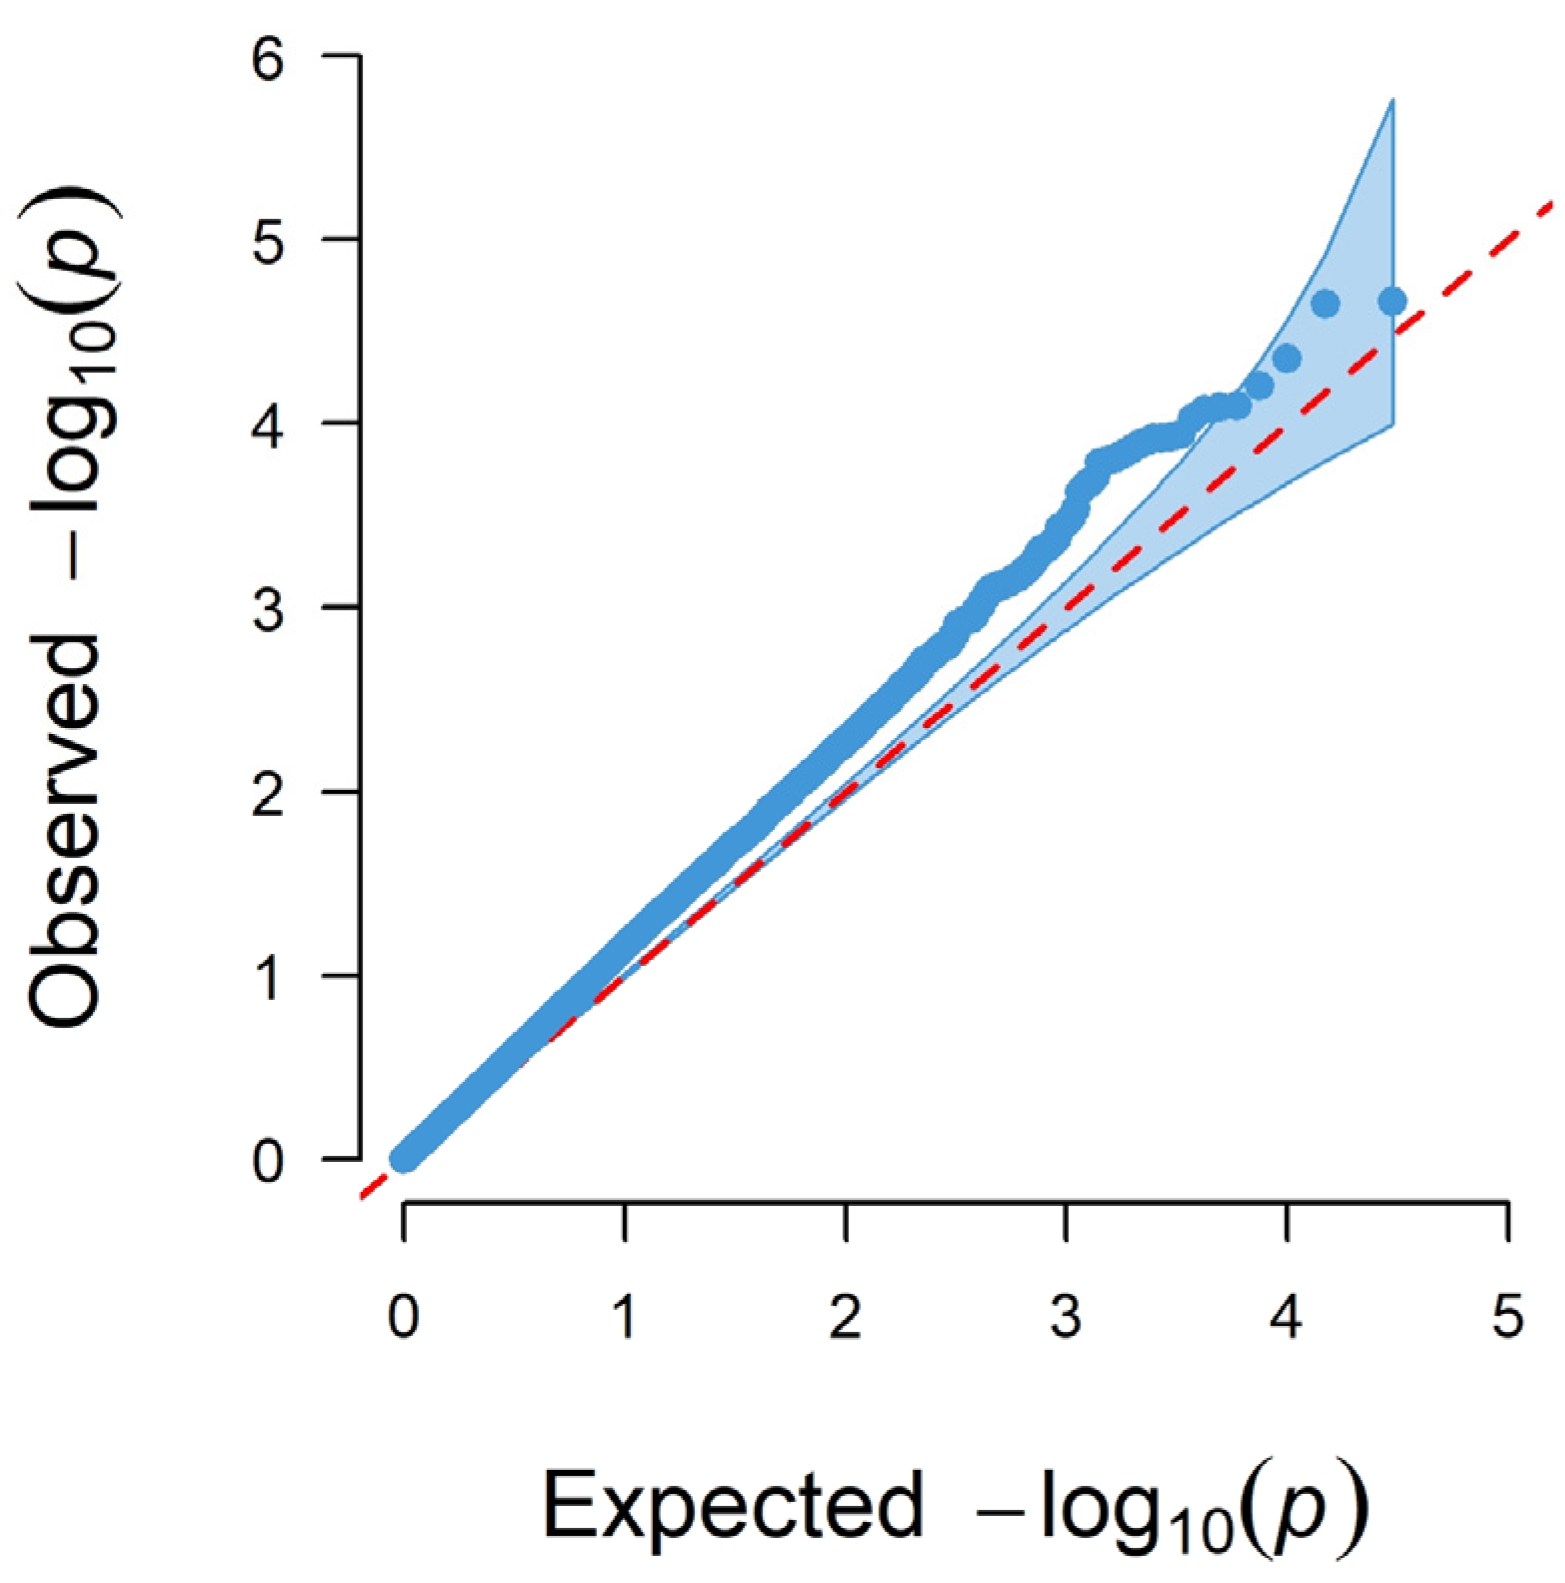
3.1.3. Genome-Wide Associations Using the 50K SNP Chip
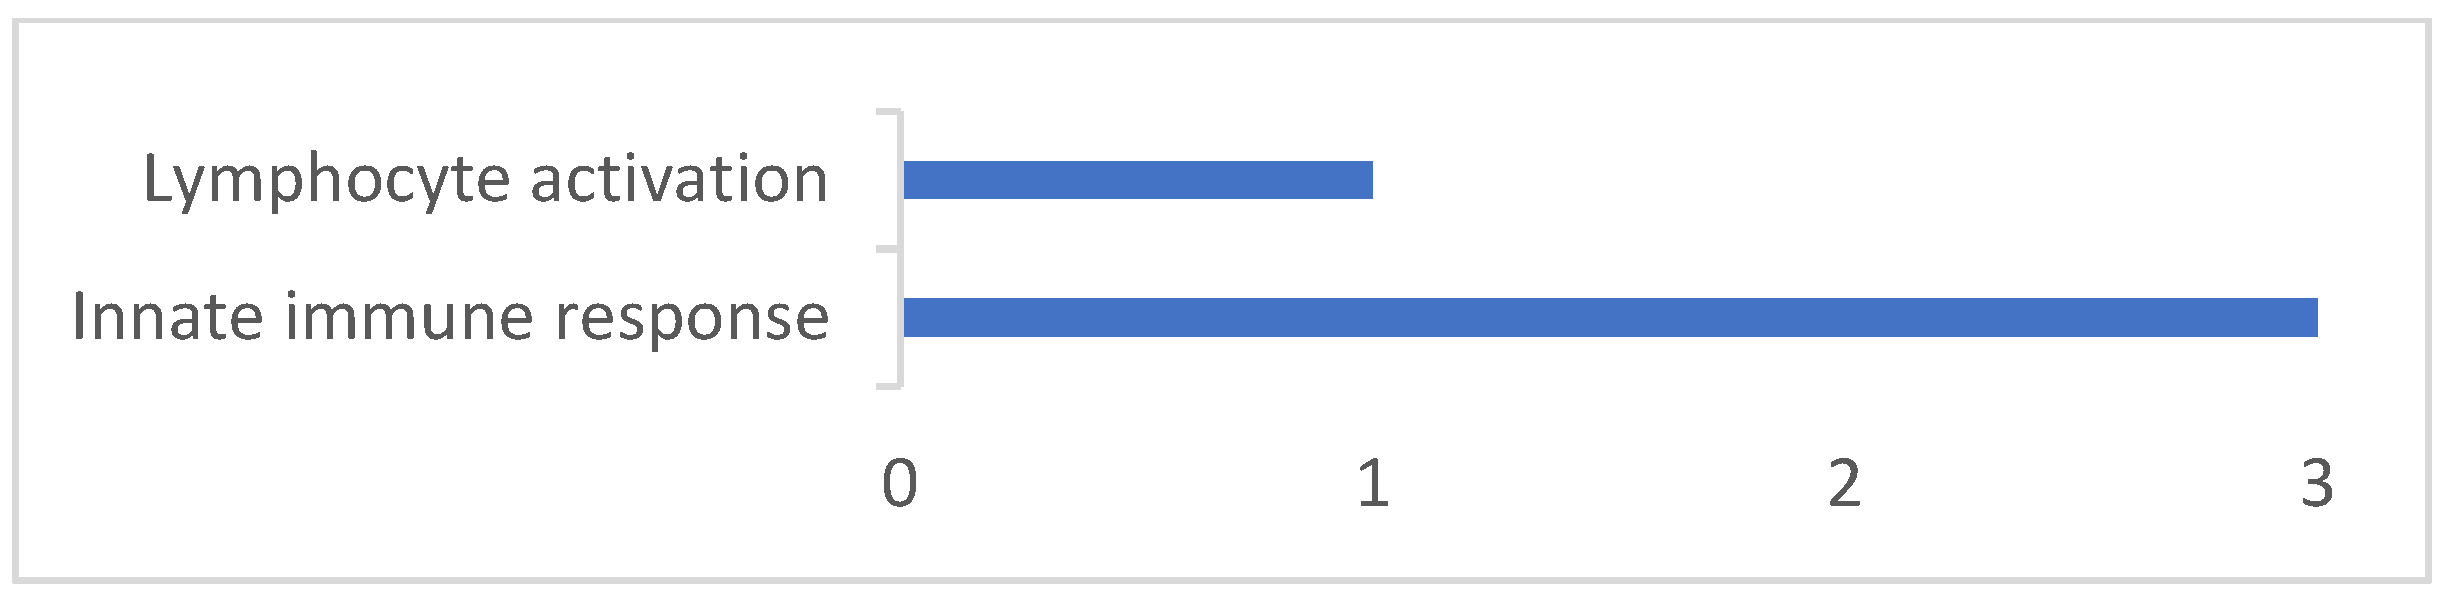
3.2. Gene Annotation
4. Discussion
5. Conclusions
Supplementary Materials
Author Contributions
Funding
Institutional Review Board Statement
Informed Consent Statement
Data Availability Statement
Acknowledgments
Conflicts of Interest
References
- Zajac, A.M. Gastrointestinal Nematodes of Small Ruminants: Life Cycle, Anthelmintics, and Diagnosis. Vet. Clin. N. Am. Food Anim. Pract. 2006, 22, 529–541. [Google Scholar] [CrossRef] [PubMed]
- Nari, A.; Cardozo, H.; Berdie, J.; Canabez, F.; Bawden, R. Dinámica de Población Para Nematodes Gastrointestinales Para Ovinos En El Uruguay. Veterinaria 1977, 14, 11–24. [Google Scholar]
- Castells, D.; Gayo, V.; Mederos, A.; Martínez, D.; Risso, E.; Rodríguez, A.; Scremini, P.; Olivera, J.; Banchero, G.; Lima, A.; et al. Epidemiological Study of Gastrointestinal Nematodes of Sheep in Uruguay Prevalence and Seasonal Dynamics. In Proceedings of the 23rd International Conference of the World Association for the Advancement of Veterinary Parasitology, Buenos Aires, Argentina, 21–25 August 2011. [Google Scholar]
- Vanimisetti, H.B.; Andrew, S.L.; Zajac, A.M.; Notter, D.R. Inheritance of Fecal Egg Count and Packed Cell Volume and Their Relationship with Production Traits in Sheep Infected with Haemonchus Contortus. J. Anim. Sci. 2004, 82, 1602–1611. [Google Scholar] [CrossRef]
- Safari, E.; Fogarty, N.M.; Gilmour, A.R. A Review of Genetic Parameter Estimates for Wool, Growth, Meat and Reproduction Traits in Sheep. Livest. Prod. Sci. 2005, 92, 271–289. [Google Scholar] [CrossRef]
- Brown, D.J.; Fogarty, N.M. Genetic Relationships between Internal Parasite Resistance and Production Traits in Merino Sheep. Anim. Prod. Sci. 2017, 57, 209. [Google Scholar] [CrossRef]
- Stear, M.; Bairden, K.; Bishop, S.; Duncan, J.; Karimi, S.; Mckellar, Q.; Murray, M. Different Patterns of Faecal Egg Output Following Infection of Scottish Blackface Lambs with Ostertagia Circumcincta. Vet. Parasitol. 1995, 59, 29–38. [Google Scholar] [CrossRef]
- Carracelas, B. Evaluación de Paneles de Polimorfismos de Nucleótido Simple Como Herramientas En La Mejora Genética de Ovinos Corriedale. Master’s Thesis, UDELAR, Montevideo, Uruguay, 2022. [Google Scholar]
- Balconi Marques, C.; Goldberg, V.; Ciappesoni, G. Genetic Parameters for Production Traits, Resistance and Resilience to Nematode Parasites under Different Worm Burden Challenges in Corriedale Sheep. Vet. Parasitol. 2020, 287, 109272. [Google Scholar] [CrossRef]
- McRae, K.M.; Stear, M.J.; Good, B.; Keane, O.M. The Host Immune Response to Gastrointestinal Nematode Infection in Sheep. Parasite Immunol. 2015, 37, 605–613. [Google Scholar] [CrossRef]
- Cantor, R.M.; Lange, K.; Sinsheimer, J.S. Prioritizing GWAS Results: A Review of Statistical Methods and Recommendations for Their Application. Am. J. Hum. Genet. 2010, 86, 6–22. [Google Scholar] [CrossRef]
- Legarra, A.; Aguilar, I.; Misztal, I. A Relationship Matrix Including Full Pedigree and Genomic Information. J. Dairy Sci. 2009, 92, 4656–4663. [Google Scholar] [CrossRef]
- Misztal, I.; Legarra, A.; Aguilar, I. Computing Procedures for Genetic Evaluation Including Phenotypic, Full Pedigree, and Genomic Information. J. Dairy Sci. 2009, 92, 4648–4655. [Google Scholar] [CrossRef] [PubMed] [Green Version]
- Wang, H.; Misztal, I.; Aguilar, I.; Legarra, A.; Muir, W. Genome-Wide Association Mapping Including Phenotypes from Relatives without Genotypes. Genet. Res. 2012, 94, 73–83. [Google Scholar] [CrossRef] [PubMed]
- Medeiros de Oliveira Silva, R.; Bonvino Stafuzza, N.; de Oliveira Fragomeni, B.; Miguel Ferreira de Camargo, G.; Matos Ceacero, T.; Noely dos Santos Gonçalves Cyrillo, J.; Baldi, F.; Augusti Boligon, A.; Zerlotti Mercadante, M.E.; Lino Lourenco, D.; et al. Genome-Wide Association Study for Carcass Traits in an Experimental Nelore Cattle Population. PLoS ONE 2017, 12, e0169860. [Google Scholar] [CrossRef] [PubMed]
- Mota, R.R.; Guimarães, S.E.F.; Fortes, M.R.S.; Hayes, B.; Silva, F.F.; Verardo, L.L.; Kelly, M.J.; de Campos, C.F.; Guimarães, J.D.; Wenceslau, R.R.; et al. Genome-Wide Association Study and Annotating Candidate Gene Networks Affecting Age at First Calving in Nellore Cattle. J. Anim. Breed. Genet. 2017, 134, 484–492. [Google Scholar] [CrossRef] [PubMed]
- Aguilar, I.; Legarra, A.; Cardoso, F.; Masuda, Y.; Lourenco, D.; Misztal, I. Frequentist P-Values for Large-Scale-Single Step Genome-Wide Association, with an Application to Birth Weight in American Angus Cattle. Genet. Sel. Evol. 2019, 51, 28. [Google Scholar] [CrossRef]
- Laodim, T.; Elzo, M.A.; Koonawootrittriron, S.; Suwanasopee, T.; Jattawa, D. Pathway Enrichment and Protein Interaction Network Analysis for Milk Yield, Fat Yield and Age at First Calving in a Thai Multibreed Dairy Population. Asian-Australas. J. Anim. Sci. 2018, 32, 508–518. [Google Scholar] [CrossRef]
- Raschia, M.A.; Nani, J.P.; Carignano, H.A.; Amadio, A.F.; Maizon, D.O.; Poli, M.A. Weighted Single-Step Genome-Wide Association Analyses for Milk Traits in Holstein and Holstein x Jersey Crossbred Dairy Cattle. Livest. Sci. 2020, 242, 104294. [Google Scholar] [CrossRef]
- Marques, D.B.D.; Bastiaansen, J.W.M.; Broekhuijse, M.L.W.J.; Lopes, M.S.; Knol, E.F.; Harlizius, B.; Guimarães, S.E.F.; Silva, F.F.; Lopes, P.S. Weighted Single-Step GWAS and Gene Network Analysis Reveal New Candidate Genes for Semen Traits in Pigs. Genet. Sel. Evol. 2018, 50, 40. [Google Scholar] [CrossRef]
- Bergamaschi, M.; Maltecca, C.; Fix, J.; Schwab, C.; Tiezzi, F. Genome-Wide Association Study for Carcass Quality Traits and Growth in Purebred and Crossbred Pigs1. J. Anim. Sci. 2020, 98, skz360. [Google Scholar] [CrossRef]
- Johnston, S.E.; Mcewan, J.C.; Pickering, N.K.; Kijas, J.W.; Beraldi, D.; Pilkington, J.G.; Pemberton, J.M.; Slate, J. Genome-Wide Association Mapping Identifies the Genetic Basis of Discrete and Quantitative Variation in Sexual Weaponry in a Wild Sheep Population. Mol. Ecol. 2011, 20, 2555–2566. [Google Scholar] [CrossRef]
- Gebreselassie, G.; Berihulay, H.; Jiang, L.; Ma, Y. Review on Genomic Regions and Candidate Genes Associated with Economically Important Production and Reproduction Traits in Sheep (Ovies Aries). Animals 2019, 10, 33. [Google Scholar] [CrossRef] [PubMed] [Green Version]
- Benavides, M.V.; Sonstegard, T.S.; van Tassell, C. Genomic Regions Associated with Sheep Resistance to Gastrointestinal Nematodes. Trends Parasitol. 2016, 32, 470–480. [Google Scholar] [CrossRef] [PubMed]
- Berton, M.P.; de Oliveira Silva, R.M.; Peripolli, E.; Stafuzza, N.B.; Martin, J.F.; Álvarez, M.S.; Gavinã, B.V.; Toro, M.A.; Banchero, G.; Oliveira, P.S.; et al. Genomic Regions and Pathways Associated with Gastrointestinal Parasites Resistance in Santa Inês Breed Adapted to Tropical Climate. J. Anim. Sci. Biotechnol. 2017, 8, 73. [Google Scholar] [CrossRef] [PubMed]
- Periasamy, K.; Pichler, R.; Poli, M.; Cristel, S.; Cetrá, B.; Medus, D.; Basar, M.; AK, T.; Ramasamy, S.; Ellahi, M.B.; et al. Candidate Gene Approach for Parasite Resistance in Sheep—Variation in Immune Pathway Genes and Association with Fecal Egg Count. PLoS ONE 2014, 9, e88337. [Google Scholar] [CrossRef] [PubMed]
- Grasso, N. Identificación de Polimorfismos de Un Solo Nucleótido Asociados a La Resistencia a Parásitos Gastrointestinales En Ovinos Corriedale. Master’s Thesis, UDELAR, Montevideo, Uruguay, 2013. [Google Scholar]
- Macedo, F. Marcadores SNP Para Exclusión de Paternidad En Las Razas Corriedale y Merino Australiano Del Uruguay. Master’s Thesis, UDELAR, Montevideo, Uruguay, 2017. [Google Scholar]
- Australian Meat & Livestock Corporation. Handbook of Australian Livestock, 3rd ed.; The Corporation: Sydney, Australia, 1989. [Google Scholar]
- Bervejillo, J.; Campoy, D.; Gonzalez, C.; Ortiz, A. Resultados de La Encuesta Ganadera Nacional 2016. In Anuario OPYPA 2018; Ministerio de Ganadería, Agricultura y Pesca: Montevideo, Uruguay, 2018; pp. 443–455. [Google Scholar]
- Castells, D. Evaluación de Resistencia de Ovinos Corriedale a los Nematodos en Uruguay: Heredabilidad y Correlaciones Genéticas El Recuento De Huevos De Nematodos Características Productivas. Master’s Thesis, UDELAR, Montevideo, Uruguay, 2008. [Google Scholar]
- Whitlock, H. Some Modifications of the McMaster Helminth Egg-Counting Technique and Apparatus. J. Coun. Sci. Ind. Res. 1948, 21, 177–180. [Google Scholar]
- Ciappesoni, G.; Gimeno, D.; Ravagnolo, O. Genetic Relationships between Faecal Worm Egg Count and Production Traits in Merino Sheep of Uruguay. In Proceedings of the World Congress on Genetics Applied to Livestock Production, Leipzig, Germany, 1–6 August 2010; p. 0384. [Google Scholar]
- Medrano, J.; Aasen, E.; Sharrow, L. DNA Extraction from Nucleated Red Blood Cells. Biotechniques 1990, 8, 43. [Google Scholar]
- Aguilar, I.; Tsuruta, S.; Masuda, Y.; Lourenco, D.; Legarra, A.; Misztal, I. BLUPF90 Suite of Programs for Animal Breeding with Focus on Genomics. In Proceedings of the World Congress on Genetics Applied to Livestock Production, Rotterdam, the Netherlands, 3–8 July 2018; p. 751. [Google Scholar]
- Aguilar, I.; Misztal, I.; Johnson, D.L.; Legarra, A.; Tsuruta, S.; Lawlor, T.J. Hot Topic: A Unified Approach to Utilize Phenotypic, Full Pedigree, and Genomic Information for Genetic Evaluation of Holstein Final Score. J. Dairy Sci. 2010, 93, 743–752. [Google Scholar] [CrossRef]
- VanRaden, P.M. Efficient Methods to Compute Genomic Predictions. J. Dairy Sci. 2008, 91, 4414–4423. [Google Scholar] [CrossRef]
- Aguilar, I.; Misztal, I.; Tsuruta, S.; Legarra, A.; Wang, H. PREGSF90-POSTGSF90: Computational Tools for the Implementation of Single-Step Genomic Selection and Genome-Wide Association with Ungenotyped Individuals in BLUPF90 Programs. In Proceedings of the 10th Congress of Genetics Applied to Livestock Production, Vancouver, BC, Canada, 17–22 August 2014; p. 680. [Google Scholar]
- R Core Team R: A Language and Environment for Statistical Computing. Available online: https://www.R-project.org (accessed on 28 April 2022).
- Turner, S.D. Qqman: An R Package for Visualizing GWAS Results Using Q-Q and Manhattan Plots. J. Open Source Softw. 2018, 3, 731. [Google Scholar] [CrossRef]
- Pritchard, J.K.; Stephens, M.; Rosenberg, N.A.; Donnelly, P. Association Mapping in Structured Populations. Am. J. Hum. Genet. 2000, 67, 170–181. [Google Scholar] [CrossRef]
- Hayes, B. Overview of Statistical Methods for Genome-Wide Association Studies (GWAS). In Genome-Wide Association Studies and Genomic Prediction; Gondro, C., van der Werf, J., Hayes, B., Eds.; Humana Press: London, UK, 2013; Volume 1019, pp. 149–169. [Google Scholar]
- Benjamini, Y.; Hochberg, Y. Controlling the False Discovery Rate: A Practical and Powerful Approach to Multiple Testing. J. R. Statist. Soc. B 1995, 57, 289–300. [Google Scholar] [CrossRef]
- Pike, N. Using False Discovery Rates for Multiple Comparisons in Ecology and Evolution. Methods Ecol. Evol. 2011, 2, 278–282. [Google Scholar] [CrossRef]
- Misztal, I.; Aguilar, I.; Lourenco, D.; Ma, L.; Steibel, J.P.; Toro, M. Emerging Issues in Genomic Selection. J. Anim. Sci. 2021, 99, skab092. [Google Scholar] [CrossRef] [PubMed]
- Qanbari, S. On the Extent of Linkage Disequilibrium in the Genome of Farm Animals. Front. Genet. 2020, 10, 1304. [Google Scholar] [CrossRef] [PubMed]
- Wang, Z.-H.; Zhu, Q.-H.; Li, X.; Zhu, J.-W.; Tian, D.-M.; Zhang, S.-S.; Kang, H.-L.; Li, C.-P.; Dong, L.-L.; Zhao, W.-M.; et al. ISheep: An Integrated Resource for Sheep Genome, Variant and Phenotype. Front. Genet. 2021, 12, 714852. [Google Scholar] [CrossRef]
- Rangwala, S.H.; Kuznetsov, A.; Ananiev, V.; Asztalos, A.; Borodin, E.; Evgeniev, V.; Joukov, V.; Lotov, V.; Pannu, R.; Rudnev, D.; et al. Accessing NCBI Data Using the NCBI Sequence Viewer and Genome Data Viewer (GDV). Genome Res. 2021, 31, 159–169. [Google Scholar] [CrossRef]
- Alvarenga, A.B.; Rovadoscki, G.A.; Petrini, J.; Coutinho, L.L.; Morota, G.; Spangler, M.L.; Pinto, L.F.B.; Carvalho, G.G.P.; Mourão, G.B. Linkage Disequilibrium in Brazilian Santa Inês Breed, Ovis Aries. Sci. Rep. 2018, 8, 8851. [Google Scholar] [CrossRef]
- Bateman, A.; Martin, M.J.; Orchard, S.; Magrane, M.; Agivetova, R.; Ahmad, S.; Alpi, E.; Bowler-Barnett, E.H.; Britto, R.; Bursteinas, B.; et al. UniProt: The Universal Protein Knowledgebase in 2021. Nucleic Acids Res. 2021, 49, D480–D489. [Google Scholar] [CrossRef]
- Harris, M.A.; Clark, J.; Ireland, A.; Lomax, J.; Ashburner, M.; Foulger, R.; Eilbeck, K.; Lewis, S.; Marshall, B.; Mungall, C.; et al. The Gene Ontology (GO) Database and Informatics Resource. Nucleic Acids Res. 2004, 32, D258–D261. [Google Scholar] [CrossRef]
- Raschia, M.A.; Donzelli, M.V.; Medus, P.D.; Cetrá, B.M.; Maizon, D.O.; Suarez, V.H.; Pichler, R.; Periasamy, K.; Poli, M.A. Single Nucleotide Polymorphisms from Candidate Genes Associated with Nematode Resistance and Resilience in Corriedale and Pampinta Sheep in Argentina. Gene 2021, 770, 145345. [Google Scholar] [CrossRef]
- Mancin, E.; Lourenco, D.; Bermann, M.; Mantovani, R.; Misztal, I. Accounting for Population Structure and Phenotypes From Relatives in Association Mapping for Farm Animals: A Simulation Study. Front. Genet. 2021, 12, 658. [Google Scholar] [CrossRef] [PubMed]
- Angosto, M.; Álvarez-Gómez, J. Metaloproteinasas, Matriz Extracelular y Cáncer. An. De La Real Acad. Nac. De Farm. 2010, 76, 59–84. [Google Scholar]
- Loffek, S.; Schilling, O.; Franzke, C.-W. Biological Role of Matrix Metalloproteinases: A Critical Balance. Eur. Respir. J. 2011, 38, 191–208. [Google Scholar] [CrossRef]
- Garg, P.; Vijay-Kumar, M.; Wang, L.; Gewirtz, A.T.; Merlin, D.; Sitaraman, S.V. Matrix Metalloproteinase-9-Mediated Tissue Injury Overrides the Protective Effect of Matrix Metalloproteinase-2 during Colitis. Am. J. Physiol.-Gastrointest. Liver Physiol. 2009, 296, G175–G184. [Google Scholar] [CrossRef] [PubMed] [Green Version]
- Knight, P.A.; Griffith, S.E.; Pemberton, A.D.; Pate, J.M.; Guarneri, L.; Anderson, K.; Talbot, R.T.; Smith, S.; Waddington, D.; Fell, M.; et al. Novel Gene Expression Responses in the Ovine Abomasal Mucosa to Infection with the Gastric Nematode Teladorsagia Circumcincta. Vet. Res. 2011, 42, 78. [Google Scholar] [CrossRef] [PubMed]
- Chitneedi, P.K.; Suárez-Vega, A.; Martínez-Valladares, M.; Arranz, J.J.; Gutiérrez-Gil, B. Exploring the Mechanisms of Resistance to Teladorsagia Circumcincta Infection in Sheep through Transcriptome Analysis of Abomasal Mucosa and Abomasal Lymph Nodes. Vet. Res. 2018, 49, 39. [Google Scholar] [CrossRef]
- Moncada, D.M.; Kammanadiminti, S.J.; Chadee, K. Mucin and Toll-like Receptors in Host Defense against Intestinal Parasites. Trends Parasitol. 2003, 19, 305–311. [Google Scholar] [CrossRef]
- Moreno, C.; Sánchez-Ibarrola, A. Receptores Tipo Toll: Bases Moleculares de La Relación Entre Respuestas Innatas y Adaptativas Del Sistema Inmunitario. Rev. De Med. De La Univ. De Navar. 2003, 47, 29–33. [Google Scholar]
- Toscano, J.H.B.; Okino, C.H.; dos Santos, I.B.; Giraldelo, L.A.; von Haehling, M.B.; Esteves, S.N.; de Souza Chagas, A.C. Innate Immune Responses Associated with Resistance against Haemonchus Contortus in Morada Nova Sheep. J. Immunol. Res. 2019, 2019, 3562672. [Google Scholar] [CrossRef]
- Ingham, A.; Reverter, A.; Windon, R.; Hunt, P.; Menzies, M. Gastrointestinal Nematode Challenge Induces Some Conserved Gene Expression Changes in the Gut Mucosa of Genetically Resistant Sheep. Int. J. Parasitol. 2008, 38, 431–442. [Google Scholar] [CrossRef]
- Alti, D.; Sambamurthy, C.; Kalangi, S.K. Emergence of Leptin in Infection and Immunity: Scope and Challenges in Vaccines Formulation. Front. Cell. Infect. Microbiol. 2018, 8, 147. [Google Scholar] [CrossRef] [PubMed]
- Faggioni, R.; Feingold, K.R.; Grunfeld, C. Leptin Regulation of the Immune Response and the Immunodeficiency of Malnutrition. FASEB J. 2001, 15, 2565–2571. [Google Scholar] [CrossRef] [PubMed]
- Wylie, A.R.G. Leptin in Farm Animals: Where Are We and Where Can We Go? Animal 2011, 5, 246–267. [Google Scholar] [CrossRef]
- Valderrábano, J.; Gomez-Rincón, C.; Uriarte, J. Effect of Nutritional Status and Fat Reserves on the Periparturient Immune Response to Haemonchus Contortus Infection in Sheep. Vet. Parasitol. 2006, 141, 122–131. [Google Scholar] [CrossRef]
- Li, Y.; Pu, L.; Shi, L.; Gao, H.; Zhang, P.; Wang, L.; Zhao, F. Revealing New Candidate Genes for Teat Number Relevant Traits in Duroc Pigs Using Genome-Wide Association Studies. Animals 2021, 11, 806. [Google Scholar] [CrossRef] [PubMed]
- Zhong, Y.-J.; Yang, Y.; Wang, X.-Y.; Di, R.; Chu, M.-X.; Liu, Q.-Y. Expression Analysis and Single-Nucleotide Polymorphisms of SYNDIG1L and UNC13C Genes Associated with Thoracic Vertebral Numbers in Sheep (Ovis Aries). Arch. Anim. Breed. 2021, 64, 131–138. [Google Scholar] [CrossRef]
- Ahbara, A.M.; Rouatbi, M.; Gharbi, M.; Rekik, M.; Haile, A.; Rischkowsky, B.; Mwacharo, J.M. Genome-Wide Insights on Gastrointestinal Nematode Resistance in Autochthonous Tunisian Sheep. Sci. Rep. 2021, 11, 9250. [Google Scholar] [CrossRef]
- Carvalho, M.E.; Baldi, F.S.; Santana, M.H.A.; Ventura, R.V.; Oliveira, G.A.; Bueno, R.S.; Bonin, M.N.; Rezende, F.M.; Coutinho, L.L.; Eler, J.P.; et al. Identification of Genomic Regions Related to Tenderness in Nellore Beef Cattle. Adv. Anim. Biosci. 2017, 8, s42–s44. [Google Scholar] [CrossRef]
- Han, Y.; Peñagaricano, F. Unravelling the Genomic Architecture of Bull Fertility in Holstein Cattle. BMC Genet. 2016, 17, 143. [Google Scholar] [CrossRef]
- Poli, J.; Gasser, S.M.; Papamichos-Chronakis, M. The INO80 Remodeller in Transcription, Replication and Repair. Philos. Trans. R. Soc. B Biol. Sci. 2017, 372, 20160290. [Google Scholar] [CrossRef]
- Zhou, B.; Wang, L.; Zhang, S.; Bennett, B.D.; He, F.; Zhang, Y.; Xiong, C.; Han, L.; Diao, L.; Li, P.; et al. INO80 Governs Superenhancer-Mediated Oncogenic Transcription and Tumor Growth in Melanoma. Genes Dev. 2016, 30, 1440–1453. [Google Scholar] [CrossRef] [PubMed]
- Gusareva, E.S.; Twizere, J.-C.; Sleegers, K.; Dourlen, P.; Abisambra, J.F.; Meier, S.; Cloyd, R.; Weiss, B.; Dermaut, B.; Bessonov, K.; et al. Male-Specific Epistasis between WWC1 and TLN2 Genes Is Associated with Alzheimer’s Disease. Neurobiol. Aging 2018, 72, 188.e3–188.e12. [Google Scholar] [CrossRef] [PubMed]
- Eyries, M.; Montani, D.; Girerd, B.; Perret, C.; Leroy, A.; Lonjou, C.; Chelghoum, N.; Coulet, F.; Bonnet, D.; Dorfmüller, P.; et al. EIF2AK4 Mutations Cause Pulmonary Veno-Occlusive Disease, a Recessive Form of Pulmonary Hypertension. Nat. Genet. 2014, 46, 65–69. [Google Scholar] [CrossRef]
- Cun, J.; Liu, Q.; Wang, X.; Di, R.; Hu, W.; Zhang, X.; Zhang, J.; Zhao, Y.; Chu, M. Polymorphism of TSHR Gene and Its Association with the Reproductive Traits in Sheep. Chin. J. Anim. Sci. 2019, 55, 50–54. [Google Scholar]
- Dechairo, B.M.; Zabaneh, D.; Collins, J.; Brand, O.; Dawson, G.J.; Green, A.P.; Mackay, I.; Franklyn, J.A.; Connell, J.M.; Wass, J.A.H.; et al. Association of the TSHR Gene with Graves’ Disease: The First Disease Specific Locus. Eur. J. Hum. Genet. 2005, 13, 1223–1230. [Google Scholar] [CrossRef] [Green Version]


| Trait | Mean | SD a | Min b | Max c |
|---|---|---|---|---|
| Age at recording (days) | 278.04 | 68.71 | 101 | 460 |
| FEC | 1309.98 | 2157.78 | 0 | 37,400 |
| LogFEC | 6.49 | 1.24 | 4.61 | 10.53 |
| Density | SNP | Animals |
|---|---|---|
| 170 | 148 | 454 |
| 507 | 373 | 702 |
| 50K | 29,832 | 375 |
| SNP Name | rs Code c | Variant Type | p-Value | FDR | Chr | Position (bp) a | Candidate Gene b |
|---|---|---|---|---|---|---|---|
| TIMP3_716 | rs159882061 | downstream gene variant | 0.0001 | 0.0056 | 3 | 176,291,630 | TIMP3 |
| TLR5_2276 | rs429546187 | missense variant | 0.0012 | 0.0096 | 12 | 24,624,977 | TLR5 |
| TLR5_786 | rs423611614 | synonymous variant | 0.0026 | 0.0096 | 12 | 24,626,347 | TLR5 |
| LEPR_260 | rs416296450 | intron variant | 0.0026 | 0.0079 | 1 | 40,732,375 | LEPR |
| TLR5_2037 | rs410008645 | synonymous variant | 0.0036 | 0.0096 | 12 | 24,625,096 | TLR5 |
| TLR9_2099 | rs119102850 | synonymous variant | 0.0045 | 0.0229 | 19 | 48,656,461 | TLR9 |
| TLR9_2504 | rs119102857 | synonymous variant | 0.0076 | 0.0229 | 19 | 48,656,866 | TLR9 |
| SNP Name | rs Code | Variant Type | p-Value | FDR | Chr | Position (bp) a | Candidate Gene b |
|---|---|---|---|---|---|---|---|
| OAR12_7879376.1 | rs414871182 | intergenic variant | 0.00124 | 0.0161 | 12 | 6,202,760 | |
| s45225.1 | rs402818177 | intergenic variant | 0.00200 | 0.0280 | 7 | 82,587,686 | +11,375 bp of SYNDIG1L |
| s68231.1 | rs410292582 | intron variant | 0.00551 | 0.0386 | 24 | 3,791,887 | MGRN1 |
| OAR7_50322674.1 | rs427377192 | intergenic variant | 0.00584 | 0.0409 | 7 | 45,569,488 |
| SNP Name | rs Code | Variant Type | p-Value | FDR | Chr | Position (bp) a | Candidate Gene b |
|---|---|---|---|---|---|---|---|
| OAR7_37789204.1 | rs426205150 | intron variant | 0.00002 | 0.0145 | 7 | 33,565,208 | INO80 |
| OAR7_50006482.1 | rs403279855 | intergenic variant | 0.00002 | 0.0145 | 7 | 45,244,213 | |
| OAR7_49479344.1 | rs421671708 | intron variant | 0.00008 | 0.0351 | 7 | 44,708,294 | TLN2 |
| OAR7_97127242.1 | rs412670683 | intron variant | 0.00012 | 0.0388 | 7 | 89,202,663 | TSHR |
| OAR7_36815076.1 | rs407390907 | intron variant | 0.00016 | 0.0405 | 7 | 32,616,683 | EIF2AK4 |
Publisher’s Note: MDPI stays neutral with regard to jurisdictional claims in published maps and institutional affiliations. |
© 2022 by the authors. Licensee MDPI, Basel, Switzerland. This article is an open access article distributed under the terms and conditions of the Creative Commons Attribution (CC BY) license (https://creativecommons.org/licenses/by/4.0/).
Share and Cite
Carracelas, B.; Navajas, E.A.; Vera, B.; Ciappesoni, G. Genome-Wide Association Study of Parasite Resistance to Gastrointestinal Nematodes in Corriedale Sheep. Genes 2022, 13, 1548. https://doi.org/10.3390/genes13091548
Carracelas B, Navajas EA, Vera B, Ciappesoni G. Genome-Wide Association Study of Parasite Resistance to Gastrointestinal Nematodes in Corriedale Sheep. Genes. 2022; 13(9):1548. https://doi.org/10.3390/genes13091548
Chicago/Turabian StyleCarracelas, Beatriz, Elly A. Navajas, Brenda Vera, and Gabriel Ciappesoni. 2022. "Genome-Wide Association Study of Parasite Resistance to Gastrointestinal Nematodes in Corriedale Sheep" Genes 13, no. 9: 1548. https://doi.org/10.3390/genes13091548