Review

Overview of Transcriptomic Research on Type 2 Diabetes: Challenges and Perspectives

by
Ziravard N. Tonyan
1,
Yulia A. Nasykhova
1,
Maria M. Danilova
1,
Yury A. Barbitoff
1,2,3,
Anton I. Changalidi
1,2,4,
Anastasiia A. Mikhailova
1 and
Andrey S. Glotov
1,*
1
Department of Genomic Medicine, D.O. Ott Research Institute of Obstetrics, Gynaecology and Reproductology, 199034 Saint-Petersburg, Russia
2
Bioinformatics Institute, 197342 Saint-Petersburg, Russia
3
Department of Genetics and Biotechnology, St. Petersburg State University, 199034 Saint-Petersburg, Russia
4
Faculty of Software Engineering and Computer Systems, ITMO University, 197101 Saint-Petersburg, Russia
*
Author to whom correspondence should be addressed.
Genes 2022, 13(7), 1176; https://doi.org/10.3390/genes13071176
Submission received: 7 June 2022 / Revised: 24 June 2022 / Accepted: 28 June 2022 / Published: 30 June 2022
(This article belongs to the Special Issue Genetics of Complex Human Disease)

Abstract

:
Type 2 diabetes (T2D) is a common chronic disease whose etiology is known to have a strong genetic component. Standard genetic approaches, although allowing for the detection of a number of gene variants associated with the disease as well as differentially expressed genes, cannot fully explain the hereditary factor in T2D. The explosive growth in the genomic sequencing technologies over the last decades provided an exceptional impetus for transcriptomic studies and new approaches to gene expression measurement, such as RNA-sequencing (RNA-seq) and single-cell technologies. The transcriptomic analysis has the potential to find new biomarkers to identify risk groups for developing T2D and its microvascular and macrovascular complications, which will significantly affect the strategies for early diagnosis, treatment, and preventing the development of complications. In this article, we focused on transcriptomic studies conducted using expression arrays, RNA-seq, and single-cell sequencing to highlight recent findings related to T2D and challenges associated with transcriptome experiments.

1. Introduction

T2D mellitus is a chronic metabolic disease affecting 6.28% of the world’s population and characterized by β-cell dysfunction and persistent hyperglycemia [1,2]. It can lead to many microvascular and macrovascular complications, including kidney failure, diabetic retinopathy, peripheral neuropathy, heart attack, and stroke, which are associated with a worse quality of life in affected people [3,4]. T2D currently has a prevalence rate of 6059 cases per 100,000 and is projected to affect 7079 individuals per 100,000 by 2030. The low quality of life of affected people and the growing incidence of T2D around the world, especially among young people, make T2D one of the main concerns of public health worldwide [2]. A good understanding of the etiological factors and pathogenetic mechanisms is needed to identify risk factors and prevent the development of this disease or delay the onset of its severe complications. The risk assessment of T2D requires the consideration of not only BMI, age, and environmental factors, such as food intake and physical activity, but also inheritance [5]. The candidate-gene study and Genome-Wide Association Study (GWAS) approaches were used to identify a number of loci and genes associated with the risk of T2D and its complicated course [6,7]. The subsequent study of these new loci revealed new molecular mechanisms underlying the disease. Most of them were responsible for insulin sensitivity, β-cell function, and inflammation. However, the found genes explain only about 10% of the heritability of T2D [8,9]. It becomes clear that single polymorphisms cannot explain the pathogenesis of a complex disease and act as an independent risk factor. The main difficulty lies in finding the link between the found variants and phenotypic manifestations, especially if the gene is not directly involved in glycemic regulation. Moreover, variants of low minor allele frequency that could make a significant contribution to the development of T2D may not be captured by GWAS, which makes the problem of “missing heritability” relevant [10]. Most of the loci identified are located in non-coding regions and play a regulatory role in the control of gene expression [11]. The main purpose of such studies is the development of risk assessment tools for the prediction of T2D and its complications, including the construction of the polygenic risk scores, both based solely on T2D-associated SNPs and adjusted for gender, age, anthropometric measurements, and laboratory parameters. Accounting for numerous trait-associated alleles and non-genetic factors made it possible to increase the predictive power of the models, with the relative performance estimated as areas under receiver operating characteristic curves, whose values increased from 0.571 to 0.901 [12]. However, there are several limitations that might impede the implementation of these instruments in practice. Most of the studies were performed on European populations, and large-scale studies covering people with T2D worldwide are needed due to possible ethnic differences. Another challenge to the application of the polygenic risk score is the interpretation of the results, which requires the consideration of non-genetic risk factors in patients [13]. Moreover, these factors (BMI, age, family history, diet, physical activity), in combination with the laboratory markers of glycemia, can be crucial for determining the individual risk of T2D [14]. Nonetheless, the study of gene expression and epigenetic modifications in people with T2D, coupled with the identification of the rare genetic variants using the approaches of whole genome, whole exome, or target genes sequencing in them, have the potential to fill the gap between the genotype data and the phenotype in diabetic individuals, which will eventually allow for an understanding of genomic function [15]. Therefore, in the last decade, much attention has been paid to studies on transcriptome analysis in T2D patients (Table 1). Transcriptome studies analyze the sum of all RNA transcripts present in an organism. Currently, three main methods are in use for transcriptome analysis: microarray, RNA sequencing, and single cell sequencing. We reviewed the main advantages and shortcomings and also discussed the most promising findings of them and the challenges researchers face when choosing these approaches.

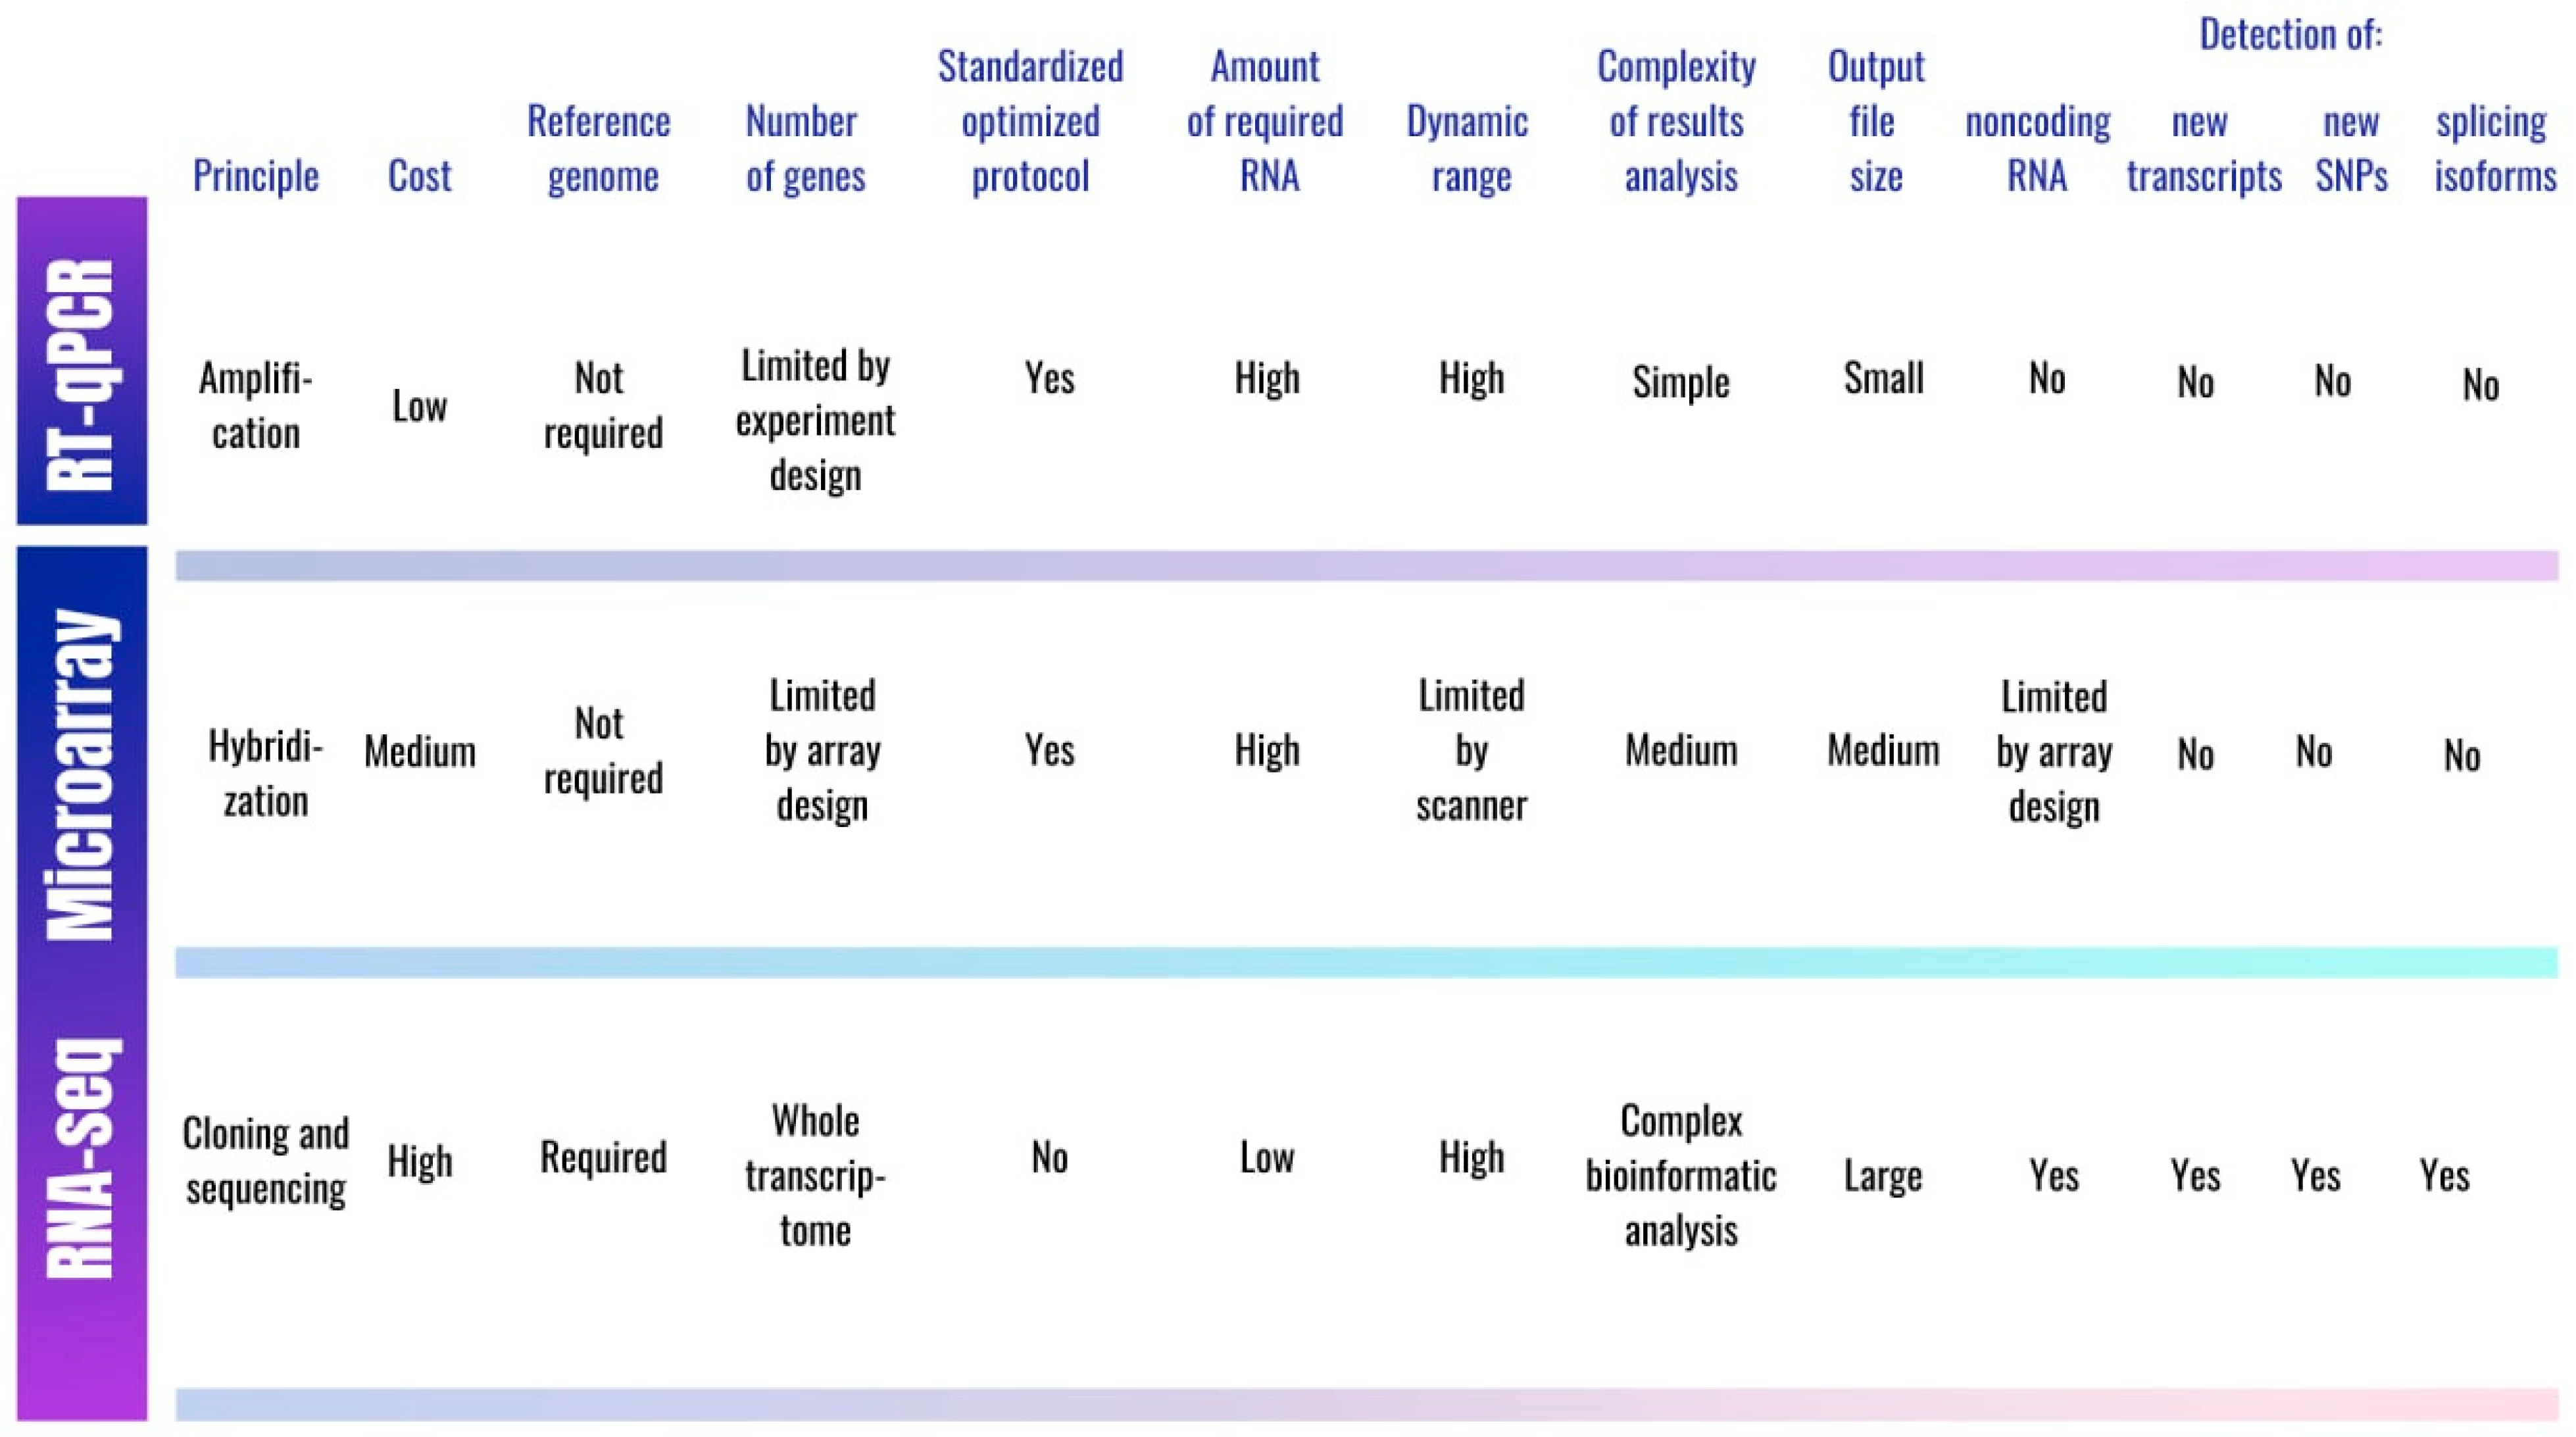
2. Approaches for Assessing Gene Expression in T2D

To evaluate gene expression, several methods are widely used in molecular biology, including both conventional (northern blot, RT-qPCR, expression arrays) and more advanced (RNA-seq, single-cell sequencing) technologies (Figure 1).
Northern blot, developed in 1977, is one of the first methods used by researchers to analyze gene expression in T2D patients [46]. It includes the separation of RNA by gel electrophoresis and subsequent hybridization with a probe labeled with chemiluminescent [47]. Even though northern blot is quite cheap and easy to perform and has a high specificity, its sensitivity is lower compared to that of RT-qPCR [48]. Compared to expression arrays, the northern blot is inferior in terms of the number of simultaneously analyzed genes, but its sensitivity is higher [49]. Today, the northern blot is not widely used in the clinic due to the relatively low sensitivity and slow analysis; its use for scientific purposes is also limited [50].
Among the variety of methods applied over time to analyze the expression of genes associated with T2D, quantitative reverse transcription polymerase chain reaction (RT-qPCR), DNA microarrays, and RNA-seq are the most preferred. RT-qPCR is a reliable and widely used technique for analyzing the expression level of target sequences. It is highly sensitive and specific, relatively cheap, allowing for the analysis of large samples, and it does not require a long and multi-stage sample preparation [51]. One of the difficulties in conducting an RT-qPCR experiment is the choice of a reference gene that is expressed relatively constant in tissues, since the accuracy of the results depends on it [52]. RT-qPCR provides reliable data and is used to validate the results of NGS or microarray experiments. It should be noted that the RT-qPCR approach application for expression analysis makes no allowance for the detection of new transcripts, and it also requires hypotheses, pre-designed probes, and, therefore, thorough experiment planning.
A gene expression array (or DNA microarray) is a technology that has been successfully used for measuring and analyzing gene expression for over a decade. The principle of the approach is to hybridize the fluorescently labeled complementary DNA from the control and experimental samples to oligonucleotides attached to a solid surface of the array [53]. The crucial limitation of this approach arises from microarray probes design based on the reference genome. Low binding specificity, leading to cross-hybridization and background signals, may substantially affect the results of the study [54]. The repetitive or related sequences, alternatively spliced transcripts, and SNPs cannot be analyzed using DNA microarray. In addition, the variety of microarrays used by researchers while conducting experiments reduces the reproducibility of the data obtained [55]. Despite the shortcomings, gene expression arrays are still in demand, since microarray technology is cheaper than NGS, and the sample preparation process is simpler and more “traditional”, which allows for the analysis of a relatively larger number of samples. The main stages of the analysis of data obtained using expression arrays include quality assessment and normalization. The main challenge in the analysis of microarray data is to find patterns of differential expression that are able to characterize the difference between samples. Today, two main approaches are used: the first is to identify individual DEGs; the second involves the identification of functionally related gene sets with an altered expression. There are many commercial tools and open-source software packages for finding DEGs in microarray experiments [56]. The main tool for the second approach is Gene Set Enrichment Analysis (GSEA) software. Overrepresented functions are revealed when comparing DEGs against the rest of the genome or when performing a GSEA that assigns ranks to each gene in the transcriptome depending on the differential expression level [57].
Over the past few years, RNA-seq has become a standard approach for gene expression measurement. Initially, the Sanger sequencing method was used for cDNA sequencing, but it was soon replaced by next generation sequencing (NGS). In addition, the Sanger sequencing method was not suitable for the analysis of transcript expression [58]. One of the main limitations of RNA-seq is the high cost, as well as the long and complex sample preparation process, which reduces the sample size. Another difficulty in conducting such an analysis is the lack of optimized standard protocols, as well as the large output file sizes [59].
However, the benefits of this method greatly outweigh its disadvantages. For instance, unlike RT-qPCR and expression arrays, RNA-seq does not require a priori sequence information, which allows for the identification of new splice-variants, SNPs, novel transcripts, and non-coding RNAs [60]. The first stage of RNA-seq results analysis is quality control, including read trimming (the removal of adapter sequences, reads with poor quality, and duplicated reads) and the analysis of sequence quality and GC content [61]. The next step is read alignment to the genome (in case novel transcript discovery is required) or annotated transcriptome (when novel transcript discovery is not needed) and subsequent read counting using various tools for within-sample normalization [62]. Several software tools are available today to analyze DEGs in RNA-seq experiments (DeSeq2, SAMseq, NOISeq, EBSeq, Sleuth, baySeq, edgeR, limma-vomm, etc.). The choice of method mostly depends on the goals, the sample size, and the number of replicates. When comparing the DEGs software tools, the NOIseq, DESeq2, and limma+vomm methods present the best levels of specificity. However, an optimal method for determining DEGs when conducting an RNA-seq experiment is still lacking, so it is recommended to combine different tools to obtain more reliable results [63]. The final step is to assess the biological functions of DEGs as well as the molecular pathways in which they are involved, using the GSEA software [62].
While expression arrays and RNA-seq make it possible to analyze an incomparably larger number of genes, the results of experiments conducted using these methods require validation by RT-qPCR.
Single-cell sequencing technology became widespread in recent years. This method has a number of advantages over standard RNA-seq: it allows for the study of cell population structures, the identification of the functional and developmental heterogeneity of the cell population, and the distinguishing of a small number of cells [64]. The single-cell phenotyping of transcriptome changes has the potential to detect the expression of cell-specific genes and possibly identify new cell subtypes. The search for DEGs during single-cell experiments is challenging because the data obtained differ significantly from the bulk RNA-seq data due to high heterogeneity, small total read counts, and a large number of zero counts [62,65]. Usually, single-cell libraries are aligned to the reference transcriptome. Both standard software for bulk RNA-seq (DESeq2, edgeR) and special tools for single-cell sequencing (D3E, DEsingle, MAST, Monocle2, SigEM, SCDE, scDD, SINCERA) are used for the analysis. A comparison of these methods showed that special tools do not significantly outperform the standard ones. All the tools have their own advantages and limitations, but none of them meet today’s requirements for solving single-cell sequencing problems, so the search for a precise analysis method continues to this day [66].

3. Transcriptome Studies in T2D

The pathogenesis of T2D is not completely understood. The significance of immune inflammation and lipid metabolism in the development of T2D [67] has been described repeatedly; however, transcriptomic studies allow for the supplementation of the available information on potential pathways that are involved in the pathogenesis of diabetes or are affected in T2D patients—for example, the ubiquitin-proteasome system, cell-cycle pathways, and cancer signaling. Supplementary Table S1 presents the main DEGs and biological processes identified by transcriptome studies.

3.1. DEGs Involved in Lipid Metabolism

Adipose tissue plays a significant role in the development of insulin resistance in T2D [68]. According to modern concepts, the role of adipose tissue in the pathogenesis of diabetes comes down to the accumulation of excess lipids in the liver and to inflammation accompanied by inflammatory cytokine production, leading to impaired insulin signaling [69]. A recent RNA-seq study in visceral adipose tissue showed the reduced expression of genes responsible for fatty acid synthesis and mitochondrial function and the increased expression of genes associated with innate immunity and transcriptional regulation in obese diabetic women [39]. While this study was mainly focused on visceral adipose tissue, Saxena and colleagues directed their attention to peripheral subcutaneous adipose tissue. The researchers compared expression profiles in thigh subcutaneous adipose tissue cells in 30 diabetic patients and 30 controls. A total of 971 differentially expressed genes (DEGs) were found. Pathway enrichment analysis revealed immune and inflammatory response signaling pathways, including the HIF-1 signaling pathway, activated in the obesity-induced chronic hypoxic state and involved in the regulation of proinflammatory cytokines, endothelial NO synthase, insulin signaling, and gluconeogenesis [70,71]. The upregulation of elements of the inflammatory NF-kappa B signaling pathway was also determined, which allowed for the conclusion that subcutaneous adipose tissue was inflamed in T2D patients and visceral fat along with the activation of other inflammation-related pathways. Additionally, pathways were found to be directly involved in fat metabolism (AMPK signaling pathway, Adipocytokine signaling pathway) and glucose metabolism (insulin signaling pathway, PI3K-Akt pathway) [27].
Saxena and colleagues repeated the comparison of the expression profiles of femoral fat in T2D patients and healthy controls using RNA-seq and found an altered expression for 2752 genes and 65 miRNAs. The expression of 10 genes was validated by qPCR (AKT2, BCL6, LIPE, METTL9, CD59, LMNA, FOS, CCL2, MUSTN1, ZNF638). Pathway enrichment analysis revealed the activation of pathways involved in glucose and lipid metabolism, such as the PPAR signaling pathway, and related to cholesterol metabolism, glycolysis/gluconeogenesis, fatty acid degradation, and maturity-onset diabetes of the young. These findings confirmed the results of a previous microarray study. Regarding the found miRNAs, eight of them (miR-133B, -210, -22, -25, -27A, -27B, -30E, -503) were associated with obesity, inflammation, T2D, and its microvascular complications, such as diabetic nephropathy and retinopathy [40].
Plasma free fatty acids are known as one of the causes of peripheral insulin resistance [72]. The RNA sequencing of palmitate-treated pancreatic cells of human donors without diabetes demonstrated an expression of 86% (56) of 69 preselected T2D-associated candidate genes, according to previous GWAS. Genes whose expression level was modified by palmitate exposure acted as regulators of cell death and morphology, cellular movement and development, gene expression, molecular transport, lipid metabolism, ubiquitin, and proteasome function. An important finding of the study is the inhibition by palmitate of the transcription factors PDX1, PAX4, MAFA, and MAFB, which play a key role in the development of insulin-producing β cells [73].
The combined analysis of gene expression and lipidomics in T2D patients is especially important for understanding the complex relationship between the lipid profile and the development of T2D. The results of integrated lipidomics and transcriptomic analysis revealed a correlation between the altered lipid profile and significantly enriched pathways in the peripheral blood of T2D individuals. The most significant pathways were one carbon pool by folate, arachidonic acid metabolism, and the insulin signaling pathway [19]. Since it is sometimes difficult to draw a direct connection between research findings and T2D and to assess the significance of the found association, comprehensive studies of the kind will allow for the identification of non-obvious relationships which could go unnoticed during isolated gene expression profiling.

3.2. DEGs Belonging to Ubiquitin–Proteasome System

A gene expression analysis in pancreatic islets cells using DNA microarrays, performed by Bugliani and colleagues, demonstrated the differential expression of 1285 genes enriched in 23 pathways and numerous functions. Among them, the ubiquitin–proteasome system was consistently affected in the islets of diabetic individuals compared to the controls. A total of 30 genes encoding ubiquitin-conjugating and ubiquitin-ligating enzymes were downregulated, and 4 upregulated genes belonged to the E3 (ubiquitin-ligating) family. Additionally, the expression of UCHL1, USP 1, 16, 46, and COPS 2, 3, and 5, responsible for deubiquitinating enzymes, was downregulated. The differential expression of UBE2K, UCHL1, and PSMB7 was confirmed by RT-qPCR. Subsequent immunohistochemistry demonstrated a significantly higher number of β-cells positive for ubiquitination and lower proteasome activity in T2D islets, thus confirming previous findings. The researchers suggested that reduced proteasome activity may impact insulin secretion by islet cells [20]. The expression of genes of the ubiquitin–proteasome system (UBE2H, UBE3A, USP2, USP54, USP30) was also inhibited in palmitate-treated pancreatic cells, which supports the theory of Bugliani and colleagues regarding the significant influence of proteasome activity on insulin secretion by β cells [73].

3.3. DEGs Involved in Immune Response

Corbi and colleagues described DEGs implicated in cell-to-cell signaling and interactions, cellular movement, immune cell trafficking, inflammatory response, and other networks in circulating the lymphocytes and monocytes of T2D individuals with dyslipidemia and periodontitis. Moreover, the DEGs for patients with poorly or well-controlled glycemia were different, which may be of interest for the targeted therapy of T2D. The study once again demonstrated the importance of inflammation in the development of T2D [28]. Using the association rule mining method, the authors analyzed microarray data and identified CDC42SE2 as a DEG in patients with decompensated T2D, dyslipidemia, and periodontitis—chronic inflammatory diseases [29]. An increased expression of RELA, the p65 subunit of the NF-kappa-B complex which regulates DNA transcription, cell survival, and immune response to infection, were also revealed in gingival tissue affected by periodontitis in T2D patients [74]. The activation of components of the NF-kB signaling pathway was also noted in a study by Saxena et al. [27] and by Lv and colleagues [37]. In an RNA-seq study performed by Lv et al., LRRC19, activating NF-kB and stimulating pro-inflammatory cytokines synthesis, was one of the significant DEGs involved in the pathogenesis of T2D.
Another study demonstrated 76 overexpressed genes and 222 suppressed genes common in Han and Kazak Chinese diabetic patients compared to healthy controls. Downregulated genes were mostly enriched in immune response processes such as granulocytes and T-lymphocytes activation and involved in antigen processing pathways. The upregulated genes were associated with fatty acid and carbon metabolism. It seems interesting that, despite the presence of many common networks, the genetic patterns differ in the Han and Kazak Chinese patients, which allows for conclusions to be drawn about the differences in the gene expression in different populations [26]. The overexpression of the HLA-DQA1 and HLA-DQB1 genes encoding subunits of MHC class II molecules, which are responsible for antigen presentation by immune cells, was demonstrated in T2D individuals, proving the commonality of immune response activation in T1D, T2D, and latent autoimmune diabetes in adults. The activation of genes associated with the IL-5, IL-6, and IL-17 signaling pathways, as well as with T-cell immune response in patients with well-controlled T2D when compared with poorly controlled T2D, may indicate a better regulation of the immune response in patients with well-controlled T2D [23]. On the other hand, such expression changes can be considered as a potential prognostic marker for the assessment of the effectiveness of hypoglycemic therapy in the future.
Neutrophils are known to play an important role in the development of immune inflammation. In the analysis of the expression profile in neutrophils from T2D patients and healthy controls, 1990 upregulated and 1314 downregulated DEGs were found. The upregulated DEGs were mainly involved in myeloid leukocyte activation, T-cell activation, the adaptive immune system, cytokine production, the immune response-regulating signaling pathway, the cytokine-mediated signaling pathway, immunoregulatory interactions between a lymphoid and a nonlymphoid cell, and the immune response–regulation pathway. The downregulated genes were related to inflammatory response, interleukin-10 signaling, the regulation of cytokine production, and cytokine–cytokine receptor interaction [38].
To shed light on the mechanisms of neutrophil involvement in the inflammatory process in T2D, Kleinstein and co-authors also performed RNA-seq transcriptomic analysis. Having compared the expression profiles of neutrophils in 11 diabetic patients and 7 healthy controls, the authors identified 50 DEGs. The SLC9A4, NECTIN2, and PLPP3 genes with the most altered expression in T2D patients were significantly downregulated. Most of the discovered genes are involved in the inflammatory process, as well as in lipid metabolism. The expression of the GNPDA1 gene was shown to be associated with glucose metabolism [41].
A study performed by Grayson and colleagues discovered the dysregulation of genes associated with T-cell-activation and signaling in T2D individuals compared with healthy controls, once again providing evidence of the involvement of the immune system and cell-mediated immunity in the pathogenesis of T2D [17].
In an analysis of skeletal muscle expression profiles in 271 individuals with glucose tolerances ranging from normal glucose metabolism to clinical manifestation of T2D, the UBN1 (ubinuclein 1) gene was the most differentially expressed [33]. To our knowledge, this gene has not previously been described as associated with T2D or glucose metabolism.
Coronary artery disease (CAD) is a common comorbidity in T2D and is one of the leading causes of death in diabetic patients worldwide [75,76]. In this regard, the results of studies aimed at searching for common expression patterns in individuals with T2D and CAD are of particular interest. According to Gong and colleagues, T2D and CAD patients indeed show similar features of expression profiles in PBMC. Among the overlapping DEGs, genes enriched in terms of viral infectious cycle, anti-apoptosis, endocrine pancreas development, blood coagulation, and innate immune response were the most significant. When comparing the T2D group of patients with healthy controls, the most significant genes were those involved in the G1/S transition of the mitotic cell cycle, blood coagulation, inflammatory response, endocrine pancreas development, and viral reproduction [34]. Previously, researchers also identified common DEGs in CAD and T2D. These included IL2RA, TNFRSF1A, and MAPK11 [17], involved in a huge number of cellular processes such as proliferation, differentiation, and transcription regulation. These data once again prove the significant role of inflammation in the pathogenesis of T2D and indicate a complex interplay in the development of T2D and CAD.
The endothelial dysfunction, inevitably leading to atherosclerosis, CAD, and microvascular complications, is known to often accompany T2D [77]. The comparative analysis of gene expression in the endothelial cells of T2D individuals and healthy controls revealed 51 upregulated and 101 downregulated DEGs associated with metabolism and growth pathways [36]. It is evident that the analysis of endothelial cells is not possible in routine practice to identify risk groups for cardiovascular complications in T2D patients. However, this study straightens out the mechanisms involved in endothelial dysfunction and the development of macro- and microvascular complications in T2D.

3.4. DEGs Participating in Cancer Signaling and Cell-Cycle Pathways

Also of interest is the upregulation of the cancer signaling pathway, which was observed repeatedly in patients with T2D. For instance, differentially expressed genes in T2D patients and healthy controls were analyzed using microarray technology in the Pakistani population. A total of 1017 genes were downregulated and 640 were upregulated when comparing these two groups. However, the small sample size in this study should be considered (two representatives from each study group). Among the differentially expressed genes identified by the pilot study were those involved in the molecular mechanisms of cancer, cell cycle, DNA replication, recombination and repair, cellular growth and proliferation, cell-to-cell signaling and interaction, and others. Canonical pathway analysis revealed important signaling pathways: insulin receptor signaling, apoptosis signaling, p53 signaling, molecular mechanism of cancer, and cell cycle regulation pathways. The suppression of the p53 tumor suppressor protein gene and the dysregulation of protooncogene MYC in diabetic patients clearly support the theory of an association between T2D and cancer incidence [30]. The data obtained appear consistent with results of other studies on the subject. For instance, the cancer signaling pathway was shown to be the most upregulated pathway in elderly individuals with T2D compared to older people without T2D. In addition, this study also confirmed immune inflammation in T2D, showing the upregulation of T-cell activation and migration and inflammation pathways [31]. These findings reaffirm existing evidence of an increased risk of cancer among T2D patients due to hyperinsulinemia, hyperglycemia, or chronic inflammation [78].
The differential expression of cell cycle genes in the neurons, astrocytes, endothelial cells, and blood cells of diabetic patients was demonstrated by several studies [30,32,36]. The microarray study conducted by Taneera and co-authors was devoted directly to the analysis of the expression profile of cell cycle genes in the islet cells of T2D individuals and healthy controls. The authors reported altered gene expression for cyclins, a cyclin-dependent kinase, and a cyclin-dependent kinase inhibitor. The expression of CCND1, CDK18, and CDKN1A was upregulated, while CCND3 and CDK5 were downregulated in T2D patients compared to controls. Moreover, the CCND1 and CDK1A expression levels were shown to correlate with HbA1C levels. CCND3 expression correlated with both HbA1C and insulin secretion. The expression levels of CDK5 and CDK18 positively and negatively correlated with insulin secretion, respectively. An interesting finding of the study was the effect of age on the expression of the CDKN1A, CDKN2A, CCNI2, CDK3, and CDK16 genes [22].

3.5. DEGs in T2D Complications

A better understanding of the gene expression changes’ role in diabetic complications might provide novel insights into the genome function mechanisms in T2D, making it possible to define the risk groups for a severe course of disease and to prevent its microvascular and macrovascular complications. The CD44 and CCL5 genes were found to be associated with wound healing in diabetic patients when analyzing the transcriptome of dermal lymphatic endothelial cells [79]. CCL5 is a chemokine that is a chemoattractant for inflammatory cells that release pro-angiogenic factors, stimulating wound vascularization [80]. The transmembrane protein CD44 is also responsible for wound healing, angiogenesis, and immune modulation [81]. Previously published data on the increased concentration of CD44 in the serum of patients with insulin resistance provide hope for the possibility of using this molecule as a potential predictive marker for the development of diabetic complications [82].
Wu and colleagues compared the expression profiles in the skin of 74 T2D patients and 148 healthy controls. The results indicate the involvement of genes responsible for the immune response (CCL20, CXCL9, CXCL10, CXCL11, CXCL13, CCL18), as well as the tumor necrosis factor superfamily and infectious disease pathway genes. The data obtained from RNA-seq correlated with the results from microarray datasets processed in the same way [35]. The overexpression of genes associated with immune response and inflammation in the skin of T2D individuals is consistent with the idea of immune inflammation underlying T2D skin manifestations [83].
The differential expression of 320 genes was found while performing transcriptional profiling comparing the blood-derived RNA of Mexican patients with diabetic retinopathy and T2D individuals without this complication. Confirmation by RT-PCR and cDNA sequencing revealed differential splicing in the TUBD1 gene encoding Tubulin delta 1. The co-expression of the a and b transcript isoforms was shown to be protective against diabetic retinopathy in T2D patients. The co-expression of the isoforms a, b, and d increased the risk of developing non-proliferative retinopathy, and the absence of the co-expression of the a and b isoforms was associated with the risk of proliferative retinopathy. A conclusion was made about the possible use of TUBD1 gene transcriptional isoforms as a biomarker for the presymptomatic diagnosis of diabetic retinopathy [25].
To reveal the pathogenesis of neuronal and endothelial damage in T2D, which potentially leads to diabetic neuropathy and dementia, Bury et al. conducted a study on cortical neurons, astrocytes, and endothelial cells, in which 912, 2202, and 1227 genes were shown to be differentially expressed, respectively, when comparing diabetic and nondiabetic patients. The expression level of the selected genes was confirmed using the NanoString nCounter platform. The most significant among them were DDIT3, H2AFX, HMOX1, NQO1, COX5B, GRIN1, and TF. The expression and localization of proteins encoded by the COX5b, NDUFb6, TGFβ1, FOXO3a, and p53 genes in neurons were validated using immunohistochemistry analysis. The affected signaling pathways included the HIF-1 signaling pathway, the insulin signaling pathway, cell cycle, cellular senescence, and oxidative phosphorylation signaling. The activation of these neuronal signaling pathways can be associated with neuronal dysfunction in dementia, and changes in the gene expression in astrocytes and endothelial cells indicate that T2D also impacts non-neuronal cells in the central nervous system [32].

3.6. The Role of Ethnic Differences

Of particular interest are studies on the gene expression in different ethnicities representatives, since it is known that African American origin is a risk factor of T2D development [84]. The results of a comparative analysis of the expression profiles in the white blood cells of African American and Caucasian origin subjects demonstrated statistically significant differences. The communication between innate and adaptive immune cells and primary immunodeficiency signaling pathways was significantly downregulated in African American subjects, while the complement system and interferon signaling pathways were downregulated in individuals of Caucasian origin. The researchers also found common patterns specific to T2D patients. Thirty DEGs were detected when compared with the control group. The expression of ABCA1, ALAS2, IL4, IL8, and PTGS2 was validated by qPCR. The identified DEGs were implicated in immune responses, lipid metabolism, and organismal injury/abnormality [18].

3.7. Early Expression Changes

To identify the specific expression patterns of insulin resistance, a transcriptomic profile of peripheral blood mononuclear cells was analyzed in healthy subjects with extremes of the distribution of HOMA-IR. A total of nine genes from Adrenergic Signaling in the CardioMyocytes pathway with a significantly altered expression in PBMC (ADCY9, TNNI3, RAPGEF3, CACNA1S, CACNG3, ADRA1B, CAMK2D, PPP2R3C, PPP2CA) were identified when comparing subjects with extreme insulin resistance or sensitivity. The function of these genes is to regulate calcium influx, cell growth, and apoptosis [24]. Even though these genes are not directly involved in the regulation of glucose homeostasis, this finding in healthy and young individuals provides an opportunity for the further search for genetic markers of the risk of developing T2D.
The search for expression changes common for T2D and impaired fasting glucose brings us closer to universal biomarkers that allow for the identification of risk groups for developing T2D. These biomarkers can include both DEGs and circulating miRNAs. Cui and co-authors found the overexpressed TAF1 gene and downregulated MAFK as common nodes in T2D individuals and subjects with impaired fasting glucose [85]. The TAF1 gene was associated with insulin resistance and glycated hemoglobin and was overexpressed in obese T2D subjects in previous studies [86,87]. The MAFK gene may also play an important role in T2D pathogenesis, as it regulates numerous β-cell-related genes [88]. The researchers also found common dysregulated miRNAs: miR-29a, miR-144, and miR-192 [85]. The dysregulation of these microRNAs has already been described in previous studies comparing T2D subjects and healthy controls [89].

3.8. MicroRNA Expression Changes

Over the past decade, researchers repeatedly demonstrated miRNA expression changes in T2D. The availability of circulating miRNAs makes them promising biomarkers for the presymptomatic diagnosis of T2D. The expression profile changes of multiple circulating miRNAs were demonstrated in studies on diabetic patients [89,90]. MiR-29a, miR-144, miR-375, and miR-34a are among the most studied miRNAs in T2D patients. MiR-375 is highly expressed in pancreatic islets [91], whole blood [92], plasma [93], and serum [94], and it is involved in insulin secretion and glucose homeostasis [95]. MiR-34a regulates the inhibition of cell-cycle progression and the induction of apoptosis, associated with p53 function [96]. The expression changes of miR-34a were also detected in the PBMC [97], serum [94], and plasma [98] of diabetic patients. The target gene for miR-29a and miR-144 is IRS1, a mediator between the insulin receptor, insulin-like growth factor 1, and PI3K/AKT intracellular signaling pathway elements involved in the translocation of GLUT4 into the plasma membrane for glucose transport [99,100,101]. According to early studies, miR-144 was found in serum [102], plasma [103], muscle [104], and whole blood [92]. MiR-29a, in turn, was expressed in all insulin-dependent organs and tissues [105]. Altered levels of miR-29a were also detected in plasma [106], serum [95], and whole blood [92].

4. Common Features of Gene Expression in Type 1 Diabetes and Gestational Diabetes Mellitus

An interesting finding was described by Chinese authors who showed that a decreased expression of jun proto-oncogene (JUN) and the upregulation of interleukin 1β (IL-1β) in peripheral blood may have a prognostic value for T2D development in children [107]. Interestingly, the differential expression of the IL1B gene has already been described in children with T2D by Kaiser and colleagues. The study analyzed the expression profiles in children with type 1 diabetes (T1D) and T2D. The comparison showed that the IL1B gene belongs in common for T1D and T2D DEGs, while the expression of MYC is significantly increased in T1D children when compared with T2D children [16]. IL-1β plays a significant role in the pathogenesis of diabetes, as it is known to regulate the inflammatory process, leading to β-cell death [108].
The search for common pathogenetic mechanisms and prognostic markers for T1D and T2D is also of particular interest. Gao and colleagues compared the T1D and T2D expression profiles with healthy controls. The MGAM and NAMPT genes had a high predictive value for T2D. PNP and CCR1 were common DEGs for T2D and T1D [109]. To date, there are no studies to explain the relationship between the PNP gene and diabetes, but it is known that antagonists of CCR1 (C-C chemokine receptor type 1) can inhibit the recruitment of monocytes and lymphocytes into the renal interstitium and thus have a beneficial effect in slowing down the development of diabetic nephropathy [110]. The suppression of CCR1 also attenuates neuropathic pain in diabetic mice [111]. MGAM (maltase-glucoamylase) is known to modulate gluconeogenesis and has a high hydrolytic activity against glucose oligomers [112,113]. The NAMPT gene was also repeatedly reported as associated with T2D and obesity [114].
In another microarray study, the expression profiles in the peripheral mononuclear blood cells of patients with T1D were closer to gestational diabetes mellitus (GDM) as compared to T2D. The DEGs common to T1D, T2D, and GDM were 22 genes, 7 of which (EGF, FAM46C, HBEGF, ID1, SH3BGRL2, VEPH1, and TMEM158) proved to be the most significant [21]. The epidermal growth factor (EGF) was shown to regulate insulin secretion, and its level was reduced in diabetic mice [115]. FAM46C, being a target gene for miR-657, is involved in the pathogenesis of GDM by regulating macrophage proliferation and migration and thus modulating the inflammatory response in GDM [116]. The heparin-binding EGF-like growth factor encoded by the HBEGF gene is crucial for glucose-stimulated β-cell proliferation, as demonstrated in rats [117]. The DNA-binding protein inhibitor ID1 was found in the islets of diabetic mice and is also associated with diabetes. ID1 knockout plays a protective role and prevents the development of glucose intolerance and the loss of b-cell gene expression induced by a high-fat diet [118]. Rs9352745, the expression quantitative trait locus for SH3BGRL2 gene, is associated with gestational weight gain [119]. This may partly explain the excess weight gain during pregnancy in patients with GDM. The role of the VEPH1 gene in the development of diabetes has not yet been studied, but Melted, an ortholog of VEPH1 in Drosophila, is known to be involved in insulin/PI3K signaling [120]. The role of the last gene, TMEM158, in the pathogenesis of T2D has yet to be studied. Despite the lack of a comprehensive theory that fully explains the significance of the aforementioned genes in the development of T2D, T1D, and GDM, the search for common mechanisms can contribute to the improvement of approaches to the prevention and precision treatment of diabetes.

5. Findings from Single-Cell Sequencing Studies

Great knowledge about the processes undergone directly in the pancreas was obtained from single cell studies. Using this new technology, researchers have shown the high proliferative capacity of multipotent pancreatic progenitor cells, as well as their developmental heterogeneity and dedifferentiation processes in adult T2D individuals. Segerstolpe et al. applied another approach to the transcriptome analysis of pancreatic islet cells. The single-cell transcriptome profiling of endocrine and exocrine pancreatic cells obtained from six healthy controls and four T2D donors revealed the downregulated expression of INS and FXYD2 genes and the overexpression of GPD2 and LEPROTL1 in the β-cells of T2D individuals. All of the genes were previously reported to be involved in T2D pathogenesis through modulating insulin secretion and regulating body weight. The expression of PCSK1N and SCG5 was found to correlate with the body mass index in all cell types of the pancreatic islets [42].
A similar conclusion was reached by Lawlor and colleagues, who also found a decreased expression of INS along with STX1A in T2D β-cells compared with nondiabetic donors. Both detected genes play a significant role in insulin secretion by β-cells. Among other things, the researchers also found an upregulated expression of CD36 and a downregulated expression of GDA in α-cells. CD36, a fatty acid transporter, was previously shown to be associated with diabetes, while the role of LAPTM4B and RCOR1, significantly dysregulated in δ-cells, remains unclear and requires further investigation [45,121].
Another study based on a single-cell RNA-seq of islet cells from 6 diabetic and 12 non-diabetic organ donors revealed the dysregulated expression of 54, 48, 119, and 33 genes in α-, β-, and δ-cells and PP cells, respectively. Most of them have an unknown function (28%) or are related to non-islet cell growth (38%) or another non-islet cell function (26%) [43].
A study comparing the α- and β-cell expression profiles of T2D donors and children showed intriguing results [44]. One of the main findings of the study reveals that the islet cells’ expression profile in child donors had immature gene signatures. Indeed, islet cell differentiation is known to complete after maturation in the postnatal period [122]. The expression profiles in T2D donors were partially like those in children, demonstrating the dedifferentiation process that causes the dysfunction of insulin secretion, which may be one of the key mechanisms in the development of T2D, along with insulin resistance. The dedifferentiation of β-cells into a multipotent progenitor state may be caused by hyperglycemia, as previously shown (glucose toxicity) [123]. However, the expression profiles of β-cells in healthy old and young mice are very similar, which may indicate that the processes of β-cell dedifferentiation occur not only under the influence of hyperglycemia but also in the normal state [124].
According to the results of another single-cell study on islet cells from mice, the differentiation and increase of β-cells are regulated by reactive oxygen species and Srf/Jun/Fos transcription factors [125]. At the same time, heterogeneity in the regulation of genes responsible for functional maturation and endoplasmic reticulum (ER) stress was also found in the β-cell population [126]. It was shown that the loss of functional b-cell mass due to the dedifferentiation of β-cells and their loss of maturity might be in response to ER stress [127]. Since recent studies have shown the reversibility of the dedifferentiation process, this gives hope that suppressing ER stress will help to restore lost functions.
Interestingly, a single-cell study performed on isolated β-cells from healthy donors also showed islet cell dedifferentiation and transdifferentiation. In particular, insulin-secreting cells showed a low expression level of β-cell genes and an overexpression of progenitor markers. β-cells were assumed to be in a plastic state and undergo dedifferentiation during isolation and ex vivo cultivation [128]. Additionally, researchers showed an independent accumulation of genetic aberrations and transcriptional noise in islet cells with age [129]. Undoubtedly, these age-related changes can affect, among other things, the endocrine function of the pancreas, which can partly explain the development of T2D in middle-aged and older adults.
Later, in another single-cell study, pancreatic cells (in particular, progenitor ductal cells) from human donors demonstrated developmental heterogeneity [130]. An important conclusion of this work is that, in addition to exocrine and endocrine progenitors, there may be a ducto-endocrine differentiation gradient. In addition, these cells were found in the pancreas of T1D and T2D donors regardless of disease duration. The possibility of stimulating these cells in vivo opens new opportunities for further pharmacological research and the elaboration of novel therapeutic approaches. The results of recent research put before us the forgotten concept of the plastic state of ductal progenitor cells capable of differentiation into facultative progenitors and dedifferentiation [131].
Single-cell transcriptomic studies on islet cells have become one of the most popular molecular methods in the study of T2D in the past years, since it requires a relatively small amount of material and allows for the determination of the expression signatures of individual cells, including those with a low abundance. One of the main difficulties in conducting a single-cell experiment is the choice of sample preparation protocol. Bonnycastle and colleagues demonstrated the importance of proper fixation and the cryopreservation of islet cell samples for further single-cell sequencing. The researchers found significant differences in the proportion of the detected cell types, as well as in the specific patterns of gene expression in the islets prepared for a single cell experiment using different protocols [132]. This indicates the need to develop a standardized approach to sample preparation methods, sequencing, and bioinformatics analysis in the single-cell study by investigators. A small number of the analyzed samples of islet cells derived from donors, due to difficulties in obtaining material for analysis, may manifest in the absence of the replication of research results. For instance, Wang and colleagues analyzed the results of three previously published single-cell studies in T2D patients and control groups and found a limited number of overlapping genes expressed by β-cells. These include downregulated ERO1LB and upregulated TTR, FXYD2, TUBA1C, FTL, and INS [133]. Another issue of current interest is the limited number of reliable α- and β-cell markers, which would help to separate cell populations. The use of flow cytometry made it possible to determine the marker TM4SF4 specific for α-cells, as well as CD24 and CD44 localized on the membranes of acinar and ductal cells, while β-cells turned out to be TM4SF4- and CD24-negative [134]. These findings can undoubtedly be extremely useful and beneficial for obtaining data specific to the populations of islet cells. However, the problem of the morphofunctional and molecular heterogeneity of β-cells remains. Protein expression studies came to the rescue in solving this issue, which made it possible to identify surface proteins and intercellular molecules specific for subpopulations of β-cells. Thus, the differential expression of ST8SIA1 and CD9 allows for the distinguishing between subpopulations of β-cells in normal adult islets and for the revelation of significant differences in terms of β-cells subpopulation percentages in diabetic donors [135,136]. A deeper understanding of the β-cells population heterogeneity will allow us to develop strategies for the prevention and targeted therapy of T2D in the future.

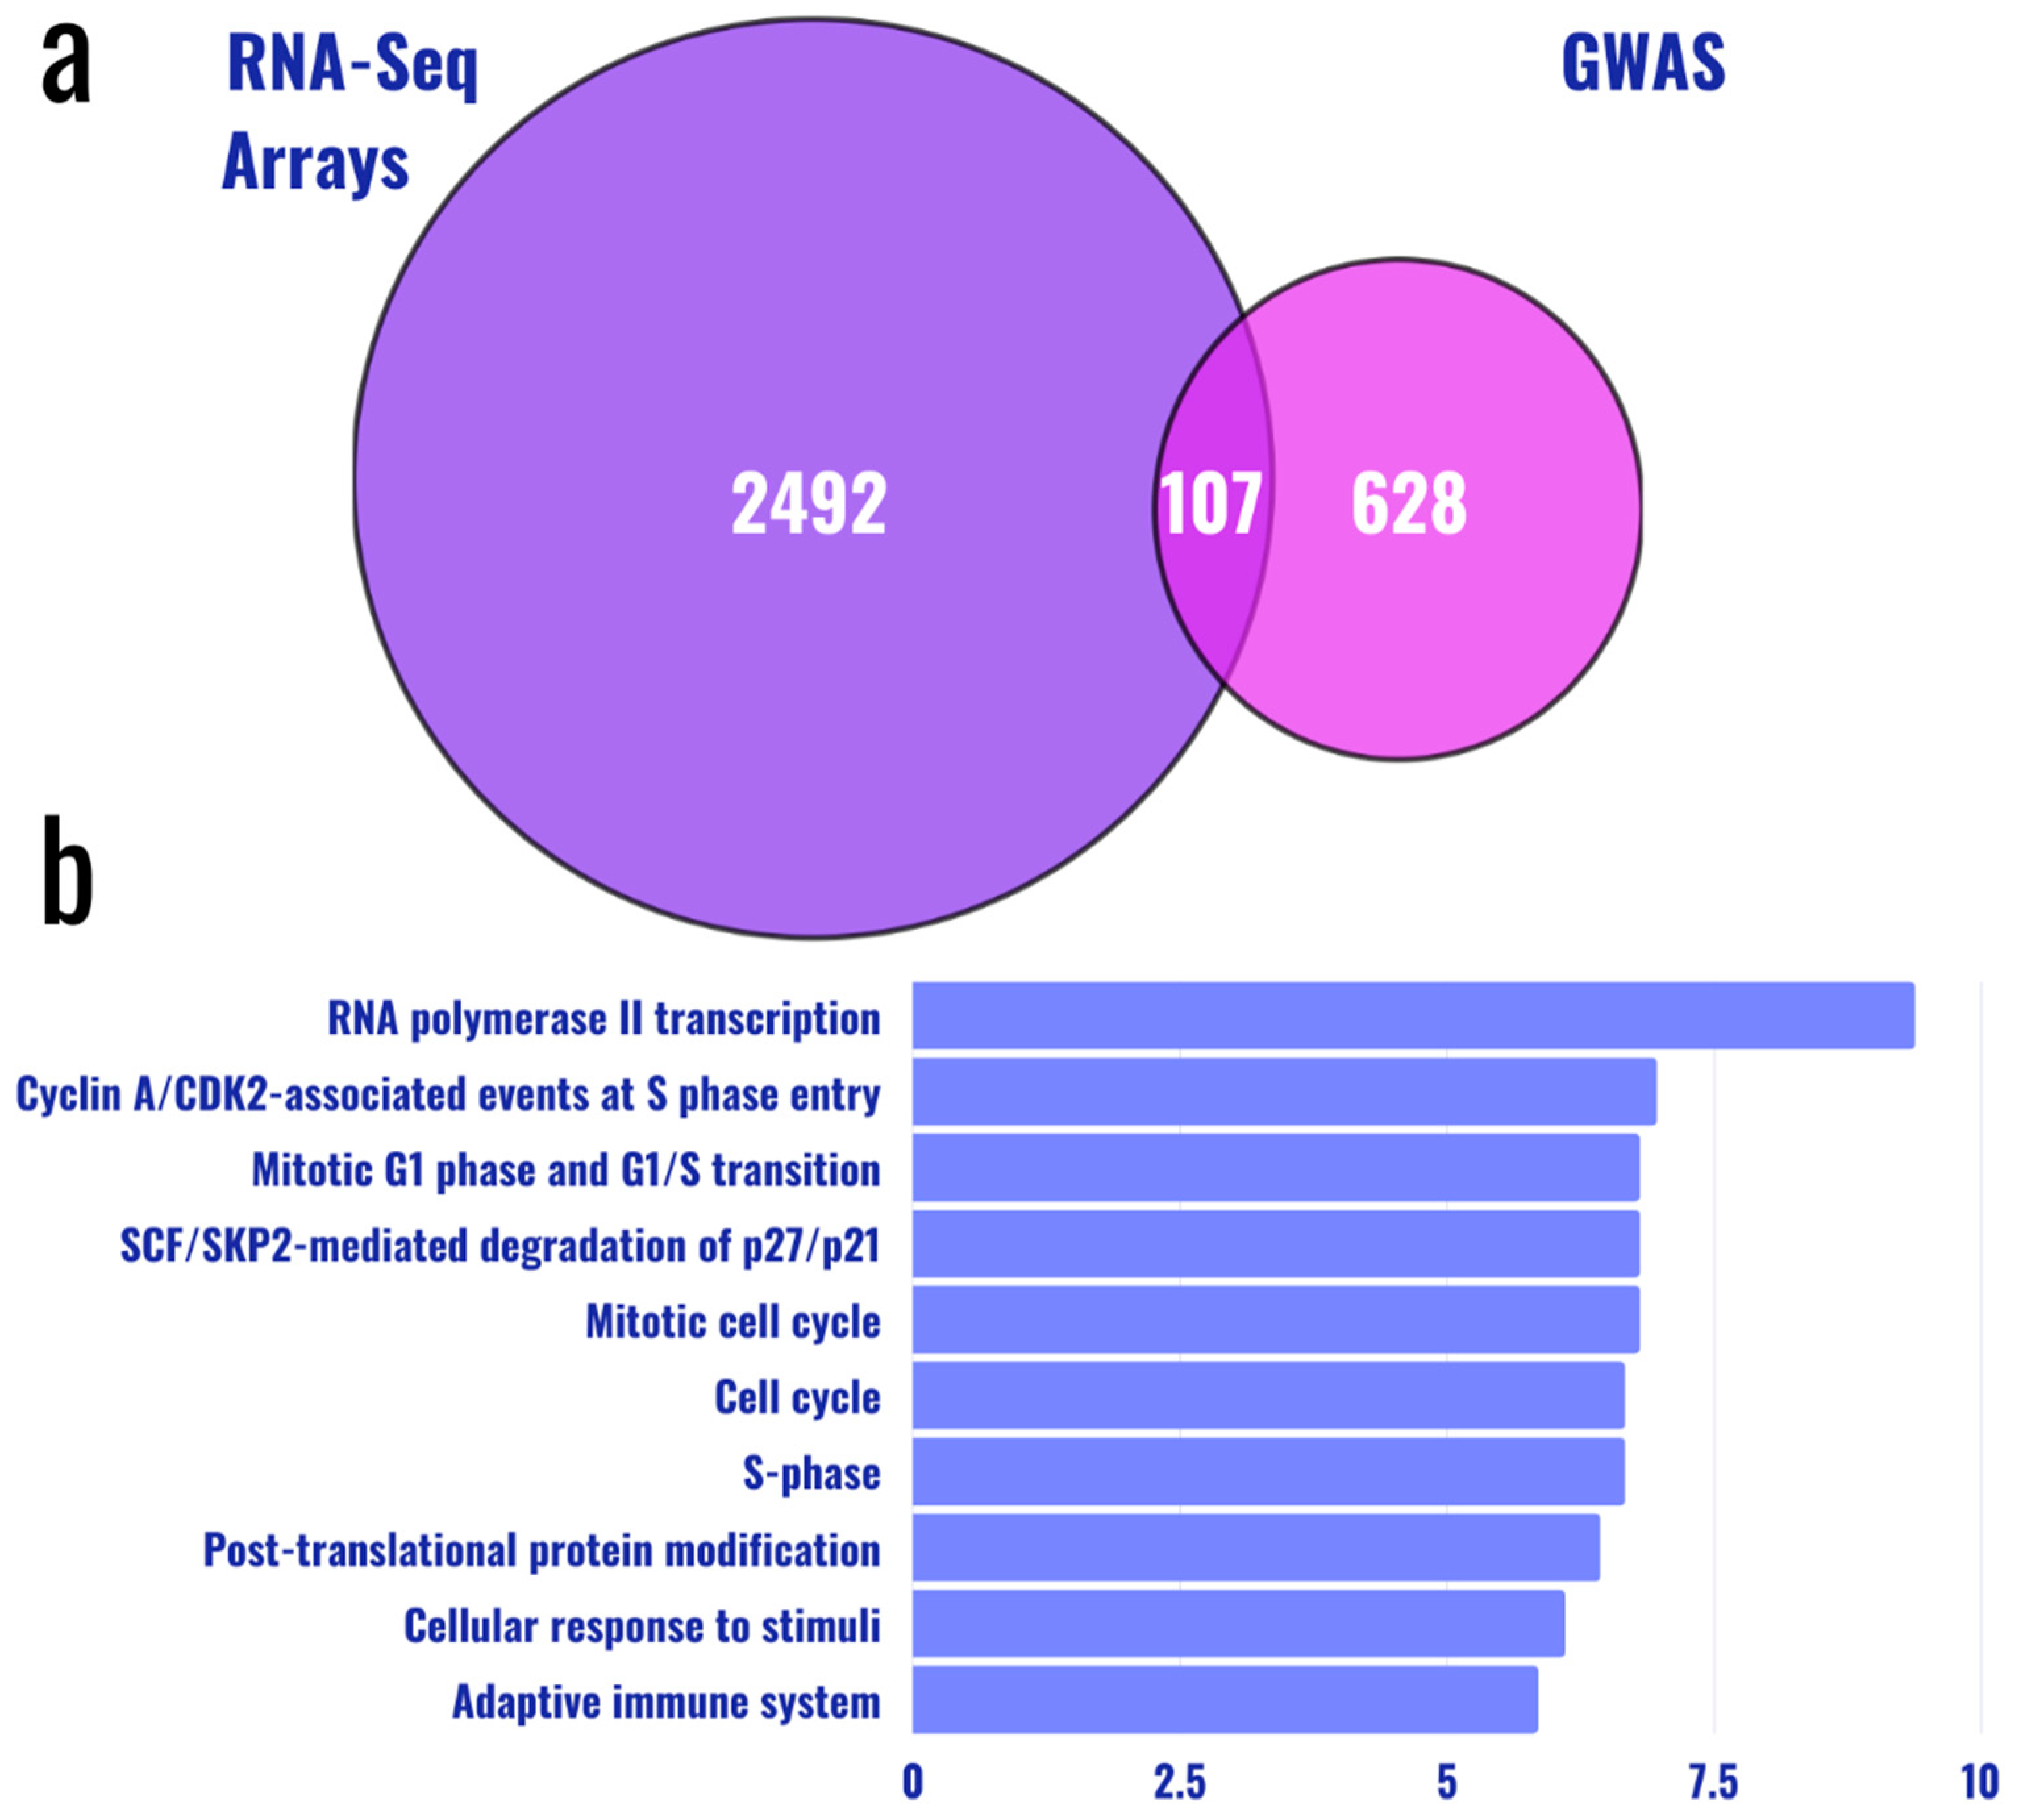
6. Comparative Analysis of Genomic and Transcriptomic Patterns

Of particular interest is the question of how the expression changes obtained from microarrays and RNA-seq studies correspond to molecular pathways and biological processes associated with genes at loci associated with T2D in major GWAS. To answer this question, we performed a comparative analysis of genomic and transcriptomic patterns based on the datasets from the open databases. First, we obtained a complete list of 628 genes at GWAS loci using several recent GWAS datasets for T2D, including the UK Biobank study, GERA [137], and latest meta-analyses involving the DIAGRAM consortium [138,139]. The analysis was performed using a recently proposed method for the functional annotation of GWAS data called FUMA [140]. We also selected 2492 DEGs with the most significant log2-feld change obtained in studies from Table 1. The gene list provided by FUMA was intersected with a complete list of DEGs. Such an analysis identifies 107 common genes between the two sets (Figure 2a). We next analyzed the molecular pathways associated with these common genes. Enrichment analysis using the Molecular Signatures Database [141] identified 98 canonical pathways, showing a significant overlap with 107 common genes. The top enrichment included processes related to the cell cycle, mitosis, and immune system activity (Figure 2b). The relatively small number of shared genes may be due to the existing limitations of both transcriptomic and GWA studies. In addition, the analysis of ethnically heterogeneous populations and different tissues may mask existing differences. At the same time, the recent rapid growth in the number of transcriptomic studies gives hope for additional data allowing for complex meta-analyses with strict inclusion and exclusion criteria.

7. Discussion

To date, the contribution of the hereditary component to the development of T2D is well known; however, the pathogenesis of this disease is not yet fully understood. The multifactorial nature of T2D makes it challenging to study, so it seems promising to identify the genetic factors that have a significant impact on the development of the disease throughout the application of omics approaches, including genomics, transcriptomics, proteomics, and others. Over the past decade, our knowledge on the functional pathways of T2D has been greatly expanded by recent transcriptomic studies that confirmed the important role of the immune system and inflammation in diabetes development as well as indicated a clear involvement of the components of the cancer signaling pathway, which is consistent with the hypothesis that the risk of cancer is significantly higher in T2D patients [78]. The significant role of visceral adipose tissue in the development of insulin resistance in T2D was confirmed by RNA-seq research [39]. Additionally, the common molecular mechanisms in the pathogenesis of T2D, T1D, and GDM were found, as well as early presymptomatic changes in individuals with borderline insulin resistance and impaired fasting glucose [24,85].
Conducting a transcriptomic study requires the consideration of many factors that may affect the results obtained. As is known, T2D patients often have concomitant diseases, an elevated BMI, and diabetic macro- and microvascular complications influencing the expression profile, and this should be considered when forming study groups and planning experiments. In addition, it is necessary to take into consideration hypoglycemic therapy and medications for comorbidities that are taken by patients and their effectiveness. The ethnicity of the participants can also play a significant role. It was suggested that the molecular mechanisms of the T2D pathogenesis may differ in the representatives of diverse ethnic groups [26].
One of the main points during the preparation of a transcriptome analysis experiment is the choice of study material. Since the main insulin targets are the liver, skeletal muscle, and adipose tissue, studying the expression in these tissues really matters [142]. The main difficulty is the need for a biopsy or another invasive procedure so that a piece of tissue or a sample of cells could be tested. Whole blood or PBMC might be a solution to this issue. Peripheral blood testing is more suitable for searching for potential T2D risk biomarkers or for early diagnosis due to its accessibility. Of particular interest are studies on the pancreas; however, obtaining a biomaterial is difficult. The material from deceased donors, cell cultures, or mouse models of T2D may solve this problem. T2D mouse models are currently being used by many researchers around the world [143]. It was shown that the expression profiles of mouse and human α- and β-cells are very similar; however, there are interspecies differences that do not allow for the full characterization of molecular and biological processes in T2D individuals [43] and the prediction of the regenerative behavior of human pancreatic tissue [131]. Additionally, the experiment often requires special controlled conditions. These limitations and ethical considerations limit the use of animal models to study T2D. The use of cell cultures is devoid of the listed shortcomings since it allows the experiment to be carried out under specified conditions. Today, there is a wide variety of in vitro models of pancreatic cells, each of which has its own advantages and disadvantages. Some of them, i.e., primary cell lines, are more representative but have a limited proliferative potential and are difficult to obtain. Transformed cell lines and stem cells, in contrast, have a longer lifespan but are less representative of the selected tissue [144]. Scientists are still searching for the ideal in vitro model of the pancreas for gene expression research.
Due to the high cost and complex sample preparation, the sample size used for transcriptomic studies is commonly quite small. A small sample size is one of the basic reasons for validating study results. In the case of a small sample, it makes sense to validate the expression of selected genes by the RT-qPCR method on an expanded sample to obtain reliable results, since the RT-qPCR method is more accessible and easier to perform compared to RNA-seq or expression arrays. One of the core issues of most conducted transcriptomic studies is the lack of validation by another method. Since transcriptomic studies provide massive data on a variety of DEGs, researchers are faced with a choice about the set of genes that require validation. These may be genes with the most significant expression changes or genes with a described function. When comparing the data on gene expression obtained by RNA-seq and RT-qPCR, they were reproduced in 85% of cases. However, the remaining 15% consisted mainly of genes with fewer exons or a lower expression. When conducting transcriptomic studies, the validation of the expression levels of such genes by RT-qPCR is required [145].
The interpretation of the study results can also be difficult, since the found DEGs often do not have the described function. Additional studies aimed at the analysis of non-coding RNAs, DNA methylation, and histone acetylation, which can affect the level of expression, as well as proteomic studies, may partly bring us closer to solving the problem by determining genes that are differentially expressed at both the transcript and protein levels and factors affecting expression.

8. Conclusions

In this article, we present the main results of transcriptomic studies conducted using expression arrays, RNA-seq, and single cell sequencing. Recent research provided evidence for the important role of immune inflammation in the pathogenesis of T2D and revealed the activation of cancer signaling, cell cycle pathways, and the role of the ubiquitin–proteasome system in T2D patients. The importance of adipose tissue, both visceral and peripheral, in the development of insulin resistance was confirmed once again. Despite the massive data provided by transcriptome studies, there are still many limitations affecting the results, as well as challenges that researchers must face from the choice of the material and method to the interpretation of the results. Undoubtedly, the data obtained using transcriptomic technologies allow for the shedding of light on the molecular mechanisms of T2D pathogenesis and the consideration of new diagnostic and therapeutic approaches. However, before introducing them into clinical practice, additional large-scale studies are required, considering both the achievements and the limitations of previous studies.

Supplementary Materials

The following supporting information can be downloaded at: https://www.mdpi.com/article/10.3390/genes13071176/s1, Table S1: The main DEGs and biological processes identified by transcriptome studies.

Author Contributions

Conceptualization, Y.A.N. and A.S.G.; writing—original draft preparation, review, and editing, Y.A.N., Z.N.T., M.M.D., Y.A.B., A.I.C., A.A.M. and A.S.G.; supervision, A.S.G. All authors have read and agreed to the published version of the manuscript.

Funding

This research was funded by the Ministry of Science and Higher Education of the Russian Federation within the Applied Science Research Program, project number No. AAAA-A20-120041390028-0.

Conflicts of Interest

The authors declare no conflict of interest.

References

  1. American Diabetes Association. Diagnosis and classification of diabetes mellitus. Diabetes Care 2009, 32 (Suppl. 1), S62–S67. [Google Scholar] [CrossRef] [PubMed] [Green Version]
  2. Khan, M.A.B.; Hashim, M.J.; King, J.K.; Govender, R.D.; Mustafa, H.; Al Kaabi, J. Epidemiology of type 2 diabetes—Global burden of disease and forecasted trends. J. Epidemiol. Glob. Health 2020, 10, 107–111. [Google Scholar] [CrossRef] [PubMed] [Green Version]
  3. World Health Organization. Global Report on Diabetes; WHO: Geneva, Switzerland, 2016. [Google Scholar]
  4. Jing, X.; Chen, J.; Dong, Y.; Han, D.; Zhao, H.; Wang, X.; Gao, F.; Li, C.; Cui, Z.; Liu, Y.; et al. Related factors of quality of life of type 2 diabetes patients: A systematic review and meta-analysis. Health Qual. Life Outcomes 2018, 16, 189. [Google Scholar] [CrossRef] [PubMed]
  5. Dean, L.; McEntyre, J. Chapter 3, Genetic Factors in Type 2 Diabetes. In The Genetic Landscape of Diabetes; National Center for Biotechnology Information: Bethesda, MD, USA, 2004. [Google Scholar]
  6. Xue, A.; Wu, Y.; Zhu, Z.; Zhang, F.; Kemper, K.E.; Zheng, Z.; Yengo, L.; Lloyd-Jones, L.R.; Sidorenko, J.; Wu, Y.; et al. Genome-wide association analyses identify 143 risk variants and putative regulatory mechanisms for type 2 diabetes. Nat. Commun. 2018, 9, 2941. [Google Scholar] [CrossRef] [Green Version]
  7. DeForest, N.; Majithia, A.R. Genetics of type 2 diabetes: Implications from large-scale studies. Curr. Diab. Rep. 2022, 22, 227–235. [Google Scholar] [CrossRef]
  8. Banerjee, M.; Saxena, M. Genetic polymorphisms of cytokine genes in type 2 diabetes mellitus. World J. Diabetes 2014, 5, 493–504. [Google Scholar] [CrossRef]
  9. Sun, X.; Yu, W.; Hu, C. Genetics of type 2 diabetes: Insights into the pathogenesis and its clinical application. BioMed Res. Int. 2014, 2014, 926713. [Google Scholar] [CrossRef] [Green Version]
  10. Manolio, T.A.; Collins, F.S.; Cox, N.J.; Goldstein, D.B.; Hindorff, L.A.; Hunter, D.J.; McCarthy, M.I.; Ramos, E.M.; Cardon, L.R.; Chakravarti, A.; et al. Finding the missing heritability of complex diseases. Nature 2009, 461, 747–753. [Google Scholar] [CrossRef] [Green Version]
  11. Cano-Gamez, E.; Trynka, G. From GWAS to function: Using functional genomics to identify the mechanisms underlying complex diseases. Front. Genet. 2020, 11, 424. [Google Scholar] [CrossRef]
  12. Liu, W.; Zhuang, Z.; Wang, W.; Huang, T.; Liu, Z. An improved genome-wide polygenic score model for predicting the risk of type 2 diabetes. Front. Genet. 2021, 12, 632385. [Google Scholar] [CrossRef]
  13. Lewis, C.M.; Vassos, E. Polygenic risk scores: From research tools to clinical instruments. Genome Med. 2020, 12, 44. [Google Scholar] [CrossRef] [PubMed]
  14. Udler, M.S.; McCarthy, M.I.; Florez, J.C.; Mahajan, A. Genetic Risk Scores for Diabetes Diagnosis and Precision Medicine. Endocr. Rev. 2019, 40, 1500–1520. [Google Scholar] [CrossRef] [PubMed] [Green Version]
  15. Jenkinson, C.P.; Göring, H.H.H.; Arya, R.; Blangero, J.; Duggirala, R.; DeFronzo, R.A. Transcriptomics in type 2 diabetes: Bridging the gap between genotype and phenotype. Genom. Data 2016, 8, 25–36. [Google Scholar] [CrossRef] [PubMed] [Green Version]
  16. Kaizer, E.C.; Glaser, C.L.; Chaussabel, D.; Banchereau, J.; Pascual, V.; White, P.C. Gene expression in peripheral blood mononuclear cells from children with diabetes. J. Clin. Endocrinol. Metab. 2007, 92, 3705–3711. [Google Scholar] [CrossRef] [Green Version]
  17. Grayson, B.L.; Wang, L.; Aune, T.M. Peripheral blood gene expression profiles in metabolic syndrome, coronary artery disease and type 2 diabetes. Genes. Immun. 2011, 12, 341–351. [Google Scholar] [CrossRef]
  18. Mao, J.; Ai, J.; Zhou, X.; Shenwu, M.; Ong, M., Jr.; Blue, M.; Washington, J.T.; Wang, X.; Deng, Y. Transcriptomic profiles of peripheral white blood cells in type II diabetes and racial differences in expression profiles. BMC Genom. 2011, S12. [Google Scholar] [CrossRef] [Green Version]
  19. Zhao, C.; Mao, J.; Ai, J.; Shenwu, M.; Shi, T.; Zhang, D.; Wang, X.; Wang, Y.; Deng, Y. Integrated lipidomics and transcriptomic analysis of peripheral blood reveals significantly enriched pathways in type 2 diabetes mellitus. BMC Med. Genom. 2013, 6 (Suppl. 1), S12. [Google Scholar] [CrossRef] [Green Version]
  20. Bugliani, M.; Liechti, R.; Cheon, H.; Suleiman, M.; Marselli, L.; Kirkpatrick, C.; Filipponi, F.; Boggi, U.; Xenarios, I.; Syed, F.; et al. Microarray analysis of isolated human islet transcriptome in type 2 diabetes and the role of the ubiquitin-proteasome system in pancreatic β cell dysfunction. Mol. Cell. Endocrinol. 2013, 367, 1–10. [Google Scholar] [CrossRef]
  21. Collares, C.V.; Evangelista, A.F.; Xavier, D.J.; Takahashi, P.; Almeida, R.; Macedo, C.; Manoel-Caetano, F.; Foss, M.C.; Foss-Freitas, M.C.; Rassi, D.M.; et al. Transcriptome meta-analysis of peripheral lymphomononuclear cells indicates that gestational diabetes is closer to type 1 diabetes than to type 2 diabetes mellitus. Mol. Biol. Rep. 2013, 40, 5351–5358. [Google Scholar] [CrossRef]
  22. Taneera, J.; Fadista, J.; Ahlqvist, E.; Zhang, M.; Wierup, N.; Renström, E.; Groop, L. Expression profiling of cell cycle genes in human pancreatic islets with and without type 2 diabetes. Mol. Cell. Endocrinol. 2013, 375, 35–42. [Google Scholar] [CrossRef]
  23. Corbi, S.C.T.; Bastos, A.S.; Nepomuceno, R.; Cirelli, T.; Dos Santos, R.A.; Takahashi, C.S.; Rocha, C.S.; Orrico, S.R.P.; Maurer-Morelli, C.V.; Scarel-Caminaga, R.M. Expression profile of genes potentially associated with adequate glycemic control in patients with type 2 diabetes mellitus. J. Diabetes Res. 2017, 2017, 2180819. [Google Scholar] [CrossRef] [PubMed] [Green Version]
  24. Matone, A.; Derlindati, E.; Marchetti, L.; Spigoni, V.; Dei Cas, A.; Montanini, B.; Ardigò, D.; Zavaroni, I.; Priami, C.; Bonadonna, R.C. Identification of an early transcriptomic signature of insulin resistance and related diseases in lymphomonocytes of healthy subjects. PLoS ONE 2017, 12, e0182559. [Google Scholar] [CrossRef] [PubMed] [Green Version]
  25. Villegas-Ruiz, V.; Hendlmeier, F.; Buentello-Volante, B.; Rodríguez-Loaiza, J.L.; Miranda-Duarte, A.; Zenteno, J.C. Genome-wide mRNA analysis reveals a TUBD1 isoform profile as a potential biomarker for diabetic retinopathy development. Exp. Eye Res. 2017, 155, 99–106. [Google Scholar] [CrossRef] [PubMed]
  26. Wang, C.; Ha, X.; Li, W.; Xu, P.; Zhang, Z.; Wang, T.; Li, J.; Wang, Y.; Li, S.; Xie, J.; et al. Comparative gene expression profile and DNA methylation status in diabetic patients of Kazak and Han people. Medicine 2018, 97, e11982. [Google Scholar] [CrossRef]
  27. Saxena, A.; Tiwari, P.; Wahi, N.; Soni, A.; Bansiwal, R.C.; Kumar, A.; Sharma, B.; Punjabi, P.; Gupta, N.; Malik, B.; et al. Transcriptome profiling reveals association of peripheral adipose tissue pathology with type-2 diabetes in Asian Indians. Adipocyte 2019, 8, 125–136. [Google Scholar] [CrossRef] [Green Version]
  28. Corbi, S.C.T.; de Vasconcellos, J.F.; Bastos, A.S.; Bussaneli, D.G.; da Silva, B.R.; Santos, R.A.; Takahashi, C.S.; de S. Rocha, C.; de Sá Carvalho, B.; Maurer-Morelli, C.V.; et al. Circulating lymphocytes and monocytes transcriptomic analysis of patients with type 2 diabetes mellitus, dyslipidemia and periodontitis. Sci. Rep. 2020, 10, 8145. [Google Scholar] [CrossRef]
  29. Veroneze, R.; Cruz Tfaile Corbi, S.; Roque da Silva, B.; de S. Rocha, C.; Maurer-Morelli, V.C.; Perez Orrico, S.R.; Cirelli, J.A.; Von Zuben, F.J.; Mantuaneli Scarel-Caminaga, R. Using association rule mining to jointly detect clinical features and differentially expressed genes related to chronic inflammatory diseases. PLoS ONE 2020, 15, e0240269. [Google Scholar] [CrossRef]
  30. Noreen, Z.; Loffredo, C.A.; Bhatti, A.; Simhadri, J.J.; Nunlee-Bland, G.; Nnanabu, T.; John, P.; Khan, J.S.; Ghosh, S. Transcriptional profiling and biological pathway(s) analysis of type 2 diabetes mellitus in a Pakistani population. Int. J. Environ. Res. Public Health 2020, 17, 5866. [Google Scholar] [CrossRef]
  31. Almanza-Aguilera, E.; Hernáez, Á.; Corella, D.; Sanllorente, A.; Ros, E.; Portolés, O.; Valussi, J.; Estruch, R.; Coltell, O.; Subirana, I.; et al. Cancer signaling transcriptome is upregulated in type 2 diabetes mellitus. J. Clin. Med. 2020, 10, 85. [Google Scholar] [CrossRef]
  32. Bury, J.J.; Chambers, A.; Heath, P.R.; Paul, G.; Ince, P.J.; Shaw, F.E.; Matthews, C.B.; Simpson, J.E.; Wharton, S.B. Type 2 diabetes mellitus-associated transcriptome alterations in cortical neurones and associated neurovascular unit cells in the ageing brain. Acta Neuropathol. Commun. 2021, 9, 5. [Google Scholar] [CrossRef]
  33. Scott, L.J.; Erdos, M.R.; Huyghe, J.R.; Welch, R.P.; Beck, A.T.; Wolford, B.N.; Chines, P.S.; Didion, J.P.; Narisu, N.; Stringham, H.M.; et al. The genetic regulatory signature of type 2 diabetes in human skeletal muscle. Nat. Commun. 2016, 7, 11764. [Google Scholar] [CrossRef] [PubMed] [Green Version]
  34. Gong, R.; Chen, M.; Zhang, C.; Chen, M.; Li, H. A comparison of gene expression profiles in patients with coronary artery disease, type 2 diabetes, and their coexisting conditions. Diagn. Pathol. 2017, 12, 44. [Google Scholar] [CrossRef] [PubMed]
  35. Wu, C.; Chen, X.; Shu, J.; Lee, C.T. Whole-genome expression analyses of type 2 diabetes in human skin reveal altered immune function and burden of infection. Oncotarget 2017, 8, 34601–34609. [Google Scholar] [CrossRef] [PubMed] [Green Version]
  36. Beckman, J.A.; Doherty, S.P.; Feldman, Z.B.; Banks, E.S.; Moslehi, J.; Jaffe, I.Z.; Hamburg, N.M.; Sheng, Q.; Brown, J.D. Comparative transcriptomics of Ex Vivo, patient-derived endothelial cells reveals novel pathways associated with type 2 diabetes mellitus. JACC Basic Transl. Sci. 2019, 4, 567–574. [Google Scholar] [CrossRef] [PubMed]
  37. Lv, B.; Bao, X.; Li, P.; Lian, J.; Wu, Y.; An, T.; Zhang, J.; Yang, X.; Wang, T.; Zhu, J.; et al. Transcriptome sequencing analysis of peripheral blood of type 2 diabetes mellitus patients with thirst and fatigue. Front. Endocrinol. 2020, 11, 558344. [Google Scholar] [CrossRef]
  38. Lin, Q.; Zhou, W.; Wang, Y.; Huang, J.; Hui, X.; Zhou, Z.; Xiao, Y. Abnormal peripheral neutrophil transcriptome in newly diagnosed type 2 diabetes patients. J. Diabetes Res. 2020, 2020, 9519072. [Google Scholar] [CrossRef] [Green Version]
  39. Carruthers, N.J.; Strieder-Barboza, C.; Caruso, J.A.; Flesher, C.G.; Baker, N.A.; Kerk, S.A.; Ky, A.; Ehlers, A.P.; Varban, O.A.; Lyssiotis, C.A.; et al. The human type 2 diabetes-specific visceral adipose tissue proteome and transcriptome in obesity. Sci. Rep. 2021, 11, 17394. [Google Scholar] [CrossRef]
  40. Saxena, A.; Mathur, N.; Tiwari, P.; Mathur, S.K. Whole transcriptome RNA-seq reveals key regulatory factors involved in type 2 diabetes pathology in peripheral fat of Asian Indians. Sci. Rep. 2021, 11, 10632. [Google Scholar] [CrossRef]
  41. Kleinstein, S.E.; McCorrison, J.; Ahmed, A.; Hasturk, H.; Van Dyke, T.E.; Freire, M. Transcriptomics of type 2 diabetic and healthy human neutrophils. BMC Immunol. 2021, 22, 37. [Google Scholar] [CrossRef]
  42. Segerstolpe, Å.; Palasantza, A.; Eliasson, P.; Andersson, E.M.; Andréasson, A.C.; Sun, X.; Picelli, S.; Sabirsh, A.; Clausen, M.; Bjursell, M.K.; et al. Single-cell transcriptome profiling of human pancreatic islets in health and type 2 diabetes. Cell Metab. 2016, 24, 593–607. [Google Scholar] [CrossRef] [Green Version]
  43. Xin, Y.; Kim, J.; Okamoto, H.; Ni, M.; Wei, Y.; Adler, C.; Murphy, A.J.; Yancopoulos, G.D.; Lin, C.; Gromada, J. RNA sequencing of single human islet cells reveals type 2 diabetes genes. Cell Metab. 2016, 24, 608–661. [Google Scholar] [CrossRef] [PubMed] [Green Version]
  44. Wang, Y.J.; Schug, J.; Won, K.J.; Liu, C.; Naji, A.; Avrahami, D.; Golson, M.L.; Kaestner, K.H. Single-cell transcriptomics of the human endocrine pancreas. Diabetes 2016, 65, 3028–3038. [Google Scholar] [CrossRef] [Green Version]
  45. Lawlor, N.; George, J.; Bolisetty, M.; Kursawe, R.; Sun, L.; Sivakamasundari, V.; Kycia, I.; Robson, P.; Stitzel, M.L. Single-cell transcriptomes identify human islet cell signatures and reveal cell-type-specific expression changes in type 2 diabetes. Genome Res. 2017, 27, 208–222. [Google Scholar] [CrossRef] [PubMed]
  46. Alwine, J.C.; Kemp, D.J.; Stark, G.R. Method for detection of specific RNAs in agarose gels by transfer to diazobenzyloxymethyl-paper and hybridization with DNA probes. Proc. Natl. Acad. Sci. USA 1977, 74, 5350–5354. [Google Scholar] [CrossRef] [Green Version]
  47. Trayhurn, P. Northern blotting. Proc. Nutr. Soc. 1996, 55, 583–589. [Google Scholar] [CrossRef] [Green Version]
  48. Fehr, J.E.; Trotter, G.W.; Oxford, J.T.; Hart, D.A. Comparison of Northern blot hybridization and a reverse transcriptase-polymerase chain reaction technique for measurement of mRNA expression of metalloproteinases and matrix components in articular cartilage and synovial membrane from horses with osteoarthritis. Am. J. Vet. Res. 2000, 61, 900–905. [Google Scholar] [CrossRef]
  49. Taniguchi, M.; Miura, K.; Iwao, H.; Yamanaka, S. Quantitative assessment of DNA microarrays-comparison with Northern blot analyses. Genomics 2001, 71, 34–39. [Google Scholar] [CrossRef]
  50. Raghavendra, P.; Pullaiah, T. Chapter 2: RNA-Based Applications in Diagnostic and Therapeutics for Cancer. In Advances in Cell and Molecular Diagnostics, 1st ed.; Academic Press: Cambridge, MA, USA, 2018. [Google Scholar] [CrossRef]
  51. Wong, M.L.; Medrano, J.F. Real-time PCR for mRNA quantitation. Biotechniques 2005, 39, 75–85. [Google Scholar] [CrossRef]
  52. Perez, L.J.; Rios, L.; Trivedi, P.; D’Souza, K.; Cowie, A.; Nzirorera, C.; Webster, D.; Brunt, K.; Legare, J.F.; Hassan, A.; et al. Validation of optimal reference genes for quantitative real time PCR in muscle and adipose tissue for obesity and diabetes research. Sci. Rep. 2017, 7, 3612. [Google Scholar] [CrossRef] [Green Version]
  53. Clarke, J.D.; Zhu, T. Microarray analysis of the transcriptome as a stepping stone towards understanding biological systems: Practical considerations and perspectives. Plant J. 2006, 45, 630–650. [Google Scholar] [CrossRef]
  54. Rachinger, N.; Fischer, S.; Böhme, I.; Linck-Paulus, L.; Kuphal, S.; Kappelmann-Fenzl, M.; Bosserhoff, A.K. Loss of gene information: Discrepancies between RNA sequencing, cDNA microarray, and qRT-PCR. Int. J. Mol. Sci. 2021, 22, 9349. [Google Scholar] [CrossRef]
  55. Hurd, P.J.; Nelson, C.J. Advantages of next-generation sequencing versus the microarray in epigenetic research. Brief. Funct. Genom. Proteom. 2009, 8, 174–183. [Google Scholar] [CrossRef] [Green Version]
  56. Slonim, D.K.; Yanai, I. Getting started in gene expression microarray analysis. PLoS Comput. Biol. 2009, 5, e1000543. [Google Scholar] [CrossRef]
  57. Zito, A.; Lualdi, M.; Granata, P.; Cocciadiferro, D.; Novelli, A.; Alberio, T.; Casalone, R.; Fasano, M. Gene set enrichment analysis of interaction networks weighted by node centrality. Front. Genet. 2021, 12, 577623. [Google Scholar] [CrossRef]
  58. Kukurba, K.R.; Montgomery, S.B. RNA sequencing and analysis. Cold Spring Harb. Protoc. 2015, 11, 951–969. [Google Scholar] [CrossRef] [Green Version]
  59. Rao, M.S.; Van Vleet, T.R.; Ciurlionis, R.; Buck, W.R.; Mittelstadt, S.W.; Blomme, E.A.G.; Liguori, M.J. Comparison of RNA-seq and microarray gene expression platforms for the toxicogenomic evaluation of liver from short-term rat toxicity studies. Front. Genet. 2019, 9, 636. [Google Scholar] [CrossRef] [Green Version]
  60. Roh, S.W.; Abell, G.C.; Kim, K.H.; Nam, Y.D.; Bae, J.W. Comparing microarrays and next-generation sequencing technologies for microbial ecology research. Trends Biotechnol. 2010, 28, 291–299. [Google Scholar] [CrossRef]
  61. Liao, Y.; Shi, W. Read trimming is not required for mapping and quantification of RNA-seq reads at the gene level. NAR Genom Bioinform. 2020, 2, lqaa068. [Google Scholar] [CrossRef]
  62. Conesa, A.; Madrigal, P.; Tarazona, S.; Gomez-Cabrero, D.; Cervera, A.; McPherson, A.; Szcześniak, M.W.; Gaffney, D.J.; Elo, L.L.; Zhang, X.; et al. A survey of best practices for RNA-seq data analysis. Genome Biol. 2016, 17, 13. [Google Scholar] [CrossRef] [Green Version]
  63. Costa-Silva, J.; Domingues, D.; Lopes, F.M. RNA-Seq differential expression analysis: An extended review and a software tool. PLoS ONE 2017, 12, e0190152. [Google Scholar] [CrossRef] [Green Version]
  64. Tang, X.; Huang, Y.; Lei, J.; Luo, H.; Zhu, X. The single-cell sequencing: New developments and medical applications. Cell Biosci. 2019, 26, 53. [Google Scholar] [CrossRef] [Green Version]
  65. Alessandrì, L.; Arigoni, M.; Calogero, R. Differential expression analysis in single-cell transcriptomics. Methods Mol. Biol. 2019, 1979, 425–432. [Google Scholar] [CrossRef]
  66. Wang, T.; Li, B.; Nelson, C.E.; Nabavi, S. Comparative analysis of differential gene expression analysis tools for single-cell RNA sequencing data. BMC Bioinform. 2019, 20, 40. [Google Scholar] [CrossRef] [Green Version]
  67. Solis-Herrera, C.; Triplitt, C.; Cersosimo, E. Pathogenesis of type 2 diabetes mellitus. In Endotext; Feingold, K.R., Anawalt, B., Boyce, A., Eds.; MDText.com, Inc.: South Dartmouth, MA, USA, 2000. [Google Scholar]
  68. Burhans, M.S.; Hagman, D.K.; Kuzma, J.N.; Schmidt, K.A.; Kratz, M. Contribution of adipose tissue inflammation to the development of type 2 diabetes mellitus. Compr. Physiol. 2018, 9, 1–58. [Google Scholar] [CrossRef]
  69. Hardy, O.T.; Czech, M.P.; Corvera, S. What causes the insulin resistance underlying obesity? Curr. Opin. Endocrinol. Diabetes Obes. 2012, 19, 81–87. [Google Scholar] [CrossRef] [Green Version]
  70. Tajima, T.; Goda, N.; Fujiki, N.; Hishiki, T.; Nishiyama, Y.; Senoo-Matsuda, N.; Shimazu, M.; Soga, T.; Yoshimura, Y.; Johnson, R.S.; et al. HIF-1alpha is necessary to support gluconeogenesis during liver regeneration. Biochem. Biophys. Res. Commun. 2009, 387, 789–794. [Google Scholar] [CrossRef]
  71. Norouzirad, R.; González-Muniesa, P.; Ghasemi, A. Hypoxia in obesity and diabetes: Potential therapeutic effects of hyperoxia and nitrate. Oxid. Med. Cell. Longev. 2017, 2017, 5350267. [Google Scholar] [CrossRef]
  72. Boden, G. Effects of free fatty acids (FFA) on glucose metabolism: Significance for insulin resistance and type 2 diabetes. Exp. Clin. Endocrinol. Diabetes 2003, 111, 121–124. [Google Scholar] [CrossRef]
  73. Cnop, M.; Abdulkarim, B.; Bottu, G.; Cunha, D.A.; Igoillo-Esteve, M.; Masini, M.; Turatsinze, J.V.; Griebel, T.; Villate, O.; Santin, I.; et al. RNA sequencing identifies dysregulation of the human pancreatic islet transcriptome by the saturated fatty acid palmitate. Diabetes 2014, 63, 1978–1993. [Google Scholar] [CrossRef] [Green Version]
  74. Agrafioti, P.; Morin-Baxter, J.; Tanagala, K.K.K.; Dubey, S.; Sims, P.; Lalla, E.; Momen-Heravi, F. Decoding the role of macrophages in periodontitis and type 2 diabetes using single-cell RNA-sequencing. FASEB J. 2022, 36, e22136. [Google Scholar] [CrossRef]
  75. Aronson, D.; Edelman, E.R. Coronary artery disease and diabetes mellitus. Cardiol Clin. 2014, 32, 439–455. [Google Scholar] [CrossRef] [PubMed] [Green Version]
  76. Einarson, T.R.; Acs, A.; Ludwig, C.; Panton, U.H. Prevalence of cardiovascular disease in type 2 diabetes: A systematic literature review of scientific evidence from across the world in 2007-2017. Cardiovasc. Diabetol. 2018, 17, 83. [Google Scholar] [CrossRef] [Green Version]
  77. Hadi, H.A.; Suwaidi, J.A. Endothelial dysfunction in diabetes mellitus. Vasc Health Risk Manag. 2007, 3, 853–876. [Google Scholar]
  78. Giovannucci, E.; Harlan, D.M.; Archer, M.C.; Bergenstal, R.M.; Gapstur, S.M.; Habel, L.A.; Pollak, M.; Regensteiner, J.G.; Yee, D. Diabetes and cancer: A consensus report. Diabetes Care 2010, 33, 1674–1685. [Google Scholar] [CrossRef] [Green Version]
  79. Ni, T.; Wang, N.; Mao, Z.G.; Yao, M. Identification of marker genes in diabetic wounds by DNA microarray study. Genet. Mol. Res. 2013, 12, 5348–5355. [Google Scholar] [CrossRef]
  80. Ridiandries, A.; Tan, J.T.M.; Bursill, C.A. The role of chemokines in wound healing. Int. J. Mol. Sci. 2018, 19, 3217. [Google Scholar] [CrossRef] [Green Version]
  81. Jordan, A.R.; Racine, R.R.; Hennig, M.J.; Lokeshwar, V.B. The role of CD44 in disease pathophysiology and targeted treatment. Front. Immunol. 2015, 6, 182. [Google Scholar] [CrossRef]
  82. Liu, L.F.; Kodama, K.; Wei, K.; Tolentino, L.L.; Choi, O.; Engleman, E.G.; Butte, A.J.; McLaughlin, T. The receptor CD44 is associated with systemic insulin resistance and proinflammatory macrophages in human adipose tissue. Diabetologia 2015, 58, 1579–1586. [Google Scholar] [CrossRef] [Green Version]
  83. Rosen, J.; Yosipovitch, G. Skin manifestations of diabetes mellitus. In Endotext; Feingold, K.R., Anawalt, B., Boyce, A., Eds.; MDText.com, Inc.: South Dartmouth, MA, USA, 2000. [Google Scholar]
  84. American Diabetes Association. Standards of medical care in diabetes. Diabetes Care 2004, 27 (Suppl. 1), 15–35. [Google Scholar] [CrossRef] [Green Version]
  85. Cui, Y.; Chen, W.; Chi, J.; Wang, L. Comparison of transcriptome between type 2 diabetes mellitus and impaired fasting glucose. Med. Sci. Monit. 2016, 22, 4699–4706. [Google Scholar] [CrossRef] [Green Version]
  86. Rosenbaum, P.; Ferreira, S.R. An update on cardiovascular risk of metabolic syndrome. Arq. Bras. Endocrinol. Metabol. 2003, 47, 220–227. [Google Scholar] [CrossRef]
  87. Denis, G.V. Bromodomain coactivators in cancer, obesity, type 2 diabetes, and inflammation. Discov. Med. 2010, 10, 489–499. [Google Scholar]
  88. Abdellatif, A.M.; Oishi, H.; Itagaki, T.; Jung, Y.; Shawki, H.H.; Okita, Y.; Hasegawa, Y.; Suzuki, H.; El-Morsy, S.E.; El-Sayed, M.A.; et al. β-cell-specific Mafk overexpression impairs pancreatic endocrine cell development. PLoS ONE 2016, 11, e0150010. [Google Scholar] [CrossRef] [Green Version]
  89. Kim, M.; Zhang, X. The profiling and role of miRNAs in diabetes mellitus. J. Diabetes Clin. Res. 2019, 1, 5–23. [Google Scholar] [CrossRef]
  90. Tonyan, Z.N.; Nasykhova, Y.A.; Mikhailova, A.A.; Glotov, A.S. MicroRNAs as potential biomarkers of type 2 diabetes mellitus. Russ. J. Genet. 2021, 57, 764–777. [Google Scholar] [CrossRef]
  91. Poy, M.N.; Eliasson, L.; Krutzfeldt, J.; Kuwajima, S.; Ma, X.; Macdonald, P.E.; Pfeffer, S.; Tuschl, T.; Rajewsky, N.; Rorsman, P.; et al. A pancreatic islet-specific microRNA regulates insulin secretion. Nature 2004, 432, 226–230. [Google Scholar] [CrossRef]
  92. Karolina, D.S.; Tavintharan, S.; Armugam, A.; Sepramaniam, S.; Pek, S.L.; Wong, M.T.; Lim, S.C.; Sum, C.F.; Jeyaseelan, K. Circulating miRNA profiles in patients with metabolic syndrome. J. Clin. Endocrinol. Metab. 2012, 97, E2271–E2276. [Google Scholar] [CrossRef] [Green Version]
  93. Sun, K.; Chang, X.; Yin, L.; Li, J.; Zhou, T.; Zhang, C.; Chen, X. Expression and DNA methylation status of microRNA-375 in patients with type 2 diabetes mellitus. Mol. Med. Rep. 2014, 9, 967–972. [Google Scholar] [CrossRef] [Green Version]
  94. Kong, L.; Zhu, J.; Han, W.; Jiang, X.; Xu, M.; Zhao, Y.; Dong, Q.; Pang, Z.; Guan, Q.; Gao, L.; et al. Significance of serum microRNAs in pre-diabetes and newly diagnosed type 2 diabetes: A clinical study. Acta Diabetol. 2011, 48, 61–69. [Google Scholar] [CrossRef]
  95. He, Y.; Ding, Y.; Liang, B.; Lin, J.; Kim, T.K.; Yu, H.; Hang, H.; Wang, K. A systematic study of dysregulated microRNA in type 2 diabetes mellitus. Int. J. Mol. Sci. 2017, 18, 456. [Google Scholar] [CrossRef]
  96. Bommer, G.T.; Gerin, I.; Feng, Y.; Kaczorowski, A.J.; Kuick, R.; Love, R.E.; Zhai, Y.; Giordano, T.J.; Qin, Z.S.; Moore, B.B.; et al. p53-mediated activation of miRNA34 candidate tumor-suppressor genes. Curr. Biol. 2007, 17, 1298–1307. [Google Scholar] [CrossRef] [PubMed] [Green Version]
  97. Shen, Y.; Xu, H.; Pan, X.; Wu, W.; Wang, H.; Yan, L.; Zhang, M.; Liu, X.; Xia, S.; Shao, Q. miR-34a and miR-125b are upregulated in peripheral blood mononuclear cells from patients with type 2 diabetes mellitus. Exp. Ther. Med. 2017, 14, 5589–5596. [Google Scholar] [CrossRef] [PubMed] [Green Version]
  98. Sun, Y.; Peng, R.; Li, A.; Zhang, L.; Liu, H.; Peng, H.; Zhang, Z. Sequence variation in microRNA-34a is associated with diabetes mellitus susceptibility in a southwest Chinese Han population. Int. J. Clin. Exp. Pathol. 2018, 11, 1637–1644. [Google Scholar]
  99. Karolina, D.S.; Armugam, A.; Tavintharan, S.; Wong, M.T.; Lim, S.C.; Sum, C.F.; Jeyaseelan, K. MicroRNA 144 impairs insulin signaling by inhibiting the expression of insulin receptor substrate 1 in type 2 diabetes mellitus. PLoS ONE 2011, 6, e22839. [Google Scholar] [CrossRef]
  100. Copps, K.D.; White, M.F. Regulation of insulin sensitivity by serine/threonine phosphorylation of insulin receptor substrate proteins IRS1 and IRS2. Diabetologia 2012, 55, 2565–2582. [Google Scholar] [CrossRef] [PubMed] [Green Version]
  101. Yang, W.M.; Jeong, H.J.; Park, S.Y.; Lee, W. Induction of miR-29a by saturated fatty acids impairs insulin signaling and glucose uptake through translational repression of IRS-1 in myocytes. FEBS Lett. 2014, 588, 2170–2176. [Google Scholar] [CrossRef] [PubMed] [Green Version]
  102. Yang, Z.M.; Chen, L.H.; Hong, M.; Chen, Y.Y.; Yang, X.R.; Tang, S.M.; Yuan, Q.F.; Chen, W.W. Serum microRNA profiling and bioinformatics analysis of patients with type 2 diabetes mellitus in a Chinese population. Mol. Med. Rep. 2017, 15, 2143–2153. [Google Scholar] [CrossRef] [Green Version]
  103. Wang, X.; Sundquist, J.; Zöller, B.; Memon, A.A.; Palmér, K.; Sundquist, K.; Bennet, L. Determination of 14 circulating microRNAs in Swedes and Iraqis with and without diabetes mellitus type 2. PLoS ONE 2014, 9, e86792. [Google Scholar] [CrossRef]
  104. Gallagher, I.J.; Scheele, C.; Keller, P.; Nielsen, A.R.; Remenyi, J.; Fischer, C.P.; Roder, K.; Babraj, J.; Wahlestedt, C.; Hutvagner, G.; et al. Integration of microRNA changes in vivo identifies novel molecular features of muscle insulin resistance in type 2 diabetes. Genome Med. 2010, 2, 9. [Google Scholar] [CrossRef] [Green Version]
  105. Ślusarz, A.; Pulakat, L. The two faces of miR-29. J. Cardiovasc. Med. 2015, 16, 480–490. [Google Scholar] [CrossRef]
  106. Liang, Y.Z.; Dong, J.; Zhang, J.; Wang, S.; He, Y.; Yan, Y.X. Identification of neuroendocrine stress response-related circulating microRNAs as biomarkers for type 2 diabetes mellitus and insulin resistance. Front. Endocrinol. 2018, 9, 132. [Google Scholar] [CrossRef]
  107. Jia, L.; Zhang, R. Alterations in gene expression profiles in children with type 2 diabetes mellitus and its mechanisms. J. Cent. South Univ. 2018, 43, 826–834. [Google Scholar] [CrossRef]
  108. Dinarello, C.A.; Donath, M.Y.; Mandrup-Poulsen, T. Role of IL-1beta in type 2 diabetes. Curr. Opin. Endocrinol. Diabetes Obes. 2010, 17, 314–321. [Google Scholar] [CrossRef] [PubMed]
  109. Gao, L.; Sun, N.; Xu, Q.; Jiang, Z.; Li, C. Comparative analysis of mRNA expression profiles in Type 1 and Type 2 diabetes mellitus. Epigenomics 2019, 11, 685–699. [Google Scholar] [CrossRef] [PubMed]
  110. Ninichuk, V.; Anders, H.J. Chemokine receptor CCR1: A new target for progressive kidney disease. Am. J. Nephrol. 2005, 25, 365–372. [Google Scholar] [CrossRef] [Green Version]
  111. Rojewska, E.; Zychowska, M.; Piotrowska, A.; Kreiner, G.; Nalepa, I.; Mika, J. Involvement of macrophage inflammatory protein-1 family members in the development of diabetic neuropathy and their contribution to effectiveness of morphine. Front. Immunol. 2018, 9, 494. [Google Scholar] [CrossRef] [Green Version]
  112. Quezada-Calvillo, R.; Sim, L.; Ao, Z.; Hamaker, B.R.; Quaroni, A.; Brayer, G.D.; Sterchi, E.E.; Robayo-Torres, C.C.; Rose, D.R.; Nichols, B.L. Luminal starch substrate “brake” on maltase-glucoamylase activity is located within the glucoamylase subunit. J. Nutr. 2008, 138, 685–692. [Google Scholar] [CrossRef] [Green Version]
  113. Nichols, B.L.; Quezada-Calvillo, R.; Robayo-Torres, C.C.; Ao, Z.; Hamaker, B.R.; Butte, N.F.; Marini, J.; Jahoor, F.; Sterchi, E.E. Mucosal maltase-glucoamylase plays a crucial role in starch digestion and prandial glucose homeostasis of mice. J. Nutr. 2009, 139, 684–690. [Google Scholar] [CrossRef]
  114. Garten, A.; Petzold, S.; Schuster, S.; Körner, A.; Kratzsch, J.; Kiess, W. Nampt and its potential role in inflammation and type 2 diabetes. Handb. Exp. Pharmacol. 2011, 203, 147–164. [Google Scholar] [CrossRef]
  115. Lee, H.Y.; Yea, K.; Kim, J.; Lee, B.D.; Chae, Y.C.; Kim, H.S.; Lee, D.W.; Kim, S.H.; Cho, J.H.; Jin, C.J.; et al. Epidermal growth factor increases insulin secretion and lowers blood glucose in diabetic mice. J. Cell Mol. Med. 2008, 12, 1593–1604. [Google Scholar] [CrossRef] [Green Version]
  116. Wang, P.; Wang, Z.; Liu, G.; Jin, C.; Zhang, Q.; Man, S.; Wang, Z. miR-657 promotes macrophage polarization toward M1 by targeting FAM46C in gestational diabetes mellitus. Mediat. Inflamm. 2019, 2019, 4851214. [Google Scholar] [CrossRef] [PubMed] [Green Version]
  117. Maachi, H.; Fergusson, G.; Ethier, M.; Brill, G.N.; Katz, L.S.; Honig, L.B.; Metukuri, M.R.; Scott, D.K.; Ghislain, J.; Poitout, V. HB-EGF signaling is required for glucose-induced pancreatic β-Cell proliferation in rats. Diabetes 2020, 69, 369–380. [Google Scholar] [CrossRef] [PubMed] [Green Version]
  118. Akerfeldt, M.C.; Laybutt, D.R. Inhibition of Id1 augments insulin secretion and protects against high-fat diet-induced glucose intolerance. Diabetes 2011, 60, 2506–2514. [Google Scholar] [CrossRef] [PubMed] [Green Version]
  119. Ludwig-Słomczyńska, A.H.; Seweryn, M.T.; Kapusta, P.; Pitera, E.; Mantaj, U.; Cyganek, K.; Gutaj, P.; Dobrucka, Ł.; Wender-Ożegowska, E.; Małecki, M.T.; et al. The transcriptome-wide association search for genes and genetic variants which associate with BMI and gestational weight gain in women with type 1 diabetes. Mol. Med. 2021, 27, 6. [Google Scholar] [CrossRef] [PubMed]
  120. Brown, T.J.; Kollara, A.; Shathasivam, P.; Ringuette, M.J. Ventricular zone expressed PH Domain Containing 1 (VEPH1): An adaptor protein capable of modulating multiple signaling transduction pathways during normal and pathological development. Cell. Commun. Signal. 2019, 17, 116. [Google Scholar] [CrossRef] [Green Version]
  121. Alkhatatbeh, M.J.; Enjeti, A.K.; Acharya, S.; Thorne, R.F.; Lincz, L.F. The origin of circulating CD36 in type 2 diabetes. Nutr. Diabetes 2013, 3, e59. [Google Scholar] [CrossRef]
  122. Jermendy, A.; Toschi, E.; Aye, T.; Koh, A.; Aguayo-Mazzucato, C.; Sharma, A.; Weir, G.C.; Sgroi, D.; Bonner-Weir, S. Rat neonatal β cells lack the specialised metabolic phenotype of mature β cells. Diabetologia 2011, 54, 594–604. [Google Scholar] [CrossRef] [Green Version]
  123. Weir, G.C.; Aguayo-Mazzucato, C.; Bonner-Weir, S. β-cell dedifferentiation in diabetes is important, but what is it? Islets 2013, 5, 233–237. [Google Scholar] [CrossRef] [Green Version]
  124. Xin, Y.; Okamoto, H.; Kim, J.; Ni, M.; Adler, C.; Cavino, K.; Na, E.; Murphy, A.J.; Yancopoulos, G.D.; Lin, C.; et al. Single-cell RNAseq reveals that pancreatic β-cells from very old male mice have a young gene signature. Endocrinology 2016, 157, 3431–3438. [Google Scholar] [CrossRef] [Green Version]
  125. Zeng, C.; Mulas, F.; Sui, Y.; Guan, T.; Miller, N.; Tan, Y.; Liu, F.; Jin, W.; Carrano, A.C.; Huising, M.O.; et al. Pseudotemporal ordering of single cells reveals metabolic control of postnatal β cell proliferation. Cell Metab. 2017, 25, 1160–1175. [Google Scholar] [CrossRef] [Green Version]
  126. Baron, M.; Veres, A.; Wolock, S.L.; Faust, A.L.; Gaujoux, R.; Vetere, A.; Ryu, J.H.; Wagner, B.K.; Shen-Orr, S.S.; Klein, A.M.; et al. A single-cell transcriptomic map of the human and mouse pancreas reveals inter- and intra-cell population structure. Cell Syst. 2016, 3, 346–360. [Google Scholar] [CrossRef] [Green Version]
  127. Groen, N.; Leenders, F.; Mahfouz, A.; Munoz-Garcia, A.; Muraro, M.J.; de Graaf, N.; Rabelink, T.J.; Hoeben, R.; van Oudenaarden, A.; Zaldumbide, A.; et al. Single-cell transcriptomics links loss of human pancreatic β-cell identity to ER stress. Cells 2021, 10, 3585. [Google Scholar] [CrossRef]
  128. Teo, A.K.K.; Lim, C.S.; Cheow, L.F.; Kin, T.; Shapiro, J.A.; Kang, N.; Burkholder, W.; Lau, H.H. Single-cell analyses of human islet cells reveal de-differentiation signatures. Cell Death Discov. 2018, 4, 14. [Google Scholar] [CrossRef] [Green Version]
  129. Enge, M.; Arda, H.E.; Mignardi, M.; Beausang, J.; Bottino, R.; Kim, S.K.; Quake, S.R. Single-cell analysis of human pancreas reveals transcriptional signatures of aging and somatic mutation patterns. Cell 2017, 171, 321–330. [Google Scholar] [CrossRef] [Green Version]
  130. Qadir, M.M.F.; Álvarez-Cubela, S.; Klein, D.; van Dijk, J.; Muñiz-Anquela, R.; Moreno-Hernández, Y.B.; Lanzoni, G.; Sadiq, S.; Navarro-Rubio, B.; García, M.T.; et al. Single-cell resolution analysis of the human pancreatic ductal progenitor cell niche. Proc. Natl. Acad. Sci. USA 2020, 117, 10876–10887. [Google Scholar] [CrossRef]
  131. Domínguez-Bendala, J.; Qadir, M.M.F.; Pastori, R.L. Pancreatic progenitors: There and back again. Trends Endocrinol. Metab. 2019, 30, 4–11. [Google Scholar] [CrossRef]
  132. Bonnycastle, L.L.; Gildea, D.E.; Yan, T.; Narisu, N.; Swift, A.J.; Wolfsberg, T.G.; Erdos, M.R.; Collins, F.S. Single-cell transcriptomics from human pancreatic islets: Sample preparation matters. Biol. Methods Protoc. 2019, 4, bpz019. [Google Scholar] [CrossRef]
  133. Wang, Y.J.; Kaestner, K.H. Single-cell RNA-seq of the pancreatic islets--a promise not yet fulfilled? Cell Metab. 2019, 29, 539–544. [Google Scholar] [CrossRef] [Green Version]
  134. Muraro, M.J.; Dharmadhikari, G.; Grün, D.; Groen, N.; Dielen, T.; Jansen, E.; van Gurp, L.; Engelse, M.A.; Carlotti, F.; de Koning, E.J.; et al. A single-cell transcriptome atlas of the human pancreas. Cell Syst. 2016, 3, 385–394. [Google Scholar] [CrossRef] [Green Version]
  135. Dorrell, C.; Schug, J.; Canaday, P.S.; Russ, H.A.; Tarlow, B.D.; Grompe, M.T.; Horton, T.; Hebrok, M.; Streeter, P.R.; Kaestner, K.H.; et al. Human islets contain four distinct subtypes of β cells. Nat. Commun. 2016, 7, 11756. [Google Scholar] [CrossRef] [Green Version]
  136. Gutierrez, G.D.; Gromada, J.; Sussel, L. Heterogeneity of the pancreatic β cell. Front. Genet. 2017, 8, 22. [Google Scholar] [CrossRef] [Green Version]
  137. Cook, J.P.; Morris, A.P. Multi-ethnic genome-wide association study identifies novel locus for type 2 diabetes susceptibility. Eur. J. Hum. Genet. 2016, 24, 1175–1180. [Google Scholar] [CrossRef] [Green Version]
  138. Fuchsberger, C.; Flannick, J.; Teslovich, T.M.; Mahajan, A.; Agarwala, V.; Gaulton, K.J.; Ma, C.; Fontanillas, P.; Moutsianas, L.; McCarthy, D.J.; et al. The genetic architecture of type 2 diabetes. Nature 2016, 536, 41–47. [Google Scholar] [CrossRef] [Green Version]
  139. Mahajan, A.; Wessel, J.; Willems, S.M.; Zhao, W.; Robertson, N.R.; Chu, A.Y.; Gan, W.; Kitajima, H.; Taliun, D.; Rayner, N.W.; et al. Refining the accuracy of validated target identification through coding variant fine-mapping in type 2 diabetes. Nat. Genet. 2018, 50, 559–571. [Google Scholar] [CrossRef] [Green Version]
  140. Watanabe, K.; Taskesen, E.; van Bochoven, A.; Posthuma, D. Functional mapping and annotation of genetic associations with FUMA. Nat. Commun. 2017, 8, 1826. [Google Scholar] [CrossRef] [Green Version]
  141. Liberzon, A.; Subramanian, A.; Pinchback, R.; Thorvaldsdóttir, H.; Tamayo, P.; Mesirov, J.P. Molecular signatures database (MSigDB) 3.0. Bioinformatics 2011, 27, 1739–1740. [Google Scholar] [CrossRef]
  142. Baron, V.; Van Obberghen, E. Mechanism of insulin action. C. R. Seances Soc. Biol. Fil. 1995, 189, 25–41. [Google Scholar]
  143. King, A.J. The use of animal models in diabetes research. Br. J. Pharmacol. 2012, 166, 877–894. [Google Scholar] [CrossRef] [Green Version]
  144. Milojević, M.; Rožanc, J.; Vajda, J.; Ćurić, L.Č.; Paradiž, E.; Stožer, A.; Maver, U.; Vihar, B. In vitro disease models of the endocrine pancreas. Biomedicines 2021, 9, 1415. [Google Scholar] [CrossRef]
  145. Everaert, C.; Luypaert, M.; Maag, J.L.V.; Cheng, Q.X.; Dinger, M.E.; Hellemans, J.; Mestdagh, P. Benchmarking of RNA-sequencing analysis workflows using whole-transcriptome RT-qPCR expression data. Sci. Rep. 2017, 7, 1559. [Google Scholar] [CrossRef] [Green Version]
Figure 1. Comparison of approaches to gene expression analysis.
Genes 13 01176 g001
Figure 2. (a) Venn diagram showing the overlap between genes at significant GWAS loci for T2D and DEGs identified using RNA-seq and arrays in T2D patients; (b) A bar plot showing false discovery rate-adjusted enrichment p-values for the top 10 gene sets with a significant enrichment among 107 T2D DEGs identified by both transcriptomic studies and GWAS.
Genes 13 01176 g002
Table 1. Transcriptomic studies in T2D patients.
Sample TypeTranscriptomic TechniqueValidationStudy GroupReferences
PBMCMicroarrayqPCR43 newly diagnosed T1D, 12 newly diagnosed T2D, 24 HC [16]
Whole bloodMicroarrayqPCR6 patients with metabolic syndrome, 6 CAD, 8 T2D, 6 rheumatoid arthritis patients, 9 HC [17]
Whole bloodMicroarrayqPCR84 T2D, 60 HC [18,19]
Human islet cellsMicroarray7 non-diabetic subjects, 6 T2D donors [20]
Whole bloodMicroarray19 T1D, 20 T2D, 17 GDM [21]
Human islet cellsMicroarrayqPCR67 non-diabetic donors, 10 T2D donors [22]
PBMCMicroarrayqPCR5 poorly controlled T2D, 7 well-controlled T2D, 6 normoglycemic individuals [23]
PBMCMicroarray10 healthy individuals with extreme insulin resistance, 10 healthy individuals with extreme insulin sensitivity [24]
Whole bloodMicroarrayqPCR20 T2D with diabetic retinopathy, 10 T2D without diabetic retinopathy [25]
Abdominal omental adipose tissuesMicroarray12 T2D, 12 HC [26]
Adipose tissue from thighMicroarrayqPCR30 T2D, 30 HC [27]
PBMCMicroarrayqPCR5 poorly controlled T2D with dyslipidemia and periodontitis, 7 well-controlled T2D with dyslipidemia and periodontitis, 6 normoglycemic with dyslipidemia and periodontitis, 6 healthy individuals with periodontitis, 6 HC [28,29]
Whole bloodMicroarrayTaqMan Low Density Array2 T2D, 2 HC [30]
Whole bloodMicroarray12 T2D, 19 HC [31]
Neurone, astrocyte, and endothelial cellMicroarrayNanoString nCounter platform + Immunohistochemical validation of protein expression6 T2D, 6 HC [32]
Skeletal muscleRNA-Seq271 participants with glucose tolerance ranging from normal to newly diagnosed T2D [33]
PBMCRNA-Seq2 T2D, 2 CAD, 6 T2D + CAD, 7 HC [34]
Skin samplesRNA-Seq74 T2D, 148 HC [35]
Endothelial cells from cubital veinRNA-Seq5 T2D, 5 HC [36]
Whole bloodRNA-Seq6 T2D with thirst and fatigue, 6 HC [37]
NeutrophilsRNA-SeqqPCR5 newly diagnosed T2D, 5 HC [38]
Visceral adipose tissueRNA-SeqqPCR10 T2D, 10 HC [39]
Adipose tissue from thighRNA-SeqqPCR5 T2D, 5 HC [40]
NeutrophilsRNA-Seq11 T2D, 7 HC [41]
Human islet cellsSingle-cell RNA-SeqRNA in situ hybridization4 T2D, 6 HC [42]
Human islet cellsSingle-cell RNA-Seq6 T2D, 12 HC [43]
Human islet cellsSingle-cell RNA-Seq1 T1D donor, 3 T2D donors, 2 children, 3 HC [44]
Human islet cellsSingle-cell RNA-SeqRNA in situ hybridization3 T2D, 5 HC [45]
PBMC—peripheral blood mononuclear cells; HC—healthy controls; T1D—type 1 diabetes; T2D—type 2 diabetes mellitus; GDM—gestational diabetes mellitus; CAD—coronary artery disease. Studies are divided by method (microarray, RNA-seq, single-cell RNA-Seq).
Publisher’s Note: MDPI stays neutral with regard to jurisdictional claims in published maps and institutional affiliations.

