Article

A Novel Cuproptosis-Related Prognostic Gene Signature and Validation of Differential Expression in Clear Cell Renal Cell Carcinoma

1
Department of Big Data in Health Science, School of Public Health, Zhejiang University School of Medicine, Hangzhou 310058, China
2
Department of Surgical Oncology, Affiliated Sir Run Run Shaw Hospital, Zhejiang University School of Medicine, Hangzhou 310016, China
*
Authors to whom correspondence should be addressed.
These authors contributed equally to this work.
Genes 2022, 13(5), 851; https://doi.org/10.3390/genes13050851
Submission received: 4 April 2022 / Revised: 2 May 2022 / Accepted: 5 May 2022 / Published: 10 May 2022

Abstract

:
Clear cell renal cell carcinoma (ccRCC) is the most prevalent subtype of renal cell carcinoma, which is characterized by metabolic reprogramming. Cuproptosis, a novel form of cell death, is highly linked to mitochondrial metabolism and mediated by protein lipoylation. However, the clinical impacts of cuproptosis-related genes (CRGs) in ccRCC largely remain unclear. In the current study, we systematically evaluated the genetic alterations of cuproptosis-related genes in ccRCC. Our results revealed that CDKN2A, DLAT, DLD, FDX1, GLS, PDHA1 and PDHB exhibited differential expression between ccRCC and normal tissues (|log2(fold change)| > 2/3 and p < 0.05). Utilizing an iterative sure independence screening (SIS) method, we separately constructed the prognostic signature of CRGs for predicting the overall survival (OS) and progression-free survival (PFS) in ccRCC patients. The prognostic score of CRGs yielded an area under the curve (AUC) of 0.658 and 0.682 for the prediction of 5-year OS and PFS, respectively. In the Kaplan−Meier survival analysis of OS, a higher risk score of cuproptosis-related gene signature was significantly correlated with worse overall survival (HR = 2.72 (2.01–3.68), log-rank p = 1.76 × 10⁻⁷). Patients with a higher risk had a significantly shorter PFS (HR = 2.83 (2.08–3.85), log-rank p = 3.66 × 10⁻⁷). Two independent validation datasets (GSE40435 (N = 101), GSE53757 (N = 72)) were collected for meta-analysis, suggesting that CDKN2A (log2(fold change) = 1.46, 95%CI: 1.75–2.35) showed significantly higher expression in ccRCC tissues while DLAT (log2(fold change) = −0.54, 95%CI: −0.93–−0.15) and FDX1 (log2(fold change) = −1.01, 95%CI: −1.61–−0.42) were lowly expressed. The expression of CDKN2A and FDX1 in ccRCC was also significantly associated with immune infiltration levels and programmed cell death protein 1 (PD-1) expression (CDKN2A: r = 0.24, p = 2.14 × 10⁻⁸; FDX1: r = −0.17, p = 1.37 × 10⁻⁴). In conclusion, the cuproptosis-related gene signature could serve as a potential prognostic predictor for ccRCC patients and may offer novel insights into the cancer treatment.

1. Introduction

Renal cell carcinoma (RCC) is one of the most common cancer types in the urinary system affecting more than 430,000 individuals in 2020 worldwide [1]. Clear cell renal cell carcinoma (ccRCC) is the most prevalent and aggressive subtype accounting for about 70% of all RCCs [2]. Clinically, approximately a third of ccRCC patients will present with metastasis at the initial diagnosis, and a quarter of patients with localized disease will have a relapsing metastasis after curative surgical resection. ccRCC in the metastatic form is always associated with high mortality [3,4]. Therefore, given the substantial incidence and mortality of ccRCC, there is an urgent need to develop more efficient prognostic models.
Copper is an indispensable trace element involved in various biological processes. Recent studies showed that the copper levels of cancer patients are significantly elevated both in serum and tumor tissues compared to healthy counterparts [5,6,7]. While dysregulation of copper homeostasis may trigger cytotoxicity, alterations in intracellular copper levels may influence the development and progression of cancer [8]. Based on this mechanism, copper ionophores (disulfiram, dithiocarbamates, elesclomol, etc.) and copper chelators (trientine, tetrathiomolybdate, etc.) have been applied in anticancer treatment [9,10,11,12]. Recently, attention has been brought to a novel cell death pathway termed cuproptosis, and it has been proven that copper binds directly to the lipoylated components of the tricarboxylic acid (TCA) cycle, leading to toxic protein stress and, ultimately, cell death [13]. ccRCC is generally accompanied by a reprogramming of the tricarboxylic acid (TCA) cycle, downregulating the energy production through a TCA cycle and enabling tumor cells to survive in conditions of nutrient depletion and hypoxia and escape from the immune system [14,15,16]. Several genes involved in copper-induced cell death were identified, which may offer novel strategies to predict the prognosis of ccRCC patients.
In the present study, we intended to comprehensively investigate the molecular alterations and clinical relevance of cuproptosis-related genes (CRGs) in ccRCC. Our analysis highlights the importance of CRGs in ccRCC development and lays a foundation for the therapeutic application of cuproptosis regulators in ccRCC.

2. Materials and Methods

2.1. Multiomics Data Source and Preprocessing

We obtained data of cuproptosis-related genes and clinical information of ccRCC patients from the The Cancer Genome Atlas (TCGA) database (https://portal.gdc.cancer.gov//, accessed on 15 March 2022). A total of 524 ccRCC patients and 72 adjunct nontumor samples were involved in the present study. Gene expression was measured with STAR as raw read counts, which subsequently transformed into transcripts per million (TPM). All gene features (e.g., chromosome positions, gene types, Ensembl IDs and official symbols) were annotated by the GENCODE project (v22) [17]. Clinical covariates, including the overall survival outcome, age, gender, tumor stage and histological grade, were attained from the previous related resource [18]. Only ccRCC patients with survival information were included in this study.
Somatic mutation data of ccRCC from whole exome/genome sequencing (WXS/WGS) were downloaded from the GDC TCGA-ccRCC project on the UCSC Xena server [19]. The MuTect2 algorithm, which assigns higher levels of confidence to somatic variants [20], was employed to identify additional germline mutations. Oncoplot was drawn according to the descending order of mutations using the R package “maftools” [21].
Digital focal-level copy number variation (CNV) values were calculated from tumor aliquots using a “masked copy number fragment” file by GISTIC2 [22] at the item level and then cut by a noise threshold of 0.3. A Cleveland dot plot was drawn to visualize the frequency of CNV by the R package “ggpubr”.

2.2. Differential Expression Analysis and Validation

We investigated the differential expression levels of CRGs between tumor and normal samples. Under the criterion of |log2(fold change) | > 2/3 and p < 0.05, we considered it as statistically significant.
For validation, we collected 2 datasets (GSE40435 [23] and GSE53757 [24]) of 173 ccRCC samples from Gene Expression Omnibus (GEO). These data were generated using the platform of Affymetrix Human Genome U133 Plus 2.0 Array (GPL570). Box plots were adopted to compare the expression of CRGs in various datasets using the R package “ggplot2”.
After computing the log2 fold change and 95% confidence intervals, we performed a meta-analysis of the results of differential expression to improve the statistical power of our study. We used the Q test (I2 statistics) as the assessment of the heterogeneity between multiple datasets. If there was no obvious heterogeneity (I2 < 50%, p > 0.05), a fixed effects model was chosen. Otherwise, we selected a random effects model. A forest plot was utilized to show fold change and related 95% CI of CRGs using the R package “forestplot”.

2.3. Gene Network and Enrichment Analysis of CRGs

To analyze the potential interactions of these genes, we performed a gene network analysis with the GENEMANIA website [25]. Furthermore, we implemented pathway enrichment analysis of CRGs with the Metascape [26] website. Gene Ontology (GO) as well as Kyoto Encyclopedia of Genes and Genomes (KEGG) were used as references, and enrichment analysis was performed by the R package “clusterProfiler” [27]. We applied the Benjamini−Hochberg method for the multiple correction, and a false discovery rate (FDR) < 0.05 was considered to be of significance.

2.4. Construct Prognostic Signature of Cuproptosis-Related Genes with Penalized Regression

To quantify cuproptosis-related genes at the individual level, we developed a signature based on iterative sure independence screening (SIS) [28]. We used SIS and least absolute shrinkage and selection operator (LASSO)−penalized Cox regression to screen for CRGs associated with survival using the R package “SIS” [29].
We then calculated the risk score using the regression coefficients of the identified prognostic signature of CRGs for OS and PFS, respectively. Subsequently, we classified patients into the high-risk and low-risk groups according to the median value of risk scores. The Kaplan−Meier survival curve was plotted to compare the OS or PFS between high-risk and low-risk groups by the R package “ggsurvplot”. Utilizing the signature, we also computed the 1-year survival, 3-year survival and 5-year survival based on the nearest neighbor nstimation (NNE) method [30]. Receiver operating characteristic (ROC) curves were computed for presenting the prediction ability using the R package “survivalROC”. In addition, we investigated potential differences among subgroups stratified by age, gender and tumor stage. Enhanced regression nomograms of CRG scores and other clinical covariates of ccRCC patients were constructed by the R package “regplot”. The calibration curves of the CRGs’ scores and other clinical covariates of ccRCC patients were estimated using 1000 bootstrapping to determine bias-corrected estimates of predicted versus observed values, which was analyzed using the R package “rms”.

2.5. Analysis of Correlation with Immune Infiltration

A Tumor Immune Estimation Resource (TIMER; cistrome.shinyapps.io/timer) [31] was used to investigate the relationship between the expression of CRGs and the abundance of six immune cells (CD4+ T cells, CD8+ T cells, B cells, neutrophils, dendritic cells and macrophages).
We also examined three important immune checkpoints (ICKs), including PD-1, PD-L1 and TIM-3 since the expression level of immune checkpoint-related genes is related to the treatment response of immune checkpoint inhibitors [32].
The Pearson correlation analysis was used to examine the association between TME or ICKs and CRGs.

2.6. Statistical Analysis

First, we performed a descriptive statistical analysis of ccRCC patients in TCGA. Continuous variables were described as mean ± standard deviation, and categorical variables were described by frequency and proportion. A Kruskal−Wallis rank sum test [33] was applied to examine the difference of CRG expression in various classifications of pathologic stage and histological grade of ccRCC patients.
We utilized the Benjamini−Hochberg method for multiple correction, and a FDR < 0.05 was the standard of statistical significance [34]. All statistical analyses were performed using R version 4.1.1 (The R Foundation). p values were two-sided, and we considered a level of p value less than 0.05 to be statistically significant.

3. Results

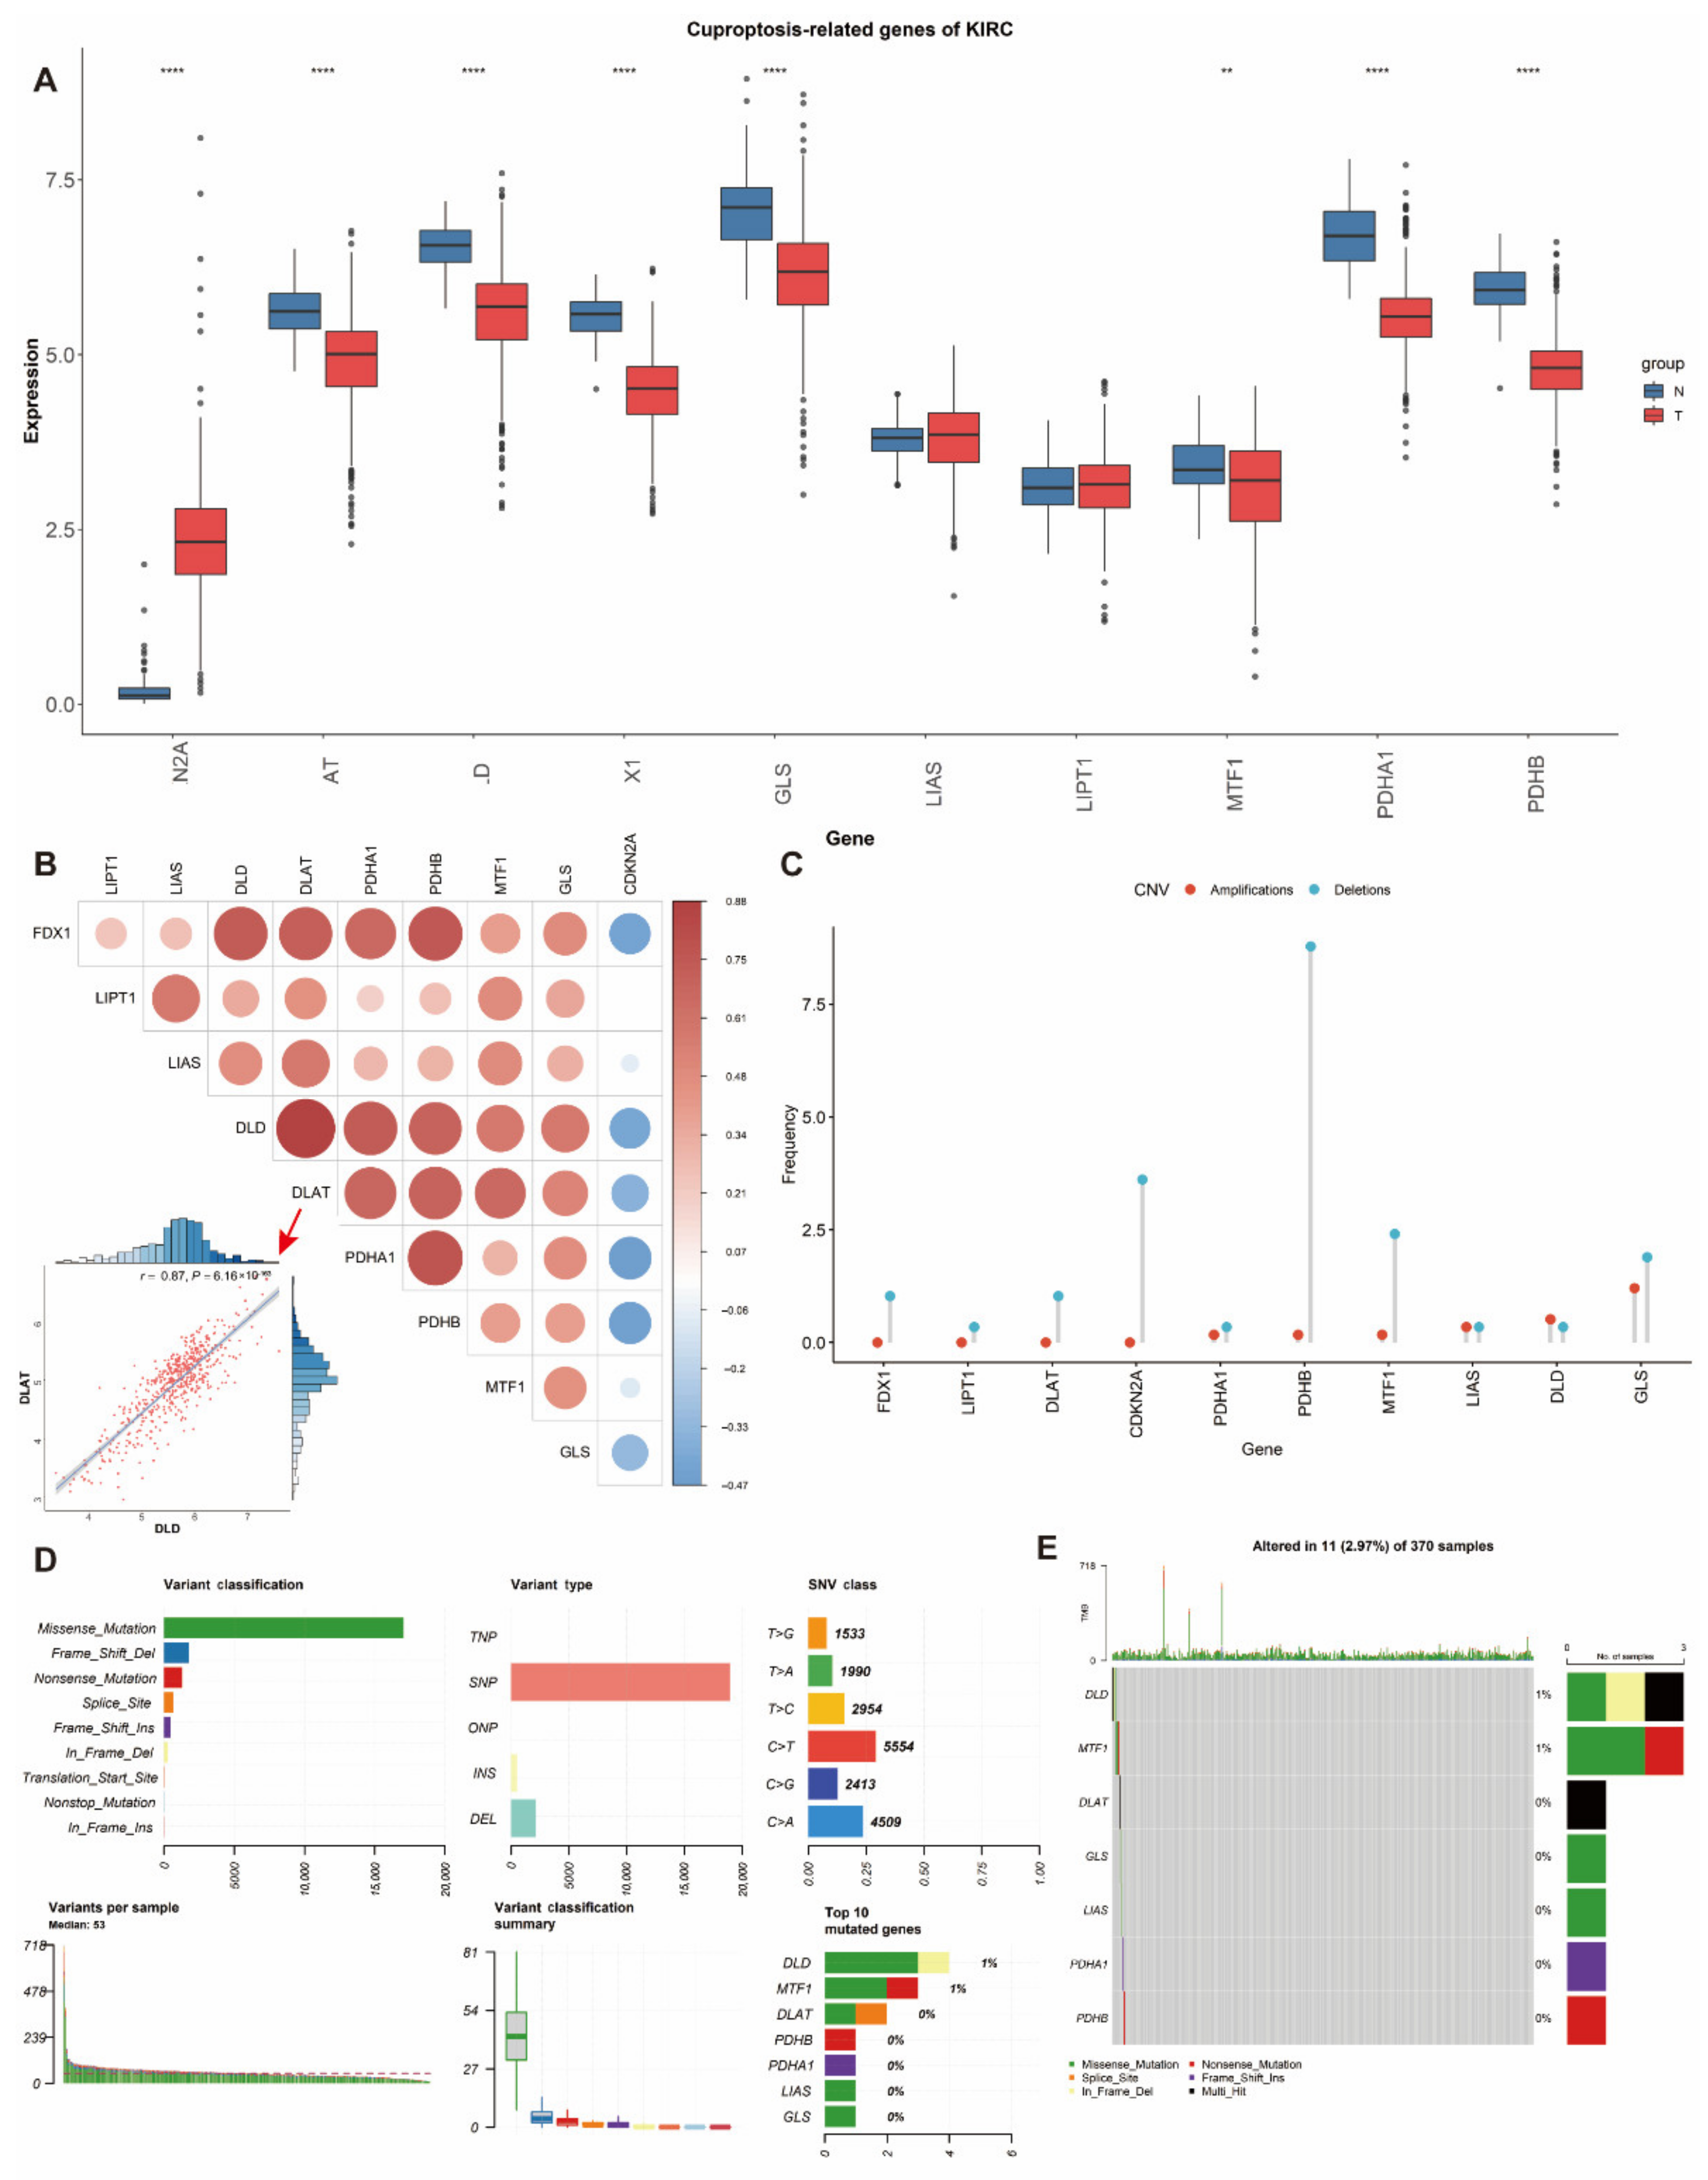
3.1. Differential Expression and Genetic Alterations of Cuproptosis-Related Genes in ccRCC

We curated a catalog of 10 genes (CDKN2A, FDX1, DLD, DLAT, LIAS, GLS, LIPT1, MTF1, PDHA1 and PDHB) that function closely with cuproptosis [13]. In comparison of differentially expressed genes between tumor and normal tissues in ccRCC patients from TCGA, only CDKN2A (log2(fold change) = 2.12, p = 1.50 × 10−155) showed significantly higher expression while DLAT (log2(fold change) = −0.73, p = 5.12 × 10⁻²⁶), DLD (log2 (fold change) = −0.97, p = 5.99 × 10−47), FDX1 (log2 (fold change) = −1.07, p = 9.21 × 10−54), GLS(log2 (fold change) = −0.94, p = 2.85 × 10⁻²²), PDHA1(log2 (fold change) = −1.14, p = 7.17 × 10⁻³²) and PDHB(log2 (fold change) = −1.12, p = 2.59 × 10−46) showed lower expression in ccRCC tissues than normal tissues (Figure 1A, Table S1). In addition, we investigated the correlation between the expression of different genes, which revealed strong associations (Figure 1B). For instance, DLD was highly and positively correlated with DLAT (r = 0.87, p = 6.16 × 10−163) (Figure 1B).
The prevalence of cuproptosis-related alterations among ccRCC samples was first determined with a focus on somatic mutations and CNVs (Figure 1C–E). The CNV alterations were not universally prevalent among these genes (Figure 1C). The primary genes with CNV deletions were PDHB and CDKN2A. In contrast, GLS had the highest CNV amplifications. It is also interesting to notice the rare changes of DLD in mutation and CNV frequency. The somatic mutation status of 11 out of 370 (2.97%) ccRCC samples is shown (Figure 1D,E). According to the classification of mutations, we noticed that missense mutation was the most frequent (Figure 1D). SNP was the most prevalent variant type, and C > T (5554) ranked at the top in the single nucleotide variant (SNV) classes. We also found that DLD (1%) and MTF1 (1%) showed higher mutation frequencies than others (Figure 1E).

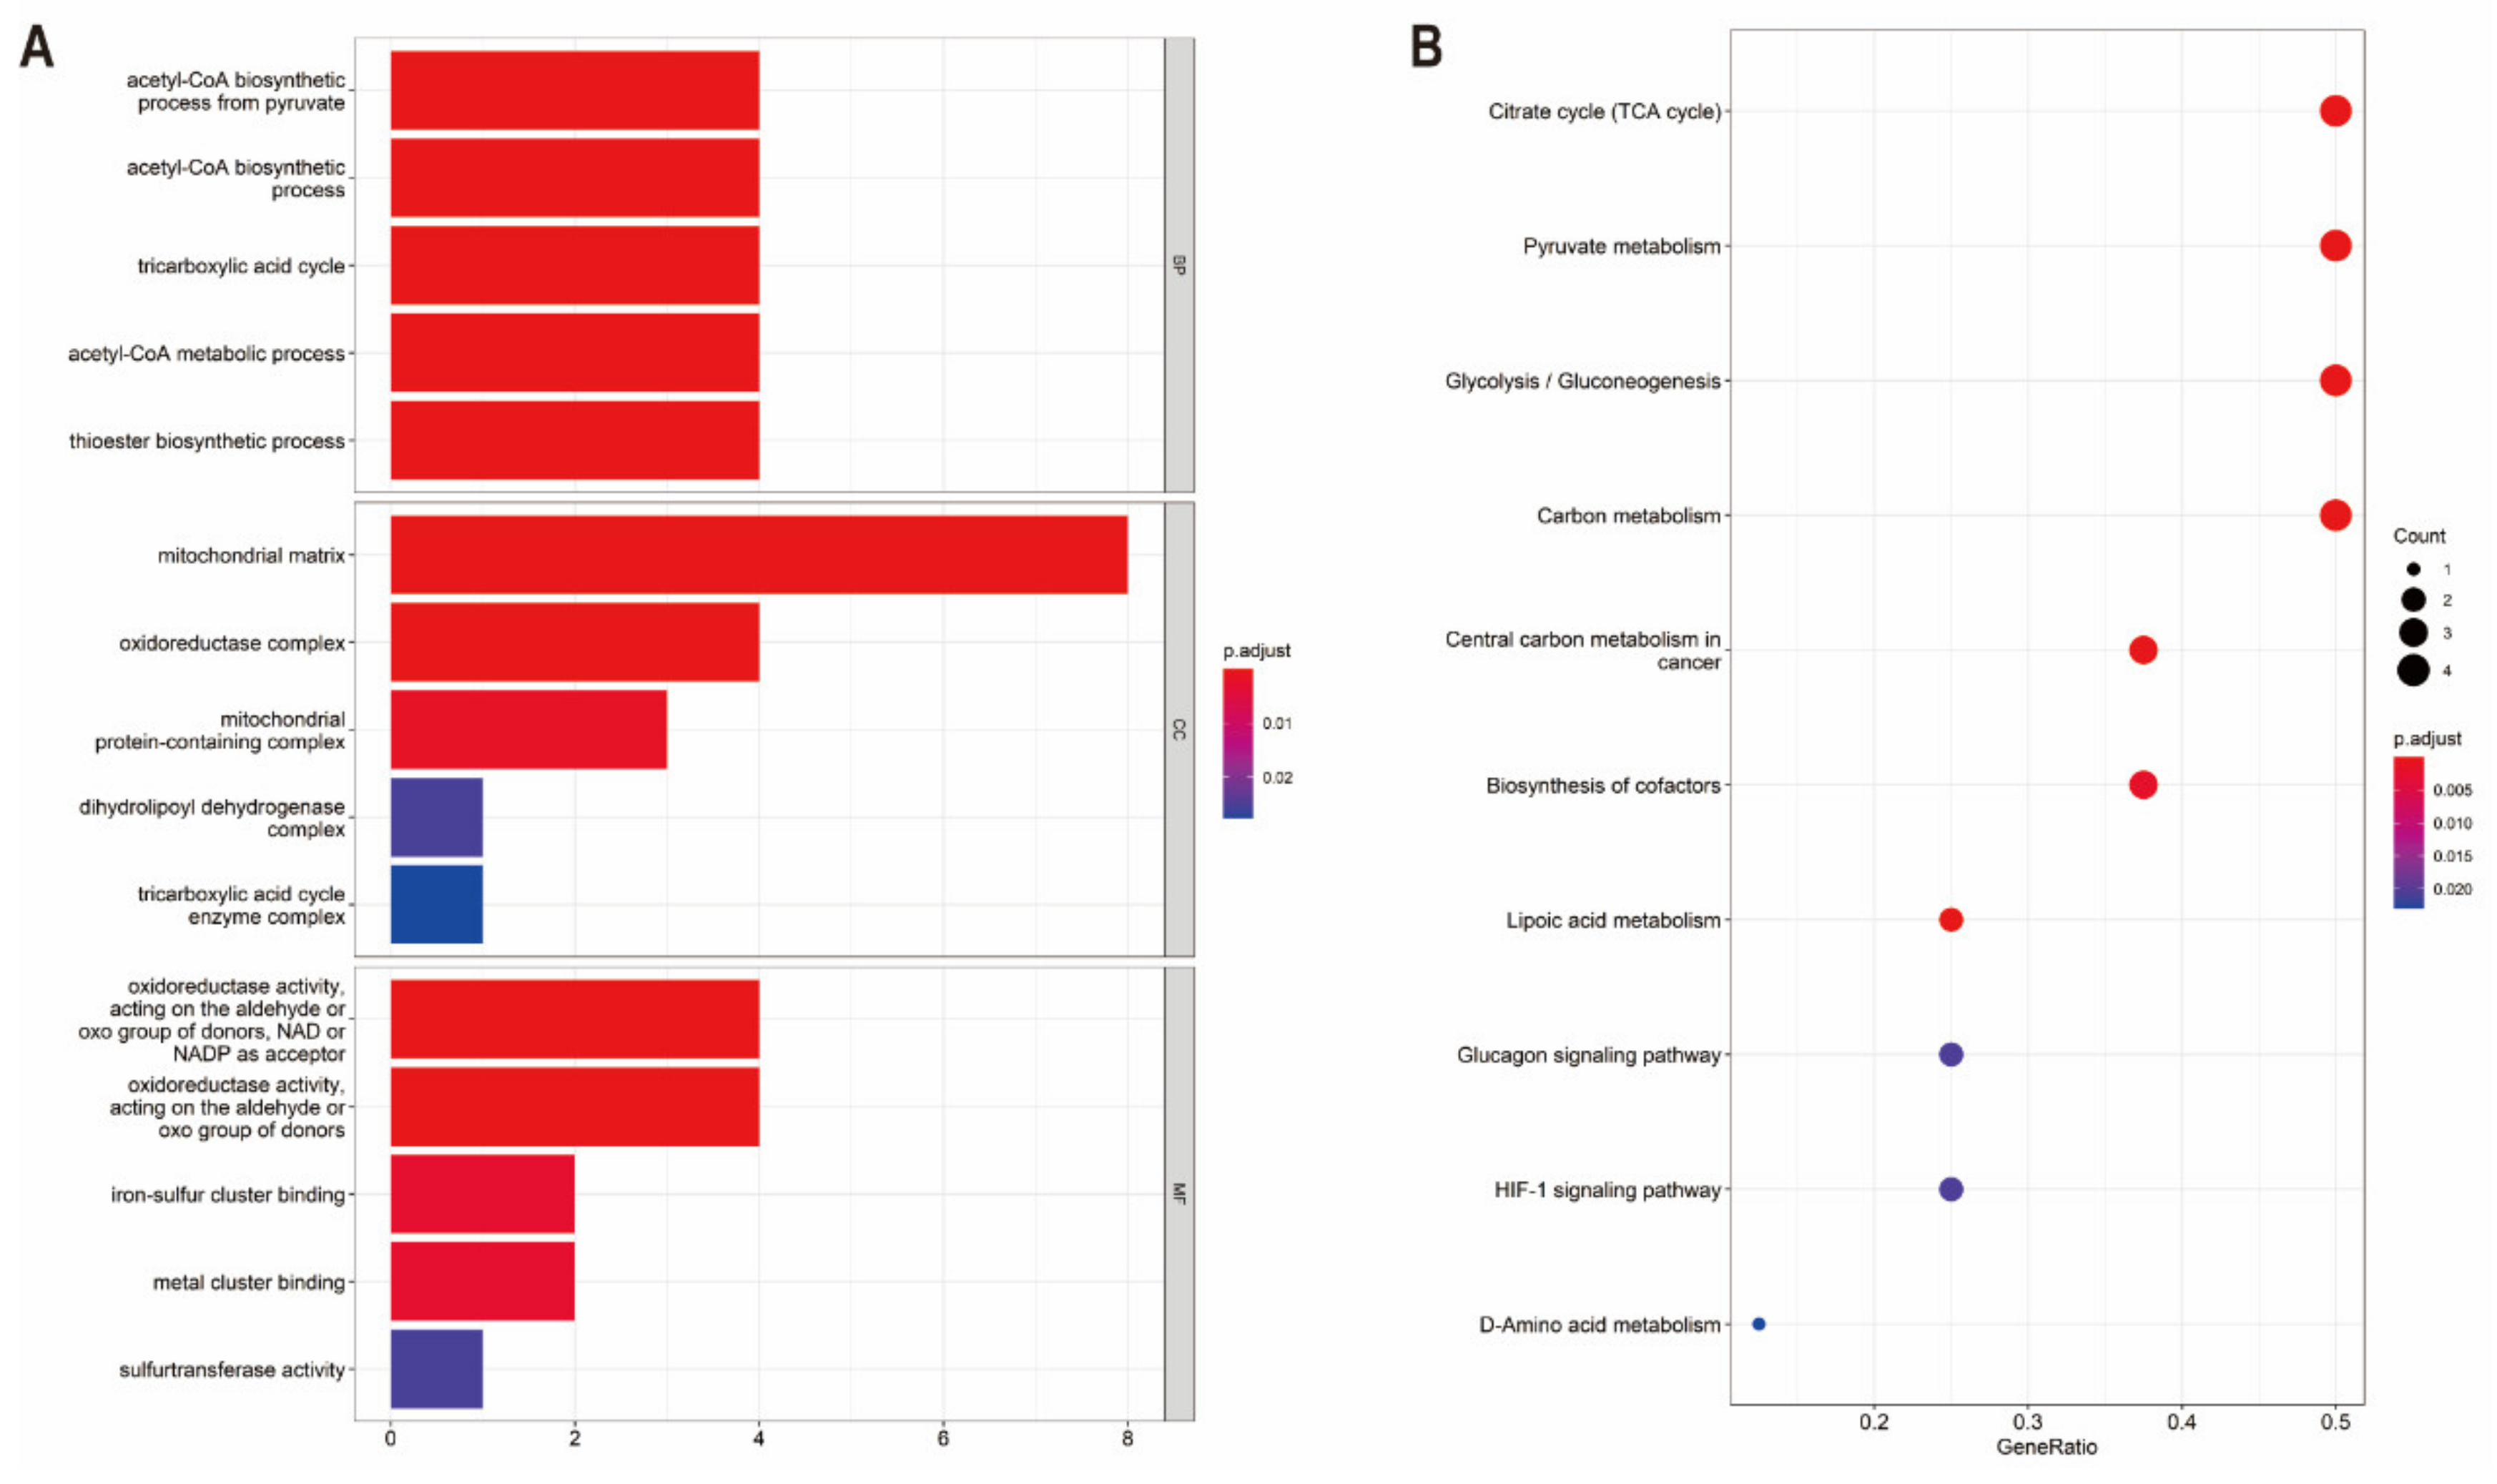
3.2. Functional Enrichment and Protein–Protein Interaction Analysis of CRGs

To demonstrate the biological functions of CRGs, relevant pathways were analyzed by GO and KEGG databases. The biological processes of the 10 CRGs mainly involved in the GO analysis were the acetyl-CoA biosynthetic process from pyruvate, acetyl-CoA biosynthetic process, tricarboxylic acid cycle, acetyl-CoA metabolic process, thioester biosynthetic process, mitochondrial matrix, oxidoreductase complex, mitochondrial protein-containing complex, dihydrolipoyl dehydrogenase complex, tricarboxylic acid cycle enzyme complex, oxidoreductase activity, iron−sulfur cluster binding and metal cluster binding (Figure 2A). Additionally, in the KEGG pathway enrichment analysis, the 10 CRGs were largely related to the TCA cycle, pyruvate metabolism, glycolysis/gluconeogenesis, carbon metabolism, lipoic acid metabolism, central carbon metabolism in cancer, biosynthesis of cofactors, glucagon signaling pathway, HIF-1 signaling pathway and D-Amino acid metabolism (Figure 2B). A Protein–Protein Interaction (PPI) analysis was performed to explore the interactions of CRGs, showing that DLD, PDHB, DLAT and PDHA1 were hub genes (Figure S1).

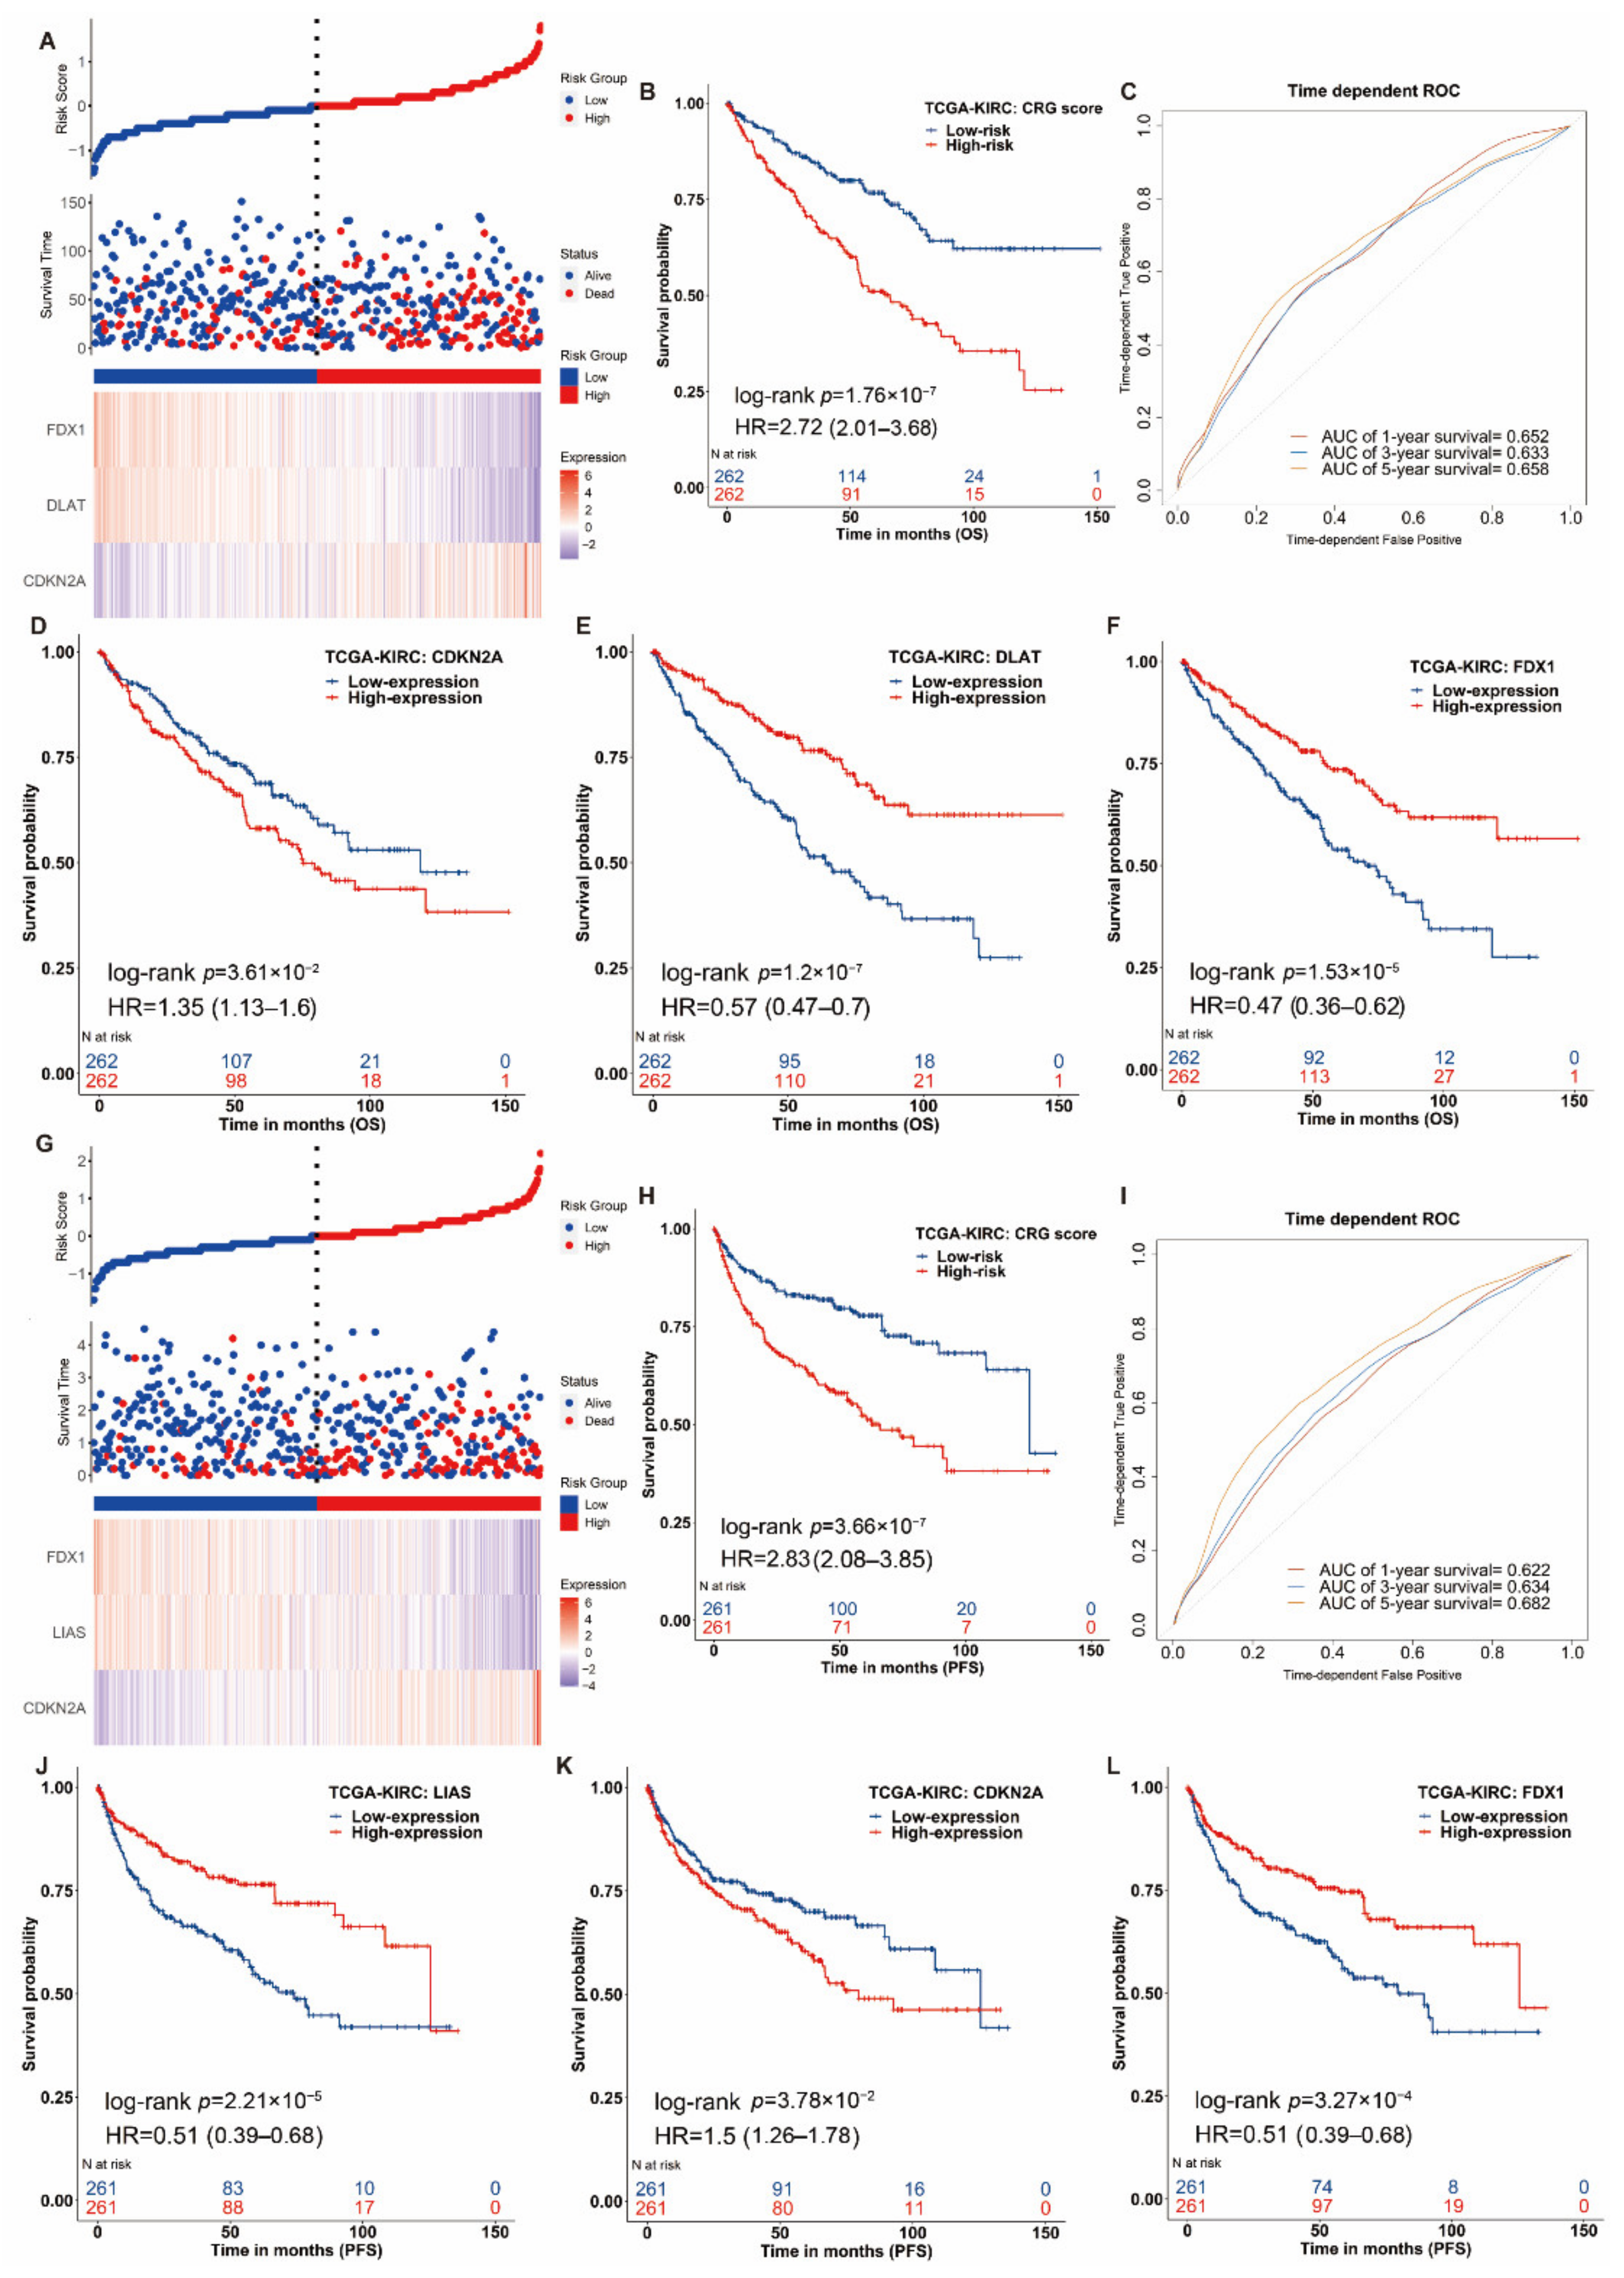
3.3. Construction of the Prognostic Signature of Cuproptosis-Related Genes in ccRCC

We further evaluated the association between the expression of CRGs and the prognosis in ccRCC. We found that all these genes except GLS were highly correlated with the overall survival (OS) in the univariate Cox proportional hazard regression model after the adjustment of age, gender, race and pathologic stage (Table S2). The hazards ratios of FDX1 (HR = 0.54 (0.41–0.71), p = 1.56 × 10⁻⁵), DLD (HR = 0.74 (0.60–0.91), p = 4.10 × 10⁻³), DLAT (HR = 0.66 (0.54–0.82), p = 1.68 × 10⁻⁴), PDHB (HR = 0.70 (0.51–0.96), p = 2.91 × 10⁻²), MTF1 (HR = 0.76 (0.61–0.94), p = 1.01 × 10⁻²) and CDKN2A (HR = 1.21 (1.01–1.45), p = 3.52 × 10⁻²) remained statistically significant (Table S2). CDKN2A exhibited oncogenic features, the overexpression of which was associated with worse survival in ccRCC patients (HR = 1.21 (1.01–1.45), p = 3.52 × 10⁻², Table S2). On the contrary, high expression of the other nine genes (FDX1, LIPT1, LIAS, DLD, DLAT, PDHA1, PDHB, MTF1 and GLS) was remarkably related to better survival in ccRCC, showing features of tumor suppressors (Table S2).
Then, we separately constructed the prognostic signature of CRGs for OS and PFS in ccRCC utilizing SIS. For OS outcomes of ccRCC patients, three genes were selected to construct the prognostic score using their regression coefficients: Scoreos = −0.44 × FDX1−0.28 × DLAT + 0.23 × CDKN2A. A higher risk score of CRGs’ signature was significantly associated with poor OS (HR = 2.72(2.01–3.68), log-rank p = 1.76 × 10⁻⁷, Figure 3A,B). We also applied a weighted risk score incorporating all related genes to estimate 1-, 3- and 5-year OS (Figure 3C,F). The prediction accuracy evaluated by AUCs was reported to be 0.652, 0.633 and 0.658 in the 1-year, 3-year and 5-year ROC curves, respectively. For PFS, we built a risk score of cuproptosis-related gene signature using the following formula: risk score = i = 1 n C o e f   G e n e × E x p r G e n e where Coef (Gene) was the coefficient of genes (i.e., FDX1, DLAT and CDKN2A) correlated with PFS, and Expr (Gene) was the expression signature of corresponding genes. The same analyses were conducted for the PFS outcome. Patients with a higher risk score had significantly shorter PFS (HR = 2.83 (2.08–3.85), log-rank p = 3.66 × 10⁻⁷, Figure 3G,H), and the reported AUCs of 1-year, 3-year and 5-year ROC curves for the prediction of PFS were 0.622, 0.634 and 0.682, respectively (Figure 3G,I). In different subgroups of age, gender and pathologic stage, the CRG risk score also had a good performance (Table S3). In short, our constructed individual-level cuproptosis-related risk signature showed a significant association with survival of ccRCC.

3.4. Nomogram Development and Validation for ccRCC

To facilitate the clinical application of the prediction model, we integrated clinical information and gene features of patients from TCGA and performed the multivariable Cox regression model to develop the nomogram. Discrimination and calibration methods were applied in both OS and PFS outcomes (Figure 4). The c-index was calculated to be 0.77 for OS and 0.824 for PFS, reflecting a relatively excellent predictive performance of the nomogram. Meanwhile, calibration plots demonstrated favorable concordance between the predicted OS or PFS and the observed OS or PFS at 1, 3 and 5 years of survival (Figure 4C,F).

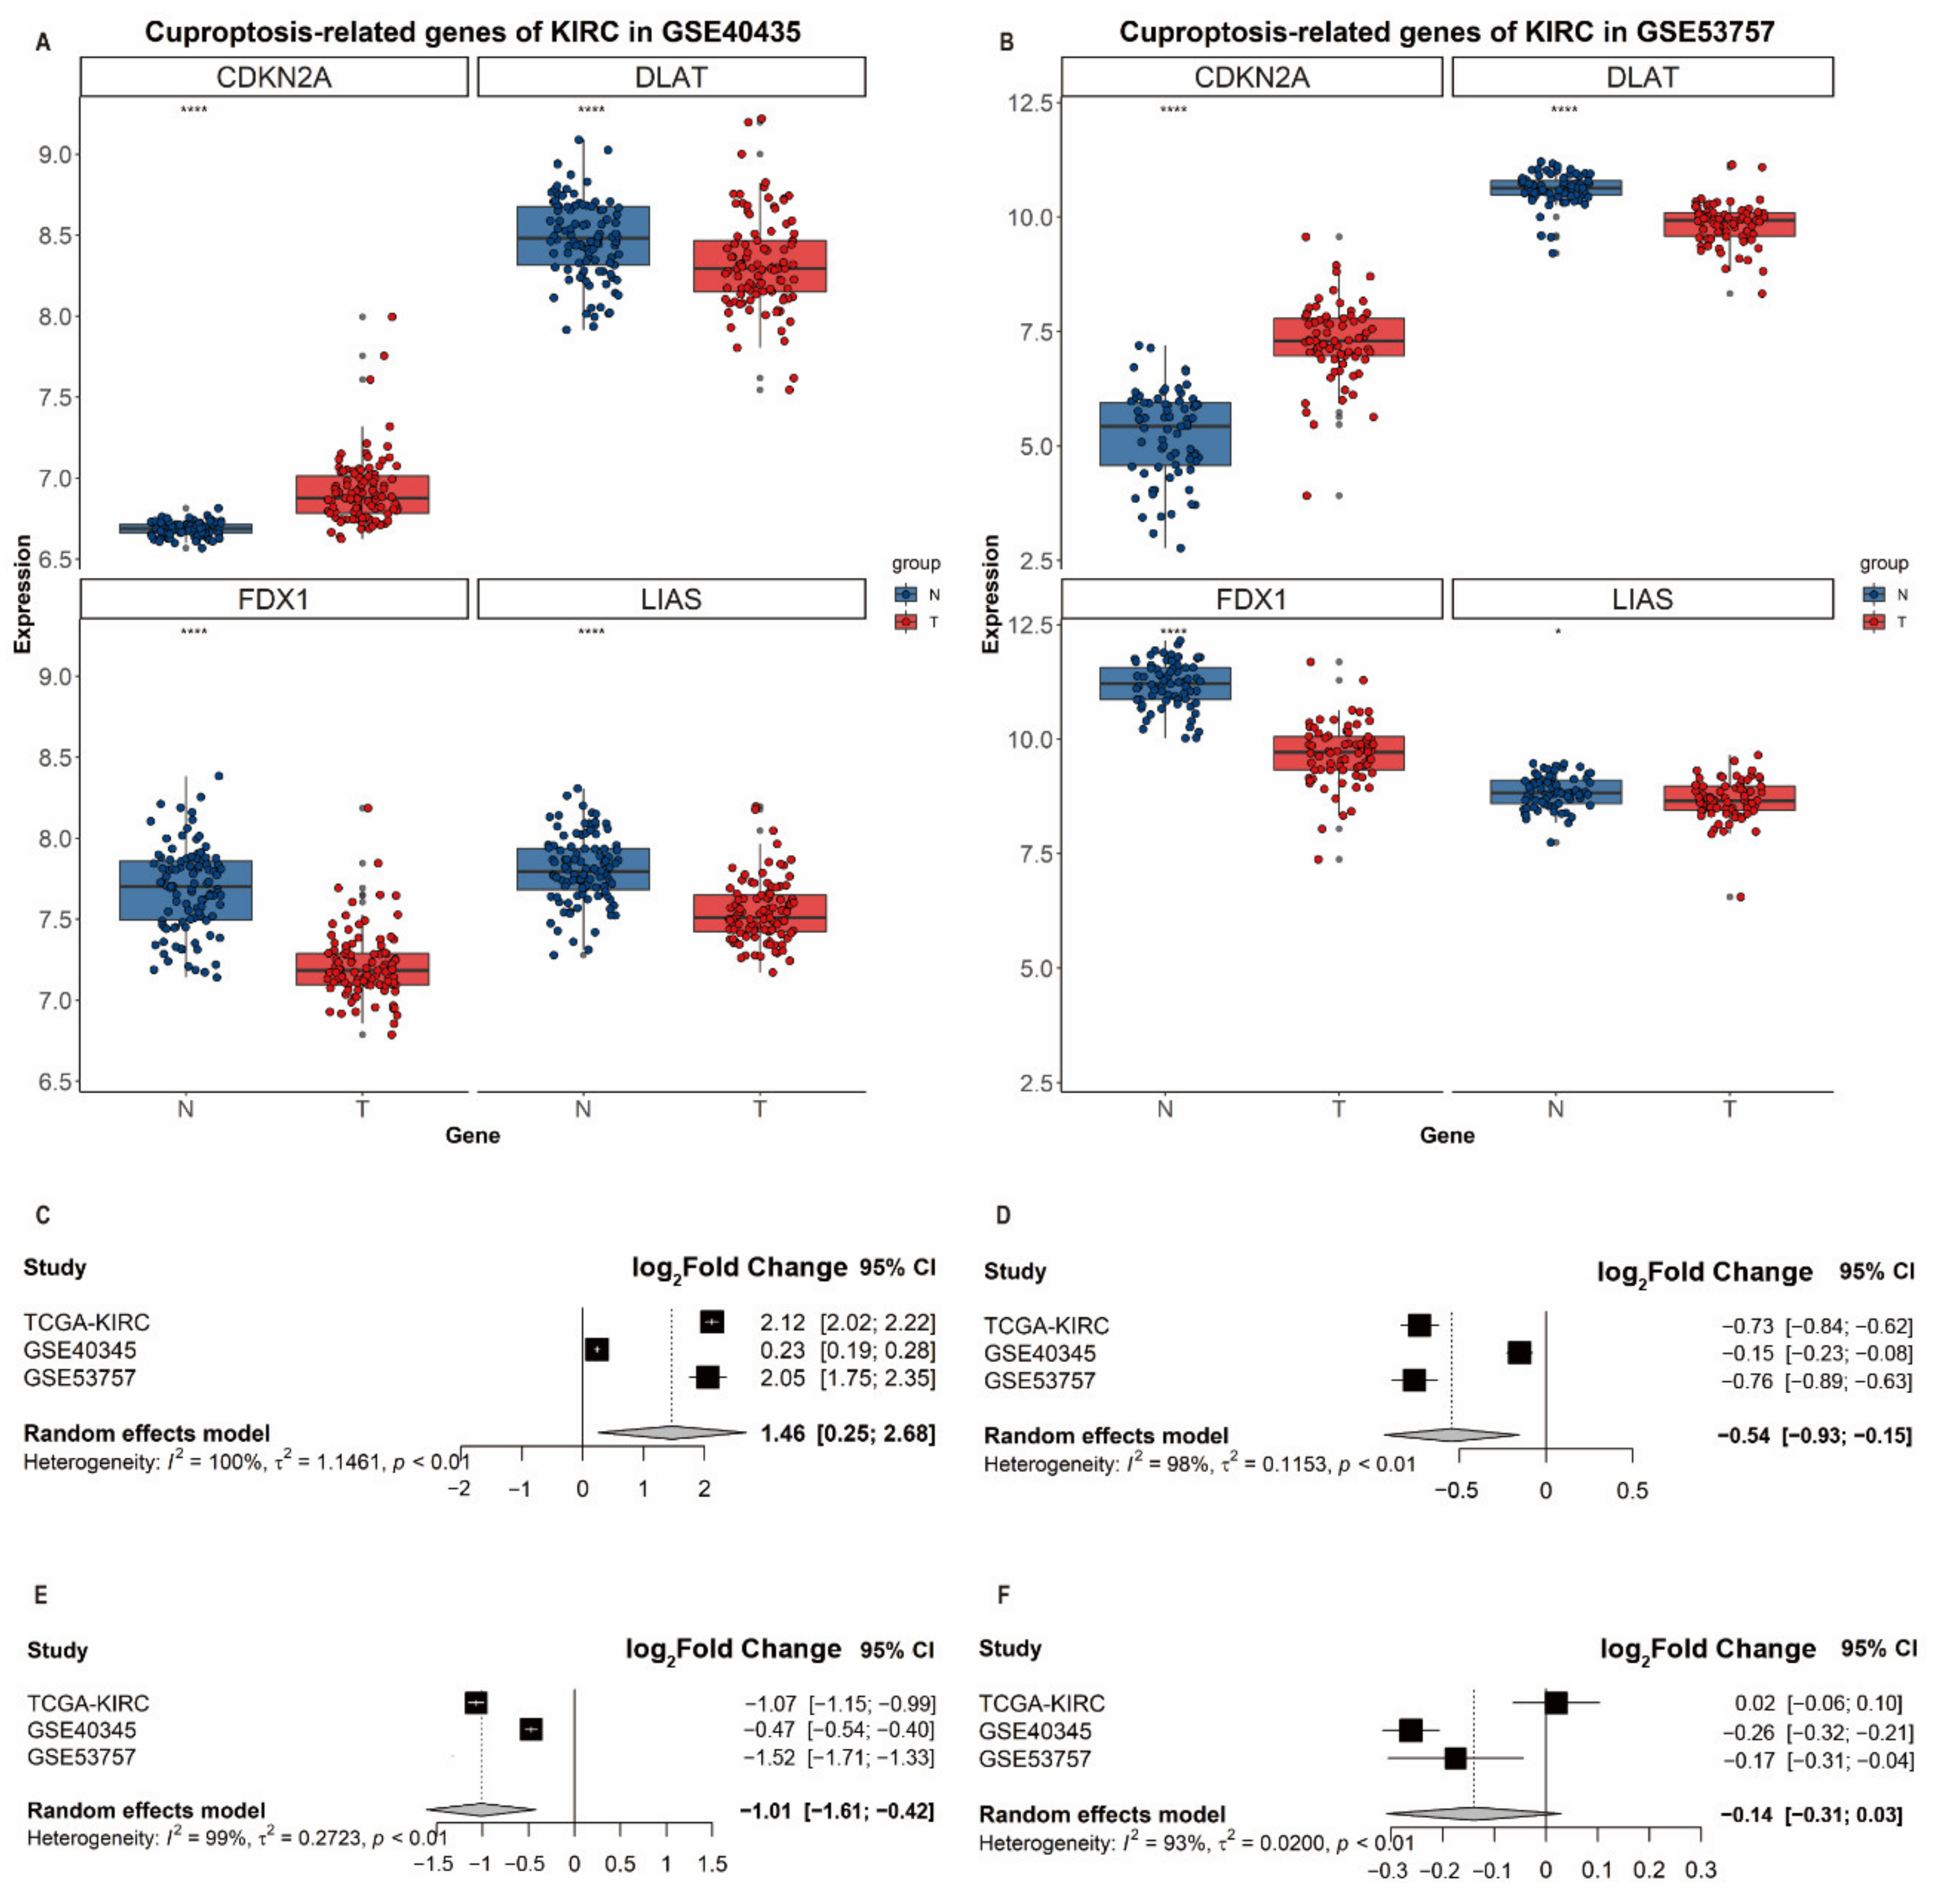
3.5. Validation of Differential Expression of CDKN2A, DLAT, FDX1 and LIAS in ccRCC

To validate the associations of differential expression levels of identified genes with ccRCC, we collected two independent validation GEO datasets (i.e., GSE40435 and GSE53757) and performed a meta-analysis to derive the summary effect estimates. GSE40435 enrolled 101 adjacent nontumor tissues and 101 ccRCC tissues while GSE53757 included 72 normal and ccRCC tissues. In GEO datasets, CDKN2A showed a significantly higher expression in ccRCC tissues (GSE40435: log2(fold change) = 0.23, p = 3.76 × 10⁻¹⁹; GSE53757: log2(fold change) = 2.05, p = 5.02 × 10⁻²⁷, Supplementary Table S1) while DLAT, FDX1 and LIAS were significantly downregulated in their expression levels in ccRCC tissues (Figure 5A,B). Due to the presence of heterogeneity between these three datasets, we, therefore, adopted the random effects model for the meta-analysis; we found that the expression levels of CDKN2A (log2(fold change) = 1.46, 95%CI: 1.75–2.35), DLAT (log2(fold change) = −0.54, 95%CI: −0.9–−0.15) and FDX1 (log2(fold change) = −1.01, 95%CI: −1.61–−0.42) (Figure 5C–F) were significantly differential between ccRCC and normal tissues, which revealed the role of FDX1 and DLAT as tumor suppressor genes and the role of CDKN2A as a cancer promotor gene.

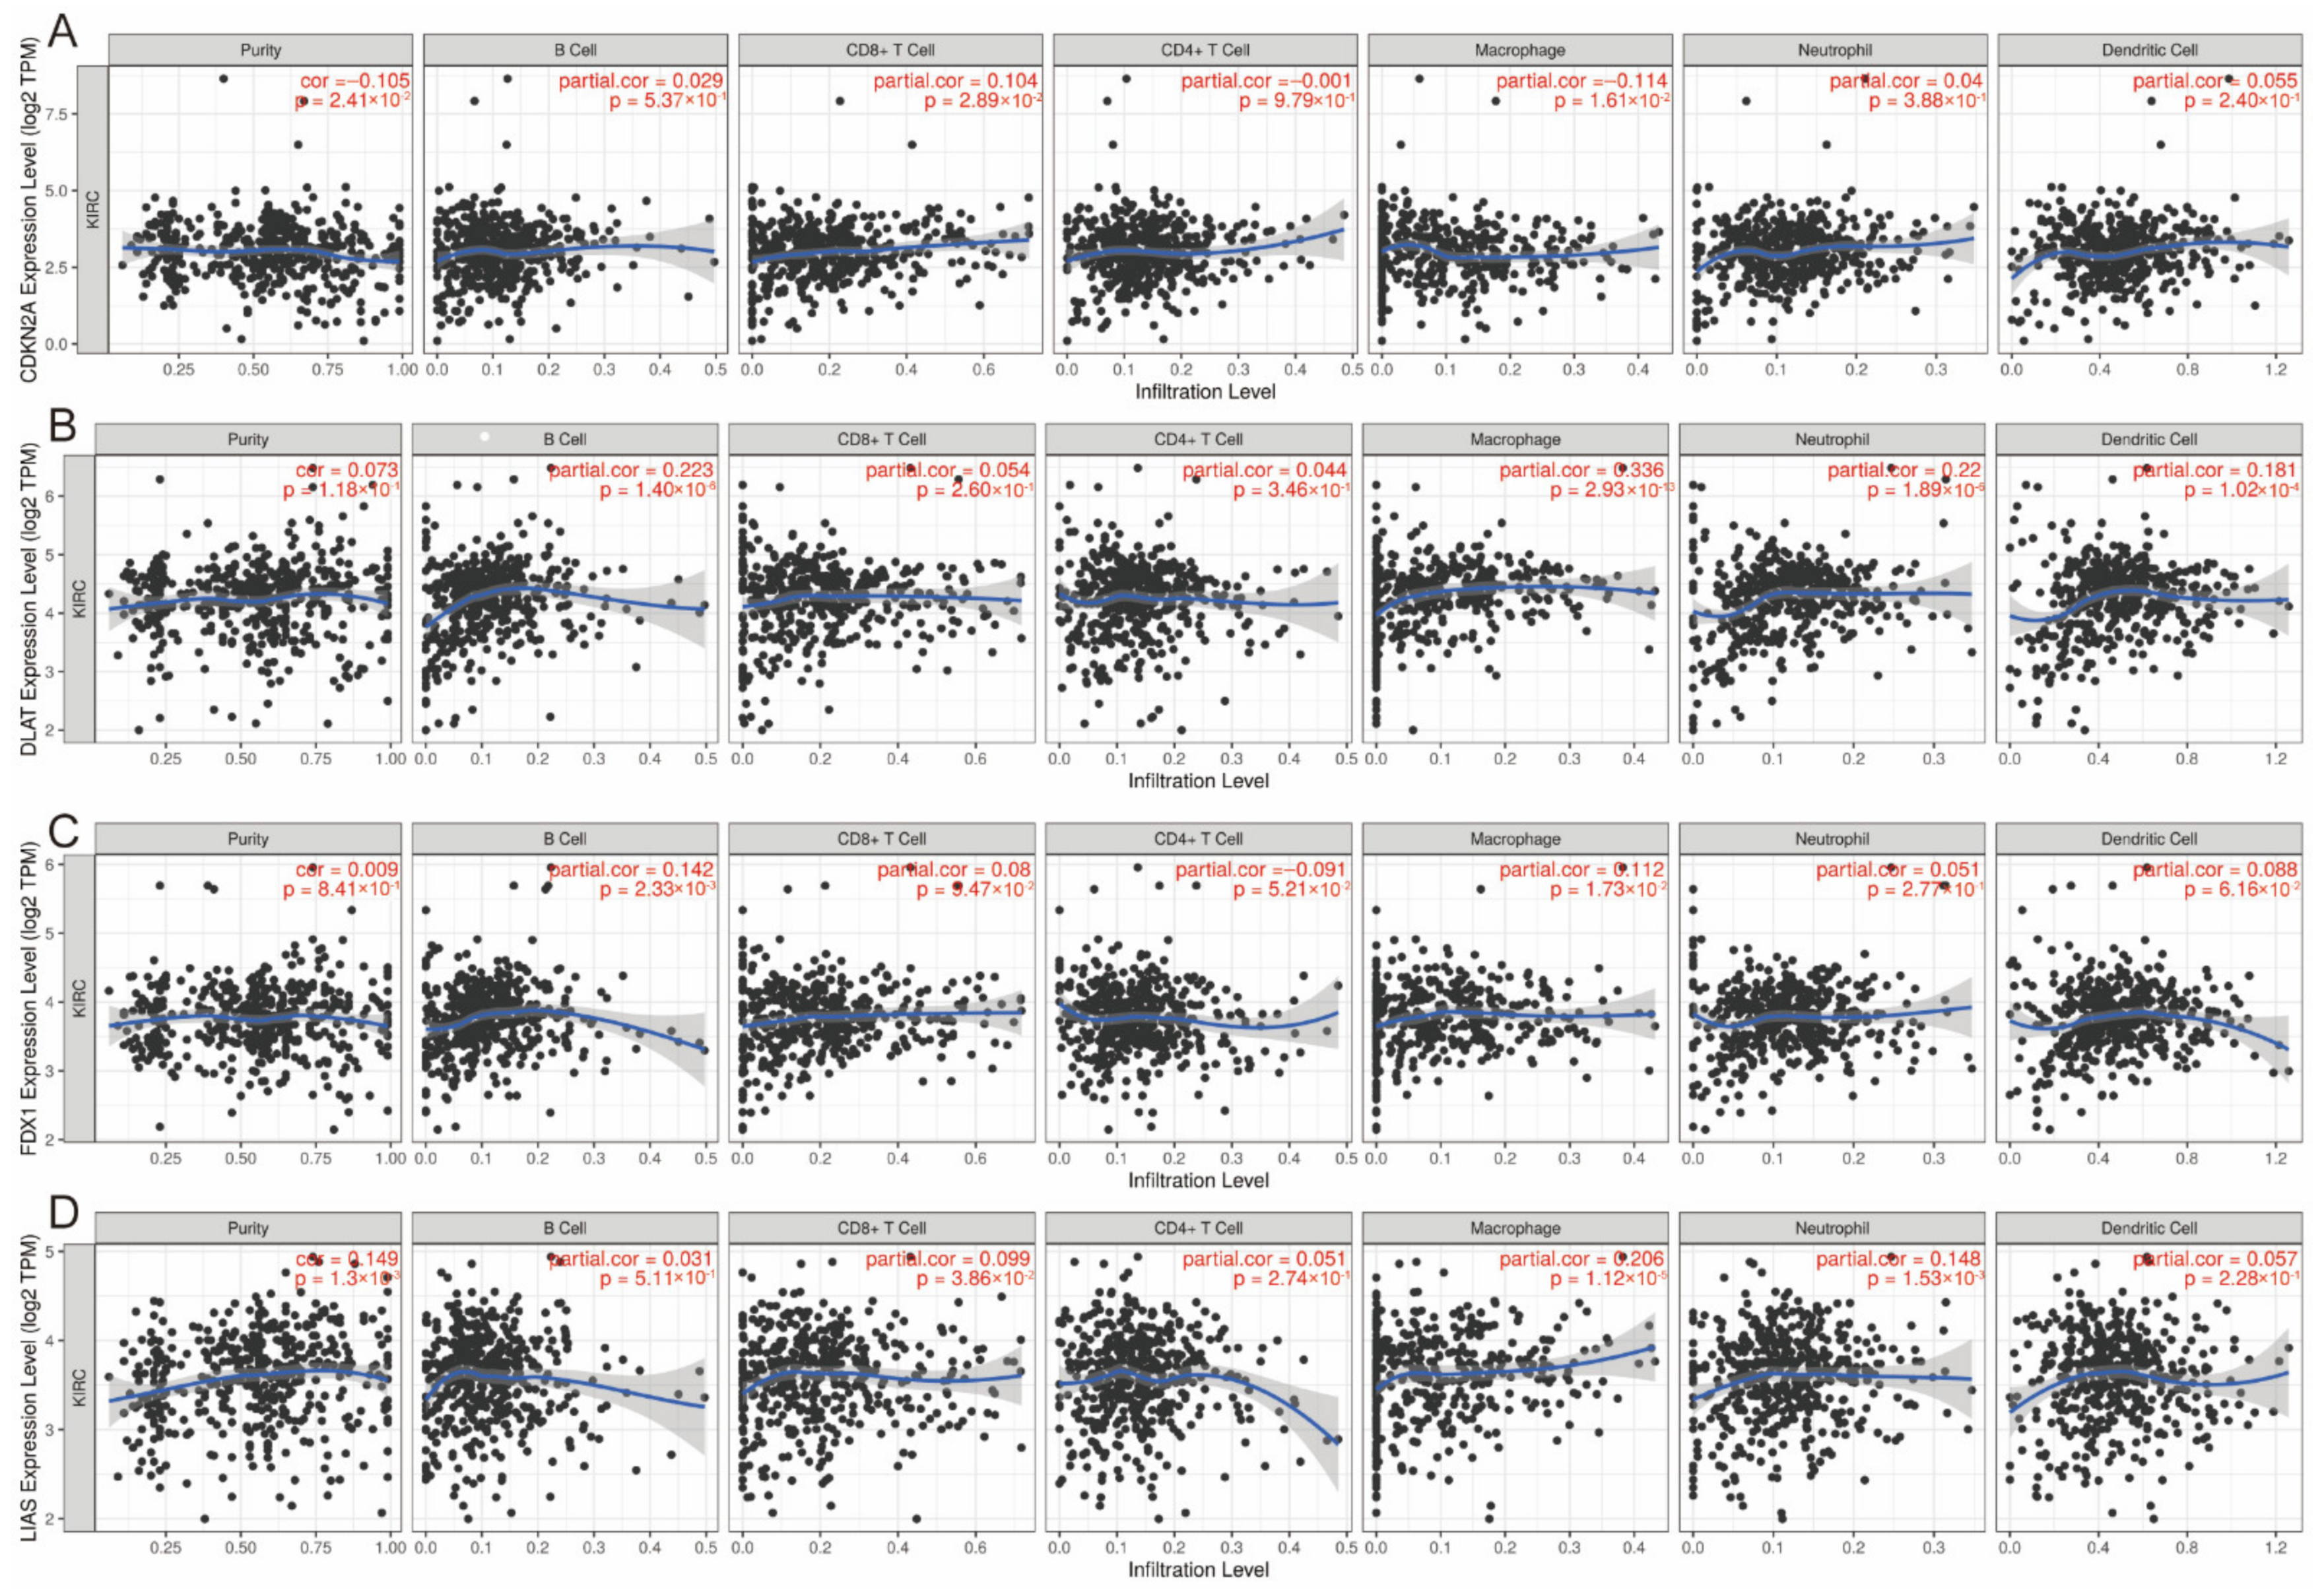
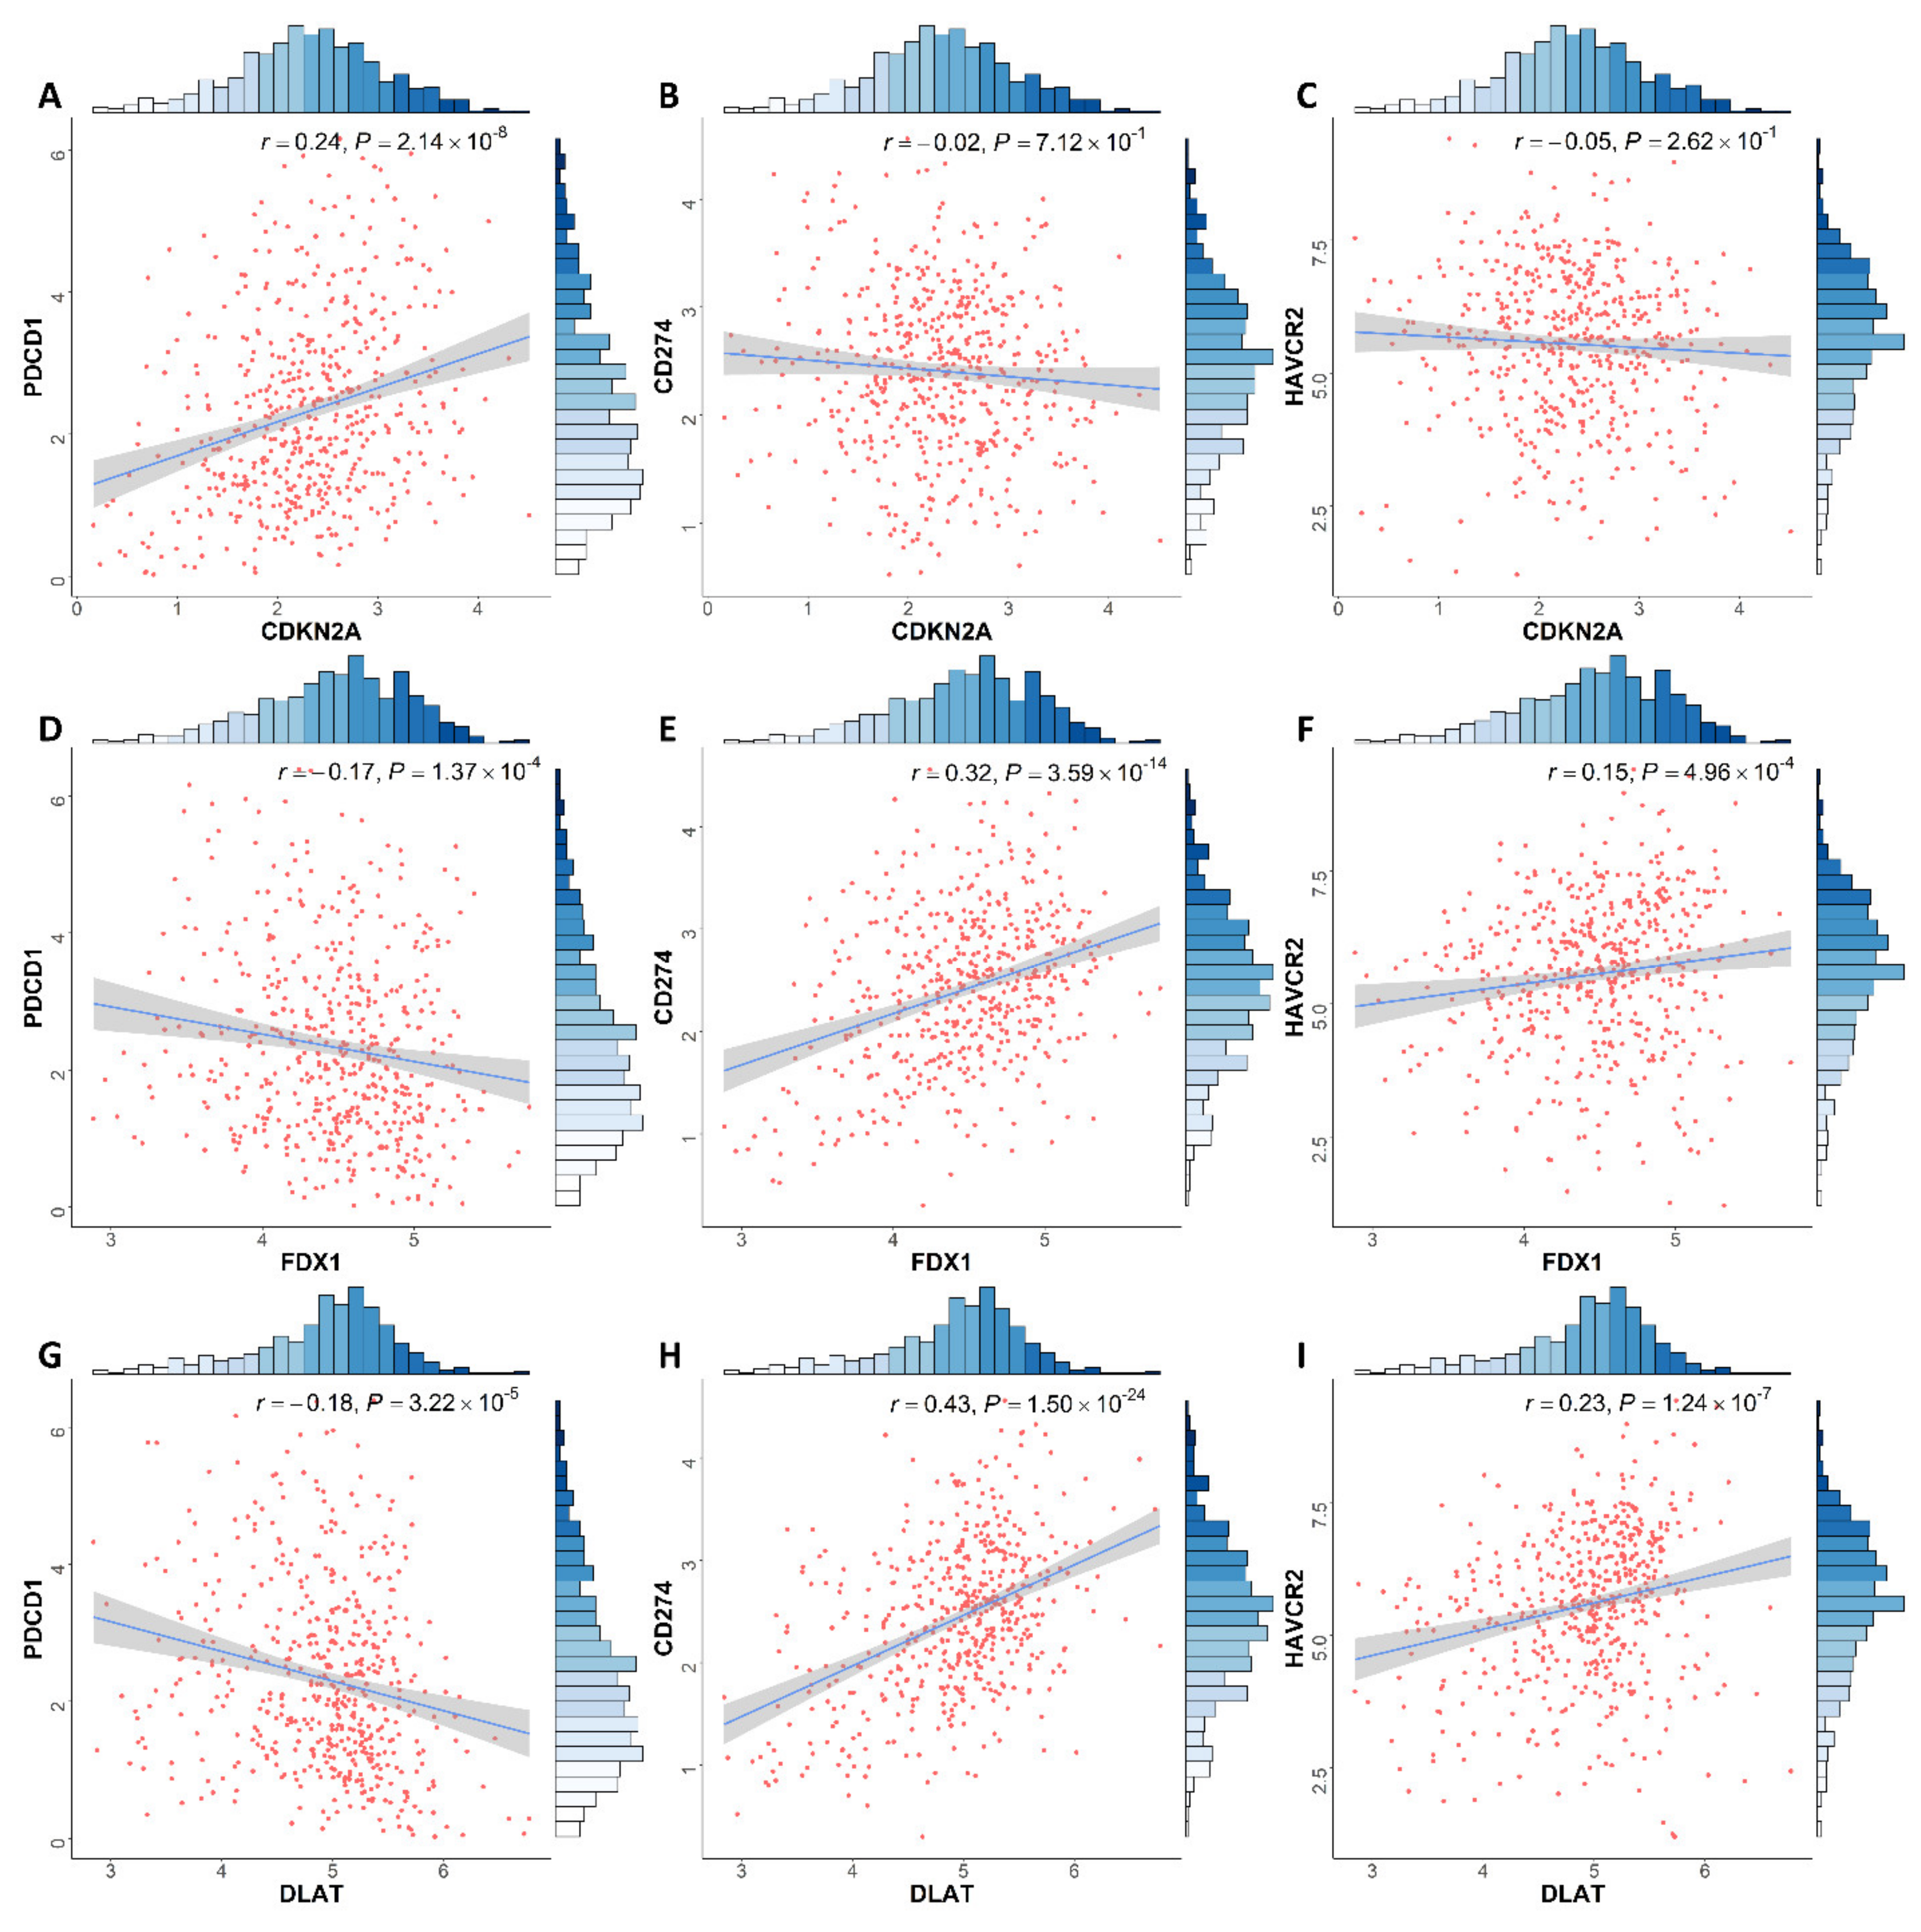
3.6. Correlation between Expression of CRGs and Immune Infiltration Levels in ccRCC

It is uncertain whether CRGs would influence immune cell recruitment in the tumor microenvironment and, therefore, affect the prognosis of ccRCC. Thus, we performed an analysis to examine the relationships between CDKN2A, DLAT, FDX1 and LIAS and immune infiltration in ccRCC. The expression level of CDKN2A was positively associated with the immune infiltration level of CD8+ T cells (p = 2.89 × 10⁻²) and negatively correlated with macrophages (p = 2.89 × 10⁻²) (Figure 6A). The DLAT expression level was positively correlated with the immune infiltration level of B cells (p = 1.40 × 10⁻⁶), macrophages (p = 2.93E × 10−13), neutrophils (p = 1.89 × 10⁻⁶) and dendritic cells (p = 1.02 × 10⁻⁴) (Figure 6B). The FDX1 expression level was positively associated with the abundance of B cells (p = 2.33 × 10⁻³) and macrophages (p = 1.73 × 10⁻²) (Figure 6C). Figure 6D presents the positive association between the LIAS expression and the abundance of CD8+ T cells (p = 3.86 × 10⁻²), macrophages (p = 1.12 × 10⁻⁵) and neutrophils (p = 1.15 × 10⁻³).
Our results also showed that CDKN2A expression in ccRCC had a positive correlation with PDCD1 expression levels (r = 0.24, p = 2.14 × 10⁻⁸). DLAT expression was associated with the expression level of PDCD1 (r = −0.18, p = 3.22 × 10⁻⁵), CD274 (r = 0.43, p = 1.50 × 10⁻²⁴) and HAVCR2 (r = 0.23, p = 1.24 × 10⁻⁷). FDX1 expression has a significant association with the expression of PDCD1 (r = −0.17, p = 1.37 × 10⁻⁴), CD274 (r = 0.32, p = 3.59 × 10⁻¹⁴) and HAVCR2 (r = 0.15, p = 4.96 × 10⁻⁴) from Figure 7.

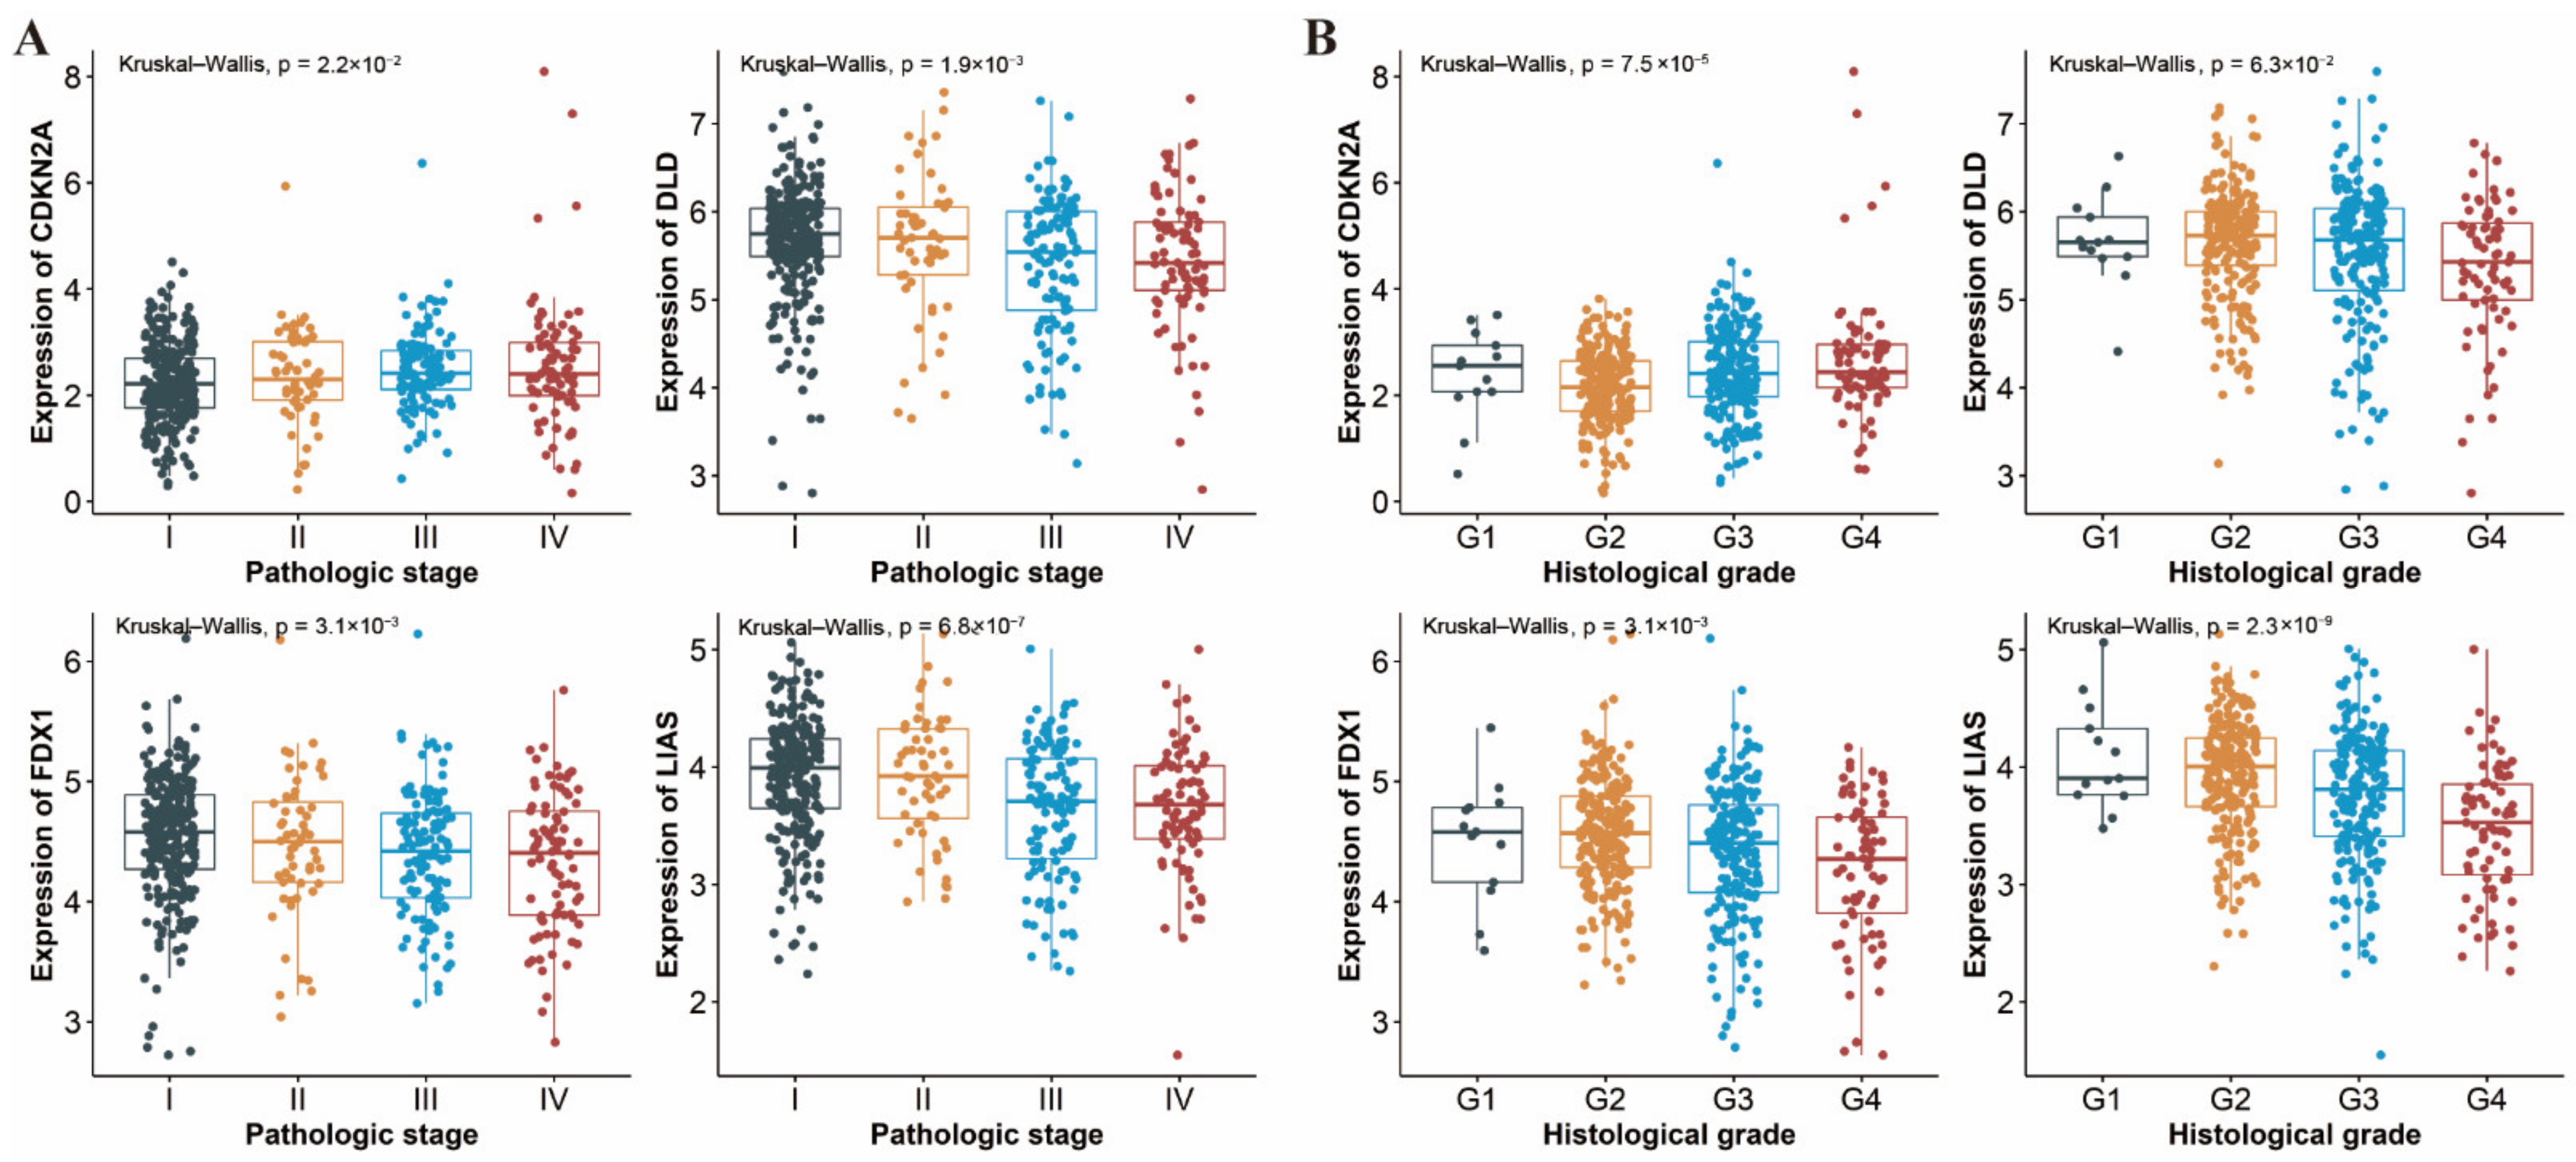
3.7. Differential Expression of CRGs in Different Pathologic Stages and Histological Grades of ccRCC

Shown in Figure 8, the expression levels of four genes (CDKN2A, DLAT, FDX1 and LIAS) varied in different pathologic stages and histological grades of ccRCC, with the exception of DLD, which did not show any statistical difference across histological grades (p = 0.063, Figure 8B). Specifically, there was a downward trend of FDX1 and LIAS expression and an upward trend of CDKN2A expression regardless of tumor stage or histological grade. These results suggested that the expression of CRGs may be correlated with disease grade and the presence of necrosis of ccRCC.

4. Discussion

In the present study, we explored the expression signature of 10 CRGs in ccRCC tissues and examined their relationships with OS and PFS. A novel cuproptosis-related prognostic score was constructed for the first time. In addition, functional analyses exhibited that pathways related to TCA cycle were enriched, and the CRGs were also proven to be associated with the grading and staging of ccRCC.
To the best of our knowledge, there have been no previous studies examining the correlations between CRGs and the development of ccRCC. Surprisingly, most cuproptosis-related genes were differentially expressed between tumor and normal tissues, and all these genes were significantly associated with OS and PFS, suggesting a potential role of cuproptosis in the prognosis of ccRCC and the predictive value of this score in the prediction of ccRCC survivorship.
The prognostic score constructed in this study consisted of four cuproptosis-related genes (CDKN2A, DLAT, FDX1 and LIAS). FDX1 encodes a small iron−sulfur protein and was involved in the reduction of Cu2+ to Cu1+. In addition, FDX1 played the role of upstream regulator in the process of protein lipoylation in the TCA cycle and key regulator of cuproptosis [13,35,36]. Dihydrolipoamide S-acetyltransferase (DLAT) was one of the components of the pyruvate dehydrogenase (PDH) complex. The oligomerization of DLAT was due to the integration of copper and lipoylated proteins in the TCA cycle [13]. Lipoic acid synthase (LIAS) encoded components of the lipoic acid pathway and synthesized a potent antioxidant termed α-Lipoic acid (LA) in mitochondria [35]. The CDKN2A expression functioned in the cell cycle control and was strongly correlated with the origin of a variety of tumors [36,37,38,39]. Furthermore, CDKN2A was shown to be absent in 76% of metastatic ccRCC samples, according to a meta-analysis [39].
Mutations leading to the overload of copper could trigger severe consequences. Nevertheless, it is feasible to manage intracellular copper levels within a certain range to selectively kill tumor cells [6]. Cuproptosis, an unconventional mechanism of cell death concerning the protein lipoylation in TCA cycle, might indicate novel insights to exploit copper toxicity to treat tumors [40]. Moreover, there have been some new findings about the pathologies of the urinary tract. Evidence has shown that there is an association between microbiota and the renal function, which is involved in the progression of several kidney diseases [41]. It has also been found that copper may contribute to the attenuation of bacterial colonization in the urethra, which may shed light on the potential therapeutic target [42]. Of interest, plant extracts contributing to the regulation and synthetization of copper-related metabolism may present as an alternative nonpharmacological intervention (NPI) strategy for cancer prevention and treatment [43,44]. For example, oregano extract could be one of the potential anticancer NPIs by invoking cell death through the mitochondrial and DNA damage pathways related to cuproptosis [44]. Additionally, plant extracts, such as the extract of the Camellia sinensis leaf, may be used to synthesize copper-related preparation and, thus, has the potential to play a part in the cancer treatment [45].
Our study has multiple advantages. Firstly, this study is the first to develop a prognostic model on the basis of CRGs. Cell death, an intense area of tumor research, has been proven fundamental to cancer origin and development [46]. Cuproptosis is a novel type of cell death that differs from any known mechanisms of cell death and is reliant on mitochondrial respiration. Such an unusual mechanism may bring up new solutions for the treatment of cancer. Moreover, compared to majority of the prognostic models which mainly focused on the overall survival, our study also took progression-free survival into consideration. PFS gain may indicate the reduction in tumor burden and symptom relief, especially for advanced cancer patients [47,48,49]. Additionally, we employed SIS to identify CRGs and adjusted covariates in both screening and testing procedures to make the results more robust.
There were several limitations in our study. First, although the validation of the expression of screened prognostic genes in TCGA and GEO demonstrated, to some extent, that three genes (CDKN2A, DLAT and FDX1) showed a robust prognostic effect, regrettably, no dataset with a sufficiently large sample size (n > 50) and clinical prognostic information was available for further validation, which is urgently warranted in future research. Second, although the prognostic score focusing on CRGs’ expression signature showed a good performance in the prediction of ccRCC survivorship, some other significant genes with predictive values were not considered in this study. Third, given that the prognostic signature was built and validated by exploiting data from public databases, further biological evidence is needed apart from the statistical evidence we offered.
In summary, this study systematically analyzed the landscape of molecular alterations and interactive genes of cuproptosis in ccRCC. Our study demonstrated that these cuproptosis-related genes may play a crucial role in ccRCC outcomes. The prognostic risk score based on the expression signature of CRGs showed a good performance for the prediction of OS and PFS of ccRCC patients and was significantly associated with immune infiltration levels and PD1 expression. Our results would also provide novel insights in developing pharmacological and nonpharmacological therapeutic strategies related to cuproptosis for cancer prevention and treatment.

Supplementary Materials

The following supporting information can be downloaded at: https://www.mdpi.com/article/10.3390/genes13050851/s1, Figure S1: Protein–Protein Interaction (PPI) of cuproptosis-related genes (CRGs); Table S1: Results of differential expression of cuproptosis-related genes (CRGs) in various datasets; Table S2: Association results for cuproptosis-related genes derived from univariate and multivariate Cox proportional hazards model. Table S3: Association results of the cuproptosis-related gene signature of subgroup (age, gender and pathologic stage) derived from Cox proportional hazards model.

Author Contributions

Z.B. takes responsibility for the content of manuscript, including the data and analysis. Conception and design: Z.B. and L.X.; development of methodology: Z.B.; acquisition of data: Z.B.; analysis and interpretation of data: Z.B.; writing—review and/or revision of the manuscript: Z.B., R.F. and L.X.; administration: Z.B. and L.X.; study supervision: Z.B. and L.X. All authors have read and agreed to the published version of the manuscript.

Funding

This research received no external funding.

Institutional Review Board Statement

Not applicable.

Informed Consent Statement

Not applicable.

Data Availability Statement

TCGA Data Poral: https://portal.gdc.cancer.gov/ (accessed on 15 March 2022); GEO Datasets: https://www.ncbi.nlm.nih.gov/gds/ (accessed on 18 March 2022); UCSC Xena: https://xenabrowser.net/ (accessed on 15 March 2022).

Acknowledgments

We thank the study participants and research staff for their contributions and commitment to this study.

Conflicts of Interest

The authors declare no conflict of interest.

References

  1. Sung, H.; Ferlay, J.; Siegel, R.L.; Laversanne, M.; Soerjomataram, I.; Jemal, A.; Bray, F. Global Cancer Statistics 2020: GLOBOCAN Estimates of Incidence and Mortality Worldwide for 36 Cancers in 185 Countries. CA Cancer J. Clin. 2021, 71, 209–249. [Google Scholar] [CrossRef] [PubMed]
  2. Jonasch, E.; Gao, J.; Rathmell, W.K. Renal cell carcinoma. BMJ 2014, 349, g4797. [Google Scholar] [CrossRef] [PubMed]
  3. Lalani, A.-K.A.; McGregor, B.A.; Albiges, L.; Choueiri, T.K.; Motzer, R.; Powles, T.; Wood, C.; Bex, A. Systemic Treatment of Metastatic Clear Cell Renal Cell Carcinoma in 2018: Current Paradigms, Use of Immunotherapy, and Future Directions. Eur. Urol. 2019, 75, 100–110. [Google Scholar] [CrossRef] [PubMed]
  4. Jonasch, E.; Walker, C.L.; Rathmell, W.K. Clear cell renal cell carcinoma ontogeny and mechanisms of lethality. Nat. Rev. Nephrol. 2021, 17, 245–261. [Google Scholar] [CrossRef] [PubMed]
  5. Blockhuys, S.; Celauro, E.; Hildesjö, C.; Feizi, A.; Stål, O.; Fierro-González, J.C.; Wittung-Stafshede, P. Defining the human copper proteome and analysis of its expression variation in cancers. Metallomics 2017, 9, 112–123. [Google Scholar] [CrossRef] [Green Version]
  6. Ge, E.J.; Bush, A.I.; Casini, A.; Cobine, P.A.; Cross, J.R.; DeNicola, G.M.; Dou, Q.P.; Franz, K.J.; Gohil, V.M.; Gupta, S.; et al. Connecting copper and cancer: From transition metal signalling to metalloplasia. Nat. Rev. Cancer 2022, 22, 102–113. [Google Scholar] [CrossRef] [PubMed]
  7. Ishida, S.; Andreux, P.; Poitry-Yamate, C.; Auwerx, J.; Hanahan, D. Bioavailable copper modulates oxidative phosphorylation and growth of tumors. Proc. Natl. Acad. Sci. USA 2013, 110, 19507–19512. [Google Scholar] [CrossRef] [Green Version]
  8. Babak, M.V.; Ahn, D. Modulation of Intracellular Copper Levels as the Mechanism of Action of Anticancer Copper Complexes: Clinical Relevance. Biomedicines 2021, 9, 852. [Google Scholar] [CrossRef]
  9. Brady, D.C.; Crowe, M.S.; Greenberg, D.N.; Counter, C.M. Copper Chelation Inhibits BRAF-Driven Melanomagenesis and Counters Resistance to BRAF and MEK1/2 Inhibitors. Cancer Res. 2017, 77, 6240–6252. [Google Scholar] [CrossRef] [Green Version]
  10. Davis, C.I.; Gu, X.; Kiefer, R.M.; Ralle, M.; Gade, T.P.; Brady, D.C. Altered copper homeostasis underlies sensitivity of hepatocellular carcinoma to copper chelation. Metallomics 2020, 12, 1995–2008. [Google Scholar] [CrossRef]
  11. Chen, D.; Cui, Q.C.; Yang, H.; Dou, Q.P. Disulfiram, a clinically used anti-alcoholism drug and copper-binding agent, induces apoptotic cell death in breast cancer cultures and xenografts via inhibition of the proteasome activity. Cancer Res. 2006, 66, 10425–10433. [Google Scholar] [CrossRef] [PubMed] [Green Version]
  12. O’Day, S.J.; Eggermont, A.M.M.; Chiarion-Sileni, V.; Kefford, R.; Grob, J.J.; Mortier, L.; Robert, C.; Schachter, J.; Testori, A.; Mackiewicz, J.; et al. Final results of phase III SYMMETRY study: Randomized, double-blind trial of elesclomol plus paclitaxel versus paclitaxel alone as treatment for chemotherapy-naive patients with advanced melanoma. J. Clin. Oncol. 2013, 31, 1211–1218. [Google Scholar] [CrossRef] [PubMed]
  13. Tsvetkov, P.; Coy, S.; Petrova, B.; Dreishpoon, M.; Verma, A.; Abdusamad, M.; Rossen, J.; Joesch-Cohen, L.; Humeidi, R.; Spangler, R.D.; et al. Copper induces cell death by targeting lipoylated TCA cycle proteins. Science 2022, 375, 1254–1261. [Google Scholar] [CrossRef] [PubMed]
  14. Linehan, W.M.; Schmidt, L.S.; Crooks, D.R.; Wei, D.; Srinivasan, R.; Lang, M.; Ricketts, C.J. The Metabolic Basis of Kidney Cancer. Cancer Discov. 2019, 9, 1006–1021. [Google Scholar] [CrossRef] [Green Version]
  15. Comprehensive molecular characterization of clear cell renal cell carcinoma. Nature 2013, 499, 43–49. [CrossRef] [Green Version]
  16. Wettersten, H.I.; Aboud, O.A.; Lara, P.N.; Weiss, R.H. Metabolic reprogramming in clear cell renal cell carcinoma. Nat. Rev. Nephrol. 2017, 13, 410–419. [Google Scholar] [CrossRef]
  17. Frankish, A.; Diekhans, M.; Ferreira, A.M.; Johnson, R.; Jungreis, I.; Loveland, J.; Mudge, J.M.; Sisu, C.; Wright, J.; Armstrong, J.; et al. GENCODE reference annotation for the human and mouse genomes. Nucleic Acids Res. 2019, 47, D766–D773. [Google Scholar] [CrossRef] [Green Version]
  18. Liu, J.; Lichtenberg, T.; Hoadley, K.A.; Poisson, L.M.; Lazar, A.J.; Cherniack, A.D.; Kovatich, A.J.; Benz, C.C.; Levine, D.A.; Lee, A.V.; et al. An Integrated TCGA Pan-Cancer Clinical Data Resource to Drive High-Quality Survival Outcome Analytics. Cell 2018, 173, 400–416.e11. [Google Scholar] [CrossRef] [Green Version]
  19. Goldman, M.J.; Craft, B.; Hastie, M.; Repecka, K.; McDade, F.; Kamath, A.; Banerjee, A.; Luo, Y.; Rogers, D.; Brooks, A.N.; et al. Visualizing and interpreting cancer genomics data via the Xena platform. Nat. Biotechnol. 2020, 38, 675–678. [Google Scholar] [CrossRef]
  20. Cibulskis, K.; Lawrence, M.S.; Carter, S.L.; Sivachenko, A.; Jaffe, D.; Sougnez, C.; Gabriel, S.; Meyerson, M.; Lander, E.S.; Getz, G. Sensitive detection of somatic point mutations in impure and heterogeneous cancer samples. Nat. Biotechnol. 2013, 31, 213–219. [Google Scholar] [CrossRef]
  21. Mayakonda, A.; Lin, D.C.; Assenov, Y.; Plass, C.; Koeffler, H.P. Maftools: Efficient and comprehensive analysis of somatic variants in cancer. Genome Res. 2018, 28, 1747–1756. [Google Scholar] [CrossRef] [PubMed] [Green Version]
  22. Mermel, C.H.; Schumacher, S.E.; Hill, B.; Meyerson, M.L.; Beroukhim, R.; Getz, G. GISTIC2.0 facilitates sensitive and confident localization of the targets of focal somatic copy-number alteration in human cancers. Genome Biol. 2011, 12, R41. [Google Scholar] [CrossRef] [PubMed] [Green Version]
  23. Wozniak, M.B.; Le Calvez-Kelm, F.; Abedi-Ardekani, B.; Byrnes, G.; Durand, G.; Carreira, C.; Michelon, J.; Janout, V.; Holcatova, I.; Foretova, L.; et al. Integrative genome-wide gene expression profiling of clear cell renal cell carcinoma in Czech Republic and in the United States. PLoS ONE 2013, 8, e57886. [Google Scholar] [CrossRef] [PubMed] [Green Version]
  24. Von Roemeling, C.A.; Radisky, D.C.; Marlow, L.A.; Cooper, S.J.; Grebe, S.K.; Anastasiadis, P.Z.; Tun, H.W.; Copland, J.A. Neuronal pentraxin 2 supports clear cell renal cell carcinoma by activating the AMPA-selective glutamate receptor-4. Cancer Res. 2014, 74, 4796–4810. [Google Scholar] [CrossRef] [Green Version]
  25. Franz, M.; Rodriguez, H.; Lopes, C.; Zuberi, K.; Montojo, J.; Bader, G.D.; Morris, Q. GeneMANIA update 2018. Nucleic Acids Res. 2018, 46, W60–W64. [Google Scholar] [CrossRef] [Green Version]
  26. Zhou, Y.; Zhou, B.; Pache, L.; Chang, M.; Khodabakhshi, A.H.; Tanaseichuk, O.; Benner, C.; Chanda, S.K. Metascape provides a biologist-oriented resource for the analysis of systems-level datasets. Nat. Commun. 2019, 10, 1523. [Google Scholar] [CrossRef]
  27. Yu, G.; Wang, L.G.; Han, Y.; He, Q.Y. clusterProfiler: An R package for comparing biological themes among gene clusters. Omics A J. Integr. Biol. 2012, 16, 284–287. [Google Scholar] [CrossRef]
  28. Zhang, R.; Chen, C.; Dong, X.; Shen, S.; Lai, L.; He, J.; You, D.; Lin, L.; Zhu, Y.; Huang, H.; et al. Independent Validation of Early-Stage Non-Small Cell Lung Cancer Prognostic Scores Incorporating Epigenetic and Transcriptional Biomarkers with Gene-Gene Interactions and Main Effects. Chest 2020, 158, 808–819. [Google Scholar] [CrossRef]
  29. Saldana, D.F.; Feng, Y. SIS: An R Package for Sure Independence Screening in Ultrahigh-Dimensional Statistical Models. J. Stat. Softw. 2018, 83, 1–25. [Google Scholar] [CrossRef] [Green Version]
  30. Heagerty, P.J.; Zheng, Y. Survival model predictive accuracy and ROC curves. Biometrics 2005, 61, 92–105. [Google Scholar] [CrossRef] [Green Version]
  31. Li, T.; Fan, J.; Wang, B.; Traugh, N.; Chen, Q.; Liu, J.S.; Li, B.; Liu, X.S. TIMER: A Web Server for Comprehensive Analysis of Tumor-Infiltrating Immune Cells. Cancer Res. 2017, 77, e108–e110. [Google Scholar] [CrossRef] [PubMed] [Green Version]
  32. Wang, Q.; Zhang, J.; Tu, H.; Liang, D.; Chang, D.W.; Ye, Y.; Wu, X. Soluble immune checkpoint-related proteins as predictors of tumor recurrence, survival, and T cell phenotypes in clear cell renal cell carcinoma patients. J. ImmunoTher. Cancer 2019, 7, 334. [Google Scholar] [CrossRef] [PubMed]
  33. Gibbons, J.D. Nonparametric Statistical Methods. Technometrics 1974, 16, 477–478. [Google Scholar] [CrossRef]
  34. Haynes, W. Benjamini-Hochberg Method. In Encyclopedia of Systems Biology; Dubitzky, W., Wolkenhauer, O., Cho, K.-H., Yokota, H., Eds.; Springer: New York, NY, USA, 2013; p. 78. [Google Scholar]
  35. Dörsam, B.; Fahrer, J. The disulfide compound α-lipoic acid and its derivatives: A novel class of anticancer agents targeting mitochondria. Cancer Lett. 2016, 371, 12–19. [Google Scholar] [CrossRef] [PubMed]
  36. Rayess, H.; Wang, M.B.; Srivatsan, E.S. Cellular senescence and tumor suppressor gene p16. Int. J. Cancer 2012, 130, 1715–1725. [Google Scholar] [CrossRef] [Green Version]
  37. Kimura, H.; Klein, A.P.; Hruban, R.H.; Roberts, N.J. The Role of Inherited Pathogenic CDKN2A Variants in Susceptibility to Pancreatic Cancer. Pancreas 2021, 50, 1123–1130. [Google Scholar] [CrossRef] [PubMed]
  38. Śledzińska, P.; Bebyn, M.G.; Furtak, J.; Kowalewski, J.; Lewandowska, M.A. Prognostic and Predictive Biomarkers in Glio-mas. Int. J. Mol. Sci. 2021, 22, 10373. [Google Scholar] [CrossRef]
  39. Bui, T.O.; Dao, V.T.; Nguyen, V.T.; Feugeas, J.-P.; Pamoukdjian, F.; Bousquet, G. Genomics of Clear-cell Renal Cell Carci-noma: A Systematic Review and Meta-analysis. Eur. Urol. 2022, 81, 349–361. [Google Scholar] [CrossRef]
  40. Kahlson Martha, A.; Dixon Scott, J. Copper-induced cell death. Science 2022, 375, 1231–1232. [Google Scholar] [CrossRef]
  41. Whiteside, S.A.; Razvi, H.; Dave, S.; Reid, G.; Burton, J.P. The microbiome of the urinary tract—A role beyond infection. Nat. Rev. Urol. 2015, 12, 81–90. [Google Scholar] [CrossRef]
  42. Hyre, A.N.; Kavanagh, K.; Kock, N.D.; Donati, G.L.; Subashchandrabose, S. Copper Is a Host Effector Mobilized to Urine during Urinary Tract Infection to Impair Bacterial Colonization. Infect. Immun. 2017, 85, e01041-16. [Google Scholar] [CrossRef] [PubMed] [Green Version]
  43. Singh, D.; Narayanamoorthy, S.; Gamre, S.; Majumdar, A.G.; Goswami, M.; Gami, U.; Cherian, S.; Subramanian, M. Hydroxychavicol, a key ingredient of Piper betle induces bacterial cell death by DNA damage and inhibition of cell division. Free Radic. Biol. Med. 2018, 120, 62–71. [Google Scholar] [CrossRef] [PubMed]
  44. Nanni, V.; di Marco, G.; Sacchetti, G.; Canini, A.; Gismondi, A. Oregano Phytocomplex Induces Programmed Cell Death in Melanoma Lines via Mitochondria and DNA Damage. Foods 2020, 9, 1486. [Google Scholar] [CrossRef] [PubMed]
  45. Dou, L.; Zhang, X.; Zangeneh, M.M.; Zhang, Y. Efficient biogenesis of Cu2O nanoparticles using extract of Camellia sinensis leaf: Evaluation of catalytic, cytotoxicity, antioxidant, and anti-human ovarian cancer properties. Bioorgan. Chem. 2021, 106, 104468. [Google Scholar] [CrossRef]
  46. Strasser, A.; Vaux, D.L. Cell Death in the Origin and Treatment of Cancer. Mol. Cell 2020, 78, 1045–1054. [Google Scholar] [CrossRef]
  47. Robinson, A.G.; Booth, C.M.; Eisenhauer, E.A. Progression-free survival as an end-point in solid tumours--perspectives from clinical trials and clinical practice. Eur. J. Cancer 2014, 50, 2303–2308. [Google Scholar] [CrossRef] [PubMed]
  48. Pasalic, D.; McGinnis, G.J.; Fuller, C.D.; Grossberg, A.J.; Verma, V.; Mainwaring, W.; Miller, A.B.; Lin, T.A.; Jethanandani, A.; Espinoza, A.F.; et al. Progression-free survival is a suboptimal predictor for overall survival among metastatic solid tumour clinical trials. Eur. J. Cancer 2020, 136, 176–185. [Google Scholar] [CrossRef]
  49. Fallowfield, L.J.; Fleissig, A. The value of progression-free survival to patients with advanced-stage cancer. Nat. Rev. Clin. Oncol. 2011, 9, 41–47. [Google Scholar] [CrossRef]
Figure 1. Expression and genetic alteration of CRGs in ccRCC: (A) the expression of 10 CRGs in ccRCC and normal tissues (tumor in red and normal in blue). The upper and lower ends of the boxes represent the interquartile range of values. The lines in the boxes represent the median value; (B) correlations between the expression of cuproptosis regulators; (CE) the CNV and mutation frequency and classification of 10 CRGs in ccRCC. * p < 0.01, *** p < 0.001; CRG: cuproptosis-related gene, ccRCC: clear cell renal cell carcinoma, SNP: single nucleotide polymorphism, INS: insertion and DEL: deletion.
Genes 13 00851 g001
Figure 2. Pathway enrichment analysis of CRGs in ccRCC patients of TCGA: (A) the enriched item in the gene ontology analysis; (B) the enriched item in the Kyoto Encyclopedia of Genes and Genomes analysis. The size of circles represents the number of enriched genes. BP: biological process, CC: cellular component, MF: molecular function and CRG: cuproptosis-related gene.
Genes 13 00851 g002
Figure 3. Clinical relevance of CRGs in the ccRCC patients of TCGA. For OS outcome, (A) distribution of risk score, survival status and the expression of prognostic CRGs, (B) Kaplan−Meier plot of the CRG signature and overall survival, (C) ROCs for one-year, three-year and five-year survival prediction. Kaplan−Meier plot for the expression of (D) CDKN2A (E) DLAT and (F) FDX1 and overall survival. For PFS outcome, (G) distribution of risk score, status and the expression of prognostic CRGs, (H) Kaplan−Meier plot of the CRG signature and progression-free survival. (I) ROCs for one-year, three-year and five-year progression-free survival prediction. Kaplan−Meier plots of the expression of (J) LIAS, (K) CDKN2A and (L) FDX1 and progression-free survival. The hazard ratios (HRs) are evaluated by Cox proportional hazard models. OS: overall survival, PFS: progression-free survival and ROC: receiver operating characteristic curve.
Genes 13 00851 g003
Figure 4. Nomogram development and validation. For (A) OS and (D) PFS, hazard ratios and p-value of the constituents involved in multivariate Cox regression considering clinical information and prognostic CRGs in ccRCC. Nomogram to predict the 1-year, 3-year and 5-year (B) OS and (E) PFS rate of LUAD patients. Calibration curve for the (C) OS and (F) PFS nomogram model in ccRCC. A dashed diagonal line represents the ideal nomogram. CRG: cuproptosis-related gene, ccRCC: clear cell renal cell carcinoma, OS: overall survival and PFS: progression-free survival.
Genes 13 00851 g004
Figure 5. Differential expression analysis and validation in three datasets. Boxplots of the expression of CDKN2A, DLAT, FDX1 and LIAS in (A) GSE40435 and (B) GSE53757. Forest plots of the meta-analysis of the differential expression of (C) CDKN2A, (D) DLAT, (E) FDX1 and (F) LIAS in GSE40435, GSE53757 and TCGA.
Genes 13 00851 g005
Figure 6. Correlation between (A) CDKN2A, (B) DLAT, (C) FDX1 and (D) LIAS expression and immune infiltration in ccRCC in the TIMER database. ccRCC: clear cell renal cell carcinoma.
Genes 13 00851 g006
Figure 7. Association between (AC) CDKN2A, (DF) FDX1 and (GI) DLAT and PDCD1, CD274 and HAVCR2 expression in ccRCC patients, respectively. ccRCC: clear cell renal cell carcinoma.
Genes 13 00851 g007
Figure 8. Expression of CDKN2A, DLAT, FDX1 and LIAS in a different (A) pathologic stage and (B) histological grade of ccRCC patients, respectively. ccRCC: clear cell renal cell carcinoma.
Genes 13 00851 g008
Publisher’s Note: MDPI stays neutral with regard to jurisdictional claims in published maps and institutional affiliations.

