
Network Approaches for Charting the Transcriptomic and Epigenetic Landscape of the Developmental Origins of Health and Disease

 , and
, and
Abstract
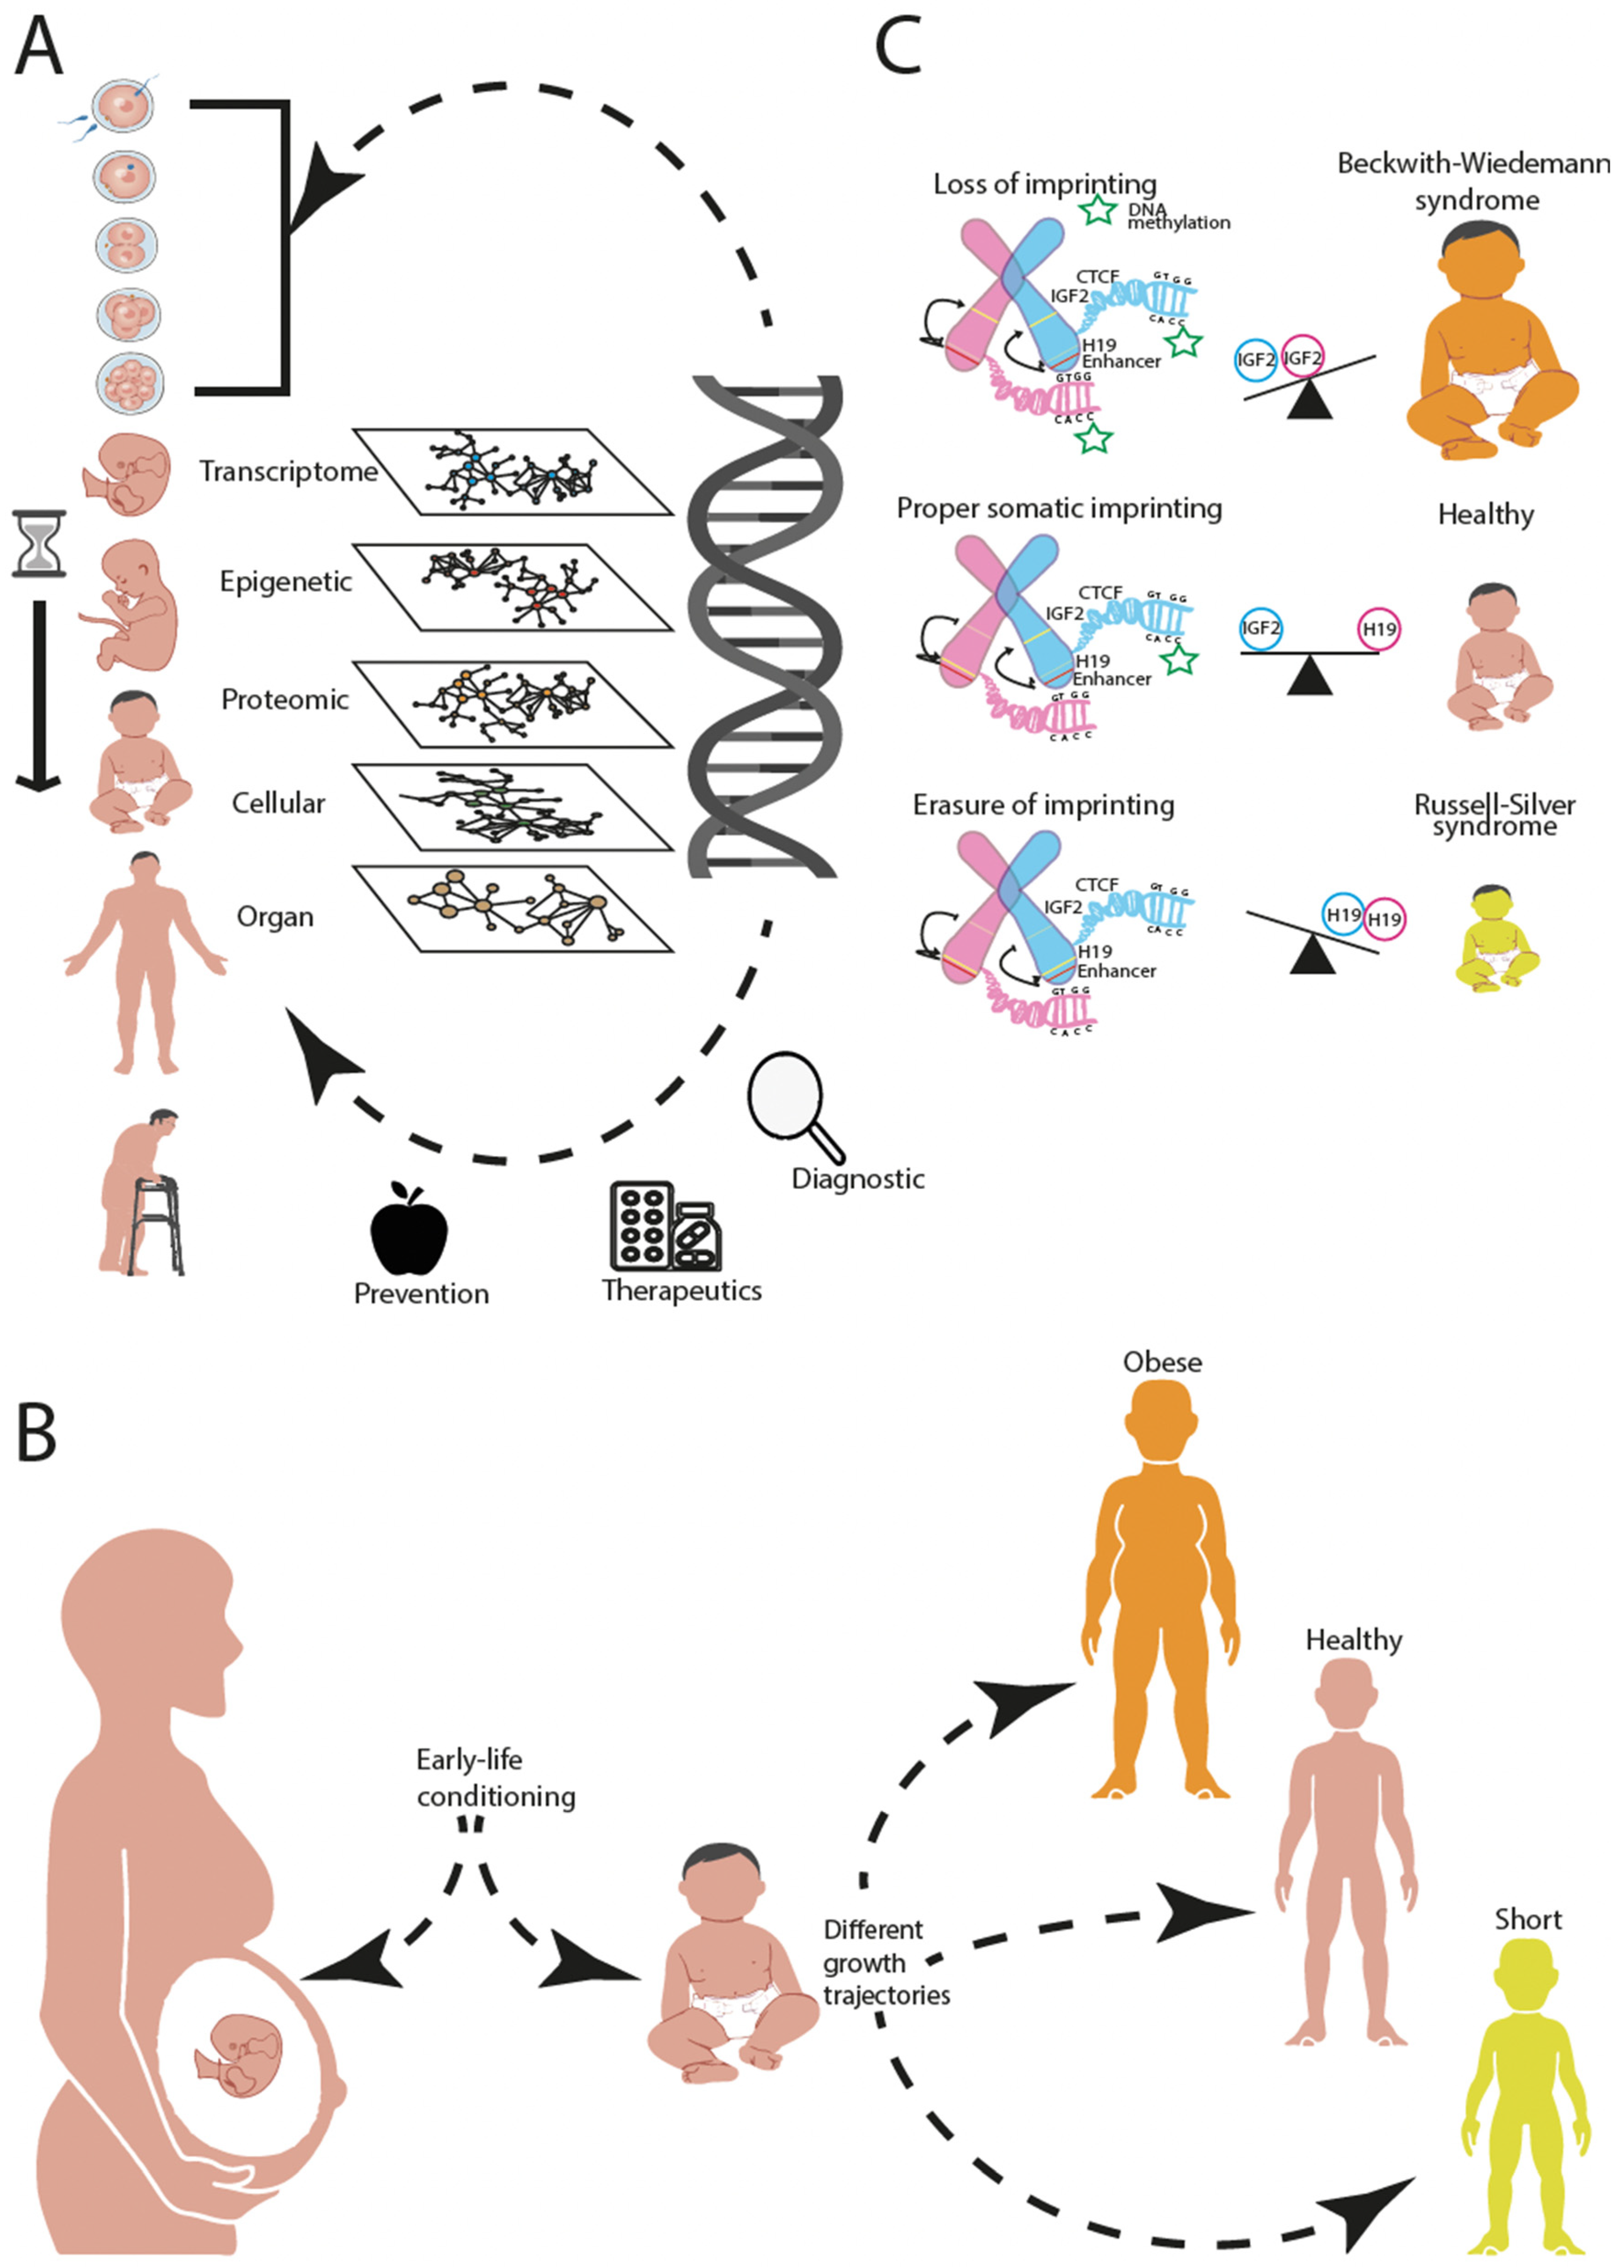
:1. Introduction
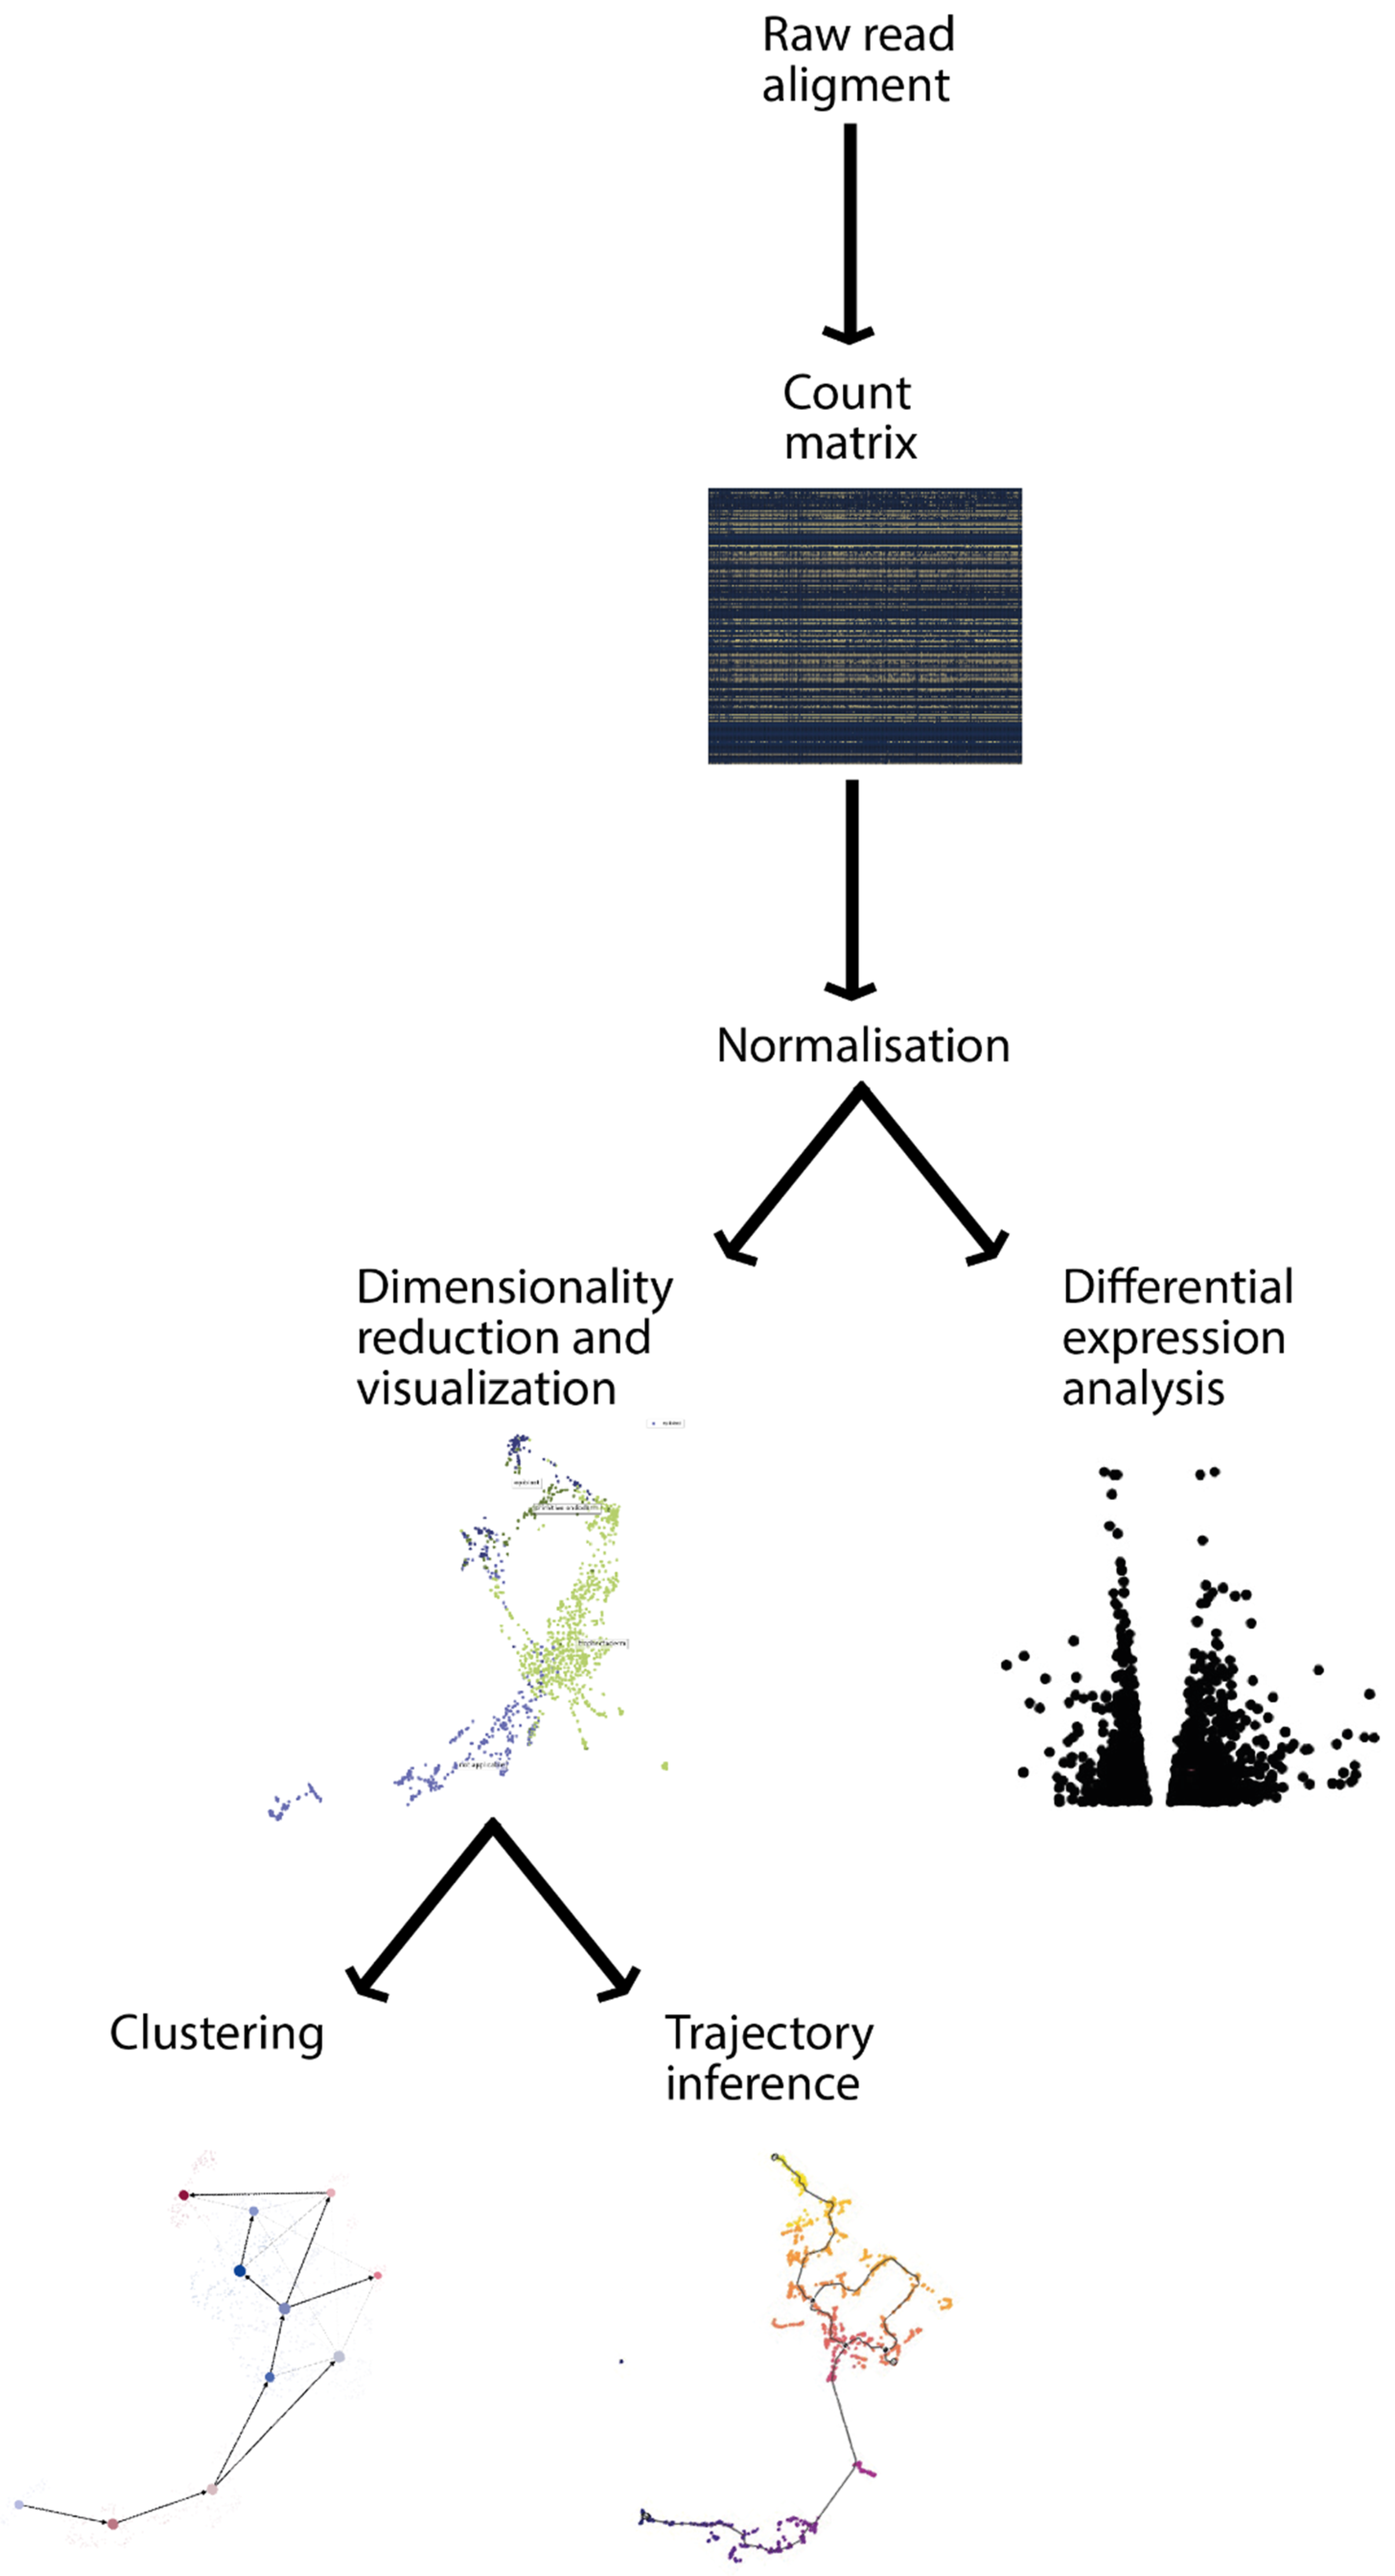
2. Transcriptomic View of Development and Analysis
2.1. Data Preprocessing
2.2. Dimensionality Reduction
2.3. Clustering
2.4. Differential Expression Analysis
2.5. Trajectory Analysis
2.6. Expressed Variation Analysis
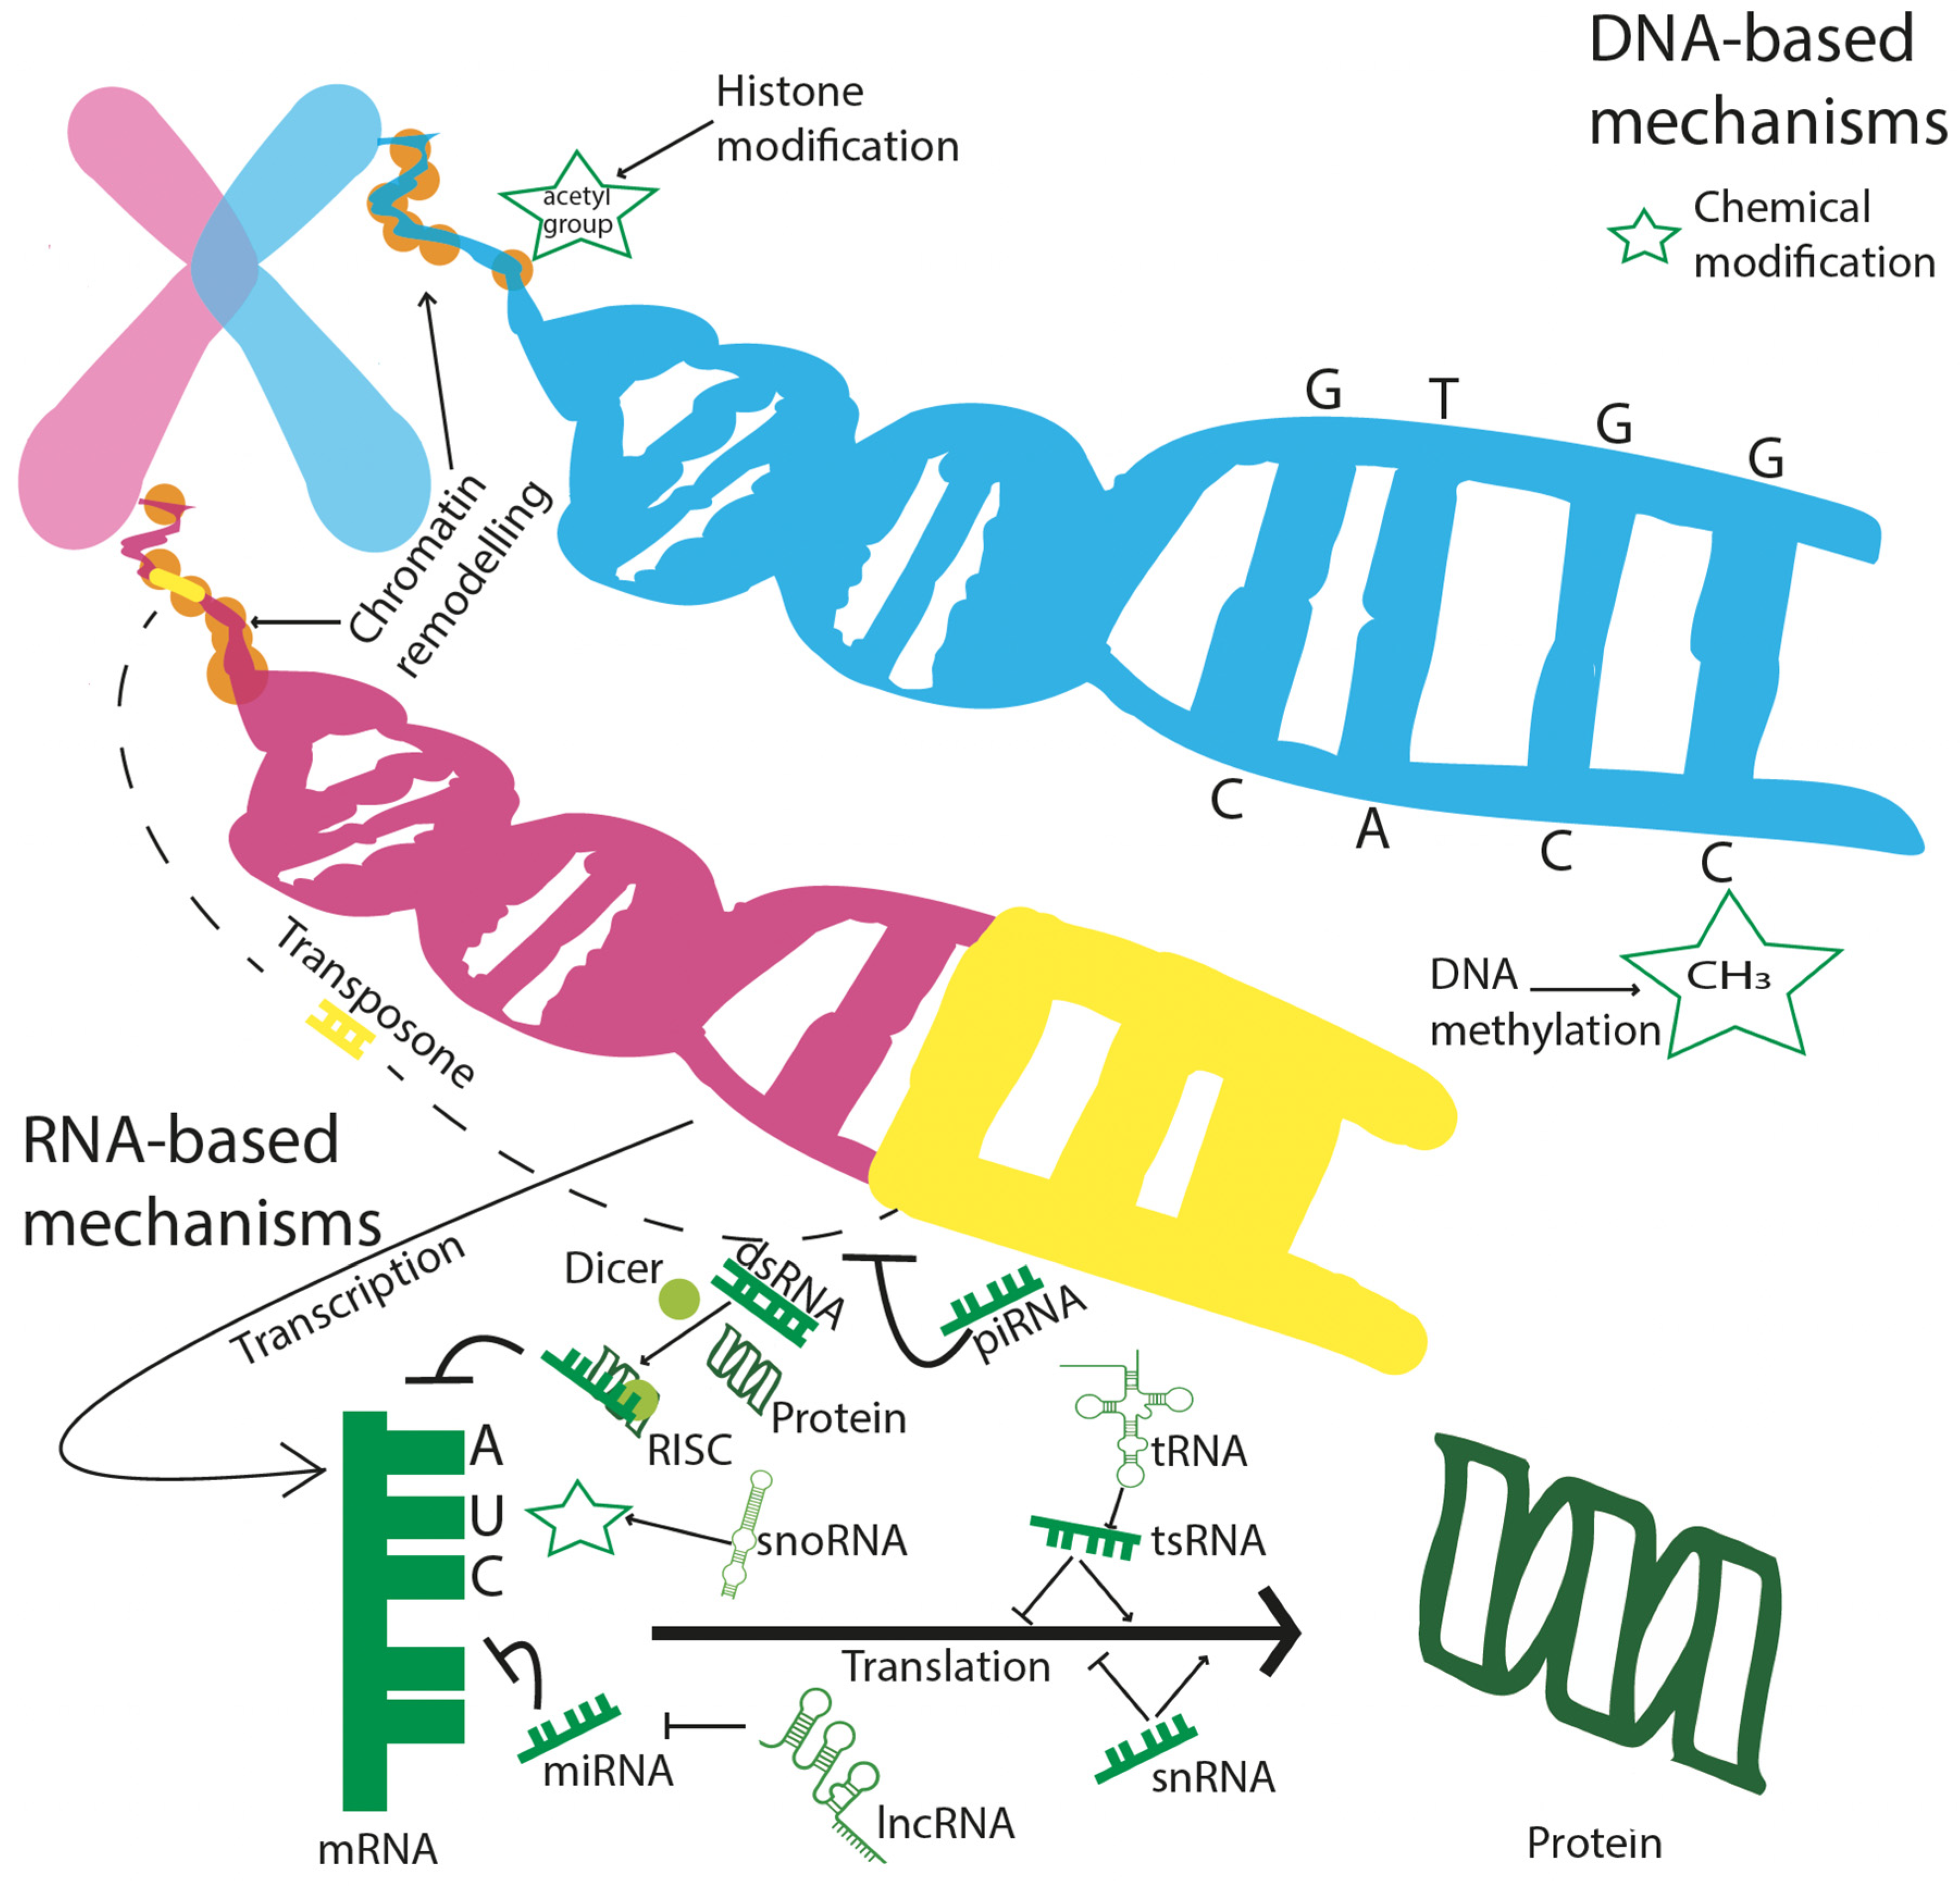
3. Epigenetic View of Development and Analysis
3.1. DNA Methylation
3.2. Non-Coding RNAs (ncRNAs)
3.3. Transposons
3.4. Chromatin Modifications
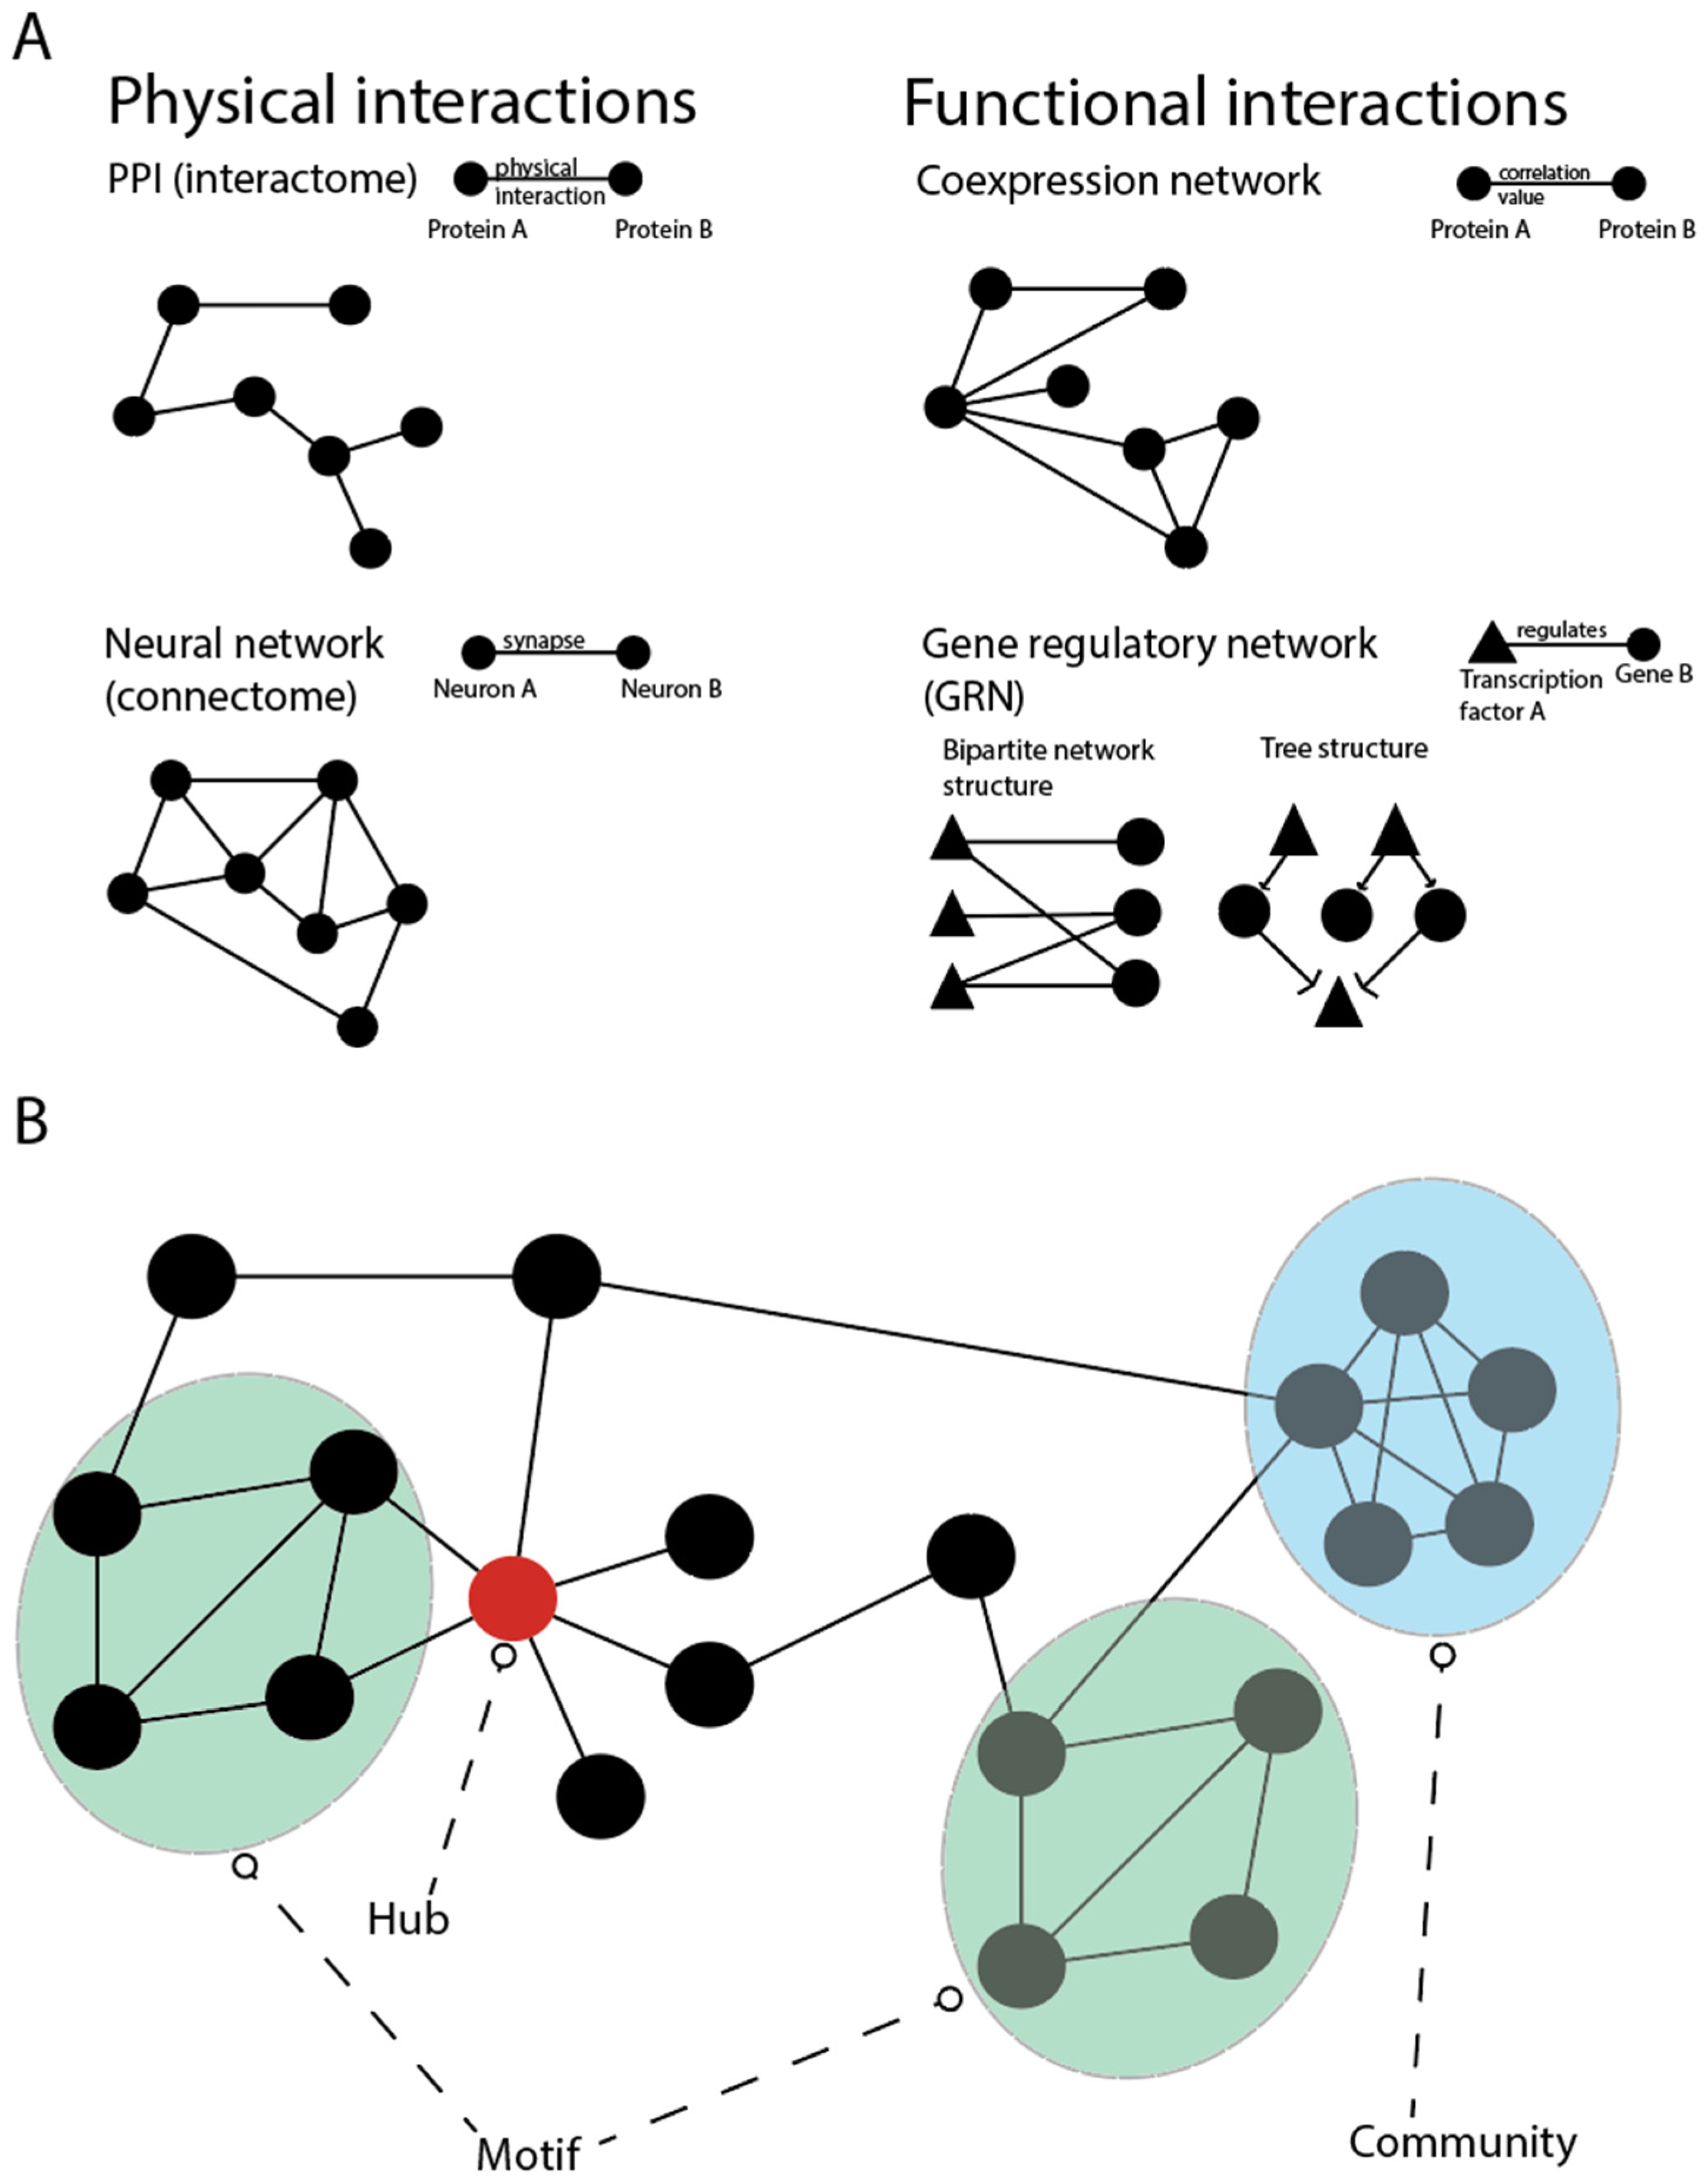
4. Network Models of the Epigenome
4.1. Gene Regulatory Networks (GRNs)
4.2. Network Approaches for Interpreting DNA Methylation Profiles
4.3. Modelling Non-Coding RNA Interactions
4.4. Network Approaches for Chromatin Modifications and Transposons
5. Towards an Integrative Analysis across Biological Hierarchies
6. Conclusions
Author Contributions
Funding
Institutional Review Board Statement
Informed Consent Statement
Acknowledgments
Conflicts of Interest
References
- Manzoni, C.; Kia, D.A.; Vandrovcova, J.; Hardy, J.; Wood, N.W.; Lewis, P.A.; Ferrari, R. Genome, Transcriptome and Proteome: The Rise of Omics Data and Their Integration in Biomedical Sciences. Brief. Bioinform. 2018, 19, 286–302. [Google Scholar] [CrossRef] [PubMed]
- Eidem, H.R.; McGary, K.L.; Capra, J.A.; Abbot, P.; Rokas, A. The Transformative Potential of an Integrative Approach to Pregnancy. Placenta 2017, 57, 204–215. [Google Scholar] [CrossRef] [PubMed]
- Kumar, M.; Kumar, K.; Jain, S.; Hassan, T.; Dada, R. Novel Insights into the Genetic and Epigenetic Paternal Contribution to the Human Embryo. Clinics 2013, 68 (Suppl. S1), 5–14. [Google Scholar] [CrossRef]
- Ratajczak, M.Z.; Shin, D.-M.; Schneider, G.; Ratajczak, J.; Kucia, M. Parental Imprinting Regulates Insulin-like Growth Factor Signaling: A Rosetta Stone for Understanding the Biology of Pluripotent Stem Cells, Aging and Cancerogenesis. Leukemia 2013, 27, 773–779. [Google Scholar] [CrossRef] [PubMed] [Green Version]
- Joyce, J.A.; Lam, W.K.; Catchpoole, D.J.; Jenks, P.; Reik, W.; Maher, E.R.; Schofield, P.N. Imprinting of IGF2 and H19: Lack of Reciprocity in Sporadic Beckwith-Wiedemann Syndrome. Hum. Mol. Genet. 1997, 6, 1543–1548. [Google Scholar] [CrossRef] [Green Version]
- Zapalska-Sozoniuk, M.; Chrobak, L.; Kowalczyk, K.; Kankofer, M. Is It Useful to Use Several “Omics” for Obtaining Valuable Results? Mol. Biol. Rep. 2019, 46, 3597–3606. [Google Scholar] [CrossRef] [PubMed] [Green Version]
- Niakan, K.K.; Han, J.; Pedersen, R.A.; Simon, C.; Pera, R.A.R. Human Pre-Implantation Embryo Development. Development 2012, 139, 829–841. [Google Scholar] [CrossRef] [PubMed] [Green Version]
- Niakan, K.K.; Eggan, K. Analysis of Human Embryos from Zygote to Blastocyst Reveals Distinct Gene Expression Patterns Relative to the Mouse. Dev. Biol. 2013, 375, 54–64. [Google Scholar] [CrossRef] [PubMed] [Green Version]
- Pfeffer, P.L. Building Principles for Constructing a Mammalian Blastocyst Embryo. Biology 2018, 7, 41. [Google Scholar] [CrossRef] [PubMed] [Green Version]
- Turco, M.Y.; Moffett, A. Development of the Human Placenta. Development 2019, 146, dev163428. [Google Scholar] [CrossRef] [Green Version]
- Barker, D.J.; Osmond, C. Infant Mortality, Childhood Nutrition, and Ischaemic Heart Disease in England and Wales. Lancet 1986, 1, 1077–1081. [Google Scholar] [CrossRef]
- Hochberg, Z.; Feil, R.; Constancia, M.; Fraga, M.; Junien, C.; Carel, J.-C.; Boileau, P.; Le Bouc, Y.; Deal, C.L.; Lillycrop, K.; et al. Child Health, Developmental Plasticity, and Epigenetic Programming. Endocr. Rev. 2011, 32, 159–224. [Google Scholar] [CrossRef] [PubMed]
- Mantione, K.J.; Kream, R.M.; Kuzelova, H.; Ptacek, R.; Raboch, J.; Samuel, J.M.; Stefano, G.B. Comparing Bioinformatic Gene Expression Profiling Methods: Microarray and RNA-Seq. Med. Sci. Monit. Basic Res. 2014, 20, 138–142. [Google Scholar]
- McGettigan, P.A. Transcriptomics in the RNA-Seq Era. Curr. Opin. Chem. Biol. 2013, 17, 4–11. [Google Scholar] [CrossRef] [PubMed]
- Baruzzo, G.; Hayer, K.E.; Kim, E.J.; Di Camillo, B.; FitzGerald, G.A.; Grant, G.R. Simulation-Based Comprehensive Benchmarking of RNA-Seq Aligners. Nat. Methods 2017, 14, 135–139. [Google Scholar] [CrossRef]
- Dobin, A.; Davis, C.A.; Schlesinger, F.; Drenkow, J.; Zaleski, C.; Jha, S.; Batut, P.; Chaisson, M.; Gingeras, T.R. STAR: Ultrafast Universal RNA-Seq Aligner. Bioinformatics 2013, 29, 15–21. [Google Scholar] [CrossRef]
- Li, H.; Durbin, R. Fast and Accurate Short Read Alignment with Burrows–Wheeler Transform. Bioinformatics 2009, 25, 1754–1760. [Google Scholar] [CrossRef] [Green Version]
- Kim, D.; Paggi, J.M.; Park, C.; Bennett, C.; Salzberg, S.L. Graph-Based Genome Alignment and Genotyping with HISAT2 and HISAT-Genotype. Nat. Biotechnol. 2019, 37, 907–915. [Google Scholar] [CrossRef]
- Navarro Gonzalez, J.; Zweig, A.S.; Speir, M.L.; Schmelter, D.; Rosenbloom, K.R.; Raney, B.J.; Powell, C.C.; Nassar, L.R.; Maulding, N.D.; Lee, C.M.; et al. The UCSC Genome Browser Database: 2021 Update. Nucleic Acids Res. 2021, 49, D1046–D1057. [Google Scholar] [CrossRef]
- O’Leary, N.A.; Wright, M.W.; Brister, J.R.; Ciufo, S.; Haddad, D.; McVeigh, R.; Rajput, B.; Robbertse, B.; Smith-White, B.; Ako-Adjei, D.; et al. Reference Sequence (RefSeq) Database at NCBI: Current Status, Taxonomic Expansion, and Functional Annotation. Nucleic Acids Res. 2016, 44, D733–D745. [Google Scholar] [CrossRef] [Green Version]
- Howe, K.L.; Achuthan, P.; Allen, J.; Allen, J.; Alvarez-Jarreta, J.; Amode, M.R.; Armean, I.M.; Azov, A.G.; Bennett, R.; Bhai, J.; et al. Ensembl 2021. Nucleic Acids Res. 2021, 49, D884–D891. [Google Scholar] [CrossRef] [PubMed]
- Zhao, S.; Zhang, B. A Comprehensive Evaluation of Ensembl, RefSeq, and UCSC Annotations in the Context of RNA-Seq Read Mapping and Gene Quantification. BMC Genom. 2015, 16, 97. [Google Scholar] [CrossRef] [Green Version]
- Kepler, T.B.; Crosby, L.; Morgan, K.T. Normalization and Analysis of DNA Microarray Data by Self-Consistency and Local Regression. Genome Biol. 2002, 3, RESEARCH0037. [Google Scholar] [CrossRef] [PubMed]
- Mortazavi, A.; Williams, B.A.; McCue, K.; Schaeffer, L.; Wold, B. Mapping and Quantifying Mammalian Transcriptomes by RNA-Seq. Nat. Methods 2008, 5, 621–628. [Google Scholar] [CrossRef]
- Li, B.; Dewey, C.N. RSEM: Accurate Transcript Quantification from RNA-Seq Data with or without a Reference Genome. BMC Bioinform. 2011, 12, 323. [Google Scholar] [CrossRef] [PubMed] [Green Version]
- Robinson, M.D.; McCarthy, D.J.; Smyth, G.K. EdgeR: A Bioconductor Package for Differential Expression Analysis of Digital Gene Expression Data. Bioinformatics 2010, 26, 139–140. [Google Scholar] [CrossRef] [PubMed] [Green Version]
- Love, M.I.; Huber, W.; Anders, S. Moderated Estimation of Fold Change and Dispersion for RNA-Seq Data with DESeq2. Genome Biol. 2014, 15, 550. [Google Scholar] [CrossRef] [Green Version]
- Harold, H. Relations between Two Sets of Variates. Biometrika 1936, 28, 321–377. [Google Scholar]
- Van der Maaten, L.; Hinton, G. Visualizing Data Using T-SNE. J. Mach. Learn. Res. 2008, 9, 2579–2605. [Google Scholar]
- McInnes, L.; Healy, J.; Saul, N.; Großberger, L. UMAP: Uniform Manifold Approximation and Projection. J. Open Source Softw. 2018, 3, 861. [Google Scholar] [CrossRef]
- Linderman, G.C.; Rachh, M.; Hoskins, J.G.; Steinerberger, S.; Kluger, Y. Fast Interpolation-Based t-SNE for Improved Visualization of Single-Cell RNA-Seq Data. Nat. Methods 2019, 16, 243–245. [Google Scholar] [CrossRef] [PubMed]
- Luecken, M.D.; Theis, F.J. Current Best Practices in Single-Cell RNA-Seq Analysis: A Tutorial. Mol. Syst. Biol. 2019, 15, e8746. [Google Scholar] [CrossRef] [PubMed]
- Becht, E.; McInnes, L.; Healy, J.; Dutertre, C.-A.; Kwok, I.W.H.; Ng, L.G.; Ginhoux, F.; Newell, E.W. Dimensionality Reduction for Visualizing Single-Cell Data Using UMAP. Nat. Biotechnol. 2019, 37, 38–44. [Google Scholar] [CrossRef] [PubMed]
- Liu, P.; Si, Y. Cluster Analysis of RNA-Sequencing Data. In Statistical Analysis of Next Generation Sequencing Data; Datta, S., Nettleton, D., Eds.; Springer International Publishing: Cham, Switzerland, 2014; pp. 191–217. ISBN 9783319072128. [Google Scholar]
- Murtagh, F. A Survey of Recent Advances in Hierarchical Clustering Algorithms. Comput. J. 1983, 26, 354–359. [Google Scholar] [CrossRef] [Green Version]
- Murtagh, F.; Contreras, P. Algorithms for Hierarchical Clustering: An Overview. Wiley Interdiscip. Rev. Data Min. Knowl. Discov. 2012, 2, 86–97. [Google Scholar] [CrossRef]
- Xiang, D.; Venglat, P.; Tibiche, C.; Yang, H.; Risseeuw, E.; Cao, Y.; Babic, V.; Cloutier, M.; Keller, W.; Wang, E.; et al. Genome-Wide Analysis Reveals Gene Expression and Metabolic Network Dynamics during Embryo Development in Arabidopsis. Plant Physiol. 2011, 156, 346–356. [Google Scholar] [CrossRef] [Green Version]
- Vallée, M.; Dufort, I.; Desrosiers, S.; Labbe, A.; Gravel, C.; Gilbert, I.; Robert, C.; Sirard, M.-A. Revealing the Bovine Embryo Transcript Profiles during Early in Vivo Embryonic Development. Reproduction 2009, 138, 95–105. [Google Scholar] [CrossRef] [Green Version]
- Yan, J.; Buer, H.; Wang, Y.P.; Zhula, G.; Bai, Y.E. Transcriptomic Time-Series Analyses of Gene Expression Profile during Zygotic Embryo Development in Picea Mongolica. Front. Genet. 2021, 12, 738649. [Google Scholar] [CrossRef]
- MacQueen, J. Some Methods for Classification and Analysis of Multivariate Observations. In Proceedings of the Fifth Berkeley Symposium on Mathematical Statistics and Probability, Oakland, CA, USA, 1 January 1967; Volume 1, pp. 281–297. [Google Scholar]
- Lumchanow, W.; Udomsiri, S. Chicken Embryo Development Detection Using Self-Organizing Maps and K-Mean Clustering. In Proceedings of the 2017 International Electrical Engineering Congress (iEECON), Pattaya, Thailand, 8–10 March 2017; pp. 1–4. [Google Scholar]
- Balsor, J.L.; Arbabi, K.; Singh, D.; Kwan, R.; Zaslavsky, J.; Jeyanesan, E.; Murphy, K.M. A Practical Guide to Sparse K-Means Clustering for Studying Molecular Development of the Human Brain. Front. Neurosci. 2021, 15, 668293. [Google Scholar] [CrossRef]
- Liu, Z. Clustering Single-Cell RNA-Seq Data with Regularized Gaussian Graphical Model. Genes 2021, 12, 311. [Google Scholar] [CrossRef]
- Xu, C.; Su, Z. Identification of Cell Types from Single-Cell Transcriptomes Using a Novel Clustering Method. Bioinformatics 2015, 31, 1974–1980. [Google Scholar] [CrossRef] [PubMed] [Green Version]
- Qiu, C.; Cao, J.; Martin, B.K.; Li, T.; Welsh, I.C.; Srivatsan, S.; Huang, X.; Calderon, D.; Noble, W.S.; Disteche, C.M.; et al. Systematic Reconstruction of Cellular Trajectories across Mouse Embryogenesis. Nat. Genet. 2022, 54, 328–341. [Google Scholar] [CrossRef] [PubMed]
- Milewski, R.; Malinowski, P.; Milewska, A.; Czerniecki, J.; Ziniewicz, P.; Wołczyński, S. Nearest Neighbor Concept in the Study of IVF ICSI/ET Treatment Effectiveness. Stud. Log. Gramm. Rhetor. Log. Stat. Comput. Methods Med. 2011, 25, 49–57. [Google Scholar]
- Wei, D.; Jiang, Q.; Wei, Y.; Wang, S. A Novel Hierarchical Clustering Algorithm for Gene Sequences. BMC Bioinform. 2012, 13, 174. [Google Scholar] [CrossRef] [PubMed] [Green Version]
- Dong, R.; He, L.; He, R.L.; Yau, S.S.-T. A Novel Approach to Clustering Genome Sequences Using Inter-Nucleotide Covariance. Front. Genet. 2019, 10, 234. [Google Scholar] [CrossRef] [PubMed] [Green Version]
- Groff, A.F.; Resetkova, N.; DiDomenico, F.; Sakkas, D.; Penzias, A.; Rinn, J.L.; Eggan, K. RNA-Seq as a Tool for Evaluating Human Embryo Competence. Genome Res. 2019, 29, 1705–1718. [Google Scholar] [CrossRef] [Green Version]
- Zhang, B.; Peñagaricano, F.; Driver, A.; Chen, H.; Khatib, H. Differential Expression of Heat Shock Protein Genes and Their Splice Variants in Bovine Preimplantation Embryos. J. Dairy Sci. 2011, 94, 4174–4182. [Google Scholar] [CrossRef] [Green Version]
- Pollet, N.; Muncke, N.; Verbeek, B.; Li, Y.; Fenger, U.; Delius, H.; Niehrs, C. An Atlas of Differential Gene Expression during Early Xenopus Embryogenesis. Mech. Dev. 2005, 122, 365–439. [Google Scholar] [CrossRef]
- Hu, B.; Zheng, L.; Long, C.; Song, M.; Li, T.; Yang, L.; Zuo, Y. EmExplorer: A Database for Exploring Time Activation of Gene Expression in Mammalian Embryos. Open Biol. 2019, 9, 190054. [Google Scholar] [CrossRef] [Green Version]
- Reid, J.E.; Wernisch, L. Pseudotime Estimation: Deconfounding Single Cell Time Series. Bioinformatics 2016, 32, 2973–2980. [Google Scholar] [CrossRef] [Green Version]
- Waddington, C.H. The Strategy of the Genes: A Discussion of Some Aspects of Theoretical Biology; George Allen & Unwin: Crows Nest, Australia, 1957. [Google Scholar]
- Trapnell, C.; Cacchiarelli, D.; Grimsby, J.; Pokharel, P.; Li, S.; Morse, M.; Lennon, N.J.; Livak, K.J.; Mikkelsen, T.S.; Rinn, J.L. The Dynamics and Regulators of Cell Fate Decisions Are Revealed by Pseudotemporal Ordering of Single Cells. Nat. Biotechnol. 2014, 32, 381–386. [Google Scholar] [CrossRef] [PubMed] [Green Version]
- Schiebinger, G.; Shu, J.; Tabaka, M.; Cleary, B.; Subramanian, V.; Solomon, A.; Gould, J.; Liu, S.; Lin, S.; Berube, P.; et al. Optimal-Transport Analysis of Single-Cell Gene Expression Identifies Developmental Trajectories in Reprogramming. Cell 2019, 176, 1517. [Google Scholar] [CrossRef] [PubMed] [Green Version]
- Saelens, W.; Cannoodt, R.; Saeys, Y. A Comprehensive Evaluation of Module Detection Methods for Gene Expression Data. Nat. Commun. 2018, 9, 1090. [Google Scholar] [CrossRef] [PubMed]
- La Manno, G.; Soldatov, R.; Zeisel, A.; Braun, E.; Hochgerner, H.; Petukhov, V.; Lidschreiber, K.; Kastriti, M.E.; Lönnerberg, P.; Furlan, A.; et al. RNA Velocity of Single Cells. Nature 2018, 560, 494–498. [Google Scholar] [CrossRef] [Green Version]
- Bergen, V.; Soldatov, R.A.; Kharchenko, P.V.; Theis, F.J. RNA Velocity—Current Challenges and Future Perspectives. Mol. Syst. Biol. 2021, 17, e10282. [Google Scholar] [CrossRef]
- Wolf, F.A.; Hamey, F.K.; Plass, M.; Solana, J.; Dahlin, J.S.; Göttgens, B.; Rajewsky, N.; Simon, L.; Theis, F.J. PAGA: Graph Abstraction Reconciles Clustering with Trajectory Inference through a Topology Preserving Map of Single Cells. Genome Biol. 2019, 20, 59. [Google Scholar] [CrossRef] [Green Version]
- Mittnenzweig, M.; Mayshar, Y.; Cheng, S.; Ben-Yair, R.; Hadas, R.; Rais, Y.; Chomsky, E.; Reines, N.; Uzonyi, A.; Lumerman, L.; et al. A Single-Embryo, Single-Cell Time-Resolved Model for Mouse Gastrulation. Cell 2021, 184, 2825–2842. [Google Scholar] [CrossRef]
- Farrell, J.A.; Wang, Y.; Riesenfeld, S.J.; Shekhar, K.; Regev, A.; Schier, A.F. Single-Cell Reconstruction of Developmental Trajectories during Zebrafish Embryogenesis. Science 2018, 360, eaar3131. [Google Scholar] [CrossRef] [Green Version]
- Xu, C. A Review of Somatic Single Nucleotide Variant Calling Algorithms for Next-Generation Sequencing Data. Comput. Struct. Biotechnol. J. 2018, 16, 15–24. [Google Scholar] [CrossRef]
- Pirooznia, M.; Kramer, M.; Parla, J.; Goes, F.S.; Potash, J.B.; McCombie, W.R.; Zandi, P.P. Validation and Assessment of Variant Calling Pipelines for Next-Generation Sequencing. Hum. Genom. 2014, 8, 14. [Google Scholar] [CrossRef] [Green Version]
- NM, P.; Liu, H.; Bousounis, P.; Spurr, L.; Alomran, N.; Ibeawuchi, H.; Sein, J.; Reece-Stremtan, D.; Horvath, A. Estimating the Allele-Specific Expression of SNVs From 10× Genomics Single-Cell RNA-Sequencing Data. Genes 2020, 11, 240. [Google Scholar] [CrossRef] [Green Version]
- Visscher, P.M.; Wray, N.R.; Zhang, Q.; Sklar, P.; McCarthy, M.I.; Brown, M.A.; Yang, J. 10 Years of GWAS Discovery: Biology, Function, and Translation. Am. J. Hum. Genet. 2017, 101, 5–22. [Google Scholar] [CrossRef] [PubMed] [Green Version]
- Malone, E.R.; Oliva, M.; Sabatini, P.J.B.; Stockley, T.L.; Siu, L.L. Molecular Profiling for Precision Cancer Therapies. Genome Med. 2020, 12, 8. [Google Scholar] [CrossRef] [PubMed] [Green Version]
- Ellrott, K.; Bailey, M.H.; Saksena, G.; Covington, K.R.; Kandoth, C.; Stewart, C.; Hess, J.; Ma, S.; Chiotti, K.E.; McLellan, M.; et al. Scalable Open Science Approach for Mutation Calling of Tumor Exomes Using Multiple Genomic Pipelines. Cell Syst. 2018, 6, 271–281.e7. [Google Scholar] [CrossRef] [Green Version]
- Fasterius, E.; Uhlén, M.; Al-Khalili Szigyarto, C. Single-Cell RNA-Seq Variant Analysis for Exploration of Genetic Heterogeneity in Cancer. Sci. Rep. 2019, 9, 9524. [Google Scholar] [CrossRef] [Green Version]
- Nica, A.C.; Dermitzakis, E.T. Expression Quantitative Trait Loci: Present and Future. Philos. Trans. R. Soc. Lond. B Biol. Sci. 2013, 368, 20120362. [Google Scholar] [CrossRef]
- Aguet, F.; Anand, S.; Ardlie, K.G.; Gabriel, S.; Getz, G.A.; Graubert, A.; Hadley, K.; Handsaker, R.E.; Huang, K.H.; Kashin, S.; et al. The GTEx Consortium Atlas of Genetic Regulatory Effects across Human Tissues. Science 2020, 369, 1318–1330. [Google Scholar]
- Bailey, P.; Chang, D.K.; Nones, K.; Johns, A.L.; Patch, A.-M.; Gingras, M.-C.; Miller, D.K.; Christ, A.N.; Bruxner, T.J.C.; Quinn, M.C.; et al. Genomic Analyses Identify Molecular Subtypes of Pancreatic Cancer. Nature 2016, 531, 47–52. [Google Scholar] [CrossRef]
- Haraksingh, R.R.; Snyder, M.P. Impacts of Variation in the Human Genome on Gene Regulation. J. Mol. Biol. 2013, 425, 3970–3977. [Google Scholar] [CrossRef] [Green Version]
- Spurr, L.F.; Alomran, N.; Bousounis, P.; Reece-Stremtan, D.; Prashant, N.M.; Liu, H.; Słowiński, P.; Li, M.; Zhang, Q.; Sein, J.; et al. ReQTL: Identifying Correlations between Expressed SNVs and Gene Expression Using RNA-Sequencing Data. Bioinformatics 2020, 36, 1351–1359. [Google Scholar] [CrossRef]
- Bae, T.; Tomasini, L.; Mariani, J.; Zhou, B.; Roychowdhury, T.; Franjic, D.; Pletikos, M.; Pattni, R.; Chen, B.-J.; Venturini, E.; et al. Different Mutational Rates and Mechanisms in Human Cells at Pregastrulation and Neurogenesis. Science 2018, 359, 550–555. [Google Scholar] [CrossRef] [PubMed] [Green Version]
- Bernstein, B.E.; Meissner, A.; Lander, E.S. The Mammalian Epigenome. Cell 2007, 128, 669–681. [Google Scholar] [CrossRef] [PubMed] [Green Version]
- Perrino, C.; Barabási, A.-L.; Condorelli, G.; Davidson, S.M.; De Windt, L.; Dimmeler, S.; Engel, F.B.; Hausenloy, D.J.; Hill, J.A.; Van Laake, L.W.; et al. Epigenomic and Transcriptomic Approaches in the Post-Genomic Era: Path to Novel Targets for Diagnosis and Therapy of the Ischaemic Heart? Position Paper of the European Society of Cardiology Working Group on Cellular Biology of the Heart. Cardiovasc. Res. 2017, 113, 725–736. [Google Scholar] [CrossRef] [PubMed]
- Zhang, J.-G.; Tan, L.-J.; Xu, C.; He, H.; Tian, Q.; Zhou, Y.; Qiu, C.; Chen, X.-D.; Deng, H.-W. Integrative Analysis of Transcriptomic and Epigenomic Data to Reveal Regulation Patterns for BMD Variation. PLoS ONE 2015, 10, e0138524. [Google Scholar] [CrossRef]
- Sun, X.; Yi, J.; Yang, J.; Han, Y.; Qian, X.; Liu, Y.; Li, J.; Lu, B.; Zhang, J.; Pan, X.; et al. An Integrated Epigenomic-Transcriptomic Landscape of Lung Cancer Reveals Novel Methylation Driver Genes of Diagnostic and Therapeutic Relevance. Theranostics 2021, 11, 5346–5364. [Google Scholar] [CrossRef]
- Napoli, C.; Benincasa, G.; Donatelli, F.; Ambrosio, G. Precision Medicine in Distinct Heart Failure Phenotypes: Focus on Clinical Epigenetics. Am. Heart J. 2020, 224, 113–128. [Google Scholar] [CrossRef]
- Gluckman, P.D.; Hanson, M.A.; Buklijas, T.; Low, F.M.; Beedle, A.S. Epigenetic Mechanisms That Underpin Metabolic and Cardiovascular Diseases. Nat. Rev. Endocrinol. 2009, 5, 401–408. [Google Scholar] [CrossRef]
- Urdinguio, R.G.; Sanchez-Mut, J.V.; Esteller, M. Epigenetic Mechanisms in Neurological Diseases: Genes, Syndromes, and Therapies. Lancet Neurol. 2009, 8, 1056–1072. [Google Scholar] [CrossRef]
- Kelly, T.K.; De Carvalho, D.D.; Jones, P.A. Epigenetic Modifications as Therapeutic Targets. Nat. Biotechnol. 2010, 28, 1069–1078. [Google Scholar] [CrossRef] [Green Version]
- Lyko, F. The DNA Methyltransferase Family: A Versatile Toolkit for Epigenetic Regulation. Nat. Rev. Genet. 2018, 19, 81–92. [Google Scholar] [CrossRef]
- Li, E.; Zhang, Y. DNA Methylation in Mammals. Cold Spring Harb. Perspect. Biol. 2014, 6, a019133. [Google Scholar] [CrossRef] [PubMed]
- Mohandas, T.; Sparkes, R.S.; Shapiro, L.J. Reactivation of an Inactive Human X Chromosome: Evidence for X Inactivation by DNA Methylation. Science 1981, 211, 393–396. [Google Scholar] [CrossRef]
- Razin, A. Tissue Specific DNA Methylation Patterns: Biochemistry of Formation and Possible Role. In Biological Methylation and Drug Design; Humana Press: Totowa, NJ, USA, 1986; pp. 127–137. [Google Scholar]
- Kass, S.U.; Landsberger, N.; Wolffe, A.P. DNA Methylation Directs a Time-Dependent Repression of Transcription Initiation. Curr. Biol. 1997, 7, 157–165. [Google Scholar] [CrossRef] [Green Version]
- Luo, C.; Hajkova, P.; Ecker, J.R. Dynamic DNA Methylation: In the Right Place at the Right Time. Science 2018, 361, 1336–1340. [Google Scholar] [CrossRef] [PubMed] [Green Version]
- Robertson, K.D.; Wolffe, A.P. DNA Methylation in Health and Disease. Nat. Rev. Genet. 2000, 1, 11–19. [Google Scholar] [CrossRef]
- Yuan, T.; Jiao, Y.; de Jong, S.; Ophoff, R.A.; Beck, S.; Teschendorff, A.E. An Integrative Multi-Scale Analysis of the Dynamic DNA Methylation Landscape in Aging. PLoS Genet. 2015, 11, e1004996. [Google Scholar] [CrossRef] [PubMed] [Green Version]
- Mendelsohn, A.R.; Larrick, J.W. Epigenetic Drift Is a Determinant of Mammalian Lifespan. Rejuvenation Res. 2017, 20, 430–436. [Google Scholar] [CrossRef]
- Issa, J.-P. Aging and Epigenetic Drift: A Vicious Cycle. J. Clin. Investig. 2014, 124, 24–29. [Google Scholar] [CrossRef] [Green Version]
- Lara, E.; Calvanese, V.; Fraga, M.F. Epigenetic Drift and Aging. In Epigenetics of Aging; Springer: New York, NY, USA, 2010; pp. 257–273. [Google Scholar]
- Romano, G.; Veneziano, D.; Acunzo, M.; Croce, C.M. Small Non-Coding RNA and Cancer. Carcinogenesis 2017, 38, 485–491. [Google Scholar] [CrossRef] [Green Version]
- Kato, M.; Slack, F.J. Ageing and the Small, Non-Coding RNA World. Ageing Res. Rev. 2013, 12, 429–435. [Google Scholar] [CrossRef] [PubMed] [Green Version]
- Schuster, A.; Skinner, M.K.; Yan, W. Ancestral Vinclozolin Exposure Alters the Epigenetic Transgenerational Inheritance of Sperm Small Noncoding RNAs. In Environmental Epigenetics; Springer: Berlin/Heidelberg, Germany, 2016; Volume 2. [Google Scholar] [CrossRef]
- Houri-Zeevi, L.; Korem Kohanim, Y.; Antonova, O.; Rechavi, O. Three Rules Explain Transgenerational Small RNA Inheritance in C. Elegans. Cell 2020, 182, 1186–1197.e12. [Google Scholar] [CrossRef]
- Ye, K.; Malinina, L.; Patel, D.J. Recognition of Small Interfering RNA by a Viral Suppressor of RNA Silencing. Nature 2003, 426, 874–878. [Google Scholar] [CrossRef] [PubMed] [Green Version]
- Fire, A.; Xu, S.; Montgomery, M.K.; Kostas, S.A.; Driver, S.E.; Mello, C.C. Potent and Specific Genetic Interference by Double-Stranded RNA in Caenorhabditis Elegans. Nature 1998, 391, 806–811. [Google Scholar] [CrossRef] [PubMed]
- Eddy, S.R. Non–Coding RNA Genes and the Modern RNA World. Nat. Rev. Genet. 2001, 2, 919–929. [Google Scholar] [CrossRef]
- Sperling, R. Small Non-Coding RNA within the Endogenous Spliceosome and Alternative Splicing Regulation. Biochim. Biophys. Acta Gene Regul. Mech. 2019, 1862, 194406. [Google Scholar] [CrossRef]
- Goodrich, J.A.; Kugel, J.F. Non-Coding-RNA Regulators of RNA Polymerase II Transcription. Nat. Rev. Mol. Cell Biol. 2006, 7, 612–616. [Google Scholar] [CrossRef]
- Cusanelli, E.; Romero, C.A.P.; Chartrand, P. Telomeric Noncoding RNA TERRA Is Induced by Telomere Shortening to Nucleate Telomerase Molecules at Short Telomeres. Mol. Cell 2013, 51, 780–791. [Google Scholar] [CrossRef] [Green Version]
- Mitchell, J.R.; Cheng, J.; Collins, K. A Box H/ACA Small Nucleolar RNA-like Domain at the Human Telomerase RNA 3’ End. Mol. Cell. Biol. 1999, 19, 567–576. [Google Scholar] [CrossRef] [Green Version]
- Yoshihama, M.; Nakao, A.; Kenmochi, N. SnOPY: A Small Nucleolar RNA Orthological Gene Database. BMC Res. Notes 2013, 6, 426. [Google Scholar] [CrossRef] [Green Version]
- Bouchard-Bourelle, P.; Desjardins-Henri, C.; Mathurin-St-Pierre, D.; Deschamps-Francoeur, G.; Fafard-Couture, É.; Garant, J.-M.; Elela, S.A.; Scott, M.S. SnoDB: An Interactive Database of Human SnoRNA Sequences, Abundance and Interactions. Nucleic Acids Res. 2020, 48, D220–D225. [Google Scholar] [CrossRef] [PubMed]
- Boccaletto, P.; Machnicka, M.A.; Purta, E.; Piatkowski, P.; Baginski, B.; Wirecki, T.K.; de Crécy-Lagard, V.; Ross, R.; Limbach, P.A.; Kotter, A.; et al. MODOMICS: A Database of RNA Modification Pathways. 2017 Update. Nucleic Acids Res. 2018, 46, D303–D307. [Google Scholar] [CrossRef] [PubMed]
- Oberbauer, V.; Schaefer, M.R. TRNA-Derived Small RNAs: Biogenesis, Modification, Function and Potential Impact on Human Disease Development. Genes 2018, 9, 607. [Google Scholar] [CrossRef] [PubMed] [Green Version]
- Schopman, N.C.T.; Heynen, S.; Haasnoot, J.; Berkhout, B. A MiRNA-TRNA Mix-up: TRNA Origin of Proposed MiRNA. RNA Biol. 2010, 7, 573–576. [Google Scholar] [CrossRef]
- Seto, A.G.; Kingston, R.E.; Lau, N.C. The Coming of Age for Piwi Proteins. Mol. Cell 2007, 26, 603–609. [Google Scholar] [CrossRef]
- Aravin, A.A.; Sachidanandam, R.; Girard, A.; Fejes-Toth, K.; Hannon, G.J. Developmentally Regulated PiRNA Clusters Implicate MILI in Transposon Control. Science 2007, 316, 744–747. [Google Scholar] [CrossRef] [Green Version]
- Das, P.P.; Bagijn, M.P.; Goldstein, L.D.; Woolford, J.R.; Lehrbach, N.J.; Sapetschnig, A.; Buhecha, H.R.; Gilchrist, M.J.; Howe, K.L.; Stark, R.; et al. Piwi and PiRNAs Act Upstream of an Endogenous SiRNA Pathway to Suppress Tc3 Transposon Mobility in the Caenorhabditis Elegans Germline. Mol. Cell 2008, 31, 79–90. [Google Scholar] [CrossRef] [Green Version]
- Kloosterman, W.P.; Plasterk, R.H.A. The Diverse Functions of MicroRNAs in Animal Development and Disease. Dev. Cell 2006, 11, 441–450. [Google Scholar] [CrossRef] [Green Version]
- Lee, R.C.; Feinbaum, R.L.; Ambros, V. The C. Elegans Heterochronic Gene Lin-4 Encodes Small RNAs with Antisense Complementarity to Lin-14. Cell 1993, 75, 843–854. [Google Scholar] [CrossRef]
- O’Brien, J.; Hayder, H.; Zayed, Y.; Peng, C. Overview of MicroRNA Biogenesis, Mechanisms of Actions, and Circulation. Front. Endocrinol. 2018, 9, 402. [Google Scholar] [CrossRef] [Green Version]
- Vanderburg, C.; Beheshti, A. MicroRNAs (MiRNAs), the Final Frontier: The Hidden Master Regulators Impacting Biological Response in All Organisms Due to Spaceflight. 2020. Available online: https://three.jsc.nasa.gov/articles/miRNA_Beheshti.pdf (accessed on 16 September 2020).
- Mattick, J.S. The State of Long Non-Coding RNA Biology. Non-Coding RNA 2018, 4, 17. [Google Scholar] [CrossRef] [PubMed] [Green Version]
- Clark, M.B.; Johnston, R.L.; Inostroza-Ponta, M. Genome-Wide Analysis of Long Noncoding RNA Stability. Genome Res. 2012, 22, 885–898. [Google Scholar] [CrossRef] [PubMed] [Green Version]
- Li, W.; Xu, C.; Guo, J.; Liu, K.; Hu, Y.; Wu, D.; Fang, H.; Zou, Y.; Wei, Z.; Wang, Z.; et al. Cis- and Trans-Acting Expression Quantitative Trait Loci of Long Non-Coding RNA in 2,549 Cancers With Potential Clinical and Therapeutic Implications. Front. Oncol. 2020, 10, 602104. [Google Scholar] [CrossRef] [PubMed]
- Müller, M.; Schauer, T.; Krause, S.; Villa, R.; Thomae, A.W.; Becker, P.B. Two-Step Mechanism for Selective Incorporation of LncRNA into a Chromatin Modifier. Nucleic Acids Res. 2020, 48, 7483–7501. [Google Scholar] [CrossRef]
- Li, Y.-Q.; Sun, N.; Zhang, C.-S.; Li, N.; Wu, B.; Zhang, J.-L. Inactivation of LncRNA HOTAIRM1 Caused by Histone Methyltransferase RIZ1 Accelerated the Proliferation and Invasion of Liver Cancer. Eur. Rev. Med. Pharmacol. Sci. 2020, 24, 8767–8777. [Google Scholar]
- Munoz-Lopez, M.; Garcia-Perez, J.L. DNA Transposons: Nature and Applications in Genomics. Curr. Genom. 2010, 11, 115–128. [Google Scholar] [CrossRef] [Green Version]
- Yang, P.; Wang, Y.; Macfarlan, T.S. The Role of KRAB-ZFPs in Transposable Element Repression and Mammalian Evolution. Trends Genet. 2017, 33, 871–881. [Google Scholar] [CrossRef]
- Kazazian, H.H.; Wong, C.; Youssoufian, H.; Scott, A.F.; Phillips, D.G.; Antonarakis, S.E. Haemophilia A Resulting from de Novo Insertion of L1 Sequences Represents a Novel Mechanism for Mutation in Man. Nature 1988, 332, 164–166. [Google Scholar] [CrossRef]
- Sun, W.; Samimi, H.; Gamez, M.; Zare, H.; Frost, B. Pathogenic Tau-Induced PiRNA Depletion Promotes Neuronal Death through Transposable Element Dysregulation in Neurodegenerative Tauopathies. Nat. Neurosci. 2018, 21, 1038–1048. [Google Scholar] [CrossRef]
- Campbell, N.A. Biology: Concepts & Connections; Pearson/Benjamin Cummings: San Francisco, CA, USA, 2009; ISBN 9780321489845. [Google Scholar]
- Doenecke, D.; Gallwitz, D. Acetylation of Histones in Nucleosomes. Mol. Cell. Biochem. 1982, 44, 113–128. [Google Scholar] [CrossRef]
- Zhang, T.; Cooper, S.; Brockdorff, N. The Interplay of Histone Modifications—Writers That Read. EMBO Rep. 2015, 16, 1467–1481. [Google Scholar] [CrossRef] [PubMed]
- Bannister, A.J.; Kouzarides, T. Regulation of Chromatin by Histone Modifications. Cell Res. 2011, 21, 381–395. [Google Scholar] [CrossRef] [PubMed]
- Li, E. Chromatin Modification and Epigenetic Reprogramming in Mammalian Development. Nat. Rev. Genet. 2002, 3, 662–673. [Google Scholar] [CrossRef] [PubMed]
- Johnson, C.A. Chromatin Modification and Disease. J. Med. Genet. 2000, 37, 905–915. [Google Scholar] [CrossRef] [Green Version]
- Schones, D.E.; Zhao, K. Genome-Wide Approaches to Studying Chromatin Modifications. Nat. Rev. Genet. 2008, 9, 179–191. [Google Scholar] [CrossRef]
- Villaseñor, R.; Pfaendler, R.; Ambrosi, C.; Butz, S.; Giuliani, S.; Bryan, E.; Sheahan, T.W.; Gable, A.L.; Schmolka, N.; Manzo, M.; et al. ChromID Identifies the Protein Interactome at Chromatin Marks. Nat. Biotechnol. 2020, 38, 728–736. [Google Scholar] [CrossRef]
- Fiandaca, M.S.; Mapstone, M.; Connors, E.; Jacobson, M.; Monuki, E.S.; Malik, S.; Macciardi, F.; Federoff, H.J. Systems Healthcare: A Holistic Paradigm for Tomorrow. BMC Syst. Biol. 2017, 11, 142. [Google Scholar] [CrossRef] [Green Version]
- Silverman, E.K.; Schmidt, H.H.H.; Anastasiadou, E.; Altucci, L.; Angelini, M.; Badimon, L.; Balligand, J.-L.; Benincasa, G.; Capasso, G.; Conte, F.; et al. Molecular Networks in Network Medicine: Development and Applications. Wiley Interdiscip. Rev. Syst. Biol. Med. 2020, 12, e1489. [Google Scholar] [CrossRef]
- Caldera, M.; Buphamalai, P.; Müller, F.; Menche, J. Interactome-Based Approaches to Human Disease. Curr. Opin. Syst. Biol. 2017, 3, 88–94. [Google Scholar] [CrossRef]
- Davidson, E.H. The Regulatory Genome: Gene Regulatory Networks in Development and Evolution; Elsevier: Amsterdam, The Netherlands, 2010; ISBN 9780080455570. [Google Scholar]
- Bergthaler, A.; Menche, J. The Immune System as a Social Network. Nat. Immunol. 2017, 18, 481–482. [Google Scholar] [CrossRef]
- Schmidt, H.H.H.W.; Menche, J. The Regulatory Network Architecture of Cardiometabolic Diseases. Nat. Genet. 2022, 54, 2–3. [Google Scholar] [CrossRef] [PubMed]
- Pržulj, N. Analyzing Network Data in Biology and Medicine: An Interdisciplinary Textbook for Biological, Medical and Computational Scientists; Cambridge University Press: Cambridge, UK, 2019; ISBN 9781108432238. [Google Scholar]
- Loan Vulliard, J.M. Complex Networks in Health and Disease. Syst. Med. 2021, 26–33. [Google Scholar] [CrossRef]
- Goymer, P. Why Do We Need Hubs? Nat. Rev. Genet. 2008, 9, 651. [Google Scholar] [CrossRef]
- Zotenko, E.; Mestre, J.; O’Leary, D.P.; Przytycka, T.M. Why Do Hubs in the Yeast Protein Interaction Network Tend to Be Essential: Reexamining the Connection between the Network Topology and Essentiality. PLoS Comput. Biol. 2008, 4, e1000140. [Google Scholar] [CrossRef]
- Muetze, T.; Goenawan, I.H.; Wiencko, H.L.; Bernal-Llinares, M.; Bryan, K.; Lynn, D.J. Contextual Hub Analysis Tool (CHAT): A Cytoscape App for Identifying Contextually Relevant Hubs in Biological Networks. F1000Research 2016, 5, 1745. [Google Scholar] [CrossRef]
- Sah, P.; Singh, L.O.; Clauset, A.; Bansal, S. Exploring Community Structure in Biological Networks with Random Graphs. BMC Bioinform. 2014, 15, 220. [Google Scholar] [CrossRef] [Green Version]
- Wilson, S.J.; Wilkins, A.D.; Lin, C.-H.; Lua, R.C.; Lichtarge, O. Discovery of functional and disease pathways by community detection in protein-protein interaction networks. Pac. Symp. Biocomput. 2017, 22, 336–347. [Google Scholar]
- Kim, W.; Li, M.; Wang, J.; Pan, Y. Biological Network Motif Detection and Evaluation. BMC Syst. Biol. 2011, 5, S5. [Google Scholar] [CrossRef] [Green Version]
- Tripathi, B.; Parthasarathy, S.; Sinha, H.; Raman, K.; Ravindran, B. Adapting Community Detection Algorithms for Disease Module Identification in Heterogeneous Biological Networks. Front. Genet. 2019, 10, 164. [Google Scholar] [CrossRef]
- Ghiassian, S.D.; Menche, J.; Barabási, A.-L. A DIseAse MOdule Detection (DIAMOnD) Algorithm Derived from a Systematic Analysis of Connectivity Patterns of Disease Proteins in the Human Interactome. PLoS Comput. Biol. 2015, 11, e1004120. [Google Scholar] [CrossRef]
- Choobdar, S.; Ahsen, M.E.; Crawford, J.; Tomasoni, M.; Fang, T.; Lamparter, D.; Lin, J.; Hescott, B.; Hu, X.; Mercer, J.; et al. Assessment of Network Module Identification across Complex Diseases. Nat. Methods 2019, 16, 843–852. [Google Scholar] [CrossRef] [PubMed] [Green Version]
- Huang, S. The Molecular and Mathematical Basis of Waddington’s Epigenetic Landscape: A Framework for Post-Darwinian Biology? Bioessays 2012, 34, 149–157. [Google Scholar] [CrossRef] [PubMed]
- Davidson, E.H.; Erwin, D.H. Gene Regulatory Networks and the Evolution of Animal Body Plans. Science 2006, 311, 796–800. [Google Scholar] [CrossRef] [PubMed] [Green Version]
- Kauffman, S.A. Metabolic Stability and Epigenesis in Randomly Constructed Genetic Nets. J. Theor. Biol. 1969, 22, 437–467. [Google Scholar] [CrossRef]
- Arkin, A.; Ross, J.; McAdams, H.H. Stochastic Kinetic Analysis of Developmental Pathway Bifurcation in Phage Lambda-Infected Escherichia Coli Cells. Genetics 1998, 149, 1633–1648. [Google Scholar] [CrossRef]
- Hasty, J.; McMillen, D.; Isaacs, F.; Collins, J.J. Computational Studies of Gene Regulatory Networks: In Numero Molecular Biology. Nat. Rev. Genet. 2001, 2, 268–279. [Google Scholar] [CrossRef]
- de Jong, H. Modeling and Simulation of Genetic Regulatory Systems: A Literature Review. J. Comput. Biol. 2002, 9, 67–103. [Google Scholar] [CrossRef] [Green Version]
- Huynh-Thu, V.A.; Irrthum, A.; Wehenkel, L.; Geurts, P. Inferring Regulatory Networks from Expression Data Using Tree-Based Methods. PLoS ONE 2010, 5, e12776. [Google Scholar] [CrossRef]
- Emmert-Streib, F.; Dehmer, M.; Haibe-Kains, B. Gene Regulatory Networks and Their Applications: Understanding Biological and Medical Problems in Terms of Networks. Front. Cell Dev. Biol. 2014, 2, 38. [Google Scholar] [CrossRef] [Green Version]
- Blais, A.; Dynlacht, B.D. Constructing Transcriptional Regulatory Networks. Genes Dev. 2005, 19, 1499–1511. [Google Scholar] [CrossRef] [Green Version]
- Vlaic, S.; Conrad, T.; Tokarski-Schnelle, C.; Gustafsson, M.; Dahmen, U.; Guthke, R.; Schuster, S. ModuleDiscoverer: Identification of Regulatory Modules in Protein-Protein Interaction Networks. Sci. Rep. 2018, 8, 433. [Google Scholar] [CrossRef] [PubMed] [Green Version]
- Pu, M.; Chen, J.; Tao, Z.; Miao, L.; Qi, X.; Wang, Y.; Ren, J. Regulatory Network of MiRNA on Its Target: Coordination between Transcriptional and Post-Transcriptional Regulation of Gene Expression. Cell. Mol. Life Sci. 2019, 76, 441–451. [Google Scholar] [CrossRef] [PubMed]
- Watson, E.; Yilmaz, L.S.; Walhout, A.J.M. Understanding Metabolic Regulation at a Systems Level: Metabolite Sensing, Mathematical Predictions, and Model Organisms. Annu. Rev. Genet. 2015, 49, 553–575. [Google Scholar] [CrossRef] [PubMed] [Green Version]
- Benes, B.; Guan, K.; Lang, M.; Long, S.P.; Lynch, J.P.; Marshall-Colón, A.; Peng, B.; Schnable, J.; Sweetlove, L.J.; Turk, M.J. Multiscale Computational Models Can Guide Experimentation and Targeted Measurements for Crop Improvement. Plant J. 2020, 103, 21–31. [Google Scholar] [CrossRef] [PubMed]
- Dehmer, M.; Mueller, L.A.J.; Emmert-Streib, F. Quantitative Network Measures as Biomarkers for Classifying Prostate Cancer Disease States: A Systems Approach to Diagnostic Biomarkers. PLoS ONE 2013, 8, e77602. [Google Scholar] [CrossRef] [Green Version]
- Kuijjer, M.L.; Tung, M.G.; Yuan, G.; Quackenbush, J.; Glass, K. Estimating Sample-Specific Regulatory Networks. IScience 2019, 14, 226–240. [Google Scholar] [CrossRef] [Green Version]
- Available online: https://netzoo.github.io (accessed on 3 March 2022).
- West, J.; Widschwendter, M.; Teschendorff, A.E. Distinctive Topology of Age-Associated Epigenetic Drift in the Human Interactome. Proc. Natl. Acad. Sci. USA 2013, 110, 14138–14143. [Google Scholar] [CrossRef] [Green Version]
- Jiao, Y.; Widschwendter, M.; Teschendorff, A.E. A Systems-Level Integrative Framework for Genome-Wide DNA Methylation and Gene Expression Data Identifies Differential Gene Expression Modules under Epigenetic Control. Bioinformatics 2014, 30, 2360–2366. [Google Scholar] [CrossRef] [Green Version]
- Tomczak, K.; Czerwińska, P.; Wiznerowicz, M. The Cancer Genome Atlas (TCGA): An Immeasurable Source of Knowledge. Contemp. Oncol. 2015, 19, A68–A77. [Google Scholar] [CrossRef]
- Ding, W.; Feng, G.; Hu, Y.; Chen, G.; Shi, T. Co-Occurrence and Mutual Exclusivity Analysis of DNA Methylation Reveals Distinct Subtypes in Multiple Cancers. Front. Cell Dev. Biol. 2020, 8, 20. [Google Scholar] [CrossRef] [Green Version]
- Hu, W.-L.; Zhou, X.-H. Identification of Prognostic Signature in Cancer Based on DNA Methylation Interaction Network. BMC Med. Genom. 2017, 10, 63. [Google Scholar] [CrossRef] [PubMed]
- Sanchez, R.; Mackenzie, S.A. Integrative Network Analysis of Differentially Methylated and Expressed Genes for Biomarker Identification in Leukemia. Sci. Rep. 2020, 10, 2123. [Google Scholar] [CrossRef] [Green Version]
- Ma, X.; Liu, Z.; Zhang, Z.; Huang, X.; Tang, W. Multiple Network Algorithm for Epigenetic Modules via the Integration of Genome-Wide DNA Methylation and Gene Expression Data. BMC Bioinform. 2017, 18, 72. [Google Scholar] [CrossRef] [PubMed] [Green Version]
- Hayes, B. Overview of Statistical Methods for Genome-Wide Association Studies (GWAS). Methods Mol. Biol. 2013, 1019, 149–169. [Google Scholar] [PubMed]
- Michels, K.B.; Binder, A.M.; Dedeurwaerder, S.; Epstein, C.B.; Greally, J.M.; Gut, I.; Houseman, E.A.; Izzi, B.; Kelsey, K.T.; Meissner, A.; et al. Recommendations for the Design and Analysis of Epigenome-Wide Association Studies. Nat. Methods 2013, 10, 949–955. [Google Scholar] [CrossRef]
- Cantor, R.M.; Lange, K.; Sinsheimer, J.S. Prioritizing GWAS Results: A Review of Statistical Methods and Recommendations for Their Application. Am. J. Hum. Genet. 2010, 86, 6–22. [Google Scholar] [CrossRef] [Green Version]
- Birney, E.; Smith, G.D.; Greally, J.M. Epigenome-Wide Association Studies and the Interpretation of Disease-Omics. PLoS Genet. 2016, 12, e1006105. [Google Scholar] [CrossRef] [Green Version]
- Ruan, P.; Shen, J.; Santella, R.M.; Zhou, S.; Wang, S. NEpiC: A Network-Assisted Algorithm for Epigenetic Studies Using Mean and Variance Combined Signals. Nucleic Acids Res. 2016, 44, e134. [Google Scholar] [CrossRef] [Green Version]
- Available online: http://www.unimd.org/dnmivd/ (accessed on 3 March 2022).
- Ding, W.; Chen, J.; Feng, G.; Chen, G.; Wu, J.; Guo, Y.; Ni, X.; Shi, T. DNMIVD: DNA Methylation Interactive Visualization Database. Nucleic Acids Res. 2020, 48, D856–D862. [Google Scholar] [CrossRef]
- Paul, P.; Chakraborty, A.; Sarkar, D.; Langthasa, M.; Rahman, M.; Bari, M.; Singha, R.S.; Malakar, A.K.; Chakraborty, S. Interplay between MiRNAs and Human Diseases. J. Cell. Physiol. 2018, 233, 2007–2018. [Google Scholar] [CrossRef]
- Li, Y.; Xu, J.; Chen, H.; Bai, J.; Li, S.; Zhao, Z.; Shao, T.; Jiang, T.; Ren, H.; Kang, C.; et al. Comprehensive Analysis of the Functional MicroRNA–MRNA Regulatory Network Identifies MiRNA Signatures Associated with Glioma Malignant Progression. Nucleic Acids Res. 2013, 41, e203. [Google Scholar] [CrossRef] [PubMed]
- Na, Y.-J.; Kim, J.H. Understanding Cooperativity of MicroRNAs via MicroRNA Association Networks. BMC Genom. 2013, 14 (Suppl. S5), S17. [Google Scholar] [CrossRef] [PubMed] [Green Version]
- Xu, J.; Li, C.-X.; Li, Y.-S.; Lv, J.-Y.; Ma, Y.; Shao, T.-T.; Xu, L.-D.; Wang, Y.-Y.; Du, L.; Zhang, Y.-P.; et al. MiRNA–MiRNA Synergistic Network: Construction via Co-Regulating Functional Modules and Disease MiRNA Topological Features. Nucleic Acids Res. 2010, 39, 825–836. [Google Scholar] [CrossRef] [PubMed] [Green Version]
- Lu, M.; Zhang, Q.; Deng, M.; Miao, J.; Guo, Y.; Gao, W.; Cui, Q. An Analysis of Human MicroRNA and Disease Associations. PLoS ONE 2008, 3, e3420. [Google Scholar] [CrossRef] [Green Version]
- Parikh, V.N.; Jin, R.C.; Rabello, S.; Gulbahce, N.; White, K.; Hale, A.; Cottrill, K.A.; Shaik, R.S.; Waxman, A.B.; Zhang, Y.-Y.; et al. MicroRNA-21 Integrates Pathogenic Signaling to Control Pulmonary Hypertension: Results of a Network Bioinformatics Approach. Circulation 2012, 125, 1520–1532. [Google Scholar] [CrossRef]
- Chen, X.; Xie, D.; Wang, L.; Zhao, Q.; You, Z.-H.; Liu, H. BNPMDA: Bipartite Network Projection for MiRNA–Disease Association Prediction. Bioinformatics 2018, 34, 3178–3186. [Google Scholar] [CrossRef] [Green Version]
- Zhao, H.; Kuang, L.; Feng, X.; Zou, Q.; Wang, L. A Novel Approach Based on a Weighted Interactive Network to Predict Associations of MiRNAs and Diseases. Int. J. Mol. Sci. 2018, 20, 110. [Google Scholar] [CrossRef] [Green Version]
- Wei, J.; Yin, Y.; Deng, Q.; Zhou, J.; Wang, Y.; Yin, G.; Yang, J.; Tang, Y. Integrative Analysis of MicroRNA and Gene Interactions for Revealing Candidate Signatures in Prostate Cancer. Front. Genet. 2020, 11, 176. [Google Scholar] [CrossRef]
- Liao, Q.; Liu, C.; Yuan, X.; Kang, S.; Miao, R.; Xiao, H.; Zhao, G.; Luo, H.; Bu, D.; Zhao, H.; et al. Large-Scale Prediction of Long Non-Coding RNA Functions in a Coding–Non-Coding Gene Co-Expression Network. Nucleic Acids Res. 2011, 39, 3864–3878. [Google Scholar] [CrossRef]
- Li, A.; Ge, M.; Zhang, Y.; Peng, C.; Wang, M. Predicting Long Noncoding RNA and Protein Interactions Using Heterogeneous Network Model. Biomed Res. Int. 2015, 2015, 671950. [Google Scholar] [CrossRef] [Green Version]
- Chen, X. Predicting LncRNA-Disease Associations and Constructing LncRNA Functional Similarity Network Based on the Information of MiRNA. Sci. Rep. 2015, 5, 13186. [Google Scholar] [CrossRef] [PubMed] [Green Version]
- Yu, Y.; Nangia-Makker, P.; Farhana, L.; Majumdar, A.P.N. A Novel Mechanism of LncRNA and MiRNA Interaction: CCAT2 Regulates MiR-145 Expression by Suppressing Its Maturation Process in Colon Cancer Cells. Mol. Cancer 2017, 16, 155. [Google Scholar] [CrossRef] [PubMed]
- Zhang, Y.; Li, Y.; Wang, Q.; Zhang, X.; Wang, D.; Tang, H.C.; Meng, X.; Ding, X. Identification of an LncRNA-miRNA-mRNA Interaction Mechanism in Breast Cancer Based on Bioinformatic Analysis. Mol. Med. Rep. 2017, 16, 5113–5120. [Google Scholar] [CrossRef] [PubMed] [Green Version]
- Cheng, L.; Shi, H.; Wang, Z.; Hu, Y.; Yang, H.; Zhou, C.; Sun, J.; Zhou, M. IntNetLncSim: An Integrative Network Analysis Method to Infer Human LncRNA Functional Similarity. Oncotarget 2016, 7, 47864–47874. [Google Scholar] [CrossRef] [Green Version]
- LncRNA2Target. Available online: http://123.59.132.21/lncrna2target/ (accessed on 3 March 2022).
- Cheng, L.; Wang, P.; Tian, R.; Wang, S.; Guo, Q.; Luo, M.; Zhou, W.; Liu, G.; Jiang, H.; Jiang, Q. LncRNA2Target v2.0: A Comprehensive Database for Target Genes of LncRNAs in Human and Mouse. Nucleic Acids Res. 2019, 47, D140–D144. [Google Scholar] [CrossRef] [Green Version]
- DesJarlais, R.; Tummino, P.J. Role of Histone-Modifying Enzymes and Their Complexes in Regulation of Chromatin Biology. Biochemistry 2016, 55, 1584–1599. [Google Scholar] [CrossRef]
- Turinsky, A.L.; Turner, B.; Borja, R.C.; Gleeson, J.A.; Heath, M.; Pu, S.; Switzer, T.; Dong, D.; Gong, Y.; On, T.; et al. DAnCER: Disease-Annotated Chromatin Epigenetics Resource. Nucleic Acids Res. 2011, 39, D889–D894. [Google Scholar] [CrossRef] [Green Version]
- DAnCER. Available online: http://wodaklab.org/dancer/ (accessed on 3 March 2022).
- Lundberg, S.M.; Tu, W.B.; Raught, B.; Penn, L.Z.; Hoffman, M.M.; Lee, S.-I. ChromNet: Learning the Human Chromatin Network from All ENCODE ChIP-Seq Data. Genome Biol. 2016, 17, 82. [Google Scholar] [CrossRef] [Green Version]
- Schmidt, S.V.; Krebs, W.; Ulas, T.; Xue, J.; Baßler, K.; Günther, P.; Hardt, A.-L.; Schultze, H.; Sander, J.; Klee, K.; et al. The Transcriptional Regulator Network of Human Inflammatory Macrophages Is Defined by Open Chromatin. Cell Res. 2016, 26, 151–170. [Google Scholar] [CrossRef] [Green Version]
- Helin, K.; Dhanak, D. Chromatin Proteins and Modifications as Drug Targets. Nature 2013, 502, 480–488. [Google Scholar] [CrossRef] [Green Version]
- Levy, O.; Knisbacher, B.A.; Levanon, E.Y.; Havlin, S. Integrating Networks and Comparative Genomics Reveals Retroelement Proliferation Dynamics in Hominid Genomes. Sci. Adv. 2017, 3, e1701256. [Google Scholar] [CrossRef] [PubMed] [Green Version]
- Buphamalai, P.; Kokotovic, T.; Nagy, V.; Menche, J. Network Analysis Reveals Rare Disease Signatures across Multiple Levels of Biological Organization. Nat. Commun. 2021, 12, 6306. [Google Scholar] [CrossRef] [PubMed]
- Karczewski, K.J.; Snyder, M.P. Integrative Omics for Health and Disease. Nat. Rev. Genet. 2018, 19, 299–310. [Google Scholar] [CrossRef]
- Stuart, T.; Satija, R. Integrative Single-Cell Analysis. Nat. Rev. Genet. 2019, 20, 257–272. [Google Scholar] [CrossRef]
- Shen, R.; Mo, Q.; Schultz, N.; Seshan, V.E.; Olshen, A.B.; Huse, J.; Ladanyi, M.; Sander, C. Integrative Subtype Discovery in Glioblastoma Using ICluster. PLoS ONE 2012, 7, e35236. [Google Scholar] [CrossRef] [PubMed]
- Jin, S.; Zeng, X.; Fang, J.; Lin, J.; Chan, S.Y.; Erzurum, S.C.; Cheng, F. A Network-Based Approach to Uncover MicroRNA-Mediated Disease Comorbidities and Potential Pathobiological Implications. NPJ Syst. Biol. Appl. 2019, 5, 41. [Google Scholar] [CrossRef]
- Wilson, S.; Filipp, F.V. A Network of Epigenomic and Transcriptional Cooperation Encompassing an Epigenomic Master Regulator in Cancer. NPJ Syst. Biol. Appl. 2018, 4, 24. [Google Scholar] [CrossRef]
- Li, C.-W.; Jheng, B.-R.; Chen, B.-S. Investigating Genetic-and-Epigenetic Networks, and the Cellular Mechanisms Occurring in Epstein-Barr Virus-Infected Human B Lymphocytes via Big Data Mining and Genome-Wide Two-Sided NGS Data Identification. PLoS ONE 2018, 13, e0202537. [Google Scholar] [CrossRef] [Green Version]
- Picard, M.; Scott-Boyer, M.-P.; Bodein, A.; Périn, O.; Droit, A. Integration Strategies of Multi-Omics Data for Machine Learning Analysis. Comput. Struct. Biotechnol. J. 2021, 19, 3735–3746. [Google Scholar] [CrossRef]
- Grapov, D.; Fahrmann, J.; Wanichthanarak, K.; Khoomrung, S. Rise of Deep Learning for Genomic, Proteomic, and Metabolomic Data Integration in Precision Medicine. OMICS 2018, 22, 630–636. [Google Scholar] [CrossRef] [Green Version]
- Lewis, J.E.; Kemp, M.L. Integration of Machine Learning and Genome-Scale Metabolic Modeling Identifies Multi-Omics Biomarkers for Radiation Resistance. Nat. Commun. 2021, 12, 2700. [Google Scholar] [CrossRef] [PubMed]
- Okoro, P.C.; Schubert, R.; Guo, X.; Johnson, W.C.; Rotter, J.I.; Hoeschele, I.; Liu, Y.; Im, H.K.; Luke, A.; Dugas, L.R.; et al. Transcriptome Prediction Performance across Machine Learning Models and Diverse Ancestries. HGG Adv. 2021, 2, 100019. [Google Scholar] [CrossRef] [PubMed]
- Jiang, Q.; Dai, L.; Chen, N.; Li, J.; Gao, Y.; Zhao, J.; Ding, L.; Xie, C.; Yi, X.; Deng, H.; et al. Integrative Analysis Provides Multi-Omics Evidence for the Pathogenesis of Placenta Percreta. J. Cell. Mol. Med. 2020, 24, 13837–13852. [Google Scholar] [CrossRef] [PubMed]
- Benny, P.A.; Alakwaa, F.M.; Schlueter, R.J.; Lassiter, C.B.; Garmire, L.X. A Review of Omics Approaches to Study Preeclampsia. Placenta 2020, 92, 17–27. [Google Scholar] [CrossRef] [PubMed]
- Zeng, L.; Yang, K.; Ge, J. Uncovering the Pharmacological Mechanism of Astragalus Salvia Compound on Pregnancy-Induced Hypertension Syndrome by a Network Pharmacology Approach. Sci. Rep. 2017, 7, 16849. [Google Scholar] [CrossRef] [PubMed] [Green Version]
- Bermúdez, M.G.; Wells, D.; Malter, H.; Munné, S.; Cohen, J.; Steuerwald, N.M. Expression Profiles of Individual Human Oocytes Using Microarray Technology. Reprod. Biomed. Online 2004, 8, 325–337. [Google Scholar] [CrossRef]
- Assou, S.; Anahory, T.; Pantesco, V.; Le Carrour, T.; Pellestor, F.; Klein, B.; Reyftmann, L.; Dechaud, H.; De Vos, J.; Hamamah, S. The Human Cumulus--Oocyte Complex Gene-Expression Profile. Hum. Reprod. 2006, 21, 1705–1719. [Google Scholar] [CrossRef]
- Kocabas, A.M.; Crosby, J.; Ross, P.J.; Otu, H.H.; Beyhan, Z.; Can, H.; Tam, W.-L.; Rosa, G.J.M.; Halgren, R.G.; Lim, B.; et al. The Transcriptome of Human Oocytes. Proc. Natl. Acad. Sci. USA 2006, 103, 14027–14032. [Google Scholar] [CrossRef] [Green Version]
- Zhang, P.; Kerkelä, E.; Skottman, H.; Levkov, L.; Kivinen, K.; Lahesmaa, R.; Hovatta, O.; Kere, J. Distinct Sets of Developmentally Regulated Genes That Are Expressed by Human Oocytes and Human Embryonic Stem Cells. Fertil. Steril. 2007, 87, 677–690. [Google Scholar] [CrossRef]
- Wood, J.R.; Dumesic, D.A.; Abbott, D.H.; Strauss, J.F. 3rd Molecular Abnormalities in Oocytes from Women with Polycystic Ovary Syndrome Revealed by Microarray Analysis. J. Clin. Endocrinol. Metab. 2007, 92, 705–713. [Google Scholar] [CrossRef] [Green Version]
- Gasca, S.; Pellestor, F.; Assou, S.; Loup, V.; Anahory, T.; Dechaud, H.; De Vos, J.; Hamamah, S. Identifying New Human Oocyte Marker Genes: A Microarray Approach. Reprod. Biomed. Online 2007, 14, 175–183. [Google Scholar] [CrossRef]
- Gasca, S.; Reyftmann, L.; Pellestor, F.; Rème, T.; Assou, S.; Anahory, T.; Dechaud, H.; Klein, B.; De Vos, J.; Hamamah, S. Total Fertilization Failure and Molecular Abnormalities in Metaphase II Oocytes. Reprod. Biomed. Online 2008, 17, 772–781. [Google Scholar] [CrossRef]
- Jones, G.M.; Cram, D.S.; Song, B.; Magli, M.C.; Gianaroli, L.; Lacham-Kaplan, O.; Findlay, J.K.; Jenkin, G.; Trounson, A.O. Gene Expression Profiling of Human Oocytes Following in Vivo or in Vitro Maturation. Hum. Reprod. 2008, 23, 1138–1144. [Google Scholar] [CrossRef] [PubMed] [Green Version]
- Wells, D.; Patrizio, P. Gene Expression Profiling of Human Oocytes at Different Maturational Stages and after in Vitro Maturation. Am. J. Obstet. Gynecol. 2008, 198, e1–e9. [Google Scholar] [CrossRef] [PubMed]
- Grøndahl, M.L.; Yding Andersen, C.; Bogstad, J.; Nielsen, F.C.; Meinertz, H.; Borup, R. Gene Expression Profiles of Single Human Mature Oocytes in Relation to Age. Hum. Reprod. 2010, 25, 957–968. [Google Scholar] [CrossRef]
- Dobson, A.T.; Raja, R.; Abeyta, M.J.; Taylor, T.; Shen, S.; Haqq, C.; Pera, R.A.R. The Unique Transcriptome through Day 3 of Human Preimplantation Development. Hum. Mol. Genet. 2004, 13, 1461–1470. [Google Scholar] [CrossRef] [PubMed]
- Li, S.S.-L.; Liu, Y.-H.; Tseng, C.-N.; Singh, S. Analysis of Gene Expression in Single Human Oocytes and Preimplantation Embryos. Biochem. Biophys. Res. Commun. 2006, 340, 48–53. [Google Scholar] [CrossRef]
- Jaroudi, S.; Kakourou, G.; Cawood, S.; Doshi, A.; Ranieri, D.M.; Serhal, P.; Harper, J.C.; SenGupta, S.B. Expression Profiling of DNA Repair Genes in Human Oocytes and Blastocysts Using Microarrays. Hum. Reprod. 2009, 24, 2649–2655. [Google Scholar] [CrossRef] [Green Version]
- Zhang, P.; Zucchelli, M.; Bruce, S.; Hambiliki, F.; Stavreus-Evers, A.; Levkov, L.; Skottman, H.; Kerkelä, E.; Kere, J.; Hovatta, O. Transcriptome Profiling of Human Pre-Implantation Development. PLoS ONE 2009, 4, e7844. [Google Scholar] [CrossRef]
- Smith, H.L.; Stevens, A.; Minogue, B.; Sneddon, S.; Shaw, L.; Wood, L.; Adeniyi, T.; Xiao, H.; Lio, P.; Kimber, S.J.; et al. Systems Based Analysis of Human Embryos and Gene Networks Involved in Cell Lineage Allocation. BMC Genom. 2019, 20, 171. [Google Scholar] [CrossRef]
- Yan, L.; Yang, M.; Guo, H.; Yang, L.; Wu, J.; Li, R.; Liu, P.; Lian, Y.; Zheng, X.; Yan, J.; et al. Single-Cell RNA-Seq Profiling of Human Preimplantation Embryos and Embryonic Stem Cells. Nat. Struct. Mol. Biol. 2013, 20, 1131–1139. [Google Scholar] [CrossRef] [PubMed]
- Blakeley, P.; Fogarty, N.; Del Valle, I.; Wamaitha, S.; Hu, T.X.; Elder, K.; Snell, P.; Christie, L.; Robson, P.; Niakan, K. Defining the Three Cell Lineages of the Human Blastocyst by Single-Cell RNA-Seq. Mech. Dev. 2017, 145, S26. [Google Scholar] [CrossRef]
- Petropoulos, S.; Edsgärd, D.; Reinius, B.; Deng, Q.; Panula, S.P.; Codeluppi, S.; Plaza Reyes, A.; Linnarsson, S.; Sandberg, R.; Lanner, F. Single-Cell RNA-Seq Reveals Lineage and X Chromosome Dynamics in Human Preimplantation Embryos. Cell 2016, 165, 1012–1026. [Google Scholar] [CrossRef] [PubMed] [Green Version]
- Zhou, F.; Wang, R.; Yuan, P.; Ren, Y.; Mao, Y.; Li, R.; Lian, Y.; Li, J.; Wen, L.; Yan, L.; et al. Reconstituting the Transcriptome and DNA Methylome Landscapes of Human Implantation. Nature 2019, 572, 660–664. [Google Scholar] [CrossRef] [PubMed]


| Techniques | Sample Type | Number of Genes/Cells | Goals | Study |
|---|---|---|---|---|
| HG-U133 Plus 2.0 array (Affymetrix) | Oocytes | 1361 transcripts expressed in oocytes | Study of oocyte transcriptomes | [220] |
| HG-U133 Plus 2.0 array (Affymetrix) | Oocytes | 1514 overexpressed in oocytes compared with cumulus cells | Understanding of the mechanisms regulating oocyte maturation | [221] |
| HG-U133 Plus 2.0 array (Affymetrix) | Oocytes | 5331 transcripts enriched in metaphase II oocytes relative to somatic cells | Comprehension of genes expressed in in vivo matured oocytes | [222] |
| HG-U133 Plus 2.0 array (Affymetrix) | Oocytes | 10,183 genes were expressed in germinal vesicle | Study of global gene expression in human oocytes at the later stages of folliculogenesis (germinal vesicle stage) | [223] |
| HG-U133 Plus 2.0 array (Affymetrix) | Oocytes | Of the 8123 transcripts expressed in the oocytes, 374 genes showed significant differences in mRNA abundance in PCOS oocytes | Understanding of PCOS | [224] |
| HG-U133 Plus 2.0 array (Affymetrix) | Oocytes | Identification of new potential regulators and marker genes that are involved in oocyte maturation | [225] | |
| HG-U133 Plus 2.0 array (Affymetrix) | Oocytes | 283 genes found in the case report sample | Identification of molecular abnormalities in metaphase II (MII) oocytes | [226] |
| Whole Genome Bioarrays printed with 54,840 discovery probes representing 18,055 human genes and an additional 29,378 human expressed sequence tags (EST) | Oocytes | 2000 genes were identified as expressed at more than 2-fold higher levels in oocytes matured in vitro than those matured in vivo | Analysis of the gene expression profile of oocytes following in vivo or in vitro maturation | [227] |
| Applied Biosystems Human Genome Survey Microarray (32,878 60-mer oligonucleotide) | Oocytes | Germinal vesicle, in vivo-MII and IVM-MII oocytes expressed 12,219, 9735 and 8510 genes, respectively | Characterisation of the patterns of gene expression in germinal vesicle stage and meiosis II oocytes matured in vitro or in vivo | [228] |
| HG-U133 Plus 2.0 array (Affymetrix) | Oocytes | 342 genes showed a significantly different expression level between the two age groups (women aged 36 years (younger) and women aged 37–39 years (older)) | Investigation of the effect of age on gene expression profile in mature oocytes | [229] |
| Two cDNA microarrays, each containing about 20,000 targets (representing in total ~29,778 independent genes according to Unigene Build 155) | Oocytes and embryos | 1896 significant changes in expression following fertilization through day 3 of development | Global analysis of the preimplantation embryo transcriptome | [230] |
| cDNA microarrays containing 9600 cDNA spots | Oocytes and embryos | 184, 29 and 65 genes were overexpressed in oocytes, 4- and 8-cell embryos, respectively | Identification of the differential expression profiles of genes in single oocytes, 4- and 8-cell preimplantation embryos | [231] |
| Genome Survey Microarrays V2.0 (Applied Biosystems) | Oocytes and embryos | 107 DNA repair genes were detected in oocytes | Identification of the DNA repair pathways that may be active pre- and post-embryonic genome activation by investigating mRNA in human in vitro matured oocytes and blastocysts | [232] |
| HG-U133 Plus 2.0 array (Affymetrix) | Oocytes and embryos | 5477 transcripts differentially expressed into transition from mature oocyte (MII) to 2-day embryo and 2989 transcripts differentially expressed into transition from 2-day to 3-day embryo | Study of global gene expression in human preimplantation development | [233] |
| HG-U133 Plus 2.0 array (Affymetrix) | Oocytes and embryos | 45 eukaryotic initiation factors, 19 of which are differentially regulated between the 8-cell stage and blastocyst | Identification of gene networks behind cell fate decision in blastomeres | [234] |
| Illumina HiSeq2000 unpaired (TrueSeq) | Oocytes, embryos, and hESCs | 124 single cells, 90 from 20 oocytes and embryos, 8 from primary hESC outgrowth, 26 from hESC passage 10, averaging 35.3 million reads per cell, average read length 100 bp. 22,687 maternally expressed genes detected, including 8701 lncRNAs, 2733 of them novel and developmental stage specific | Comparing the gene expression of human epiblast in vitro with hESCs | [235] |
| Illumina HiSeq2000 paired-end (TrueSeq) | Embryos | 86 single cells | Validating known marker genes and highlighting differences between human and mouse pre-implantation development | [236] |
| Illumina HiSeq2000 single-end (Smart-seq2) | Embryos | 1529 single cells from 88 embryos of various developmental stages, averaging 8500 expressed genes | Showcasing the differentiation of cell lineage in pre-implantation embryos and X-chromosome dosage compensation in females | [237] |
| Illumina HiSeq4000 paired-end (STRT-Seq and Trio-seq2) | Embryos | 7636 single cells from 65 pre/post implantation embryos | Observation of genome regulation surrounding implantation | [238] |
| Name | Type of Data | URLs | Description | Reference |
|---|---|---|---|---|
| National Institutes of Health Roadmap Epigenome Project |
| www.roadmapepigenomics.org (accessed on 3 March 2022) | The consortium provides an analysis of stem cells and primary ex vivo tissues to collect normal epigenomes to provide a reference for comparison and integration in future studies. | [217] |
| ENCODE (Encyclopedia of DNA Elements Project) |
| https://www.encodeproject.org/ (accessed on 3 March 2022) | The consortium built a comprehensive parts list of functional elements in the human genome, including all the regulatory elements in different biological levels of complexity. | [218] |
| Human Epigenome Consortium |
| https://epigenomesportal.ca/ihec/ (accessed on 3 March 2022) | Large collection of studies containing human epigenome and transcriptome grouped by tissue and cell type. | [219] |
| Histone Infobase (HIstome) |
| http://www.iiserpune.ac.in/~coee/histome/ (accessed on 3 March 2022) | Database covering 5 different types of histones, 8 types of their post-translational modification and 13 classes of modifying enzymes | [220] |
| DeepBlue |
| https://deepblue.mpi-inf.mpg.de/ (accessed on 3 March 2022) | This source provides a great effort for integrating different databases and sources and obtaining a large comprehensive epigenomic consultable tool (via web interface or API interface) | [221] |
| MethBase |
| http://smithlabresearch.org/software/methbase/ (accessed on 3 March 2022) | For each methylome, they provide methylation level at individual sites, regions of allele specific methylation, hypo- or hyper-methylated regions, partially methylated regions, metadata and statistics. | [222] |
| iMETHYL |
| http://imethyl.iwate-megabank.org/ (accessed on 3 March 2022) | They provide a multi-omics data centering source for DNA methylation, also including information about cell types. | [223] |
| NONCODE |
| http://www.noncode.org/index.php (accessed on 3 March 2022) | This database comprises lncRNA from different organisms in health and disease. | [224] |
| miRBase |
| https://www.mirbase.org/ (accessed on 3 March 2022) | This is a searchable database of published miRNA sequences and annotations. | [225] |
| PolymiRTS Database 3.0 |
| https://compbio.uthsc.edu/miRSNP/ (accessed on 3 March 2022) | Database containing miRNAs biological annotations, relationships with disease states and gene expression and their polymorphisms, variants and mutations. | [226] |
| snOPY |
| http://snoopy.med.miyazaki-u.ac.jp/ (accessed on 3 March 2022) | They provide a list of snoRNAs, snoRNA locus, target RNAs and orthologs for 39 different organisms. | [90] |
| snoDB |
| http://scottgroup.med.usherbrooke.ca/snoDB/ (accessed on 3 March 2022) | It harmonises human snoRNAs information from different sources, such as sequence databases and target information. | [91] |
| RMBase v2.0 |
| http://rna.sysu.edu.cn/rmbase/ (accessed on 3 March 2022) | This database provides an important source for all the possible RNA modifications, including miRNA, snRNAs and snoRNAs. | [227] |
| mQTLdb |
| http://www.mqtldb.org/ (accessed on 3 March 2022) | They provide methylation and genotype data on mother–child pairs providing access to meQTL mapping across five different stages of life. | [228] |
| Methylomic trajectories across fetal brain development |
| https://epigenetics.essex.ac.uk/fetalbrain/ (accessed on 3 March 2022) | DNA methylation across fetal brain development. | [229] |
| Methylation quantitative trait loci (mQTL) in the developing human brain and their enrichment in genomic regions associated with schizophrenia |
| https://epigenetics.essex.ac.uk/mQTL/ (accessed on 3 March 2022) | DNA methylation quantitative trait loci of human fetal brain. | [230] |
Publisher’s Note: MDPI stays neutral with regard to jurisdictional claims in published maps and institutional affiliations. |
© 2022 by the authors. Licensee MDPI, Basel, Switzerland. This article is an open access article distributed under the terms and conditions of the Creative Commons Attribution (CC BY) license (https://creativecommons.org/licenses/by/4.0/).
Share and Cite
Lombardo, S.D.; Wangsaputra, I.F.; Menche, J.; Stevens, A. Network Approaches for Charting the Transcriptomic and Epigenetic Landscape of the Developmental Origins of Health and Disease. Genes 2022, 13, 764. https://doi.org/10.3390/genes13050764
Lombardo SD, Wangsaputra IF, Menche J, Stevens A. Network Approaches for Charting the Transcriptomic and Epigenetic Landscape of the Developmental Origins of Health and Disease. Genes. 2022; 13(5):764. https://doi.org/10.3390/genes13050764
Chicago/Turabian StyleLombardo, Salvo Danilo, Ivan Fernando Wangsaputra, Jörg Menche, and Adam Stevens. 2022. "Network Approaches for Charting the Transcriptomic and Epigenetic Landscape of the Developmental Origins of Health and Disease" Genes 13, no. 5: 764. https://doi.org/10.3390/genes13050764