

Dynamic Network Biomarker Analysis Reveals the Critical Phase Transition of Fruit Ripening in Grapevine
 and
and 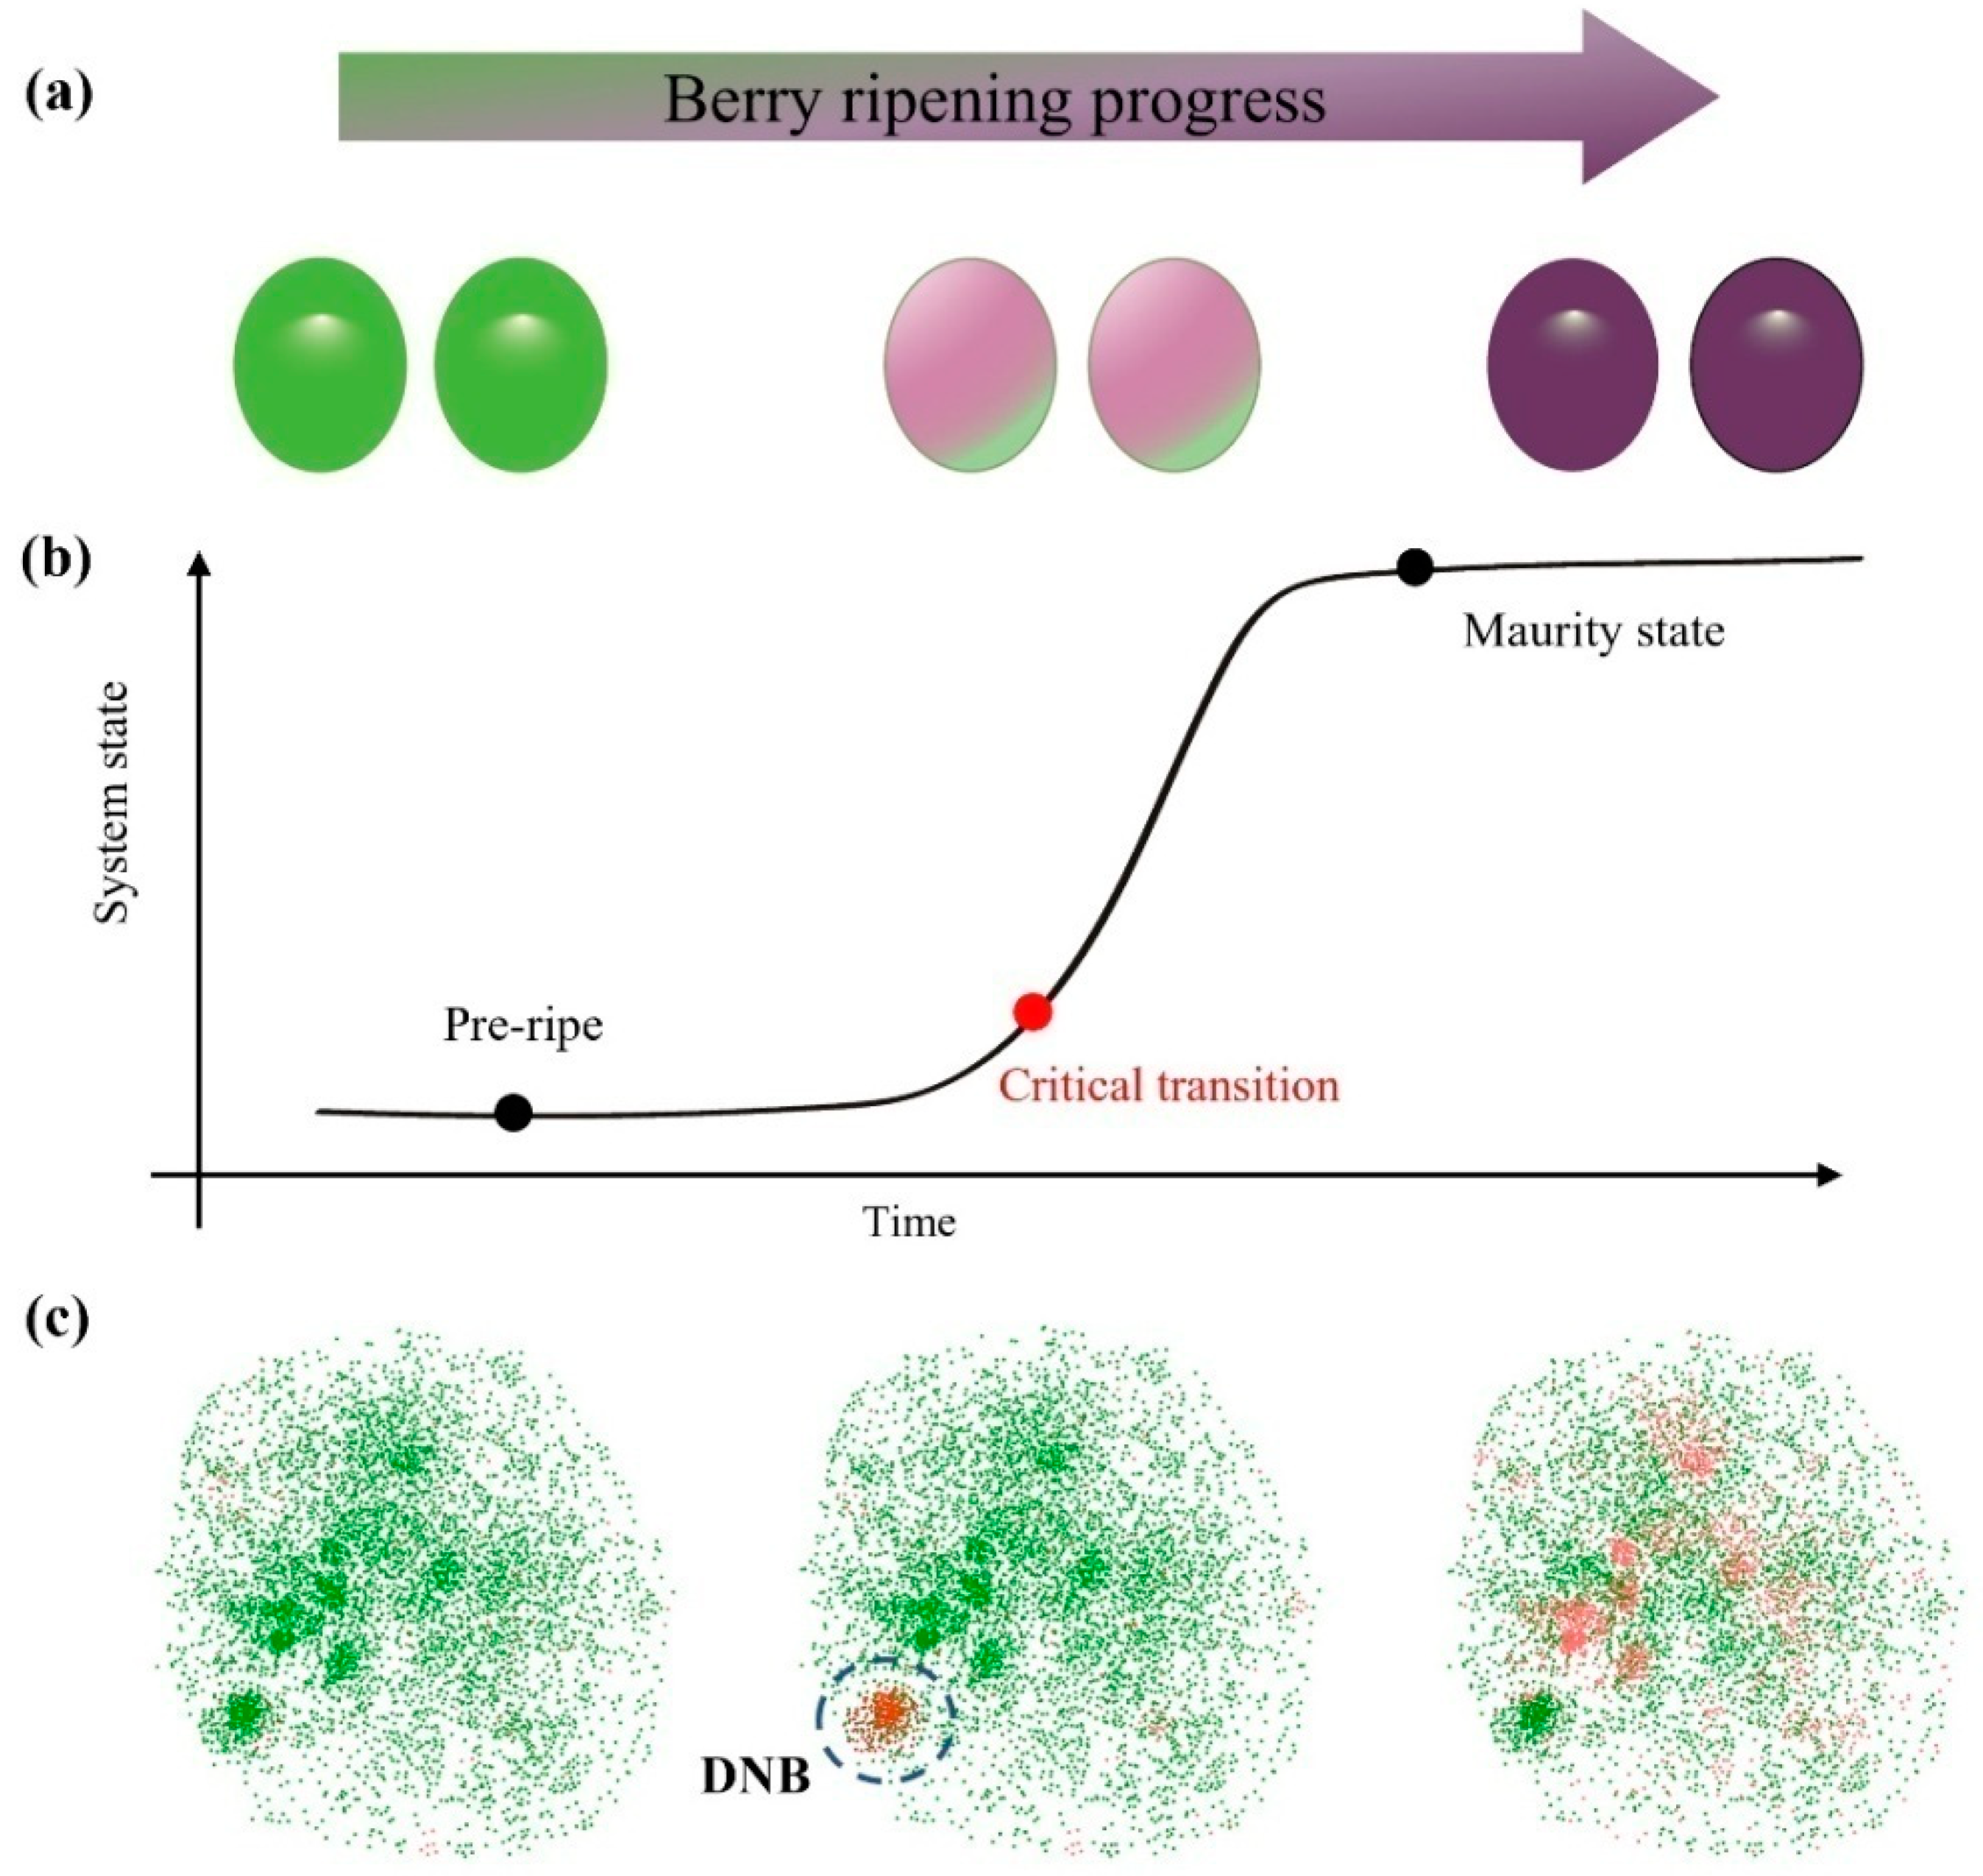
Abstract
:1. Introduction
2. Materials and Methods
2.1. Data Collection and Pre-Processing
2.2. Differential Gene Expression Analysis
2.3. Functional Enrichment Analysis and Visualization
2.4. Network Analysis and Visualization
3. Results
3.1. Quantitative Modeling for System Fluctuations of Berry Ripening
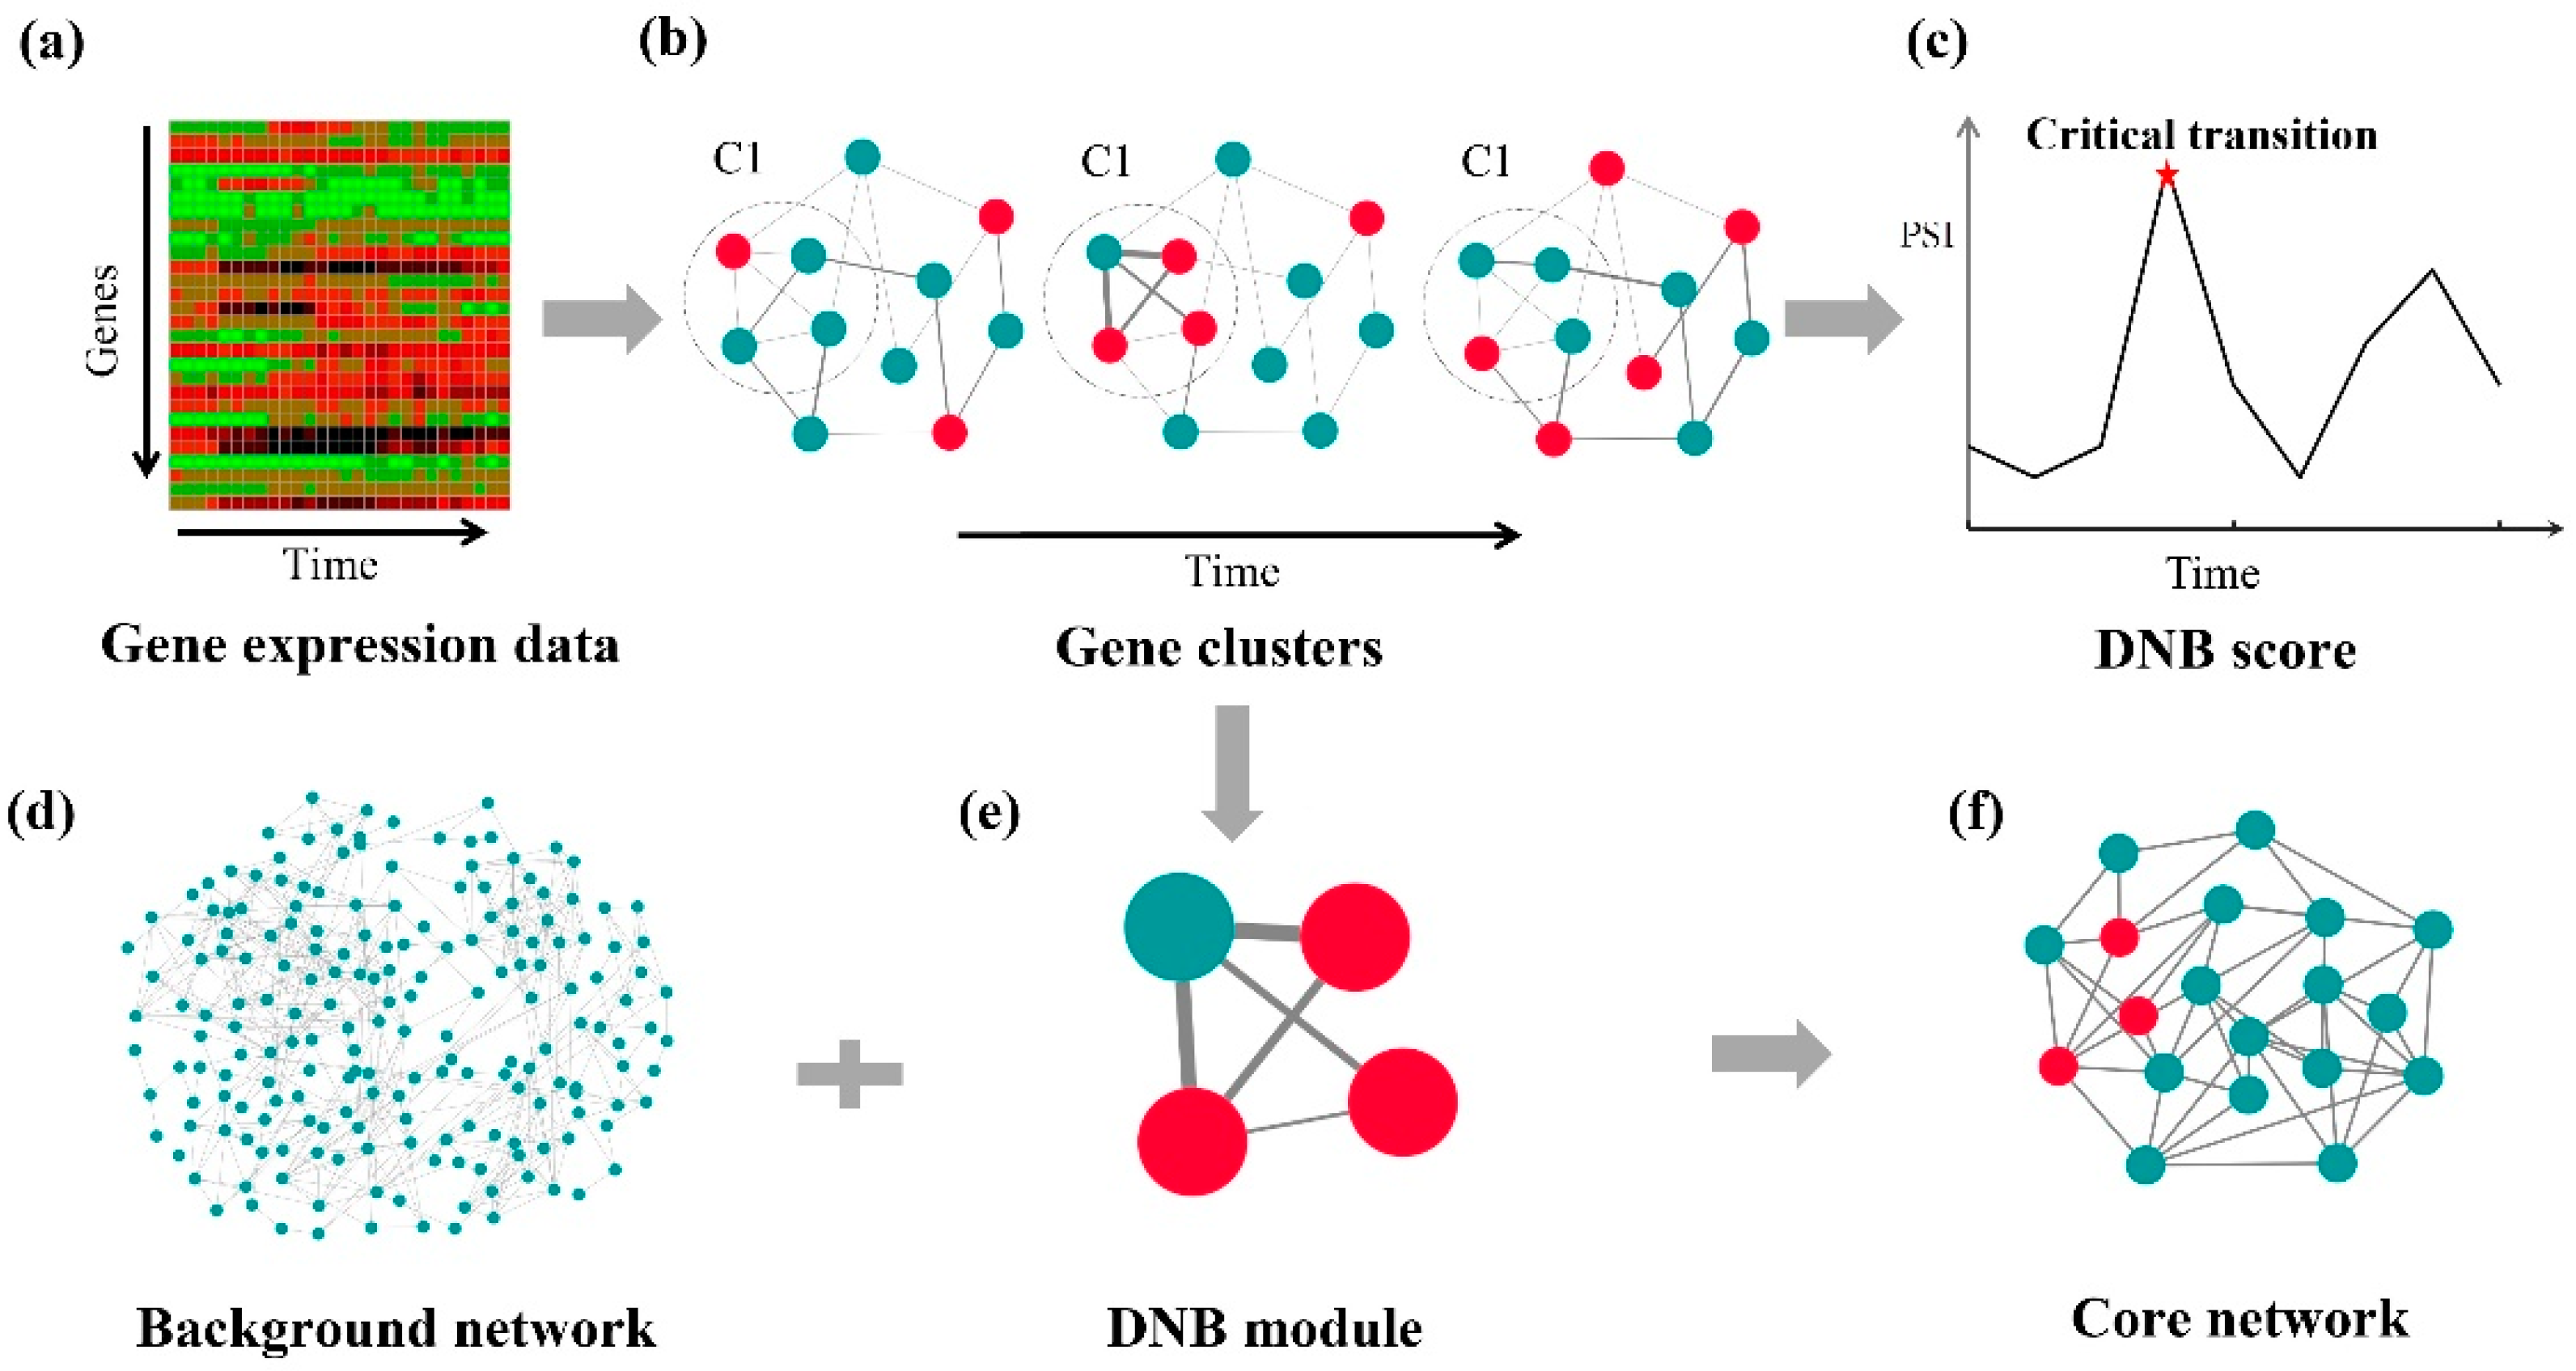
3.2. Dynamic Network Biomarker Analysis of Grapevine Fruit Ripening
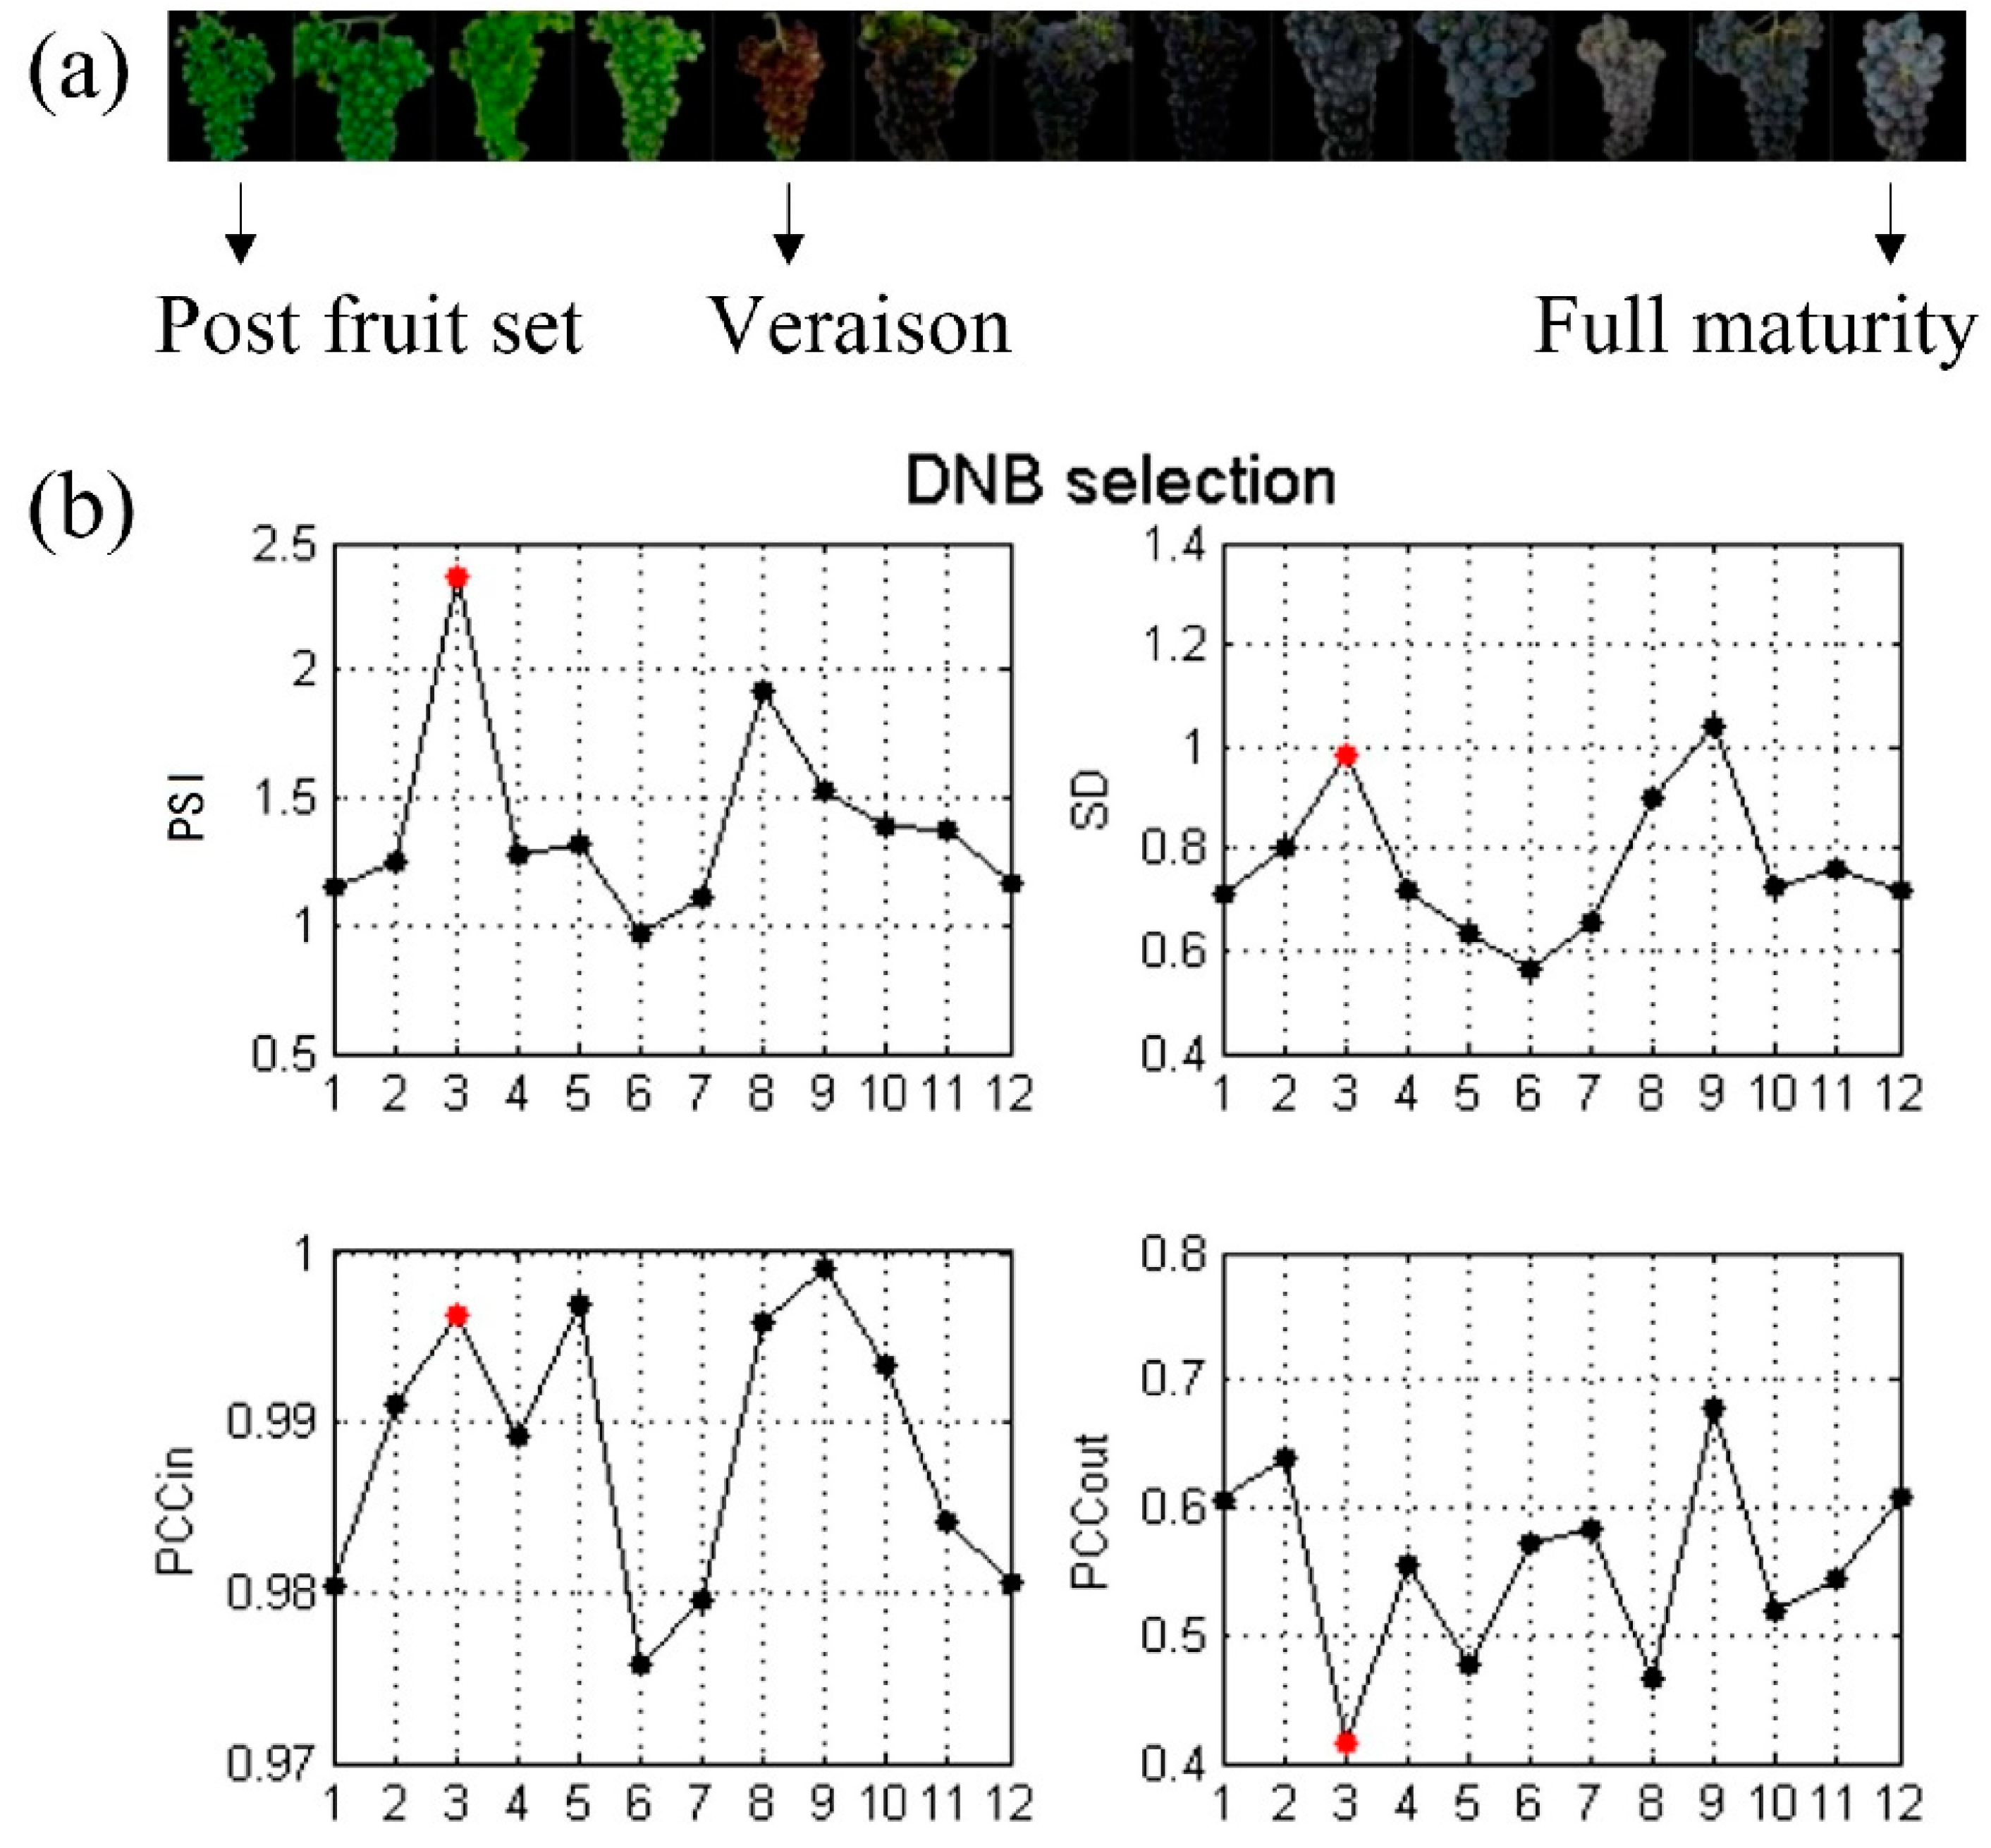
3.3. Critical Transition of Grapevine Berry Ripening
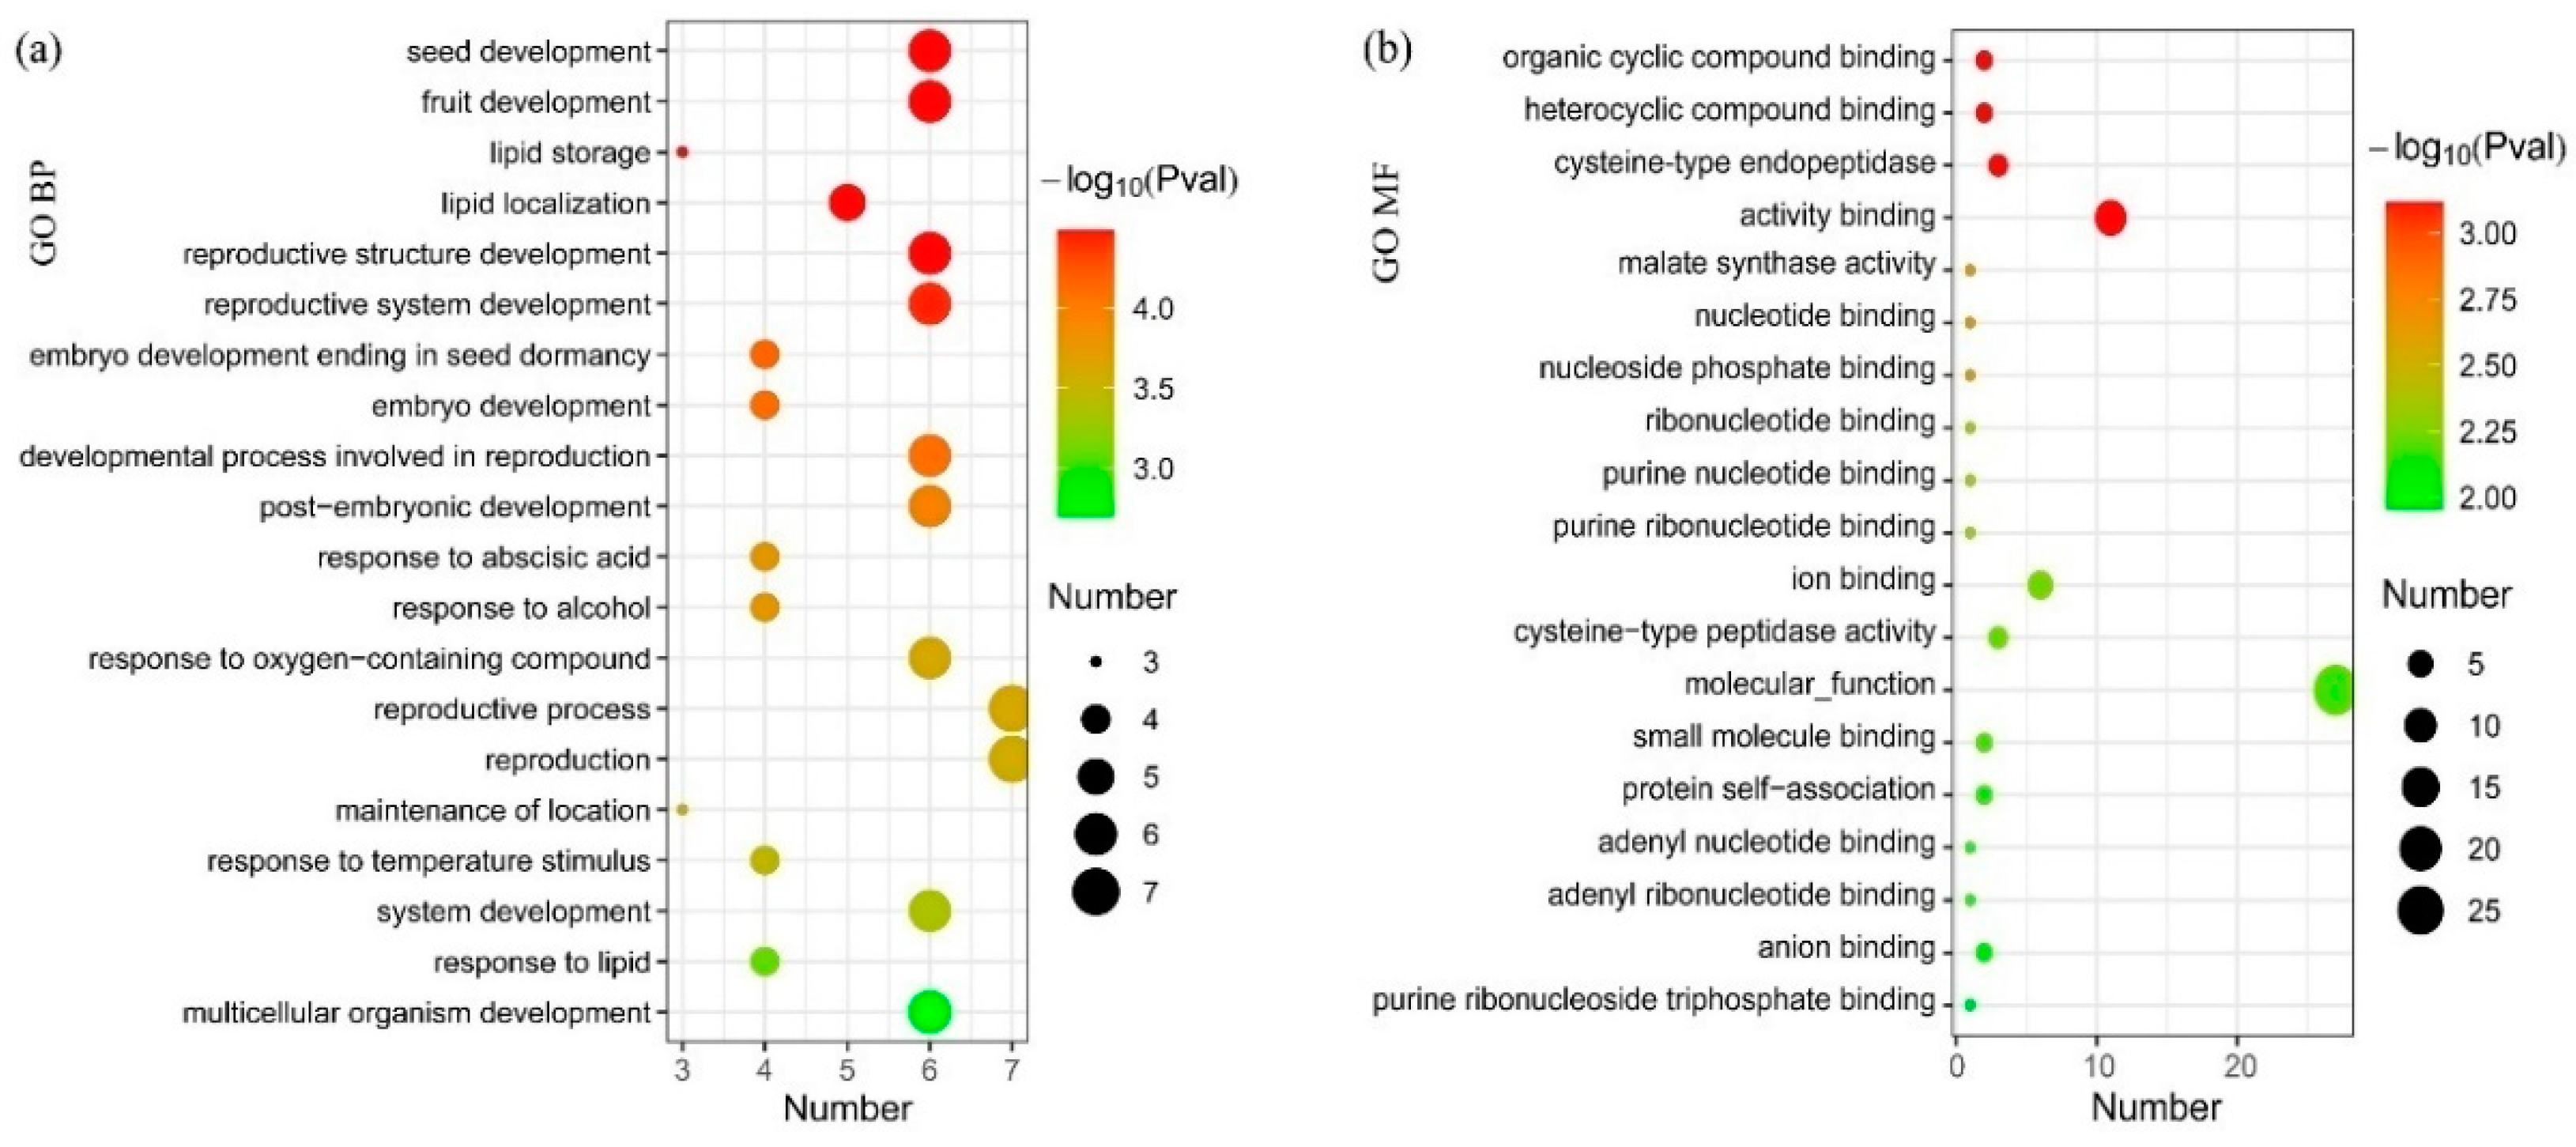
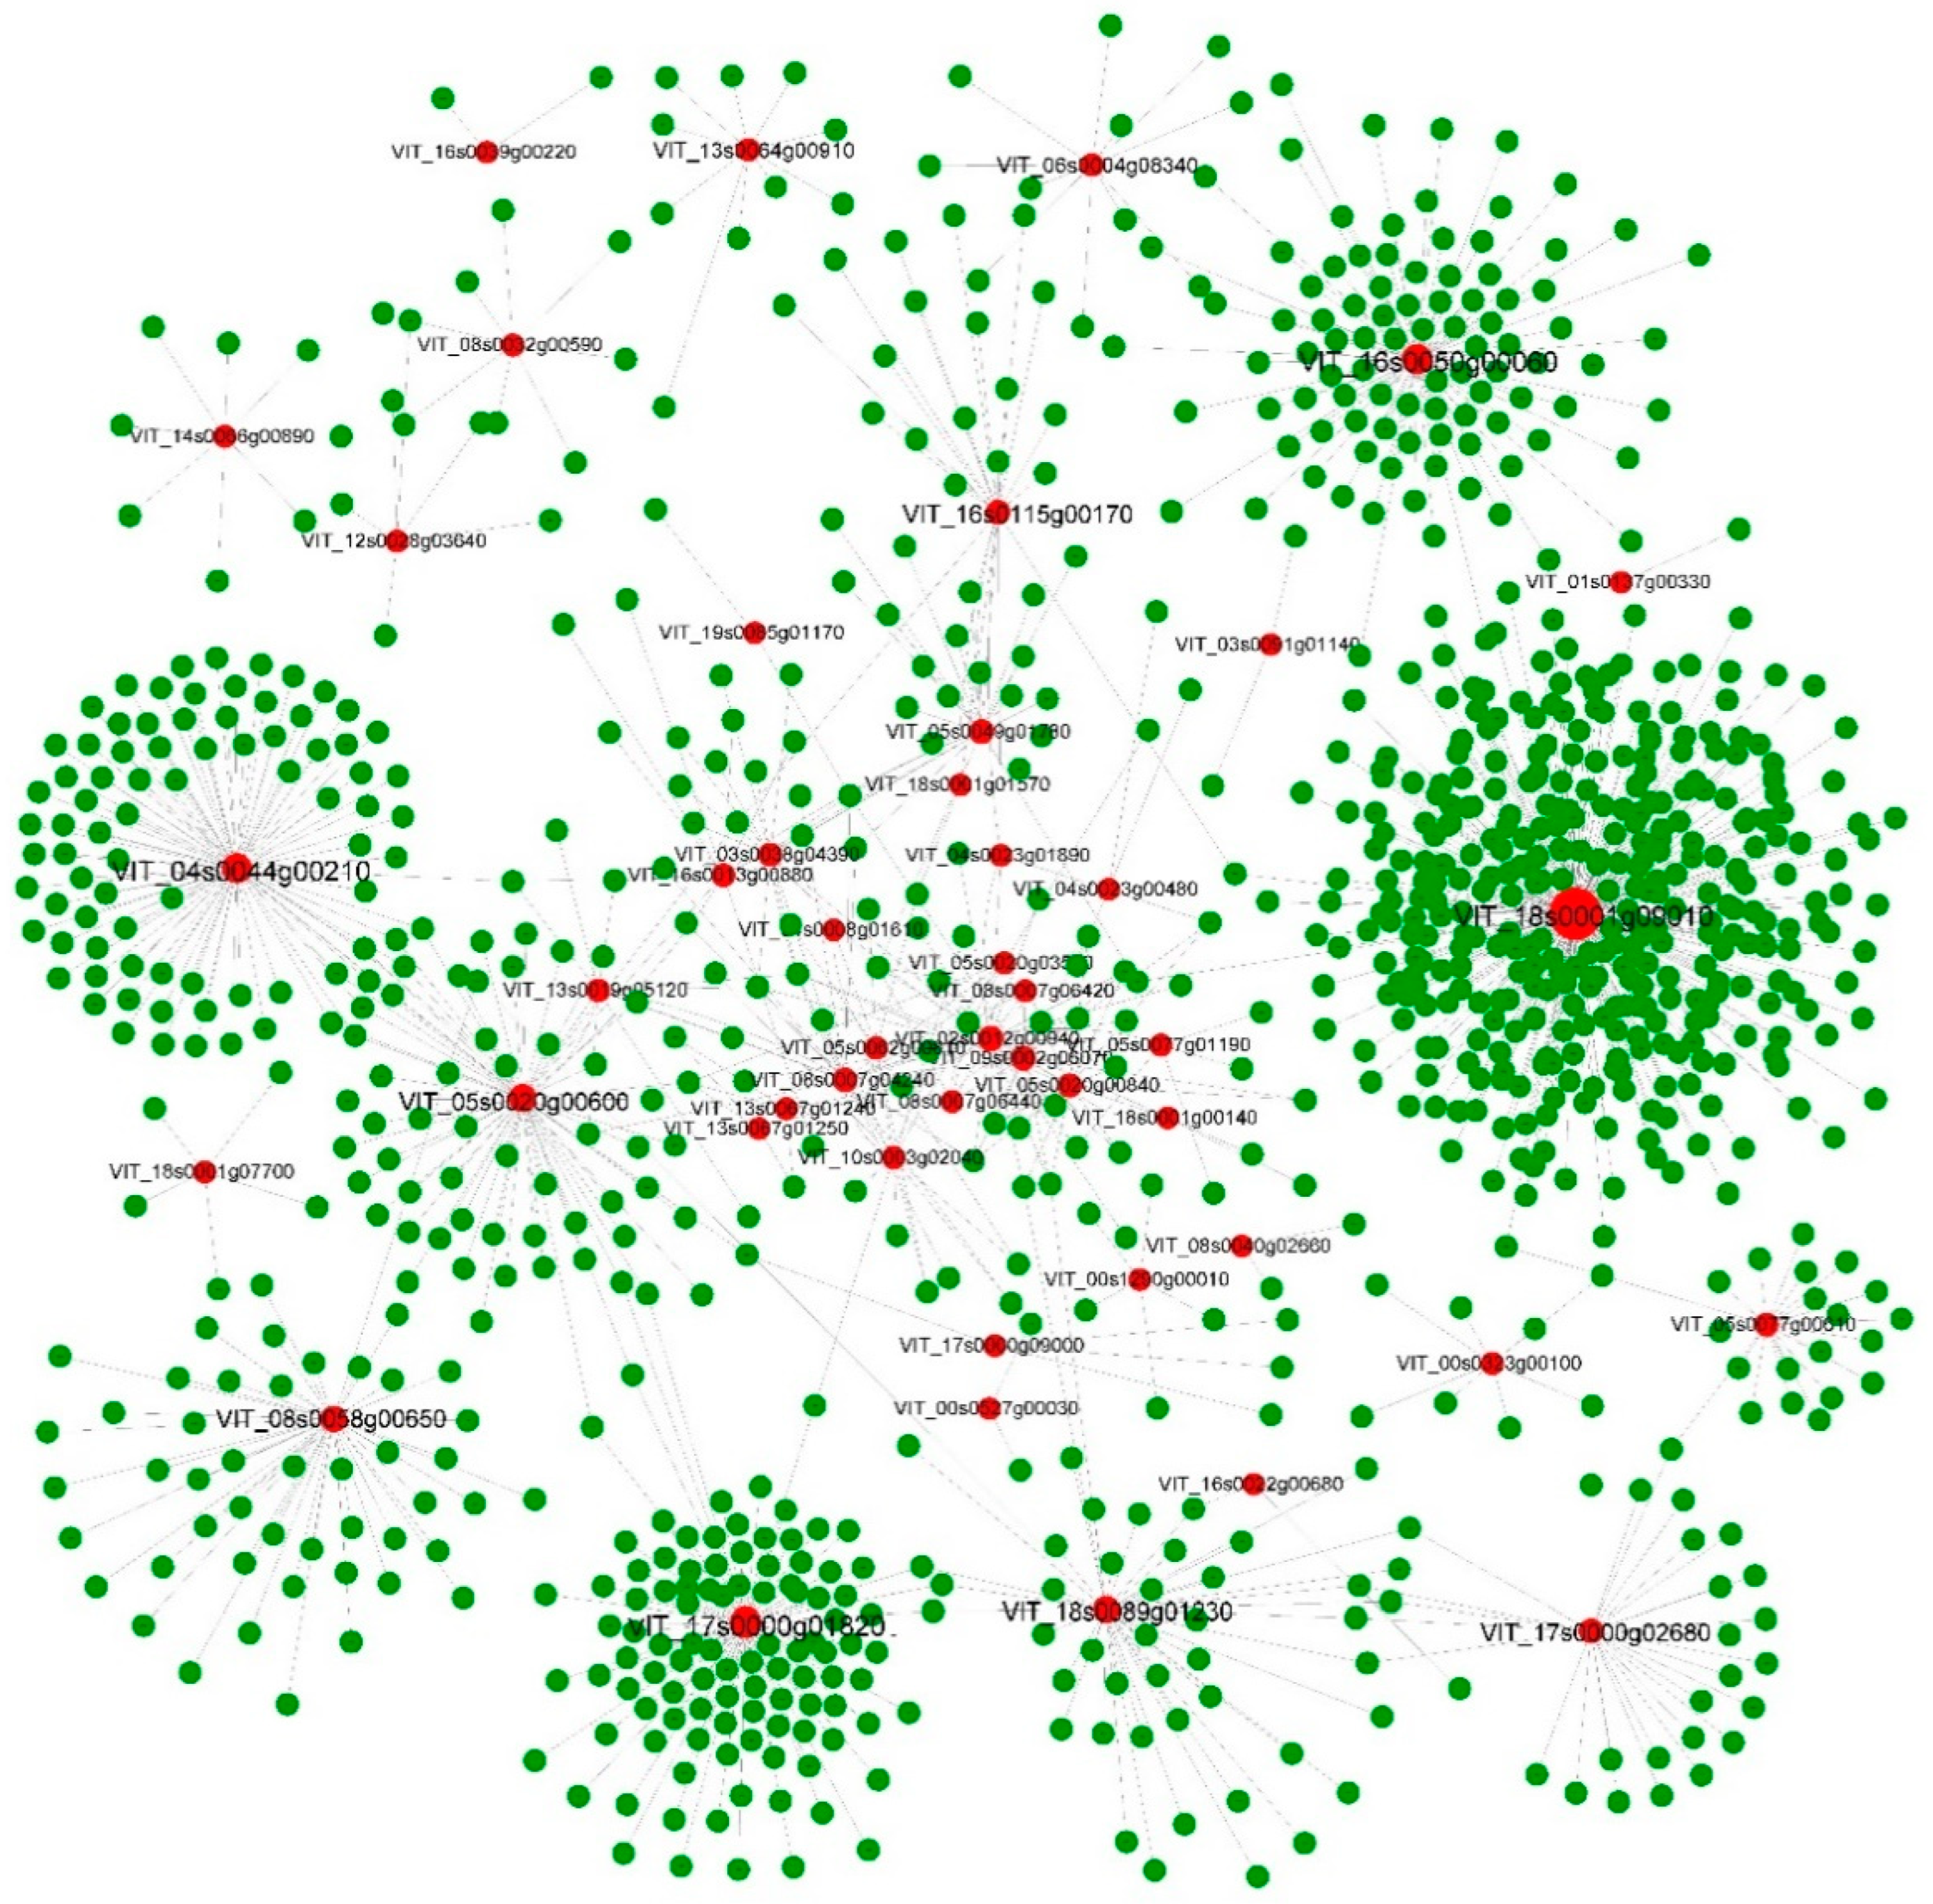
3.4. Characteristics and Core Networks of the DNB Genes
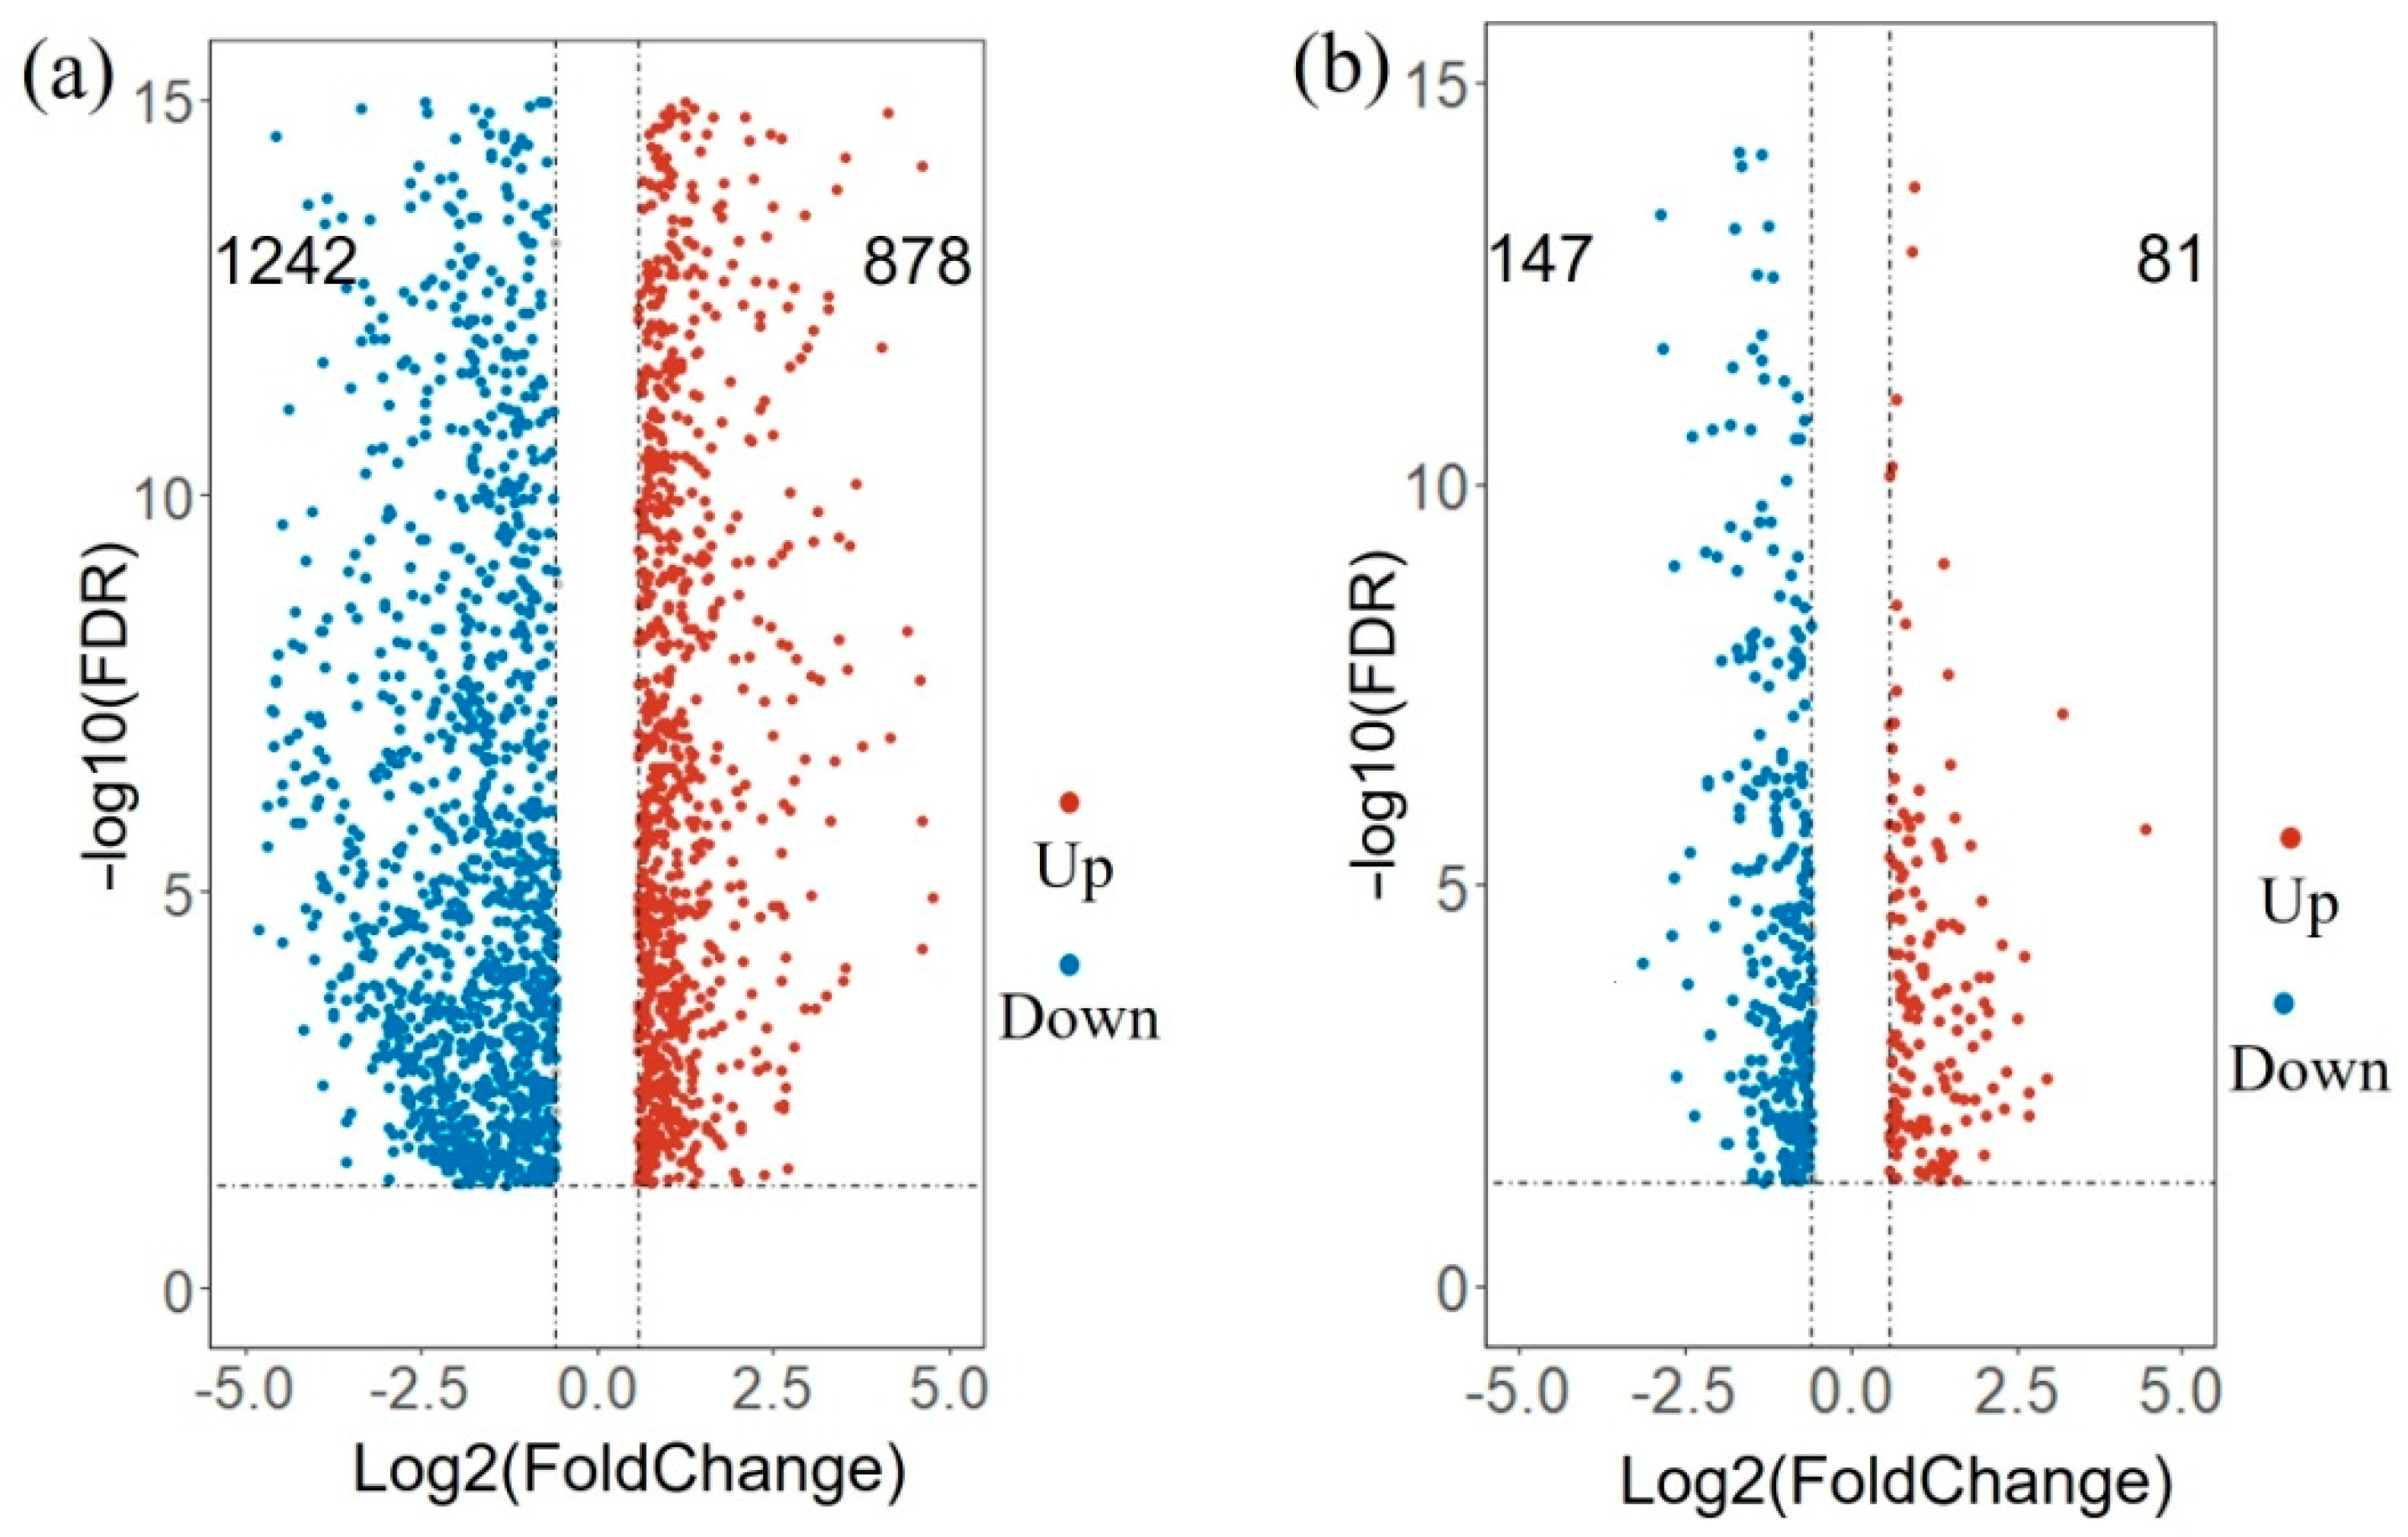
3.5. Differentially Expressed Genes between Maturity and Pre-Rip State
4. Discussion
5. Conclusions
Supplementary Materials
Author Contributions
Funding
Institutional Review Board Statement
Informed Consent Statement
Data Availability Statement
Acknowledgments
Conflicts of Interest
Abbreviations
| ABA | Abscisic acid |
| BR | Brassinosteroid |
| DNB | Dynamic network biomarker |
| DEG | Differentially expressed gene |
| FC | Fold change |
| FDR | False discovery rate |
| RPKM | Reads Per Kilobase per Million mapped reads |
| GO | Gene ontology |
| PCC | Pearson correlation coefficient |
| PPI | Protein–protein interaction |
| PSI | Phase transition scoring index |
| SD | Standard deviation |
| WGCNA | Weighted correlation network analysis |
References
- Coombe, B.G.; Hale, C.R. The hormone content of ripening grape berries and the effects of growth substance treatments. Plant Physiol. 1973, 51, 629–634. [Google Scholar] [CrossRef] [PubMed] [Green Version]
- Foster, J.D. Grape, raisin, and lily ingestion. In Textbook of Small Animal Emergency Medicine; John Wiley & Sons: Hoboken, NJ, USA, 2018; pp. 862–865. [Google Scholar]
- Berhe, D.T.; Belew, D. Evaluation of wild, wine, table, and raisin grapevine (Vitis spp.) genotypes in Gedeo Zone, Southern Ethiopia. Sci. World J. 2022, 2022, 6852704. [Google Scholar] [CrossRef] [PubMed]
- Kuhn, N.; Guan, L.; Dai, Z.W.; Wu, B.-H.; Lauvergeat, V.; Gomès, E.; Li, S.-H.; Godoy, F.; Arce-Johnson, P.; Delrot, S. Berry ripening: Recently heard through the grapevine. J. Exp. Bot. 2013, 65, 4543–4559. [Google Scholar] [CrossRef] [PubMed] [Green Version]
- Coombe, B.G. Research on development and ripening of the grape berry. Am. J. Enol. Vitic. 1992, 43, 120–127. [Google Scholar]
- Zhang, A.; Zhou, H.; Jiang, X.; Han, Y.; Zhang, X. The draft genome of a flat peach (Prunus persica L. cv.‘124 Pan’) provides insights into its good fruit flavor traits. Plants 2021, 10, 538. [Google Scholar] [CrossRef]
- Deluc, L.G.; Grimplet, J.; Wheatley, M.D.; Tillett, R.L.; Quilici, D.R.; Osborne, C.; Schooley, D.A.; Schlauch, K.A.; Cushman, J.C.; Cramer, G.R. Transcriptomic and metabolite analyses of Cabernet Sauvignon grape berry development. BMC Genom. 2007, 8, 429. [Google Scholar] [CrossRef] [Green Version]
- COOMBE, B.G.; McCARTHY, M. Dynamics of grape berry growth and physiology of ripening. Aust. J. Grape Wine Res. 2000, 6, 131–135. [Google Scholar] [CrossRef]
- Fasoli, M.; Richter, C.L.; Zenoni, S.; Bertini, E.; Vitulo, N.; Dal Santo, S.; Dokoozlian, N.; Pezzotti, M.; Tornielli, G.B. Timing and order of the molecular events marking the onset of berry ripening in grapevine. Plant Physiol. 2018, 178, 1187–1206. [Google Scholar] [CrossRef] [Green Version]
- D’Incà, E.; Cazzaniga, S.; Foresti, C.; Vitulo, N.; Bertini, E.; Galli, M.; Gallavotti, A.; Pezzotti, M.; Tornielli, G.B.; Zenoni, S. VviNAC33 promotes organ de-greening and represses vegetative growth during the vegetative-to-mature phase transition in grapevine. New Phytol. 2021, 231, 726. [Google Scholar] [CrossRef]
- Zhang, A.; Xiong, Y.; Fang, J.; Jiang, X.; Wang, T.; Liu, K.; Peng, H.; Zhang, X. Diversity and Functional Evolution of Terpene Synthases in Rosaceae. Plants 2022, 11, 736. [Google Scholar] [CrossRef]
- Cherian, S.; Figueroa, C.R.; Nair, H. ‘Movers and shakers’ in the regulation of fruit ripening: A cross-dissection of climacteric versus non-climacteric fruit. J. Exp. Bot. 2014, 65, 4705–4722. [Google Scholar] [CrossRef] [PubMed]
- Chen, Y.; Grimplet, J.; David, K.; Castellarin, S.D.; Terol, J.; Wong, D.C.J.; Luo, Z.; Schaffer, R.; Celton, J.M.; Talon, M.; et al. Ethylene receptors and related proteins in climacteric and non-climacteric fruits. Plant Sci. 2018, 276, 63–72. [Google Scholar] [CrossRef] [PubMed] [Green Version]
- Jia, H.F.; Lu, D.; Sun, J.H.; Li, C.L.; Xing, Y.; Qin, L.; Shen, Y.Y. Type 2C protein phosphatase ABI1 is a negative regulator of strawberry fruit ripening. J. Exp. Bot. 2013, 64, 1677–1687. [Google Scholar] [CrossRef] [PubMed] [Green Version]
- Pilati, S.; Bagagli, G.; Sonego, P.; Moretto, M.; Brazzale, D.; Castorina, G.; Simoni, L.; Tonelli, C.; Guella, G.; Engelen, K.; et al. Abscisic acid is a major regulator of grape berry ripening onset: New insights into ABA signaling network. Front. Plant Sci. 2017, 8, 1093. [Google Scholar] [CrossRef] [Green Version]
- Symons, G.M.; Davies, C.; Shavrukov, Y.; Dry, I.B.; Reid, J.B.; Thomas, M.R. Grapes on steroids. Brassinosteroids are involved in grape berry ripening. Plant Physiol. 2006, 140, 150–158. [Google Scholar] [CrossRef] [PubMed] [Green Version]
- Böttcher, C.; Burbidge, C.A.; Boss, P.K.; Davies, C. Interactions between ethylene and auxin are crucial to the control of grape (Vitis vinifera L.) berry ripening. BMC Plant Biol. 2013, 13, 222. [Google Scholar] [CrossRef] [Green Version]
- Kapoor, L.; Simkin, A.J.; George Priya Doss, C.; Siva, R. Fruit ripening: Dynamics and integrated analysis of carotenoids and anthocyanins. BMC Plant Biol. 2022, 22, 27. [Google Scholar] [CrossRef]
- Chen, T.; Qin, G.; Tian, S. Regulatory network of fruit ripening: Current understanding and future challenges. New Phytol. 2020, 228, 1219–1226. [Google Scholar] [CrossRef]
- García-Gómez, M.L.; Castillo-Jiménez, A.; Martínez-García, J.C.; Álvarez-Buylla, E.R. Multi-level gene regulatory network models to understand complex mechanisms underlying plant development. Curr. Opin. Plant Biol. 2020, 57, 171–179. [Google Scholar] [CrossRef]
- Deng, Z.; Zhang, J.; Li, J.; Zhang, X. Application of Deep Learning in Plant–Microbiota Association Analysis. Frontiers in Genetics 2021, 12. [Google Scholar] [CrossRef]
- Kuang, J.F.; Wu, C.J.; Guo, Y.F.; Walther, D.; Shan, W.; Chen, J.Y.; Chen, L.; Lu, W.J. Deciphering transcriptional regulators of banana fruit ripening by regulatory network analysis. Plant Biotechnol. J. 2021, 19, 477–489. [Google Scholar] [CrossRef] [PubMed]
- Shinozaki, Y.; Nicolas, P.; Fernandez-Pozo, N.; Ma, Q.; Evanich, D.J.; Shi, Y.; Xu, Y.; Zheng, Y.; Snyder, S.I.; Martin, L.B. High-resolution spatiotemporal transcriptome mapping of tomato fruit development and ripening. Nat. Commun. 2018, 9, 364. [Google Scholar] [CrossRef] [PubMed] [Green Version]
- Zhang, X.; Zhao, X.-M.; He, K.; Lu, L.; Cao, Y.; Liu, J.; Hao, J.-K.; Liu, Z.-P.; Chen, L. Inferring gene regulatory networks from gene expression data by path consistency algorithm based on conditional mutual information. Bioinformatics 2012, 28, 98–104. [Google Scholar] [CrossRef] [PubMed]
- Zhang, X.J.; Liu, K.Q.; Liu, Z.P.; Duval, B.; Richer, J.M.; Zhao, X.M.; Hao, J.K.; Chen, L.N. NARROMI: A noise and redundancy reduction technique improves accuracy of gene regulatory network inference. Bioinformatics 2013, 29, 106–113. [Google Scholar] [CrossRef] [PubMed] [Green Version]
- Zhang, X.; Zhao, J.; Hao, J.-K.; Zhao, X.-M.; Chen, L. Conditional mutual inclusive information enables accurate quantification of associations in gene regulatory networks. Nucleic Acids Res. 2015, 43, e31. [Google Scholar] [CrossRef] [Green Version]
- Zhao, J.; Zhou, Y.; Zhang, X.; Chen, L. Part mutual information for quantifying direct associations in networks. Proc. Natl. Acad. Sci. 2016, 113, 5130–5135. [Google Scholar] [CrossRef] [Green Version]
- Jiang, X.; Zhang, X. RSNET: Inferring gene regulatory networks by a redundancy silencing and network enhancement technique. BMC Bioinform. 2022, 23, 165. [Google Scholar] [CrossRef]
- Langfelder, P.; Horvath, S. WGCNA: An R package for weighted correlation network analysis. BMC Bioinform. 2008, 9, 559. [Google Scholar] [CrossRef] [Green Version]
- Li, M.; Zeng, T.; Liu, R.; Chen, L. Detecting tissue-specific early warning signals for complex diseases based on dynamical network biomarkers: Study of type 2 diabetes by cross-tissue analysis. Brief. Bioinform. 2013, 15, 229–243. [Google Scholar] [CrossRef] [Green Version]
- Liu, R.; Wang, J.; Ukai, M.; Sewon, K.; Chen, P.; Suzuki, Y.; Wang, H.; Aihara, K.; Okada-Hatakeyama, M.; Chen, L. Hunt for the tipping point during endocrine resistance process in breast cancer by dynamic network biomarkers. J. Mol. Cell Biol. 2019, 11, 649–664. [Google Scholar] [CrossRef] [Green Version]
- Wang, T.; Zhang, X. Genome-wide dynamic network analysis reveals the potential genes for MeJA-induced growth-to-defense transition. BMC Plant Biol. 2021, 21, 450. [Google Scholar] [CrossRef] [PubMed]
- Zhang, F.; Liu, X.; Zhang, A.; Jiang, Z.; Chen, L.; Zhang, X. Genome-wide dynamic network analysis reveals a critical transition state of flower development in Arabidopsis. BMC Plant Biol. 2019, 19, 11. [Google Scholar] [CrossRef] [PubMed] [Green Version]
- He, S.; Wang, H.; Hao, X.; Wu, Y.; Bian, X.; Yin, M.; Zhang, Y.; Fan, W.; Dai, H.; Yuan, L. Dynamic network biomarker analysis discovers IbNAC083 in the initiation and regulation of sweet potato root tuberization. Plant J. 2021, 108, 793–813. [Google Scholar] [CrossRef] [PubMed]
- Yang, B.; Li, M.; Tang, W.; Liu, W.; Zhang, S.; Chen, L.; Xia, J. Dynamic network biomarker indicates pulmonary metastasis at the tipping point of hepatocellular carcinoma. Nat. Commun. 2018, 9, 678. [Google Scholar] [CrossRef] [PubMed] [Green Version]
- Pertea, M.; Kim, D.; Pertea, G.M.; Leek, J.T.; Salzberg, S.L. Transcript-level expression analysis of RNA-seq experiments with HISAT, StringTie and Ballgown. Nat. Protoc. 2016, 11, 1650–1667. [Google Scholar] [CrossRef] [PubMed]
- Leng, N.; Dawson, J.A.; Thomson, J.A.; Ruotti, V.; Rissman, A.I.; Smits BM, G.; Haag, J.D.; Gould, M.N.; Stewart, R.M.; Kendziorski, C. EBSeq: An empirical Bayes hierarchical model for inference in RNA-seq experiments. Bioinformatics 2013, 29, 1035–1043. [Google Scholar] [CrossRef] [PubMed] [Green Version]
- Mi, H.; Muruganujan, A.; Ebert, D.; Huang, X.; Thomas, P.D. PANTHER version 14: More genomes, a new PANTHER GO-slim and improvements in enrichment analysis tools. Nucleic Acids Res. 2019, 47, D419–D426. [Google Scholar] [CrossRef]
- Szklarczyk, D.; Gable, A.L.; Lyon, D.; Junge, A.; Wyder, S.; Huerta-Cepas, J.; Simonovic, M.; Doncheva, N.T.; Morris, J.H.; Bork, P.; et al. STRING v11: Protein-protein association networks with increased coverage, supporting functional discovery in genome-wide experimental datasets. Nucleic Acids Res. 2019, 47, D607–D613. [Google Scholar] [CrossRef] [Green Version]
- Shannon, P.; Markiel, A.; Ozier, O.; Baliga, N.S.; Wang, J.T.; Ramage, D.; Amin, N.; Schwikowski, B.; Ideker, T. Cytoscape: A software environment for integrated models of biomolecular interaction networks. Genome Res. 2003, 13, 2498–2504. [Google Scholar] [CrossRef]
- Bolmgren, K.; Eriksson, O. Seed mass and the evolution of fleshy fruits in angiosperms. Oikos 2010, 119, 707–718. [Google Scholar] [CrossRef]
- Eriksson, O. Evolution of angiosperm seed disperser mutualisms: The timing of origins and their consequences for coevolutionary interactions between angiosperms and frugivores. Biol. Rev. 2016, 91, 168–186. [Google Scholar] [CrossRef] [PubMed]
- Brumos, J. Gene regulation in climacteric fruit ripening. Curr. Opin. Plant Biol. 2021, 63, 102042. [Google Scholar] [CrossRef] [PubMed]
- Forlani, S.; Mizzotti, C.; Masiero, S. The NAC side of the fruit: Tuning of fruit development and maturation. BMC Plant Biol. 2021, 21, 238. [Google Scholar] [CrossRef] [PubMed]
- He, L.; Ren, Z.Y.; Wang, Y.; Fu, Y.Q.; Li, Y.; Meng, N.; Pan, Q.H. Variation of growth-to-ripening time interval induced by abscisic acid and synthetic auxin affecting transcriptome and flavor compounds in Cabernet Sauvignon grape berry. Plants 2020, 9, 630. [Google Scholar] [CrossRef] [PubMed]
- Töpfer, R.; Hausmann, L.; Harst, M.; Maul, E.; Zyprian, E.; Eibach, R. New horizons for grapevine breeding. Fruit Veg. Cereal Sci. Biotechnol. 2011, 5, 79–100. [Google Scholar]
- Falchi, R.; Wong, D.C.; Yan, Y.; Savoi, S.; Gambetta, G.A.; Castellarin, S.D. The genomics of grape berry ripening. The Grape Genome 2019, 247–274. [Google Scholar]
- Dai, Z.W.; Léon, C.; Feil, R.; Lunn, J.E.; Delrot, S.; Gomès, E. Metabolic profiling reveals coordinated switches in primary carbohydrate metabolism in grape berry (Vitis vinifera L.), a non-climacteric fleshy fruit. J. Exp. Bot. 2013, 64, 1345–1355. [Google Scholar] [CrossRef]
- Centeno, D.C.; Osorio, S.; Nunes-Nesi, A.; Bertolo, A.L.; Carneiro, R.T.; Araújo, W.L.; Steinhauser, M.C.; Michalska, J.; Rohrmann, J.; Geigenberger, P.; et al. Malate plays a crucial role in starch metabolism, ripening, and soluble solid content of tomato fruit and affects postharvest softening. Plant Cell 2011, 23, 162–184. [Google Scholar] [CrossRef] [Green Version]
- Gouthu, S.; Deluc, L.G. Timing of ripening initiation in grape berries and its relationship to seed content and pericarp auxin levels. BMC Plant Biol. 2015, 15, 46. [Google Scholar] [CrossRef] [Green Version]
- Ristic, R.; Iland, P.G. Relationships between seed and berry development of Vitis Vinifera L. cv Shiraz: Developmental changes in seed morphology and phenolic composition. Aust. J. Grape Wine Res. 2005, 11, 43–58. [Google Scholar] [CrossRef]
- Vondras, A.M.; Gouthu, S.; Schmidt, J.A.; Petersen, A.R.; Deluc, L.G. The contribution of flowering time and seed content to uneven ripening initiation among fruits within Vitis vinifera L. cv. Pinot noir clusters. Planta 2016, 243, 1191–1202. [Google Scholar] [CrossRef] [PubMed]
- He, H.; Yamamuro, C. Interplays between auxin and GA signaling coordinate early fruit development. Horticulture Research 2022, 9, uhab078. [Google Scholar] [CrossRef] [PubMed]
- Cosme, F.; Gonçalves, B.; Inês, A.; Jordão, A.M.; Vilela, A. Grape and wine metabolites: Biotechnological approaches to improve wine quality. Grape Wine Biotechnol. 2016, 187–214. [Google Scholar]
- Li, Z.; Jiang, G.; Liu, X.; Ding, X.; Zhang, D.; Wang, X.; Zhou, Y.; Yan, H.; Li, T.; Wu, K.; et al. Histone demethylase SlJMJ6 promotes fruit ripening by removing H3K27 methylation of ripening-related genes in tomato. New Phytol. 2020, 227, 1138–1156. [Google Scholar] [CrossRef] [PubMed]
- Ding, X.; Liu, X.; Jiang, G.; Li, Z.; Song, Y.; Zhang, D.; Jiang, Y.; Duan, X. SlJMJ7 orchestrates tomato fruit ripening via crosstalk between H3K4me3 and DML2-mediated DNA demethylation. New Phytol. 2021, 1202–1219. [Google Scholar] [CrossRef]


Publisher’s Note: MDPI stays neutral with regard to jurisdictional claims in published maps and institutional affiliations. |
© 2022 by the authors. Licensee MDPI, Basel, Switzerland. This article is an open access article distributed under the terms and conditions of the Creative Commons Attribution (CC BY) license (https://creativecommons.org/licenses/by/4.0/).
Share and Cite
Wang, T.; Peng, H.; Cao, Y.; Xu, J.; Xiong, Y.; Liu, K.; Fang, J.; Liu, F.; Zhang, A.; Zhang, X. Dynamic Network Biomarker Analysis Reveals the Critical Phase Transition of Fruit Ripening in Grapevine. Genes 2022, 13, 1851. https://doi.org/10.3390/genes13101851
Wang T, Peng H, Cao Y, Xu J, Xiong Y, Liu K, Fang J, Liu F, Zhang A, Zhang X. Dynamic Network Biomarker Analysis Reveals the Critical Phase Transition of Fruit Ripening in Grapevine. Genes. 2022; 13(10):1851. https://doi.org/10.3390/genes13101851
Chicago/Turabian StyleWang, Tengfei, Huixiang Peng, Yingying Cao, Jing Xu, Yuhong Xiong, Kangchen Liu, Jing Fang, Fang Liu, Aidi Zhang, and Xiujun Zhang. 2022. "Dynamic Network Biomarker Analysis Reveals the Critical Phase Transition of Fruit Ripening in Grapevine" Genes 13, no. 10: 1851. https://doi.org/10.3390/genes13101851