
Somatic Reversion of a Novel IL2RG Mutation Resulting in Atypical X-Linked Combined Immunodeficiency

 , ,
, ,
Abstract
:1. Introduction
2. Materials and Methods
2.1. Patient Recruitment
2.2. Samples
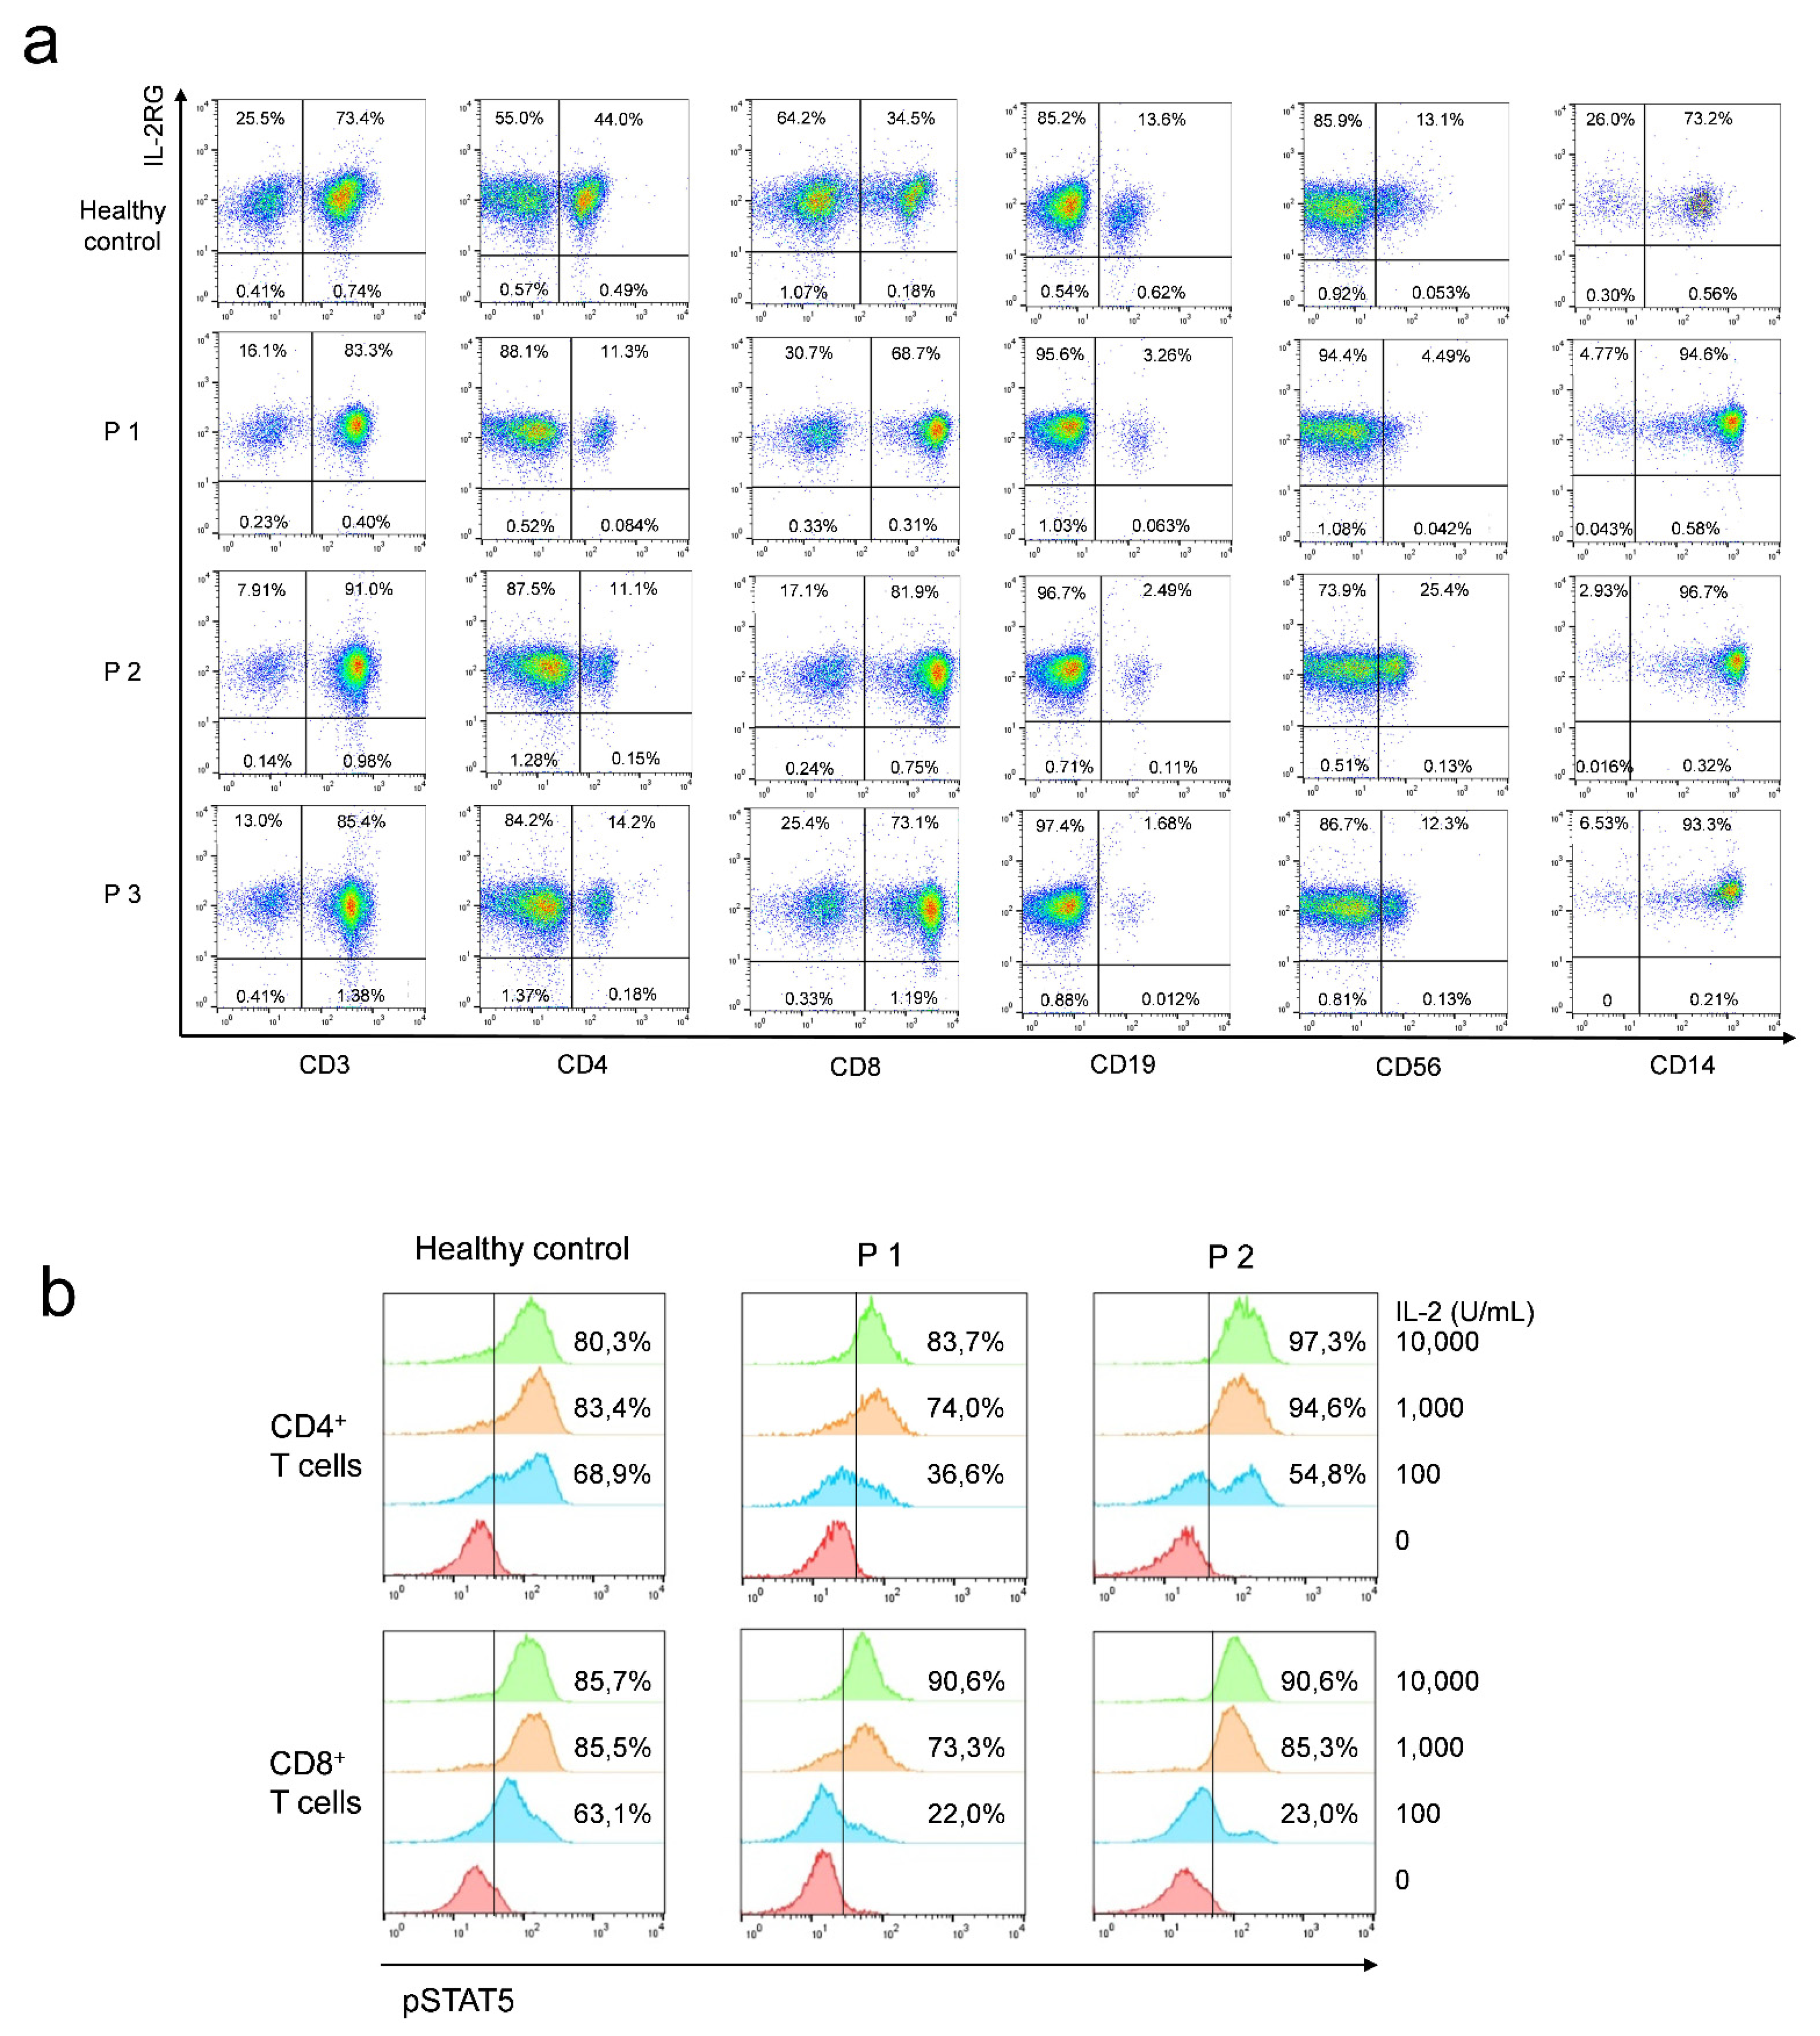
2.3. Lymphocyte Percentage and IL-2RG Expression
2.4. Intracellular pSTAT5 Staining
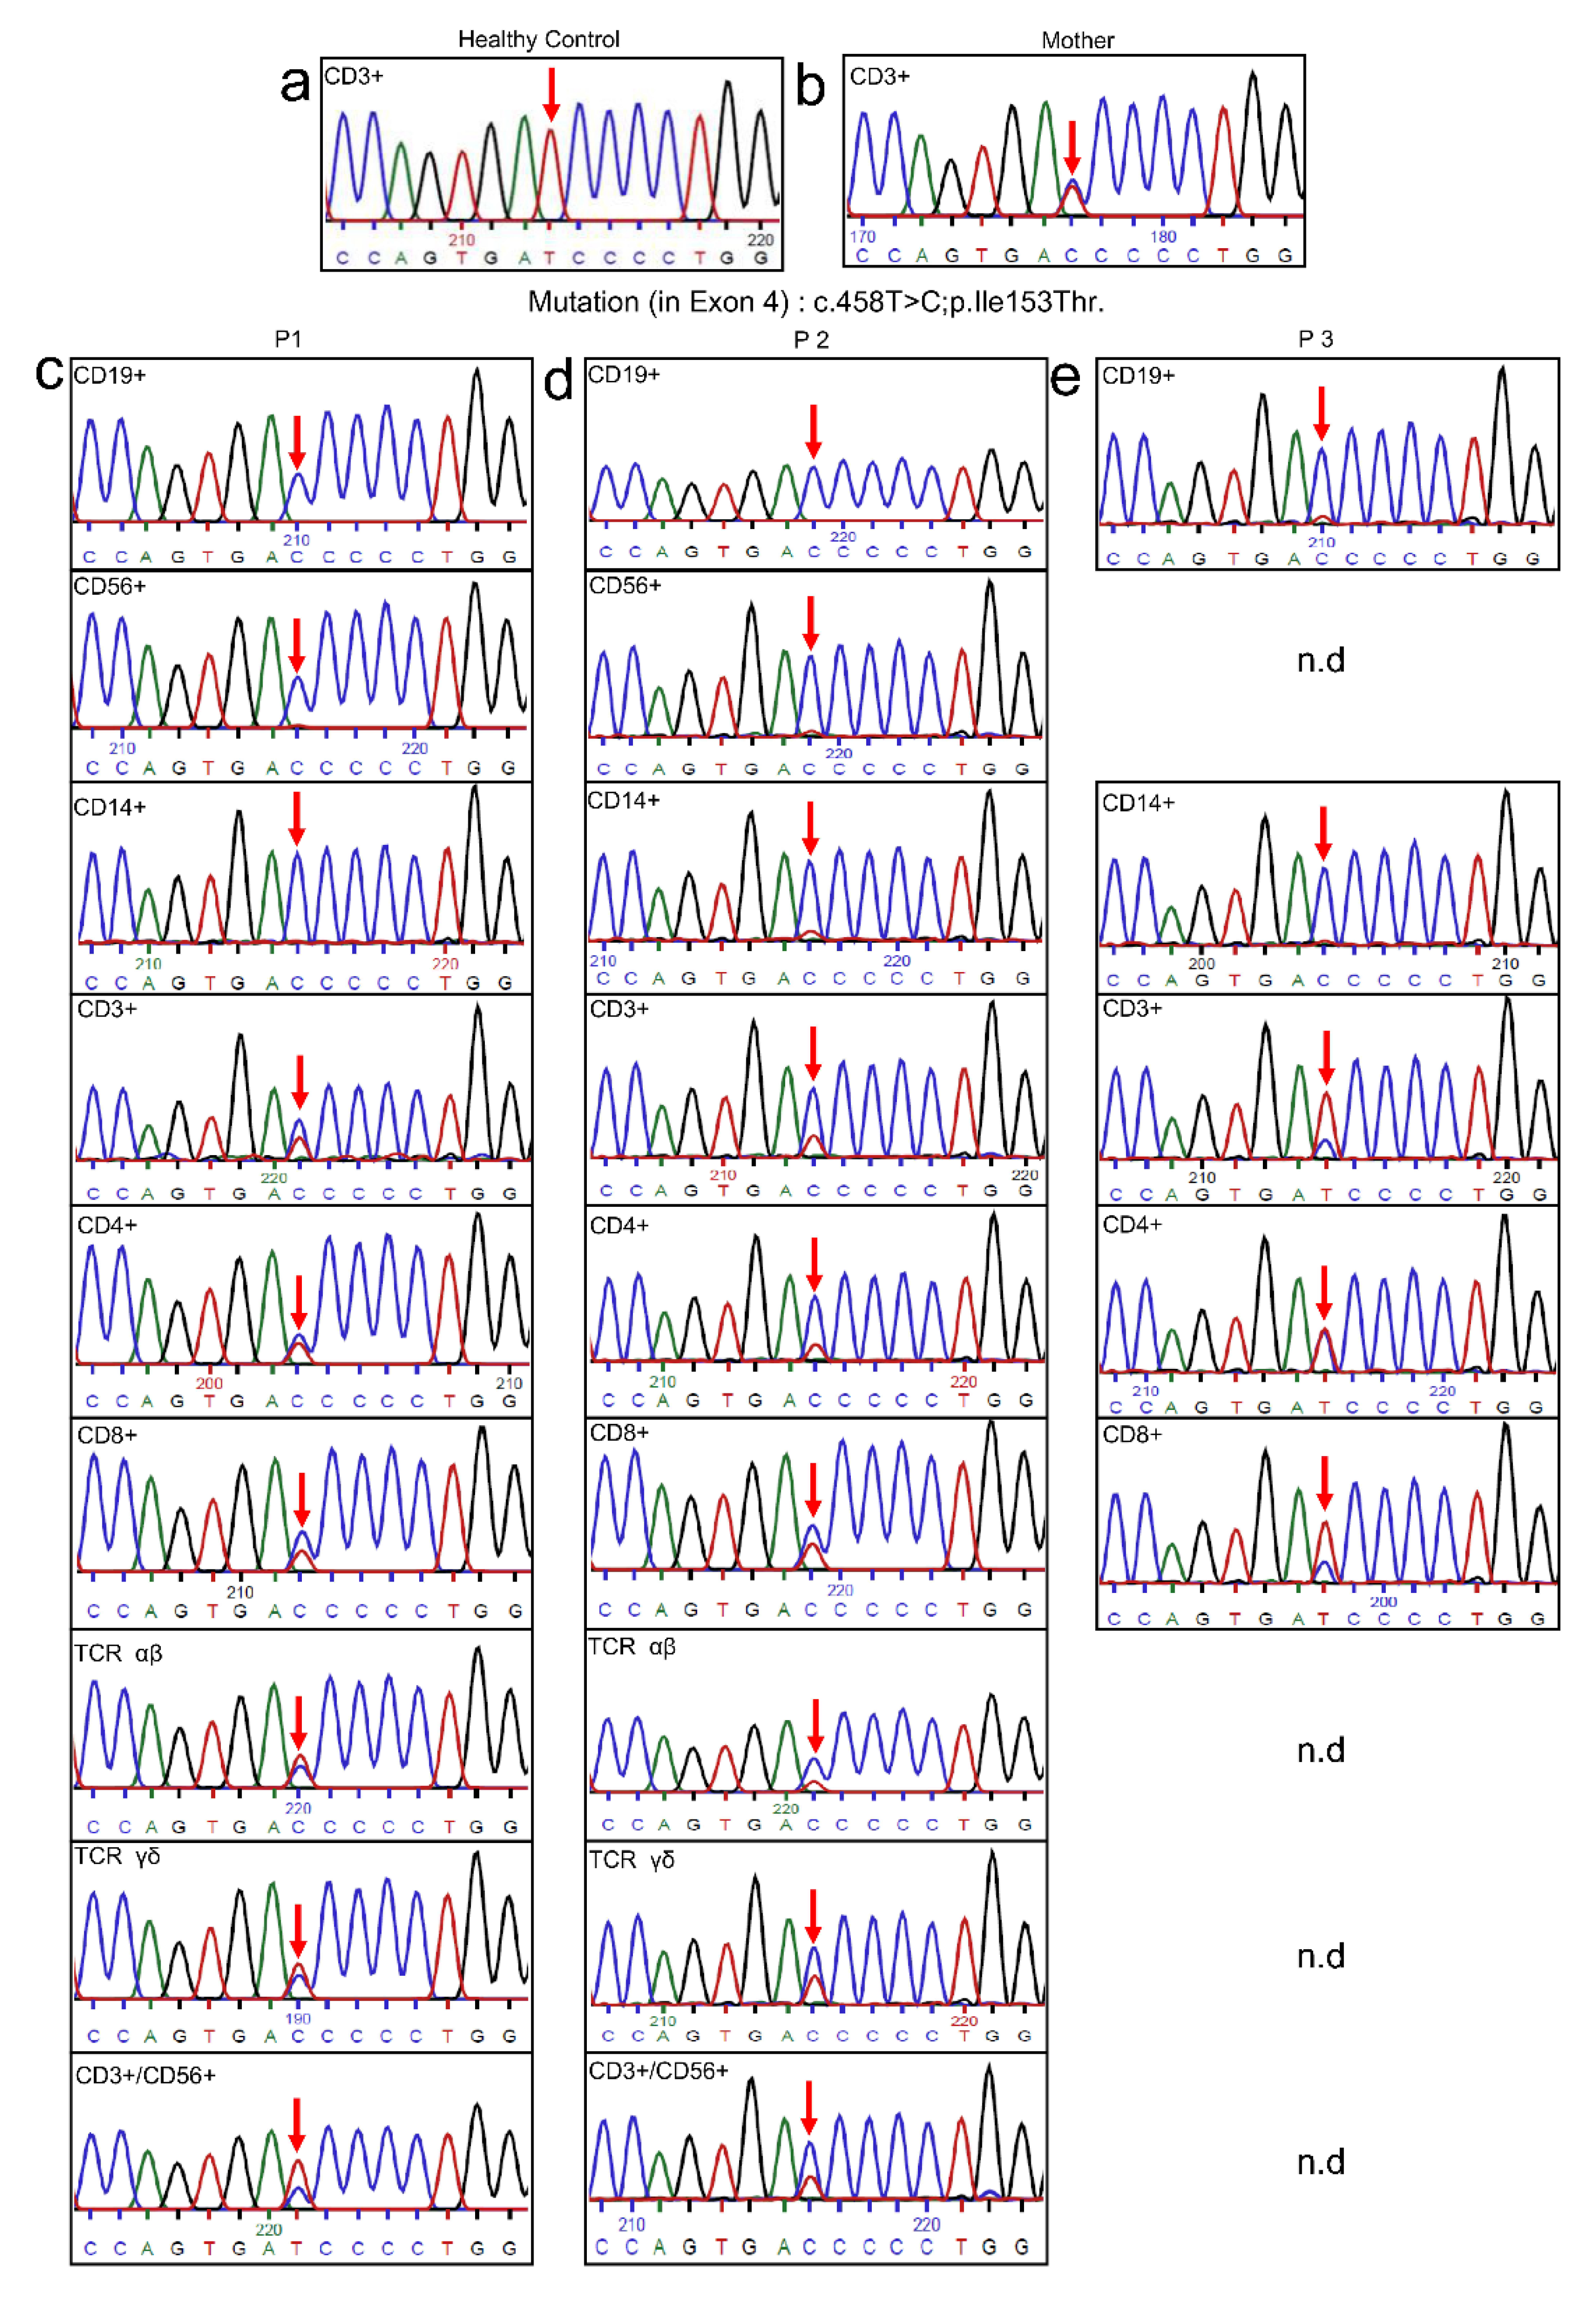
2.5. Genetic Analysis
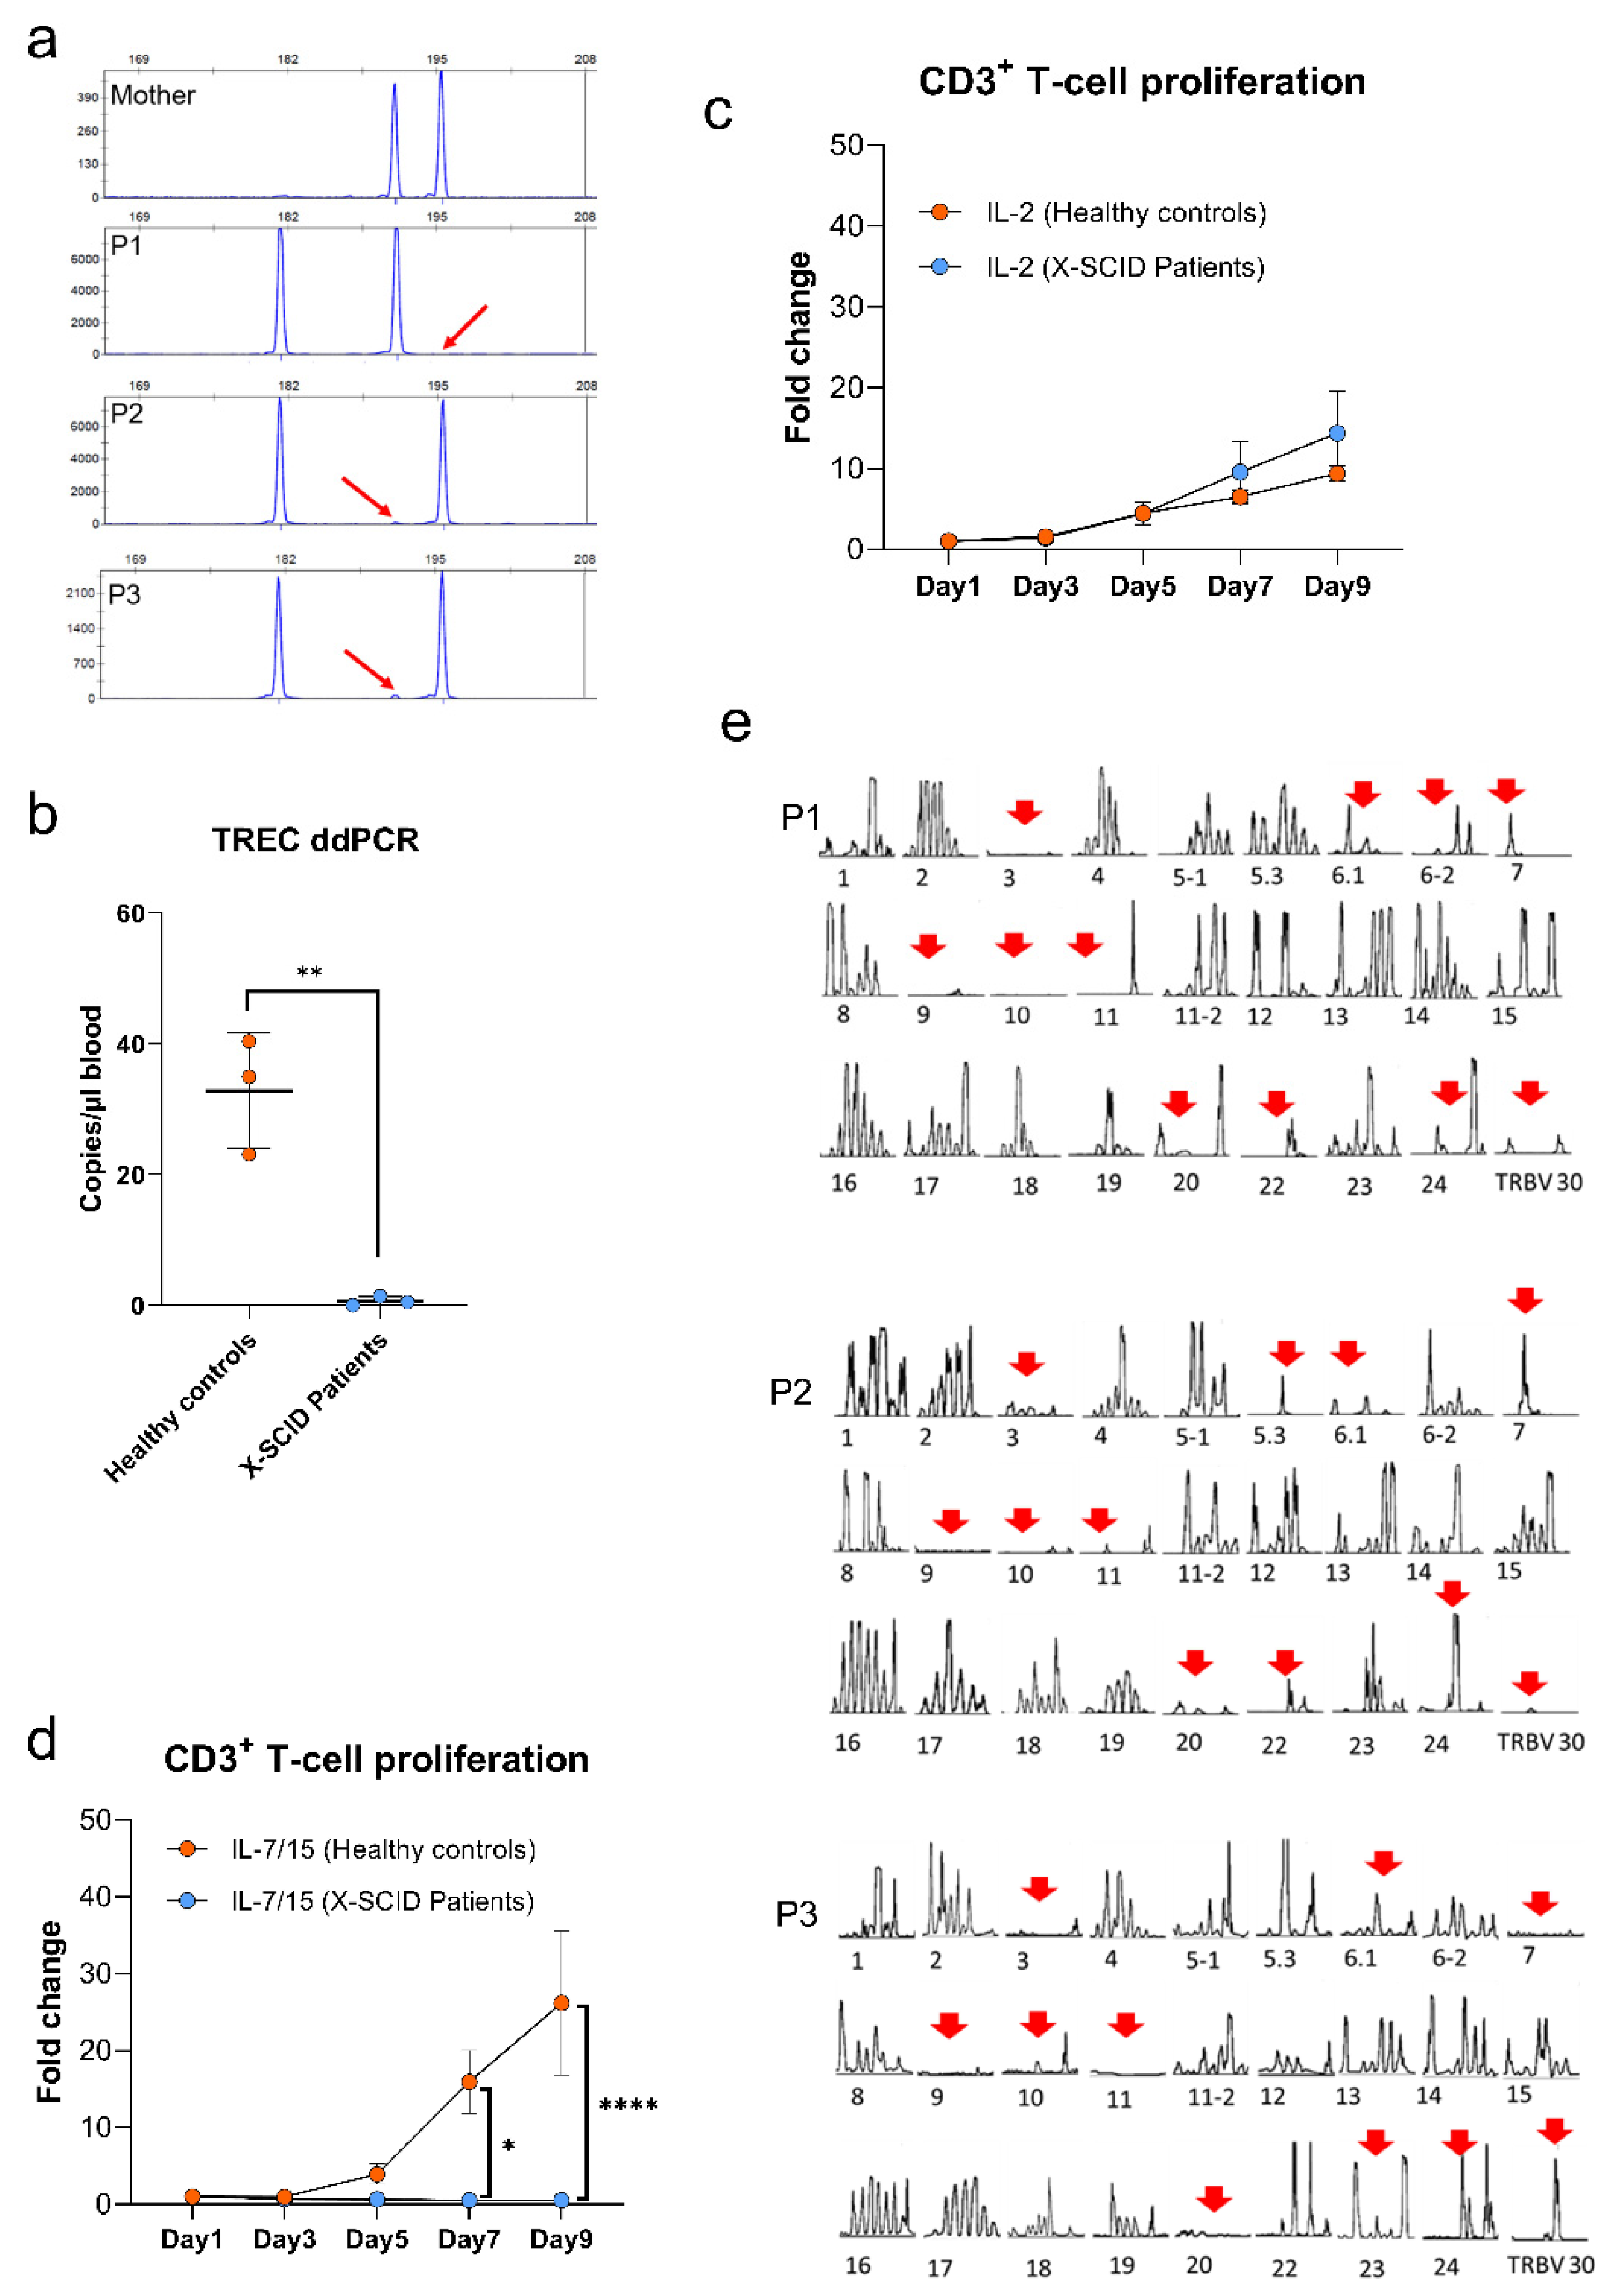
2.6. Maternal Engraftment
2.7. TREC Quantification
2.8. T-Cell Receptor Repertoire Analysis and CDR3 Spectra-Typing
2.9. T-Cell Proliferation
2.10. Statistical Analysis
3. Results
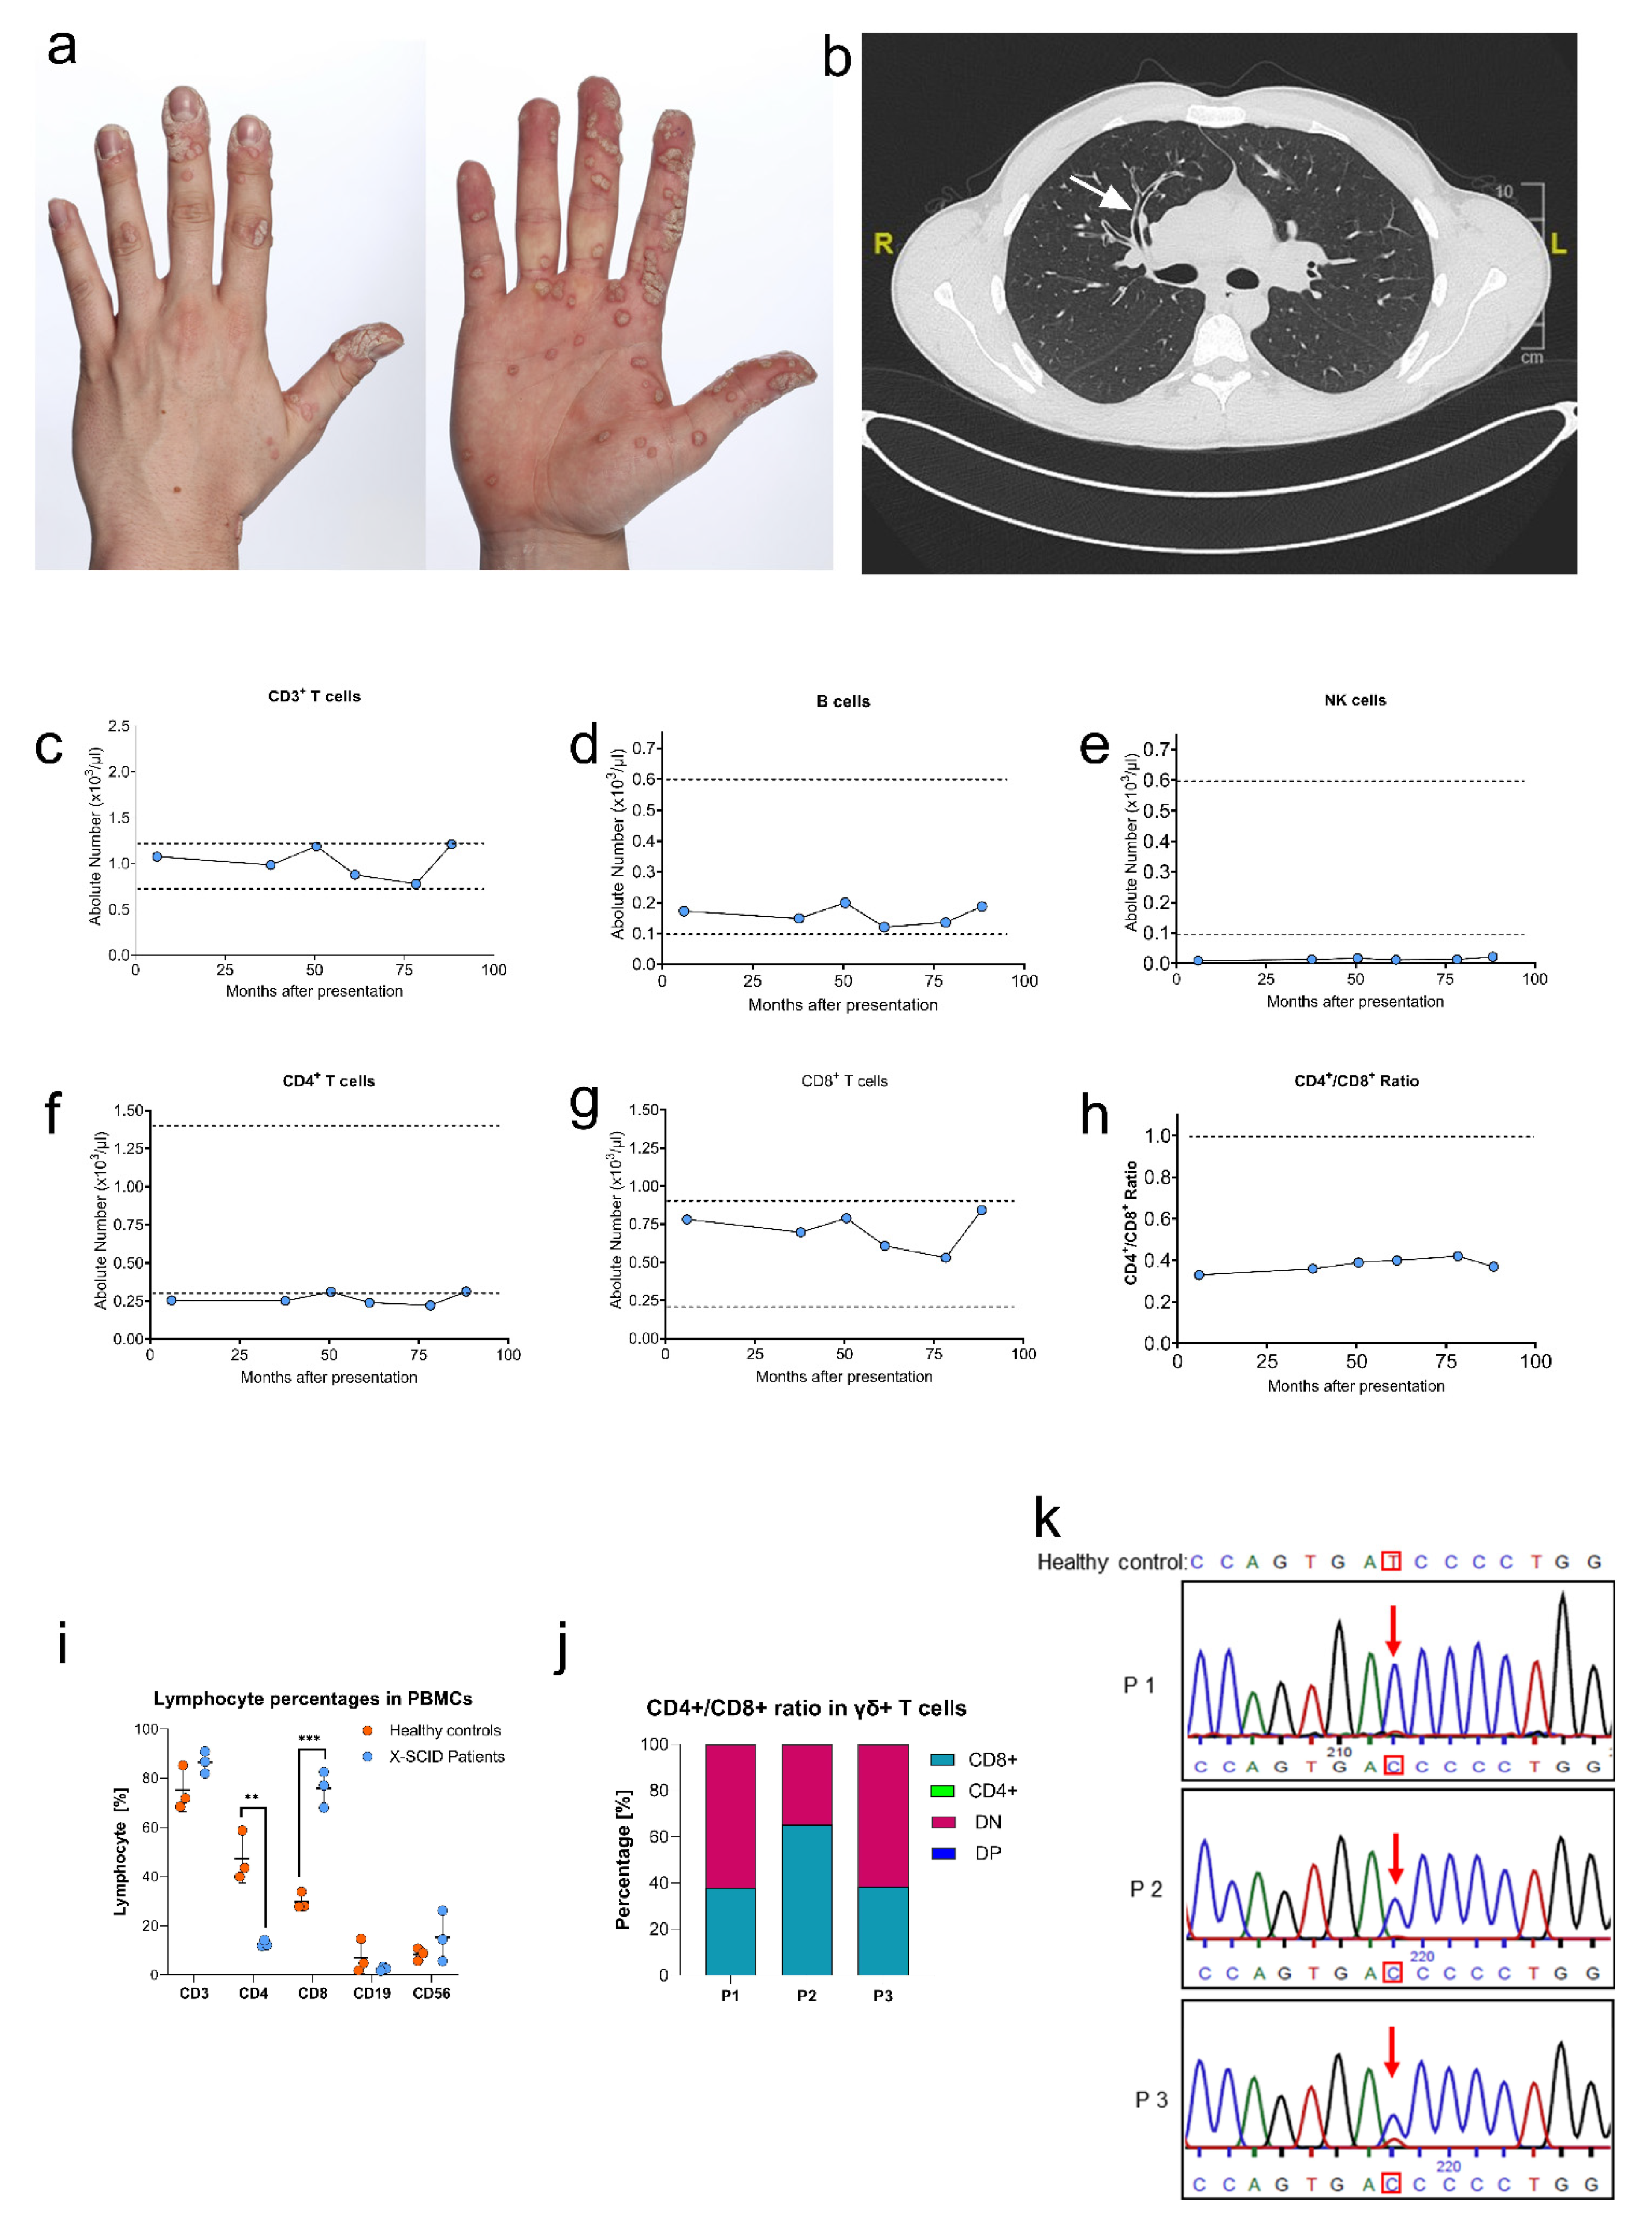
3.1. Case Report
3.2. Clinical and Immunological Phenotype
3.3. Genetic Analysis
3.4. Functional Analysis
3.5. Sequencing of Multiple Subpopulations
3.6. Quantification of T Cell Receptor Excision Circles and T Cell Proliferation
3.7. TCR Vβ Repertoire Analysis
4. Discussion
4.1. p.Ile153Thr Results in Hypomorphic Mutation for IL-2RG Signaling
4.2. p.Ile153Thr vs. p.Ile153Asn Cases Can Explain Different Outcomes of X-SCID
- Dissimilar impact in the protein structure: In order to further understand the differences between both mutations at the molecular level, we studied position 153 in the interaction with IL-2 (Figure S2). It is found in the extracellular domain of the receptor, more concretely in the cytokine binding surface [27]. The wild-type isoleucine at this position is part of a β-sheet motif. As a hydrophobic amino acid, its side chain is not very reactive but could be involved in ligand recognition [28]. The substitution for asparagine could have a severe consequence because of its polar nature, which could disrupt the β-sheet motif. This is not the case in the substitution for threonine since this slightly polar amino acid presents two non-hydrogen substituents attached to the beta carbon (similarly to isoleucine) which restricts the adoptable conformations from the main chain and could maintain the β-sheet conformation. Thus, we hypothesized that Ile153Thr mutation has a lower impact on the tertiary structure of IL2RG and would support a more benign outcome. It was also considered that Ile153Asn could be responsible for additional, aberrant modifications in the receptor, such as N-linked glycosylations, but the existence of proline in position 154 hampers the formation of a suitable N-glycosylation motif and makes this event very unlikely [29].
- The possible absence of natural reversion in p.Ile153Asn: The genetic analysis performed to identify this mutation was based on the abolishment of one SauIIIA restriction site in the mutant sample [2]. In the hypothetical presence of natural reverted cells, the restriction digestion would be possible and visible in the gel, which was not reported in the publication. This would suggest an absence of natural reverted cells, however, a genetic analysis using the genomic DNA from blood cells or PBMCs would hide a potential reversion in the lymphocyte population. A more detailed analysis of different subpopulations including T cells, B cells and NK cells would be needed to fully address this possibility.
4.3. Natural Reversion from P1, P2 and P3 Is Originated in Early Progenitor T-Cells
4.4. Defect in IL-2RG Signaling Is Responsible for Inverted CD4+/CD8+ Ratio and Low Amounts of Naïve T Cells Compared to Memory T Cells
4.5. Vβ Families and TCR Repertoire Are Skewed and Shared in P1, P2 and P3

| P1 (%) | Reference (%) [35,36,37]. | ||
|---|---|---|---|
| CD3+ | 85.10 | + | 55.00–83.00 |
| CD4+ | 21.90 | - | 28.0–57.00 |
| CD8+ | 59.10 | +++ | 10.00–39.00 |
| TCRαβ+ | 96.20 | 88.00–98.00 | |
| TCRγδ+ | 3.70 | 1.00–12.00 | |
| CD3+CD4+CD45RA+ | 10.00 | -- | 21.00–58.00 |
| CD3+CD4+CD45RO+ | 85.90 | ++ | 35.00–73.00 |
| CD3+CD8+CD45RA+ | 4.92 | --- | 23.00–73.00 |
| CD3+CD8+CD45RA− | 22.87 | 13.00–43.00 | |
| CD3+CD8+CD28-CD27− | 53.90 | ++ | 1.60–36.00 |
| CD19+ | 13.20 | 6.00–19.00 | |
| CD16+CD56+ | 22 | --- | 90–600 |
4.6. Final Conclusions
Supplementary Materials
Author Contributions
Funding
Institutional Review Board Statement
Informed Consent Statement
Data Availability Statement
Acknowledgments
Conflicts of Interest
References
- Puck, J.M.; Deschênes, S.M.; Porter, J.C.; Dutra, A.S.; Brown, C.J.; Willard, H.F.; Henthorn, P.S. The interleukin-2 receptor gamma chain maps to Xq13.1 and is mutated in X-linked severe combined immunodeficiency, SCIDX1. Hum. Mol. Genet. 1993, 2, 1099–1104. [Google Scholar] [CrossRef] [PubMed]
- Puck, J.M.; Pepper, A.E.; Henthorn, P.S.; Candotti, F.; Isakov, J.; Whitwam, T.; Conley, M.E.; Fischer, R.E.; Rosenblatt, H.M.; Small, T.N.; et al. Mutation analysis of IL2RG in human X-linked severe combined immunodeficiency. Blood 1997, 89, 1968–1977. [Google Scholar] [PubMed]
- Miyazaki, T.; Kawahara, A.; Fujii, H.; Nakagawa, Y.; Minami, Y.; Liu, Z.J.; Oishi, I.; Silvennoinen, O.; Witthuhn, B.A.; Ihle, J.N. Functional activation of Jak1 and Jak3 by selective association with IL-2 receptor subunits. Science 1994, 266, 1045–1047. [Google Scholar] [CrossRef] [PubMed]
- Russell, S.M.; Johnston, J.A.; Noguchi, M.; Kawamura, M.; Bacon, C.M.; Friedmann, M.; Berg, M.; McVicar, D.W.; Witthuhn, B.A.; Silvennoinen, O. Interaction of IL-2R beta and gamma c chains with Jak1 and Jak3: Implications for XSCID and XCID. Science 1994, 266, 1042–1045. [Google Scholar] [CrossRef] [Green Version]
- Noguchi, M.; Yi, H.; Rosenblatt, H.M.; Filipovich, A.H.; Adelstein, S.; Modi, W.S.; McBride, O.W.; Leonard, W.J. Interleukin-2 receptor gamma chain mutation results in X-linked severe combined immunodeficiency in humans. Cell 1993, 73, 147–157. [Google Scholar] [CrossRef]
- Lim, C.K.; Abolhassani, H.; Appelberg, S.K.; Sundin, M.; Hammarström, L. hypomorphic mutation: Identification of a novel pathogenic mutation in exon 8 and a review of the literature. Allergy Asthma Clin. Immunol. 2019, 15, 2. [Google Scholar] [CrossRef] [PubMed] [Green Version]
- Fuchs, S.; Rensing-Ehl, A.; Erlacher, M.; Vraetz, T.; Hartjes, L.; Janda, A.; Rizzi, M.; Lorenz, M.R.; Gilmour, K.; de Saint-Basile, G.; et al. Patients with T⁺/low NK⁺ IL-2 receptor γ chain deficiency have differentially-impaired cytokine signaling resulting in severe combined immunodeficiency. Eur. J. Immunol. 2014, 44, 3129–3140. [Google Scholar] [CrossRef]
- Mou, W.; He, J.; Chen, X.; Zhang, H.; Ren, X.; Wu, X.; Ni, X.; Xu, B.; Gui, J. A novel deletion mutation in IL2RG gene results in X-linked severe combined immunodeficiency with an atypical phenotype. Immunogenetics 2017, 69, 29–38. [Google Scholar] [CrossRef]
- de Villartay, J.-P.; Lim, A.; Al-Mousa, H.; Dupont, S.; Déchanet-Merville, J.; Coumau-Gatbois, E.; Gougeon, M.-L.; Lemainque, A.; Eidenschenk, C.; Jouanguy, E.; et al. A novel immunodeficiency associated with hypomorphic RAG1 mutations and CMV infection. J. Clin. Investig. 2005, 115, 3291–3299. [Google Scholar] [CrossRef] [Green Version]
- Kawai, T.; Saito, M.; Nishikomori, R.; Yasumi, T.; Izawa, K.; Murakami, T.; Okamoto, S.; Mori, Y.; Nakagawa, N.; Imai, K.; et al. Multiple reversions of an IL2RG mutation restore T cell function in an X-linked severe combined immunodeficiency patient. J. Clin. Immunol. 2012, 32, 690–697. [Google Scholar] [CrossRef]
- Pyeritz, R.E.; Korf, B.R.; Grody, W.W. Emery and Rimoin’s Principles and Practice of Medical Genetics and Genomics: Foundations; Academic Press: Cambridge, MA, USA, 2018. [Google Scholar]
- Jonkman, M.F.; Scheffer, H.; Stulp, R.; Pas, H.H.; Nijenhuis, M.; Heeres, K.; Owaribe, K.; Pulkkinen, L.; Uitto, J. Revertant mosaicism in epidermolysis bullosa caused by mitotic gene conversion. Cell 1997, 88, 543–551. [Google Scholar] [CrossRef] [Green Version]
- Jonkman, M.F.; Pasmooij, A.M.G. Revertant mosaicism—Patchwork in the skin. N. Engl. J. Med. 2009, 360, 1680–1682. [Google Scholar] [CrossRef] [PubMed]
- Hirschhorn, R. In vivo reversion to normal of inherited mutations in humans. J. Med. Genet. 2003, 40, 721–728. [Google Scholar] [CrossRef] [PubMed] [Green Version]
- Hsu, A.P.; Pittaluga, S.; Martinez, B.; Rump, A.P.; Raffeld, M.; Uzel, G.; Puck, J.M.; Freeman, A.F.; Holland, S.M. IL2RG reversion event in a common lymphoid progenitor leads to delayed diagnosis and milder phenotype. J. Clin. Immunol. 2015, 35, 449–453. [Google Scholar] [CrossRef] [PubMed]
- Kuijpers, T.W.; van Leeuwen, E.M.M.; Barendregt, B.H.; Klarenbeek, P.; aan de Kerk, D.J.; Baars, P.A.; Jansen, M.H.; de Vries, N.; van Lier, R.A.W.; van der Burg, M. A reversion of an IL2RG mutation in combined immunodeficiency providing competitive advantage to the majority of CD8+ T cells. Haematologica 2013, 98, 1030–1038. [Google Scholar] [CrossRef] [Green Version]
- Kury, P.; Führer, M.; Fuchs, S.; Lorenz, M.R.; Giorgetti, O.B.; Bakhtiar, S.; Frei, A.P.; Fisch, P.; Boehm, T.; Schwarz, K.; et al. Long-term robustness of a T-cell system emerging from somatic rescue of a genetic block in T-cell development. EBioMedicine 2020, 59, 102961. [Google Scholar] [CrossRef]
- Okuno, Y.; Hoshino, A.; Muramatsu, H.; Kawashima, N.; Wang, X.; Yoshida, K.; Wada, T.; Gunji, M.; Toma, T.; Kato, T.; et al. Late-Onset Combined Immunodeficiency with a Novel IL2RG Mutation and Probable Revertant Somatic Mosaicism. J. Clin. Immunol. 2015, 35, 610–614. [Google Scholar] [CrossRef]
- Speckmann, C.; Pannicke, U.; Wiech, E.; Schwarz, K.; Fisch, P.; Friedrich, W.; Niehues, T.; Gilmour, K.; Buiting, K.; Schlesier, M.; et al. Clinical and immunologic consequences of a somatic reversion in a patient with X-linked severe combined immunodeficiency. Blood 2008, 112, 4090–4097. [Google Scholar] [CrossRef] [Green Version]
- Stephan, V.; Wahn, V.; Le Deist, F.; Dirksen, U.; Broker, B.; Müller-Fleckenstein, I.; Horneff, G.; Schroten, H.; Fischer, A.; de Saint Basile, G. Atypical X-linked severe combined immunodeficiency due to possible spontaneous reversion of the genetic defect in T cells. N. Engl. J. Med. 1996, 335, 1563–1567. [Google Scholar] [PubMed]
- Wada, T.; Yasui, M.; Toma, T.; Nakayama, Y.; Nishida, M.; Shimizu, M.; Okajima, M.; Kasahara, Y.; Koizumi, S.; Inoue, M.; et al. Detection of T lymphocytes with a second-site mutation in skin lesions of atypical X-linked severe combined immunodeficiency mimicking Omenn syndrome. Blood 2008, 112, 1872–1875. [Google Scholar] [CrossRef]
- Bousso, P.; Wahn, V.; Douagi, I.; Horneff, G.; Pannetier, C.; Le Deist, F.; Zepp, F.; Niehues, T.; Kourilsky, P.; Fischer, A.; et al. Diversity, functionality, and stability of the T cell repertoire derived in vivo from a single human T cell precursor. Proc. Natl. Acad. Sci. USA 2000, 97, 274–278. [Google Scholar] [CrossRef] [Green Version]
- Lin, C.H.; Kuehn, H.S.; Thauland, T.J.; Lee, C.M.; De Ravin, S.S.; Malech, H.L.; Keyes, T.J.; Jager, A.; Davis, K.L.; Garcia-Lloret, M.I.; et al. Progressive B Cell Loss in Revertant X-SCID. J. Clin. Immunol. 2020, 40, 1001–1009. [Google Scholar] [CrossRef] [PubMed]
- Hazenberg, M.D.; Verschuren, M.C.; Hamann, D.; Miedema, F.; van Dongen, J.J. T cell receptor excision circles as markers for recent thymic emigrants: Basic aspects, technical approach, and guidelines for interpretation. J. Mol. Med. 2001, 79, 631–640. [Google Scholar] [CrossRef] [PubMed] [Green Version]
- Profaizer, T.; Slev, P. A Multiplex, Droplet Digital PCR Assay for the Detection of T-Cell Receptor Excision Circles and Kappa-Deleting Recombination Excision Circles. Clin. Chem. 2020, 66, 229–238. [Google Scholar] [CrossRef]
- Sonntag, K.; Hashimoto, H.; Eyrich, M.; Menzel, M.; Schubach, M.; Döcker, D.; Battke, F.; Courage, C.; Lambertz, H.; Handgretinger, R.; et al. Immune monitoring and TCR sequencing of CD4 T cells in a long term responsive patient with metastasized pancreatic ductal carcinoma treated with individualized, neoepitope-derived multipeptide vaccines: A case report. J. Transl. Med. 2018, 16, 23. [Google Scholar] [CrossRef] [PubMed] [Green Version]
- Wang, X.; Rickert, M.; Garcia, K.C. Structure of the Quaternary Complex of Interleukin-2 with Its alpha, beta, and gammac receptors. Science 2005, 310, 1159–1163. [Google Scholar] [CrossRef] [PubMed]
- Betts, M.J.R.R.B. Amino acid properties and consequences of substitutions. In Bioinformatics for Geneticists; Barnes, M.R.G.I.C., Ed.; Wiley: Hoboken, NJ, USA, 2003. [Google Scholar]
- Opdenakker, G.; Rudd, P.M.; Ponting, C.P.; Dwek, R.A. Concepts and principles of glycobiology. FASEB J. 1993, 7, 1330–1337. [Google Scholar] [CrossRef]
- Sam-Yellowe, T.Y. T Cell Development and T Cell Receptor Structure. In Immunology: Overview and Laboratory Manual; Springer: Berlin/Heidelberg, Germany, 2021; pp. 105–116. [Google Scholar]
- Ku, C.C.; Murakami, M.; Sakamoto, A.; Kappler, J.; Marrack, P. Control of homeostasis of CD8+ memory T cells by opposing cytokines. Science 2000, 28, 675–678. [Google Scholar] [CrossRef] [PubMed]
- Harville, T.O.; Adams, D.M.; Howard, T.A.; Ware, R.E. Oligoclonal expansion of CD45RO+ T lymphocytes in Omenn syndrome. J. Clin. Immunol. 1997, 17, 322–332. [Google Scholar] [CrossRef]
- Lev, A.; Simon, A.J.; Amariglio, N.; Rechavi, G.; Somech, R. Selective clinical and immune response of the oligoclonal autoreactive T cells in Omenn patients after cyclosporin A treatment. Clin. Exp. Immunol. 2012, 167, 338–345. [Google Scholar] [CrossRef] [PubMed]
- Brooks, E.G.; Filipovich, A.H.; Padgett, J.W.; Mamlock, R.; Goldblum, R.M. T-cell receptor analysis in Omenn’s syndrome: Evidence for defects in gene rearrangement and assembly. Blood 1999, 93, 242–250. [Google Scholar] [CrossRef] [PubMed]
- Hulstaert, F.; Hannet, I.; Deneys, V.; Munhyeshuli, V.; Reichert, T.; De Bruyere, M.; Strauss, K. Age-related changes in human blood lymphocyte subpopulations. II. Varying kinetics of percentage and absolute count measurements. Clin. Immunol. Immunopathol. 1994, 70, 152–158. [Google Scholar] [CrossRef] [PubMed]
- Schatorjé, E.J.; Gemen, E.F.; Driessen, G.J.; Leuvenink, J.; van Hout, R.W.; van der Burg, M.; de Vries, E. Age-matched reference values for B-lymphocyte subpopulations and CVID classifications in children. Scand. J. Immunol. 2011, 74, 502–510. [Google Scholar] [CrossRef] [PubMed]
- Shearer, W.T.; Rosenblatt, H.M.; Gelman, R.S.; Oyomopito, R.; Plaeger, S.; Stiehm, E.R.; Wara, D.W.; Douglas, S.D.; Luzuriaga, K.; McFarland, E.J.; et al. Lymphocyte subsets in healthy children from birth through 18 years of age: The Pediatric AIDS Clinical Trials Group P1009 study. J. Allergy Clin. Immunol. 2003, 112, 973–980. [Google Scholar] [CrossRef] [PubMed]
- Sehnal, D.; Bittrich, S.; Deshpande, M.; Svobodová, R.; Berka, K.; Bazgier, V.; Velankar, S.; Burley, S.K.; Koča, J.; Rose, A.S. Mol* Viewer: Modern web app for 3D visualization and analysis of large biomolecular structures. Nucleic Acids Res. 2021, 49, W431–W437. [Google Scholar] [CrossRef] [PubMed]


| P1 | P2 | P3 | |
|---|---|---|---|
| Patient (age, ethnicity) | 26-year-old German male | 25-year-old German male | 23-year-old German male |
| Consanguinity | No | ||
| Medical history | Viral infections with molluscum contagiosum and cutaneous warts due to Human papilloma virus, chronic respiratory infections, two hospitalization due to severe pneumonia within 7 years, Pseudomonas aeruginosa | Viral infections with molluscum contagiosum and cutaneous warts due to Human papilloma virus, otitis, susceptible to viral and fungi infections with skin rash | Viral infections with molluscum contagiosum and cutaneous warts due to Human papilloma virus, chronic respiratory infections with recurrent sinusitis, hospitalization due to a severe episode of pneumonia |
| Family history | No family history suggestive of immunodeficiency, mother detected as conductor of X-chromosomal recessive mutation | ||
| Clinical phenotype (at diagnosis) | Bronchiectasis and generalized cutaneous warts | Asymptomatic | Bronchiectasis and right middle lobe atelectasis, local cutaneous warts |
| Viral examination | VZV IgG positive Positive EBV PCR Negative CMV PCR Positive HPV 2, 27, 57 PCR | n.a. | n.a. |
| Therapy | Local IL-2 injection Cryotherapy Laser therapy Keratolysis Imiquimod cream Retinoids INF-α IVIG substitution Antibiotic prophylaxis | - | Cryotherapy Laser therapy Keratolysis Imiquimod cream |
| P 1 | P 2 | P 3 | Normal Range | ||||||
|---|---|---|---|---|---|---|---|---|---|
| 08/2019 | 01/2020 | 05/2020 | 07/2020 | 01/2020 | 05/2020 | 05/2020 | 07/2020 | ||
| Leukocytes, absolute/µL | 5710 | 5790 | 6114 | 4610 | 5470 | 5200 | 4700 | 5300 | 3800–10,300 |
| Lymphocytes, absolute/µL | 1276 | 520↓ | 856↓ | 1011↓ | 1789 | 1456 | 1316 | 697↓ | 1100–3200 |
| CD3+, absolute/µL (%) | 866↓ (67.9) | n.a. | 608↓ (71) | 511↓ (50.5) | 1502 (84) | 1165 (80) | 987 (75) | 697↓ (47) | 900–4500 |
| CD4+, absolute/µL (%) | 146↓ (11.4) | n.a. | 146↓ (17) | 151↓ (14.9) | 272↓ (15.2) | 233↓ (16) | 197↓ (15) | 178↓ (12) | 500–2400 |
| CD8+, absolute/µL (%) | 685 (53.7) | n.a. | 411 (48) | 331 (32.7) | 1073 (60) | 815 (56) | 737 (56) | 430 (29) | 300–1600 |
| CD4+/CD8+ ratio | 0.21 | 0.35 | 0.46 | 0.25 | 0.29 | 0.27 | 0.41 | >1.0 | |
| CD19+, absolute/µL (%) | 87↓ (6.82) | n.a. | 103↓ (12) | 76↓ (7.5) | 179↓ (10) | 175↓ (12) | 132↓ (10) | 119↓ (8) | 200–2100 |
| CD56+, absolute/µL | 153 (12) | n.a. | 21↓ (2.5) | 23↓ (2.3) | 72↓ (4) | 22↓ (1.5) | 61↓ (4.6) | 163 (11) | 100–1000 |
| IgG, mg/dL | 1760↑ | 1920↑ | n.a. | 1680↑ | 1550 | 1349 | 1470 | n.a. | 700–1600 |
| IgG1, mg/dL | 1670↑ | 1800↑ | n.a. | n.a. | 1550↑ | n.a. | 1270↑ | n.a. | 405–1011 |
| IgG2, mg/dL | 79↓ | 181 | n.a. | n.a. | 147↓ | n.a. | 168↓ | n.a. | 169–786 |
| IgG3, mg/dL | 63.1 | 73.1 | n.a. | n.a. | 149↑ | n.a. | 55.3 | n.a. | 11–85 |
| IgG4, mg/dL | <0.3↓ | 10.9 | n.a. | n.a. | 0.6↓ | n.a. | 0.4↓ | n.a. | 3.0–201 |
| IgA, mg/dL | 240 | 269 | n.a. | n.a. | 230 | n.a. | n.a. | n.a. | 70–400 |
| IgM, mg/dL | 111 | 114 | n.a. | n.a. | 166 | n.a. | n.a. | n.a. | 40–230 |
| IgE, mg/dL | 16 | 19 | n.a. | n.a. | 9 | n.a. | n.a. | n.a. | 0–100 |
| P1 | P2 | P3 | |
|---|---|---|---|
| Thymic shadows | n.a. | ||
| Blood count | CD4+ and NK cell lymphopenia | Low CD4+ T cells | Low CD4+ T cells |
| Immunophenotype | TlowB+NKlow | ||
| γδT cells | Normal | ||
| Extended immunophenotype | Low CD4/CD8 ratio < 1.0 | ||
| Immunoglobulin levels | Dysgammaglobulinemia | ||
| Lymphocyte proliferation | Variable | ||
| TRECs | Reduced | ||
| TCR Vβ repertoire | Skewed | ||
| Genetic findings | IL2RG c.458T > C; p.Ile153Thr | ||
| IL-2RG expression | Normal | ||
| STAT-5 Phosphorylation | Partially defective (FC) | Partially defective (FC) | n.a. |
Publisher’s Note: MDPI stays neutral with regard to jurisdictional claims in published maps and institutional affiliations. |
© 2021 by the authors. Licensee MDPI, Basel, Switzerland. This article is an open access article distributed under the terms and conditions of the Creative Commons Attribution (CC BY) license (https://creativecommons.org/licenses/by/4.0/).
Share and Cite
Hou, Y.; Gratz, H.P.; Ureña-Bailén, G.; Gratz, P.G.; Schilbach-Stückle, K.; Renno, T.; Güngör, D.; Mader, D.A.; Malenke, E.; Antony, J.S.; et al. Somatic Reversion of a Novel IL2RG Mutation Resulting in Atypical X-Linked Combined Immunodeficiency. Genes 2022, 13, 35. https://doi.org/10.3390/genes13010035
Hou Y, Gratz HP, Ureña-Bailén G, Gratz PG, Schilbach-Stückle K, Renno T, Güngör D, Mader DA, Malenke E, Antony JS, et al. Somatic Reversion of a Novel IL2RG Mutation Resulting in Atypical X-Linked Combined Immunodeficiency. Genes. 2022; 13(1):35. https://doi.org/10.3390/genes13010035
Chicago/Turabian StyleHou, Yujuan, Hans Peter Gratz, Guillermo Ureña-Bailén, Paul G. Gratz, Karin Schilbach-Stückle, Tina Renno, Derya Güngör, Daniel A. Mader, Elke Malenke, Justin S. Antony, and et al. 2022. "Somatic Reversion of a Novel IL2RG Mutation Resulting in Atypical X-Linked Combined Immunodeficiency" Genes 13, no. 1: 35. https://doi.org/10.3390/genes13010035