Methods for Separation and Characterization of Extracellular Vesicles: Results of a Worldwide Survey Performed by the ISEV Rigor and Standardization Subcommittee

 , , , and
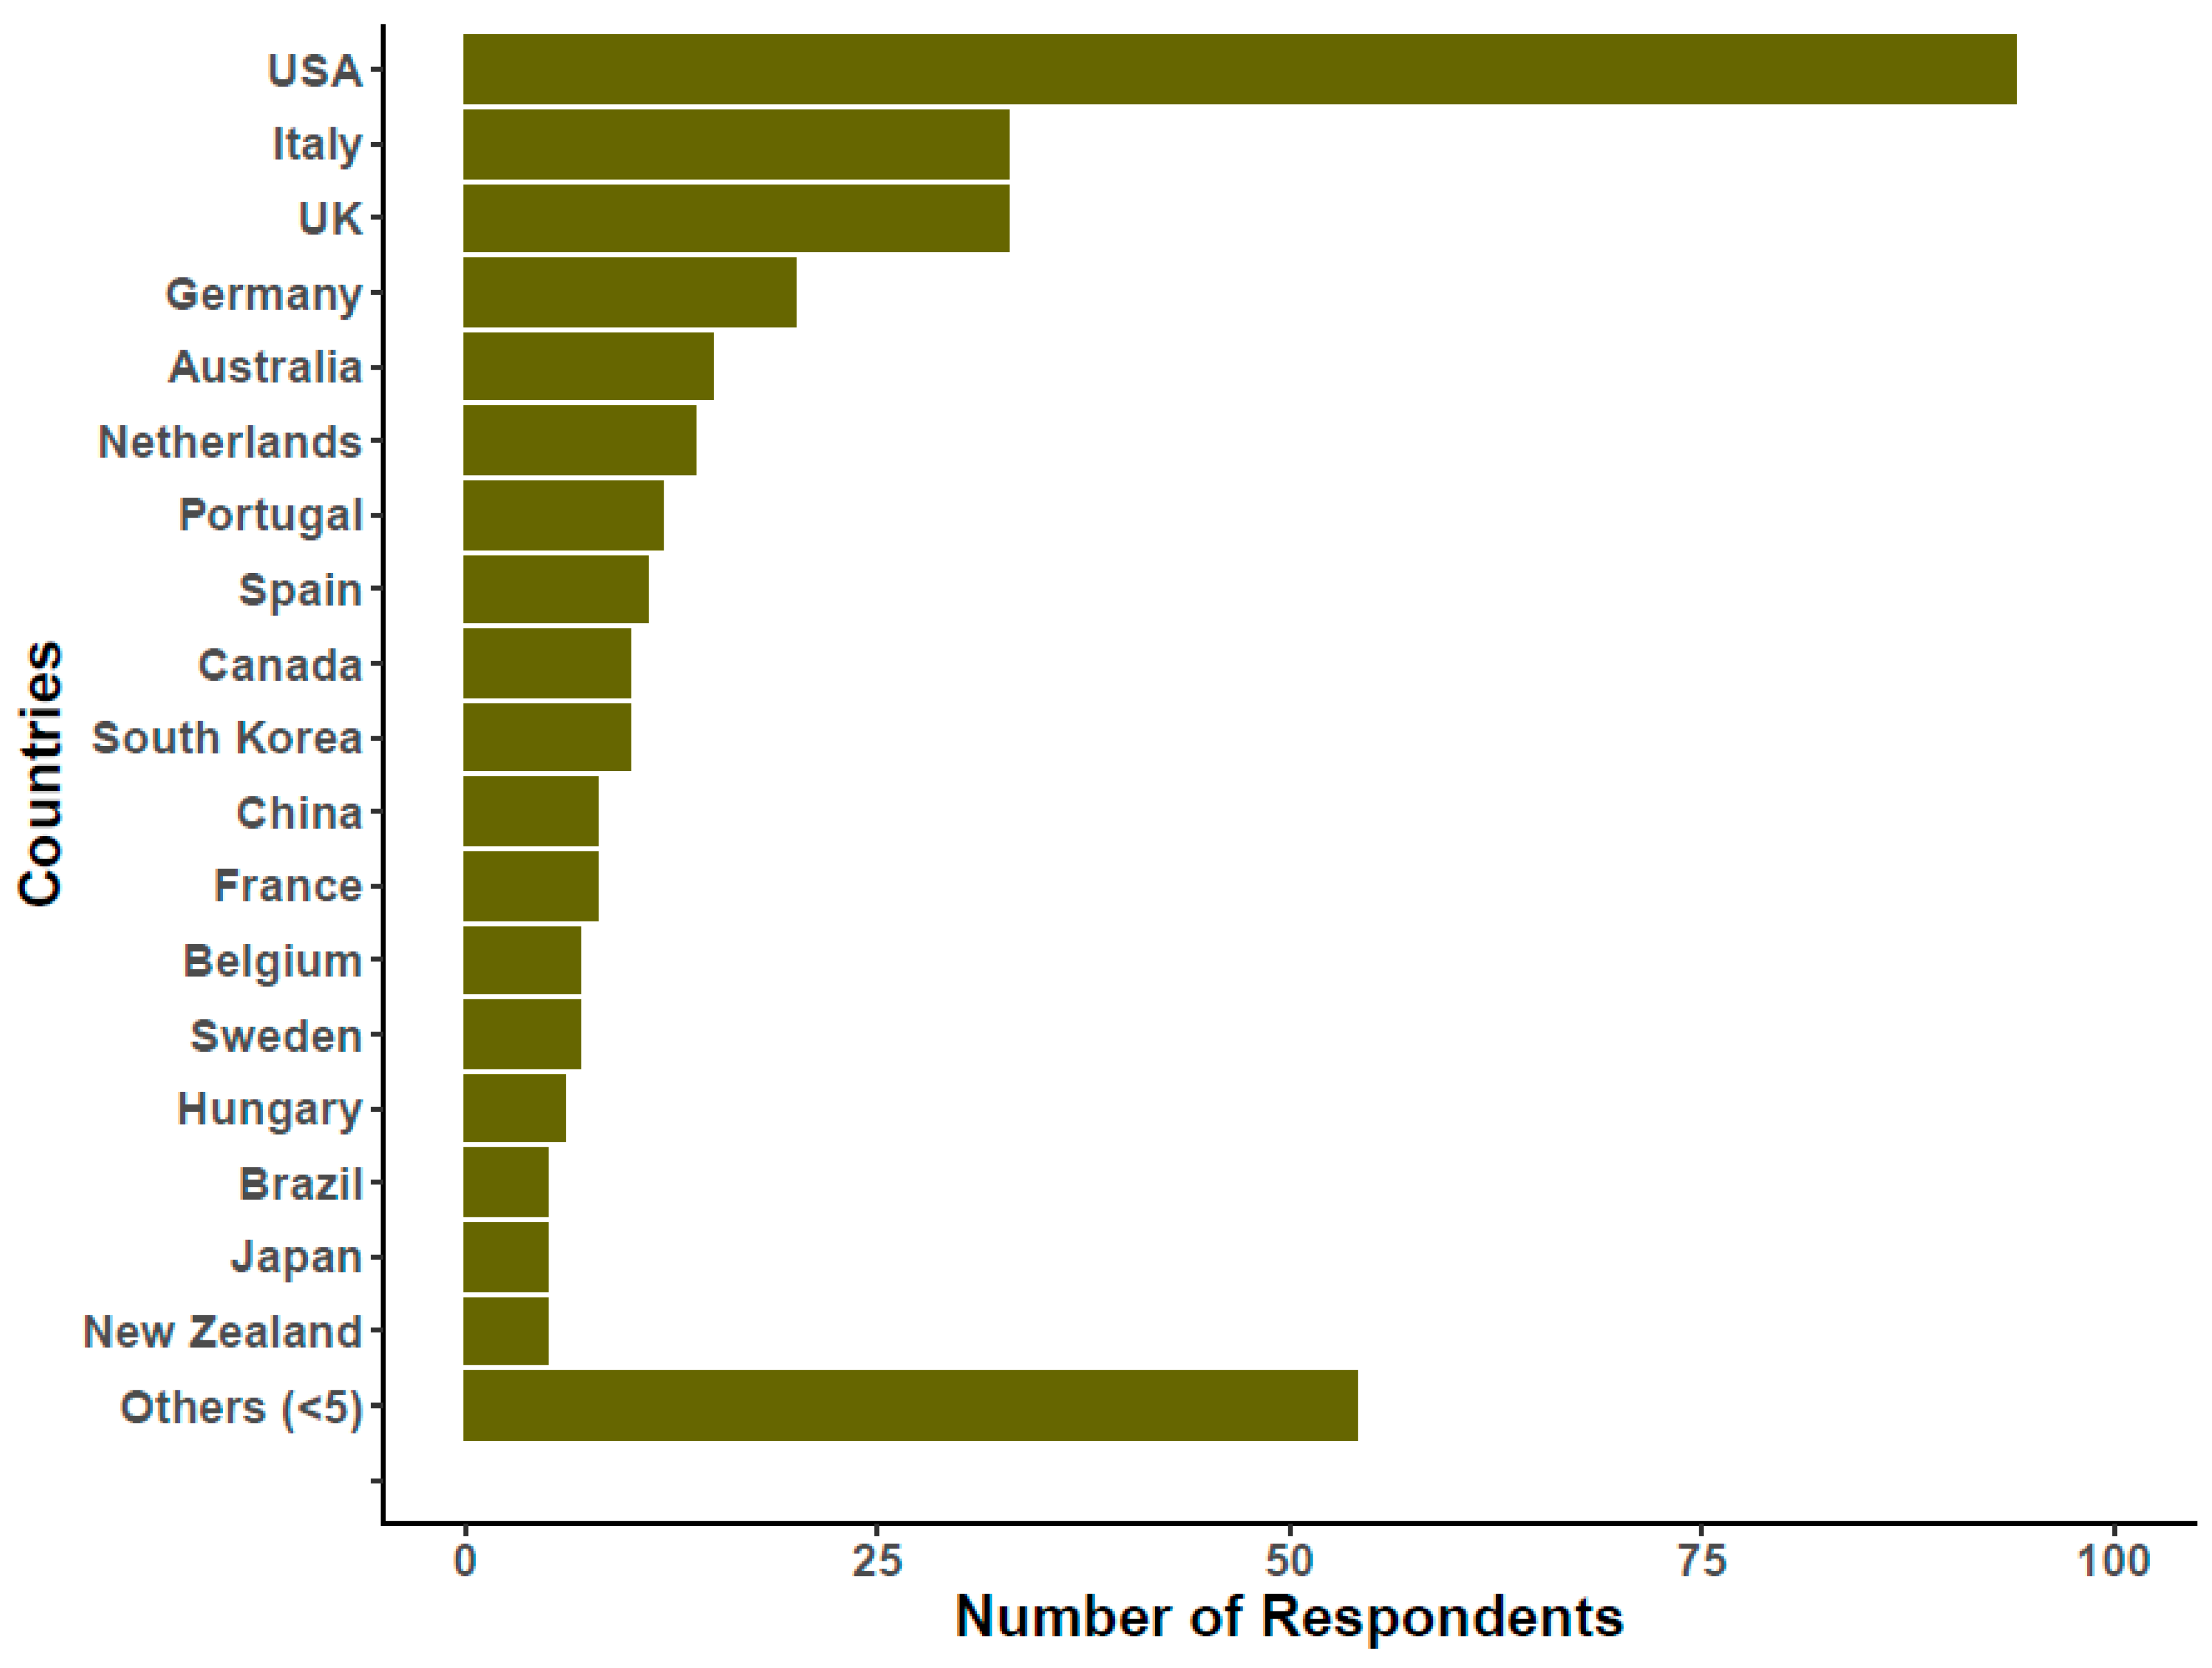
Abstract
:1. Introduction
2. The Survey
3. Sources of Extracellular Vesicles
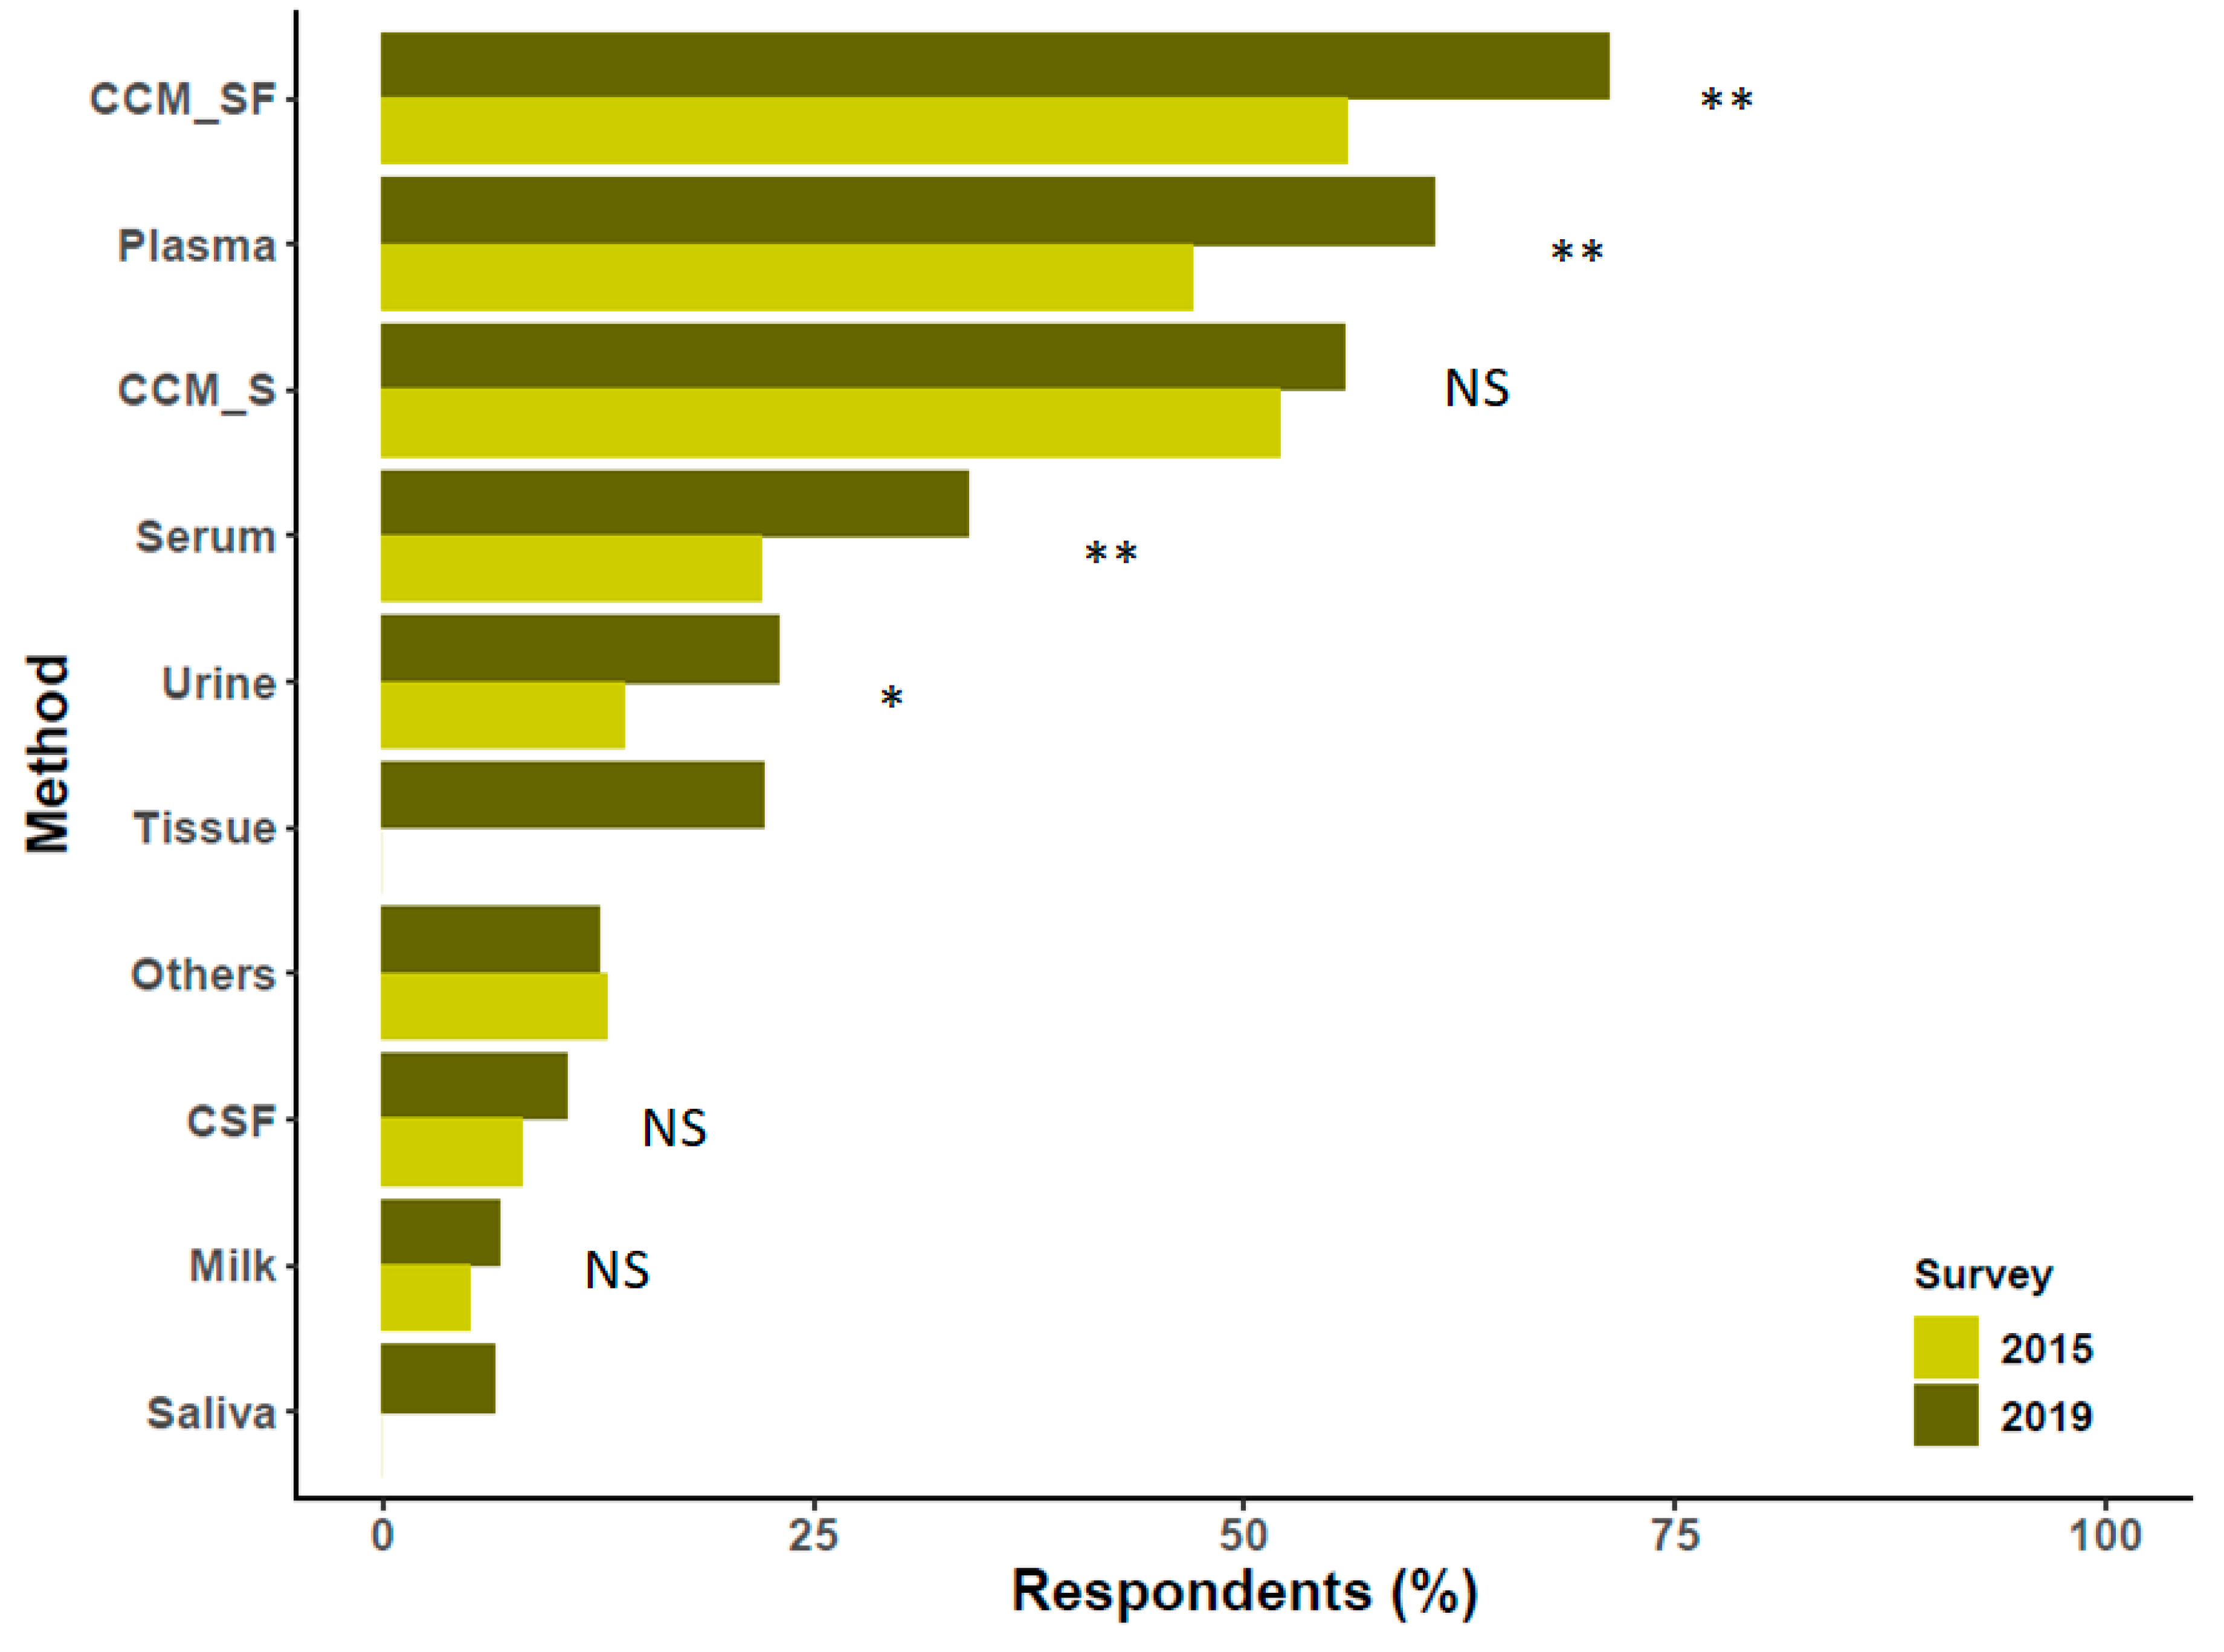
4. Preparation/Separation Methods
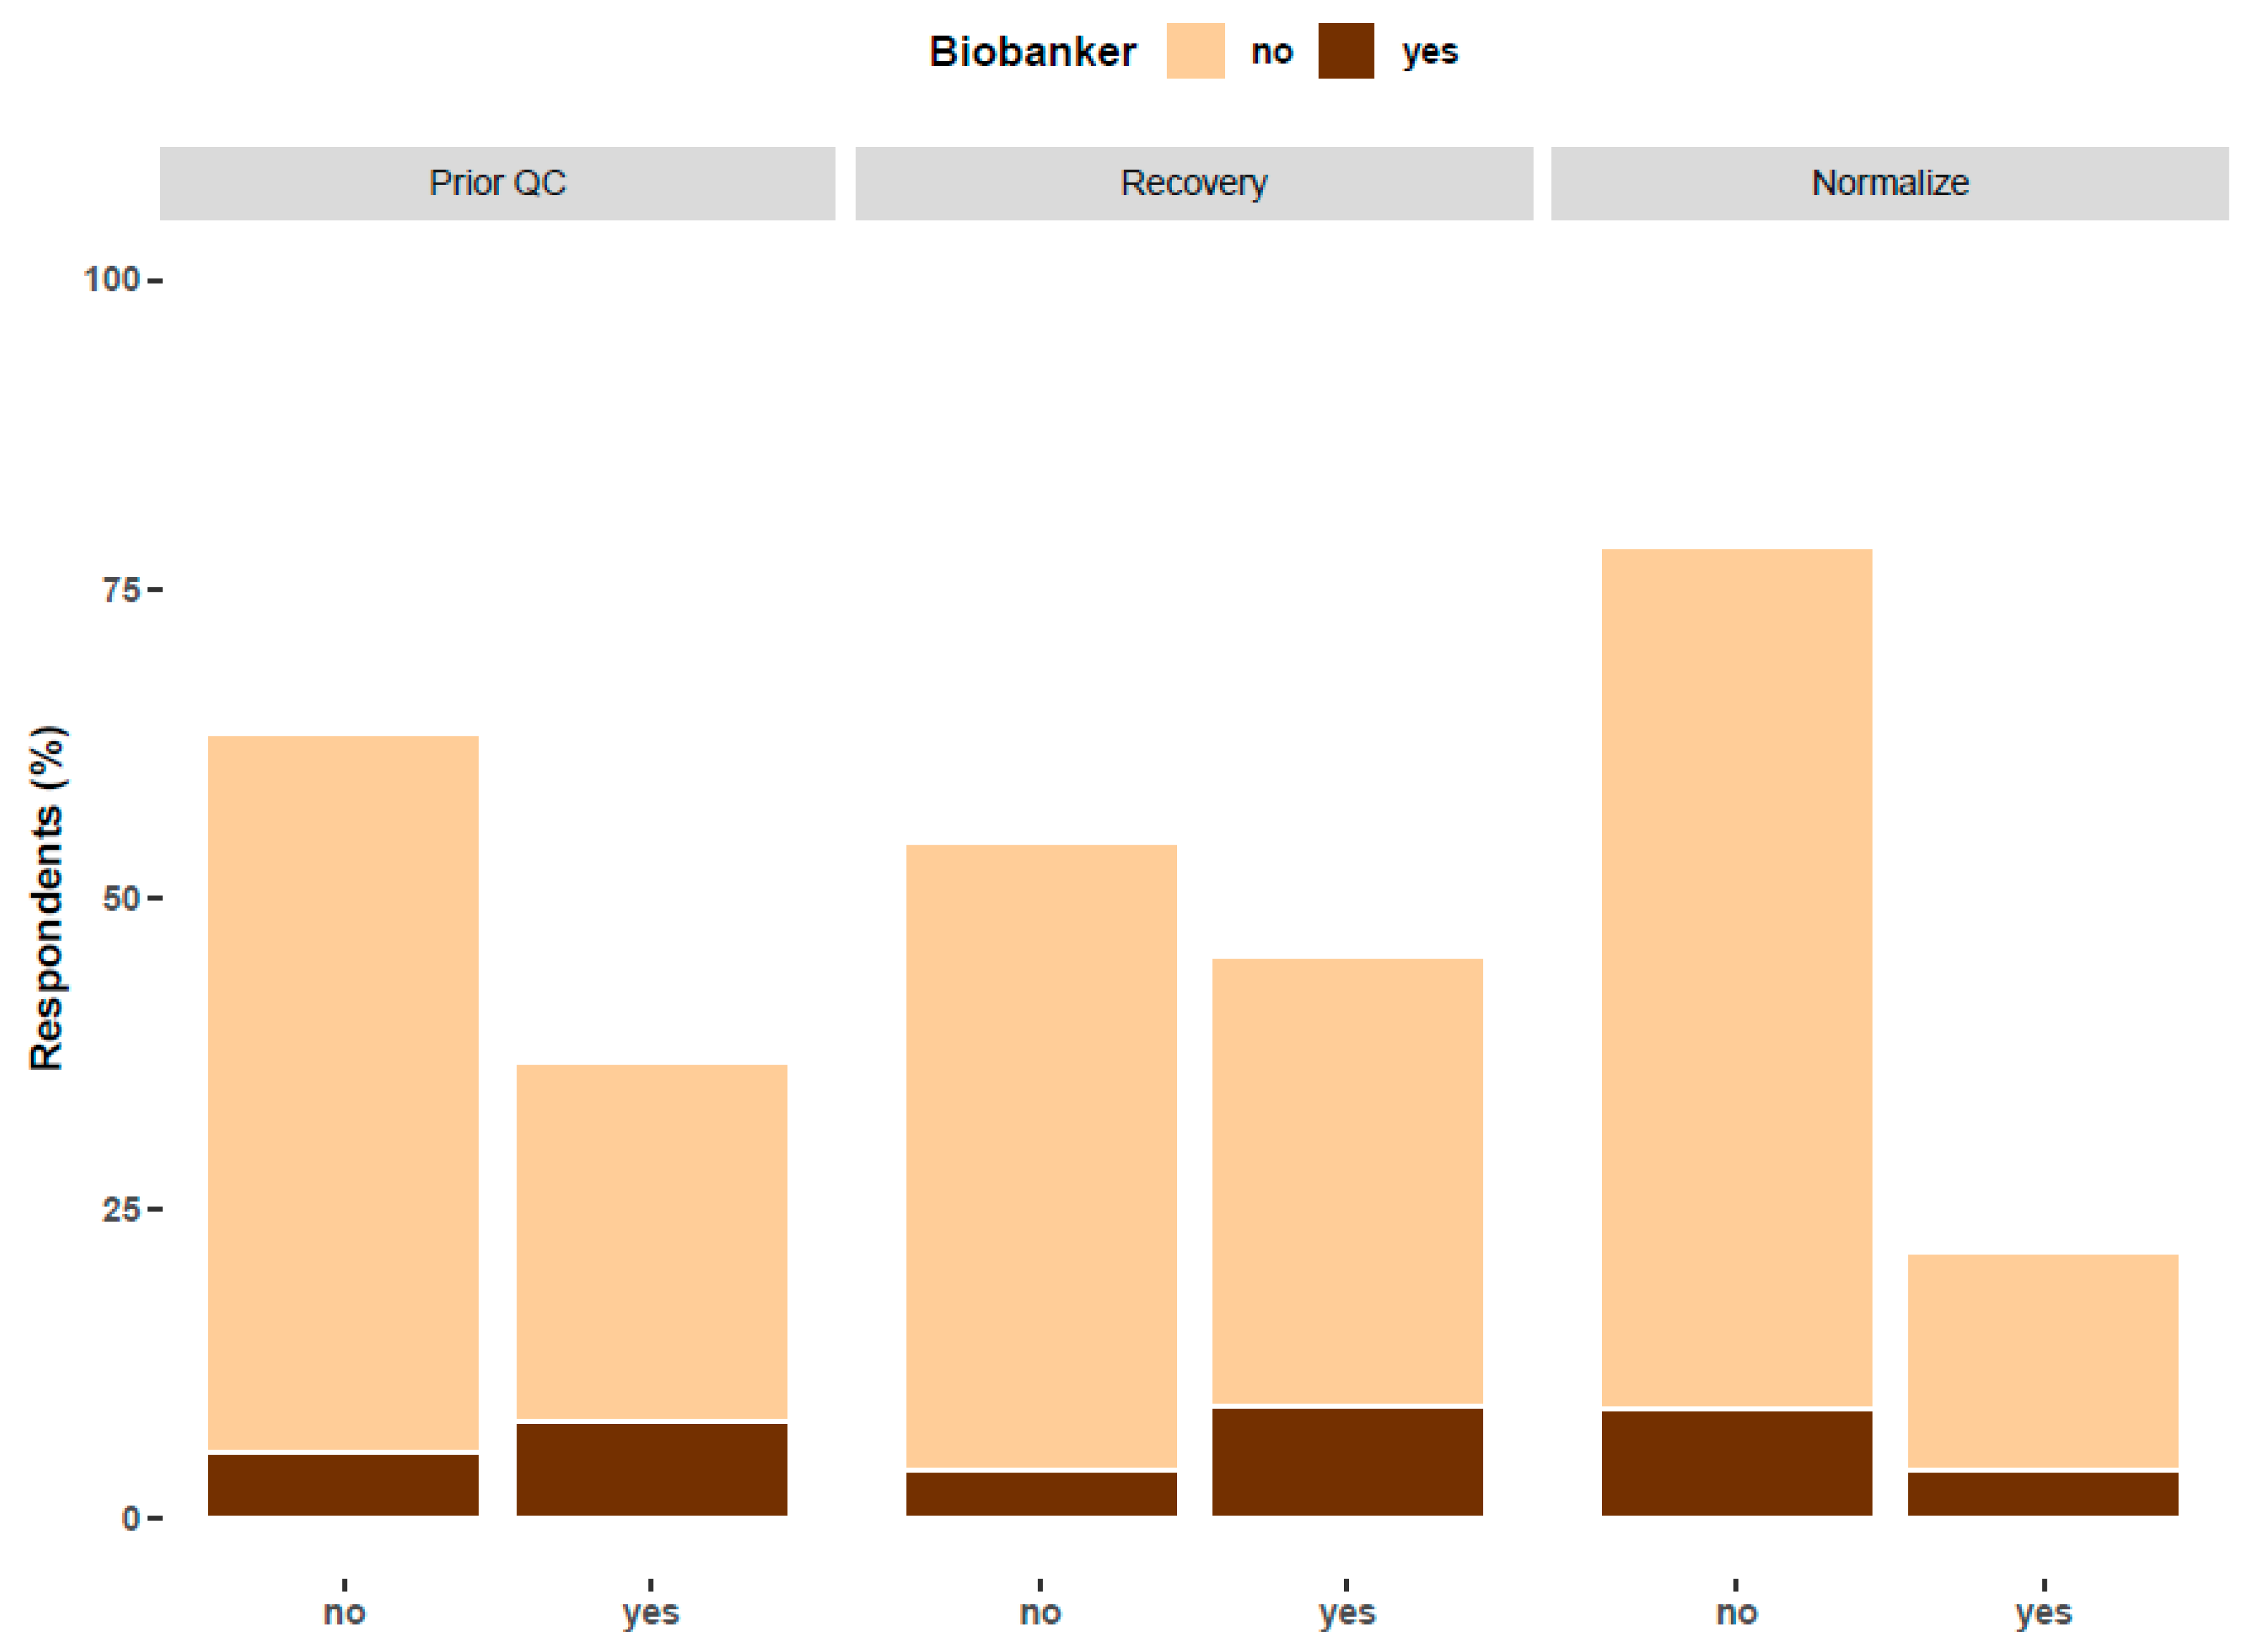
5. Quality Control of EV Preparations: Relationship with Biobanking
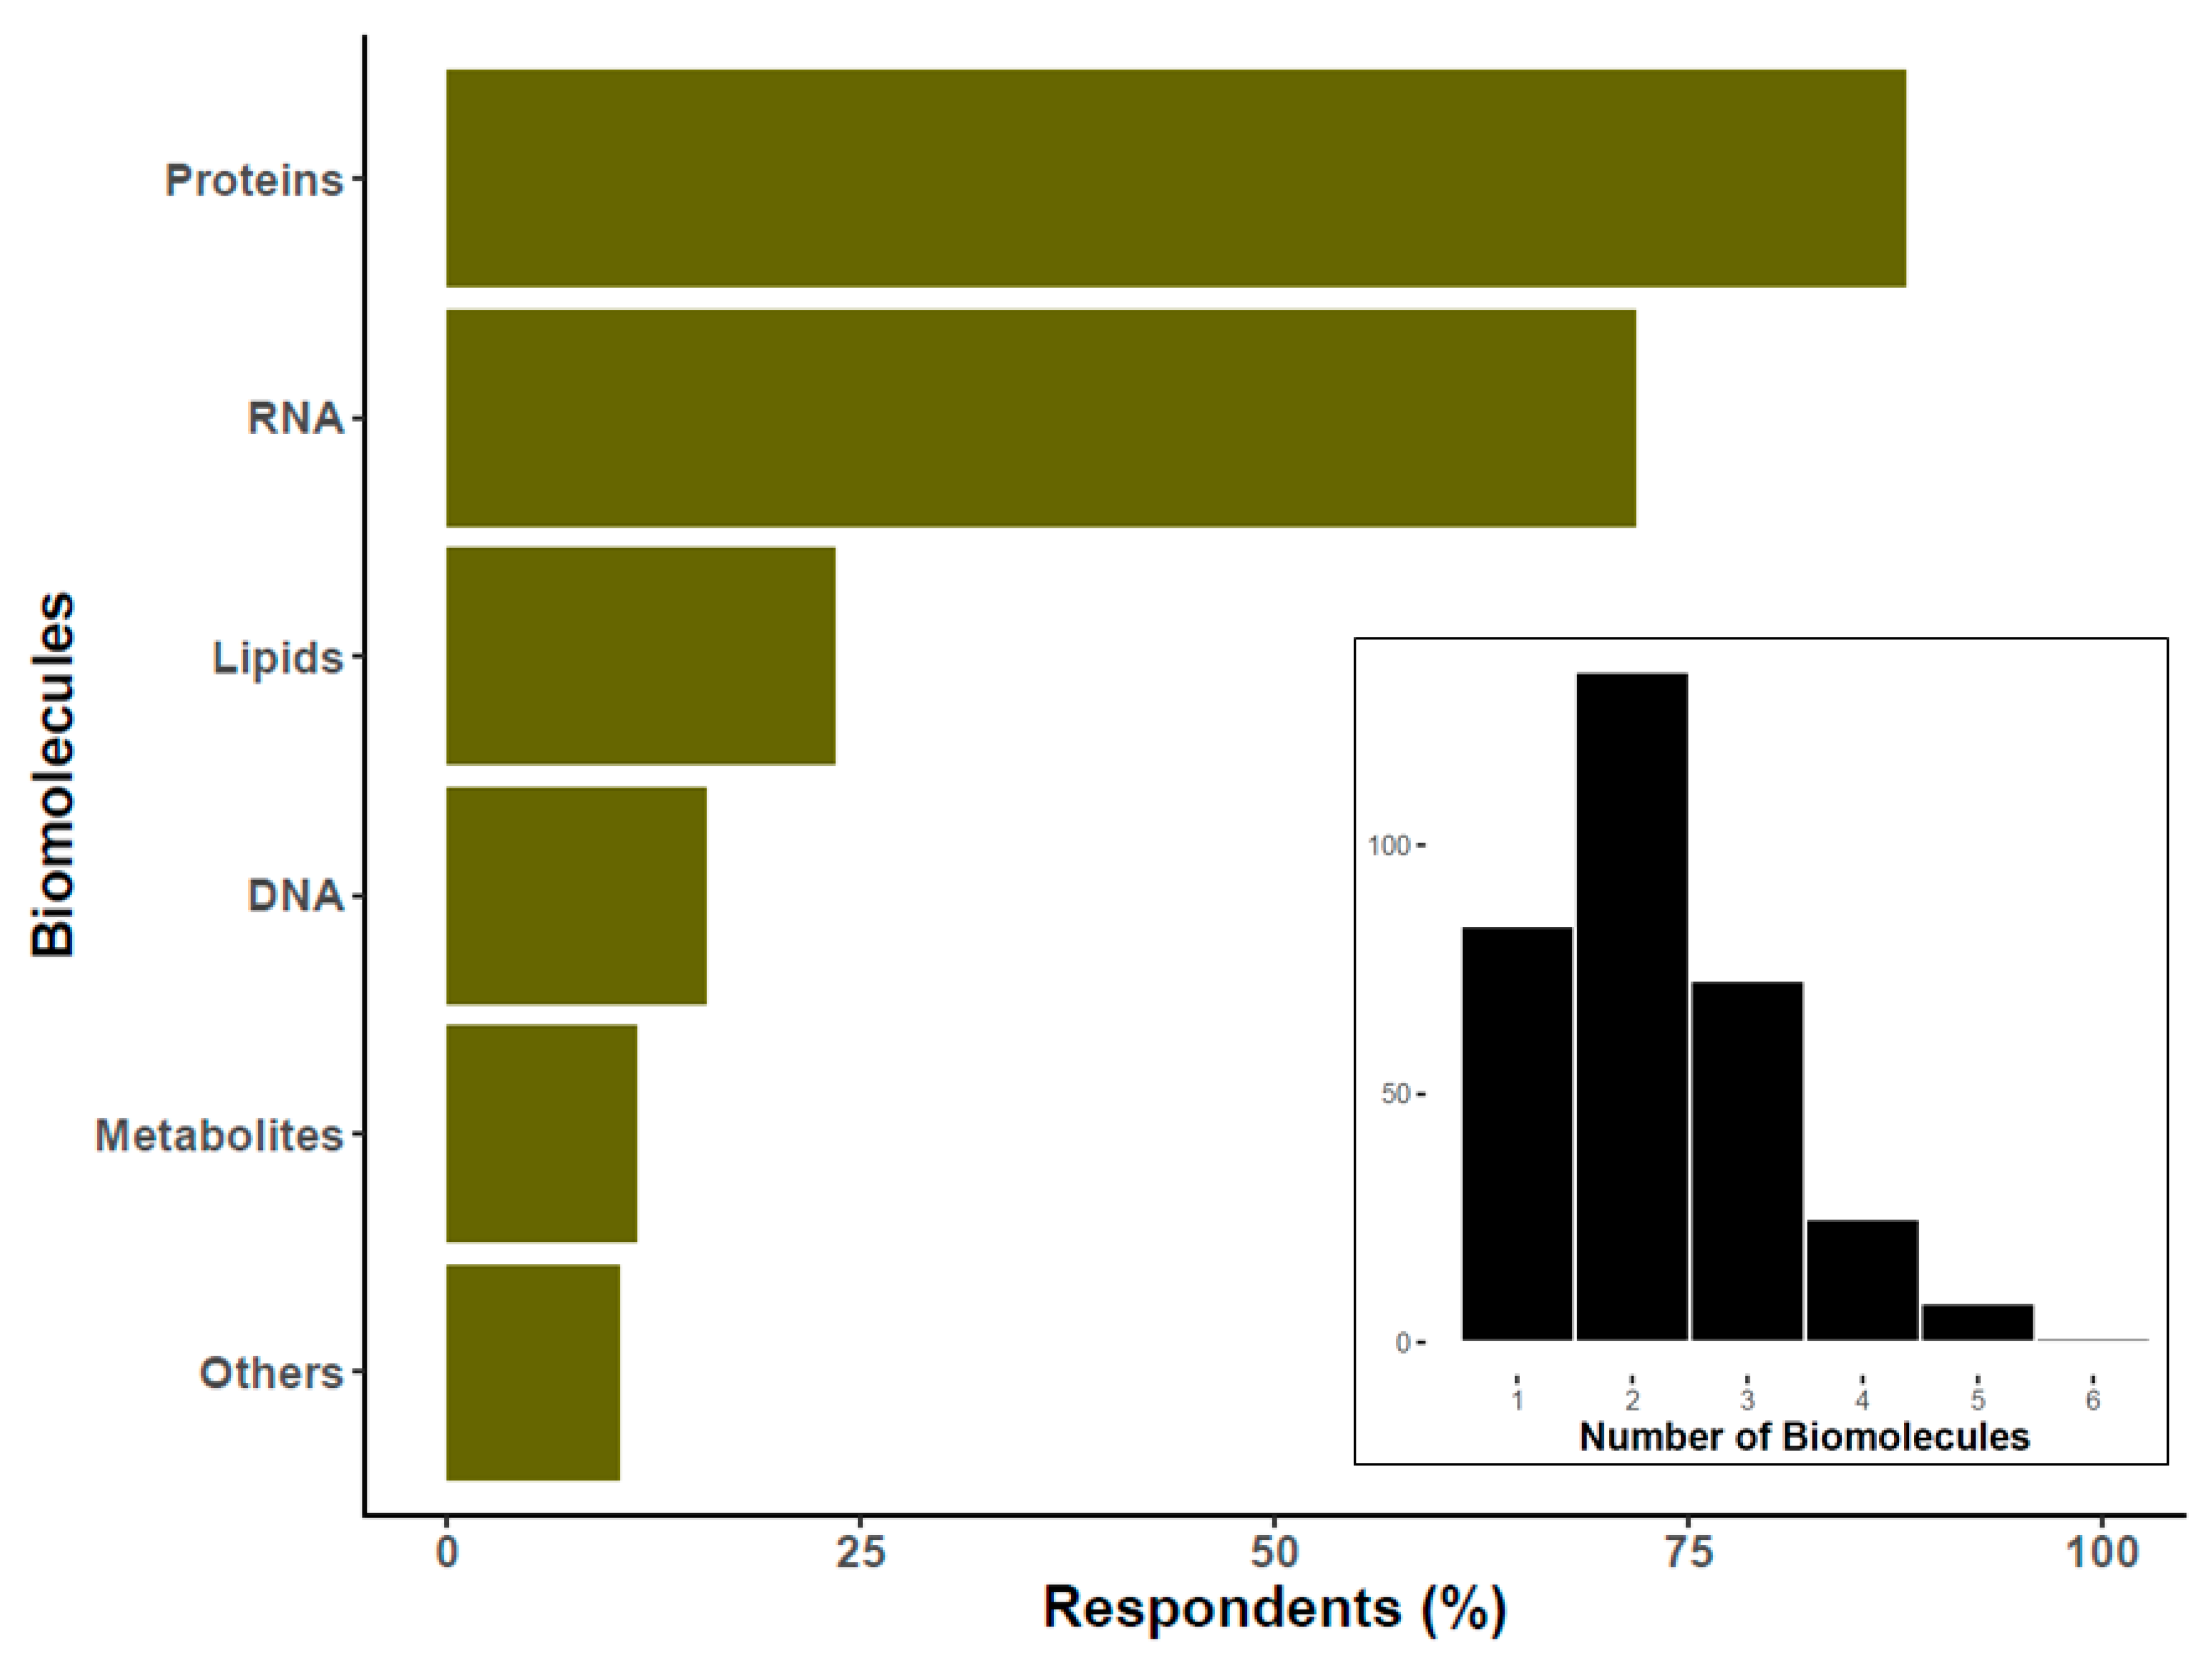
6. EV Biomolecule Cargo Types of Interest
7. Increased Implementation and Diversity of Characterization Methods
8. Normalization Methods for In Vitro and In Vivo Assays
9. Conclusions and Final Remarks
Supplementary Materials
Author Contributions
Funding
Acknowledgments
Conflicts of Interest
References
- Lötvall, J.; Rajendran, L.; Gho, Y.-S.; Théry, C.; Wauben, M.; Raposo, G.; Sjöstrand, M.; Taylor, D.; Telemo, E.; Breakefield, X.O. The launch of Journal of Extracellular Vesicles (JEV), the official journal of the International Society for Extracellular Vesicles—About microvesicles, exosomes, ectosomes and other extracellular vesicles. J. Extracell. Vesicles 2012, 1. [Google Scholar] [CrossRef] [PubMed]
- Soekmadji, C.; Hill, A.F.; Wauben, M.H.; Buzás, E.I.; Di Vizio, D.; Gardiner, C.; Lotvall, J.; Sahoo, S.; Witwer, K.W. Towards mechanisms and standardization in extracellular vesicle and extracellular RNA studies: Results of a worldwide survey. J. Extracell. Vesicles 2018, 7, 1535745. [Google Scholar] [CrossRef] [PubMed] [Green Version]
- Lener, T.; Gimona, M.; Aigner, L.; Börger, V.; Buzas, E.; Camussi, G.; Chaput, N.; Chatterjee, D.; Court, F.A.; Del Portillo, H.A.; et al. Applying extracellular vesicles based therapeutics in clinical trials—An ISEV position paper. J. Extracell. Vesicles 2015, 4, 30087. [Google Scholar] [CrossRef] [PubMed]
- Mateescu, B.; Kowal, E.; Van Balkom, B.W.M.; Bartel, S.; Bhattacharyya, S.N.; Buzás, E.I.; Buck, A.H.; De Candia, P.; Chow, F.W.-N.; Das, S.; et al. Obstacles and opportunities in the functional analysis of extracellular vesicle RNA—An ISEV position paper. J. Extracell. Vesicles 2017, 6, 1286095. [Google Scholar] [CrossRef] [Green Version]
- Russell, A.E.; Sneider, A.; Witwer, K.W.; Bergese, P.; Bhattacharyya, S.N.; Cocks, A.; Cocucci, E.; Erdbrügger, U.; Falcon-Perez, J.M.; Freeman, D.W.; et al. Biological membranes in EV biogenesis, stability, uptake, and cargo transfer: An ISEV position paper arising from the ISEV membranes and EVs workshop. J. Extracell. Vesicles 2019, 8, 1684862. [Google Scholar] [CrossRef] [Green Version]
- Clayton, A.; Boilard, E.; Buzás, E.I.; Cheng, L.; Falcón-Perez, J.M.; Gardiner, C.; Gustafson, D.; Gualerzi, A.; Hendrix, A.; Hoffman, A.; et al. Considerations towards a roadmap for collection, handling and storage of blood extracellular vesicles. J. Extracell. Vesicles 2019, 8, 1647027. [Google Scholar] [CrossRef] [Green Version]
- Lässer, C.; Théry, C.; Buzás, E.I.; Mathivanan, S.; Zhao, W.; Gho, Y.S.; Lötvall, J. The International Society for Extracellular Vesicles launches the first massive open online course on extracellular vesicles. J. Extracell. Vesicles 2016, 5, 34299. [Google Scholar] [CrossRef]
- Gardiner, C.; Di Vizio, D.; Sahoo, S.; Théry, C.; Witwer, K.W.; Wauben, M.; Hill, A.F. Techniques used for the isolation and characterization of extracellular vesicles: Results of a worldwide survey. J. Extracell. Vesicles 2016, 5, 32945. [Google Scholar] [CrossRef]
- Auber, M.; Fröhlich, D.; Drechsel, O.; Karaulanov, E.; Krämer-Albers, E.-M. Serum-free media supplements carry miRNAs that co-purify with extracellular vesicles. J. Extracell. Vesicles 2019, 8, 1656042. [Google Scholar] [CrossRef] [Green Version]
- Kowal, J.; Arras, G.; Colombo, M.; Jouve, M.; Morath, J.P.; Primdal-Bengtson, B.; Dingli, F.; Loew, D.; Tkach, M.; Théry, C. Proteomic comparison defines novel markers to characterize heterogeneous populations of extracellular vesicle subtypes. Proc. Natl. Acad. Sci. USA 2016, 113, E968–E977. [Google Scholar] [CrossRef] [Green Version]
- Eitan, E.; Zhang, S.; Witwer, K.W.; Mattson, M.P. Extracellular vesicle–depleted fetal bovine and human sera have reduced capacity to support cell growth. J. Extracell. Vesicles 2015, 4, 26373. [Google Scholar] [CrossRef] [PubMed]
- Coumans, F.A.; Brisson, A.R.; Buzás, E.I.; Dignat-George, F.; Drees, E.E.; El Andaloussi, S.; Emanueli, C.; Gąsecka, A.; Hendrix, A.; Hill, A.F.; et al. Methodological Guidelines to Study Extracellular Vesicles. Circ. Res. 2017, 120, 1632–1648. [Google Scholar] [CrossRef] [PubMed]
- Han, Y.; Jia, L.; Zheng, Y.; Li, W. Salivary Exosomes: Emerging Roles in Systemic Disease. Int. J. Boil. Sci. 2018, 14, 633–643. [Google Scholar] [CrossRef] [PubMed]
- Chiabotto, G.; Gai, C.; Deregibus, M.C.; Camussi, G. Salivary Extracellular Vesicle-Associated exRNA as Cancer Biomarker. Cancers 2019, 11, 891. [Google Scholar] [CrossRef] [PubMed] [Green Version]
- Webber, J.; Clayton, A. How pure are your vesicles? J. Extracell. Vesicles 2013, 2, 19861. [Google Scholar] [CrossRef] [PubMed]
- Erdbrügger, U.; Rudy, C.K.; Etter, M.E.; Dryden, K.A.; Yeager, M.; Klibanov, A.L.; Lannigan, J.A. Imaging flow cytometry elucidates limitations of microparticle analysis by conventional flow cytometry. Cytom. Part A 2014, 85, 756–770. [Google Scholar] [CrossRef]
- Trends in Extracellular Vesicle Research. 2019. Available online: https://www.beckman.es/resources/research-areas/nanoscale/ev-report (accessed on 30 January 2020).
- Mora, E.M.; Álvarez-Cubela, S.; Oltra, E. Biobanking of Exosomes in the Era of Precision Medicine: Are We There Yet? Int. J. Mol. Sci. 2015, 17, 13. [Google Scholar] [CrossRef] [Green Version]
- Zhang, H.; Lyden, D. Asymmetric-flow field-flow fractionation technology for exomere and small extracellular vesicle separation and characterization. Nat. Protoc. 2019, 14, 1027–1053. [Google Scholar] [CrossRef]
- Jeppesen, D.K.; Fenix, A.M.; Franklin, J.L.; Higginbotham, J.N.; Zhang, Q.; Zimmerman, L.J.; Liebler, D.C.; Ping, J.; Liu, Q.; Evans, R.; et al. Reassessment of Exosome Composition. Cell 2019, 177, 428–445.e18. [Google Scholar] [CrossRef] [Green Version]
- Bebelman, M.P.; Bun, P.; Huveneers, S.; Van Niel, G.; Pegtel, D.M.; Verweij, F.J. Real-time imaging of multivesicular body–plasma membrane fusion to quantify exosome release from single cells. Nat. Protoc. 2019, 15, 102–121. [Google Scholar] [CrossRef]
- Leidal, A.M.; Huang, H.H.; Marsh, T.; Solvik, T.; Zhang, D.; Ye, J.; Kai, F.; Goldsmith, J.; Liu, J.Y.; Huang, Y.-H.; et al. The LC3-conjugation machinery specifies the loading of RNA-binding proteins into extracellular vesicles. Nat. Cell Biol. 2020, 22, 187–199. [Google Scholar] [CrossRef] [PubMed]


© 2020 by the authors. Licensee MDPI, Basel, Switzerland. This article is an open access article distributed under the terms and conditions of the Creative Commons Attribution (CC BY) license (http://creativecommons.org/licenses/by/4.0/).
Share and Cite
Royo, F.; Théry, C.; Falcón-Pérez, J.M.; Nieuwland, R.; Witwer, K.W. Methods for Separation and Characterization of Extracellular Vesicles: Results of a Worldwide Survey Performed by the ISEV Rigor and Standardization Subcommittee. Cells 2020, 9, 1955. https://doi.org/10.3390/cells9091955
Royo F, Théry C, Falcón-Pérez JM, Nieuwland R, Witwer KW. Methods for Separation and Characterization of Extracellular Vesicles: Results of a Worldwide Survey Performed by the ISEV Rigor and Standardization Subcommittee. Cells. 2020; 9(9):1955. https://doi.org/10.3390/cells9091955
Chicago/Turabian StyleRoyo, Felix, Clotilde Théry, Juan M. Falcón-Pérez, Rienk Nieuwland, and Kenneth W. Witwer. 2020. "Methods for Separation and Characterization of Extracellular Vesicles: Results of a Worldwide Survey Performed by the ISEV Rigor and Standardization Subcommittee" Cells 9, no. 9: 1955. https://doi.org/10.3390/cells9091955