

GFAP as a Potential Biomarker for Alzheimer’s Disease: A Systematic Review and Meta-Analysis


Abstract
:1. Introduction
2. Materials and Methods
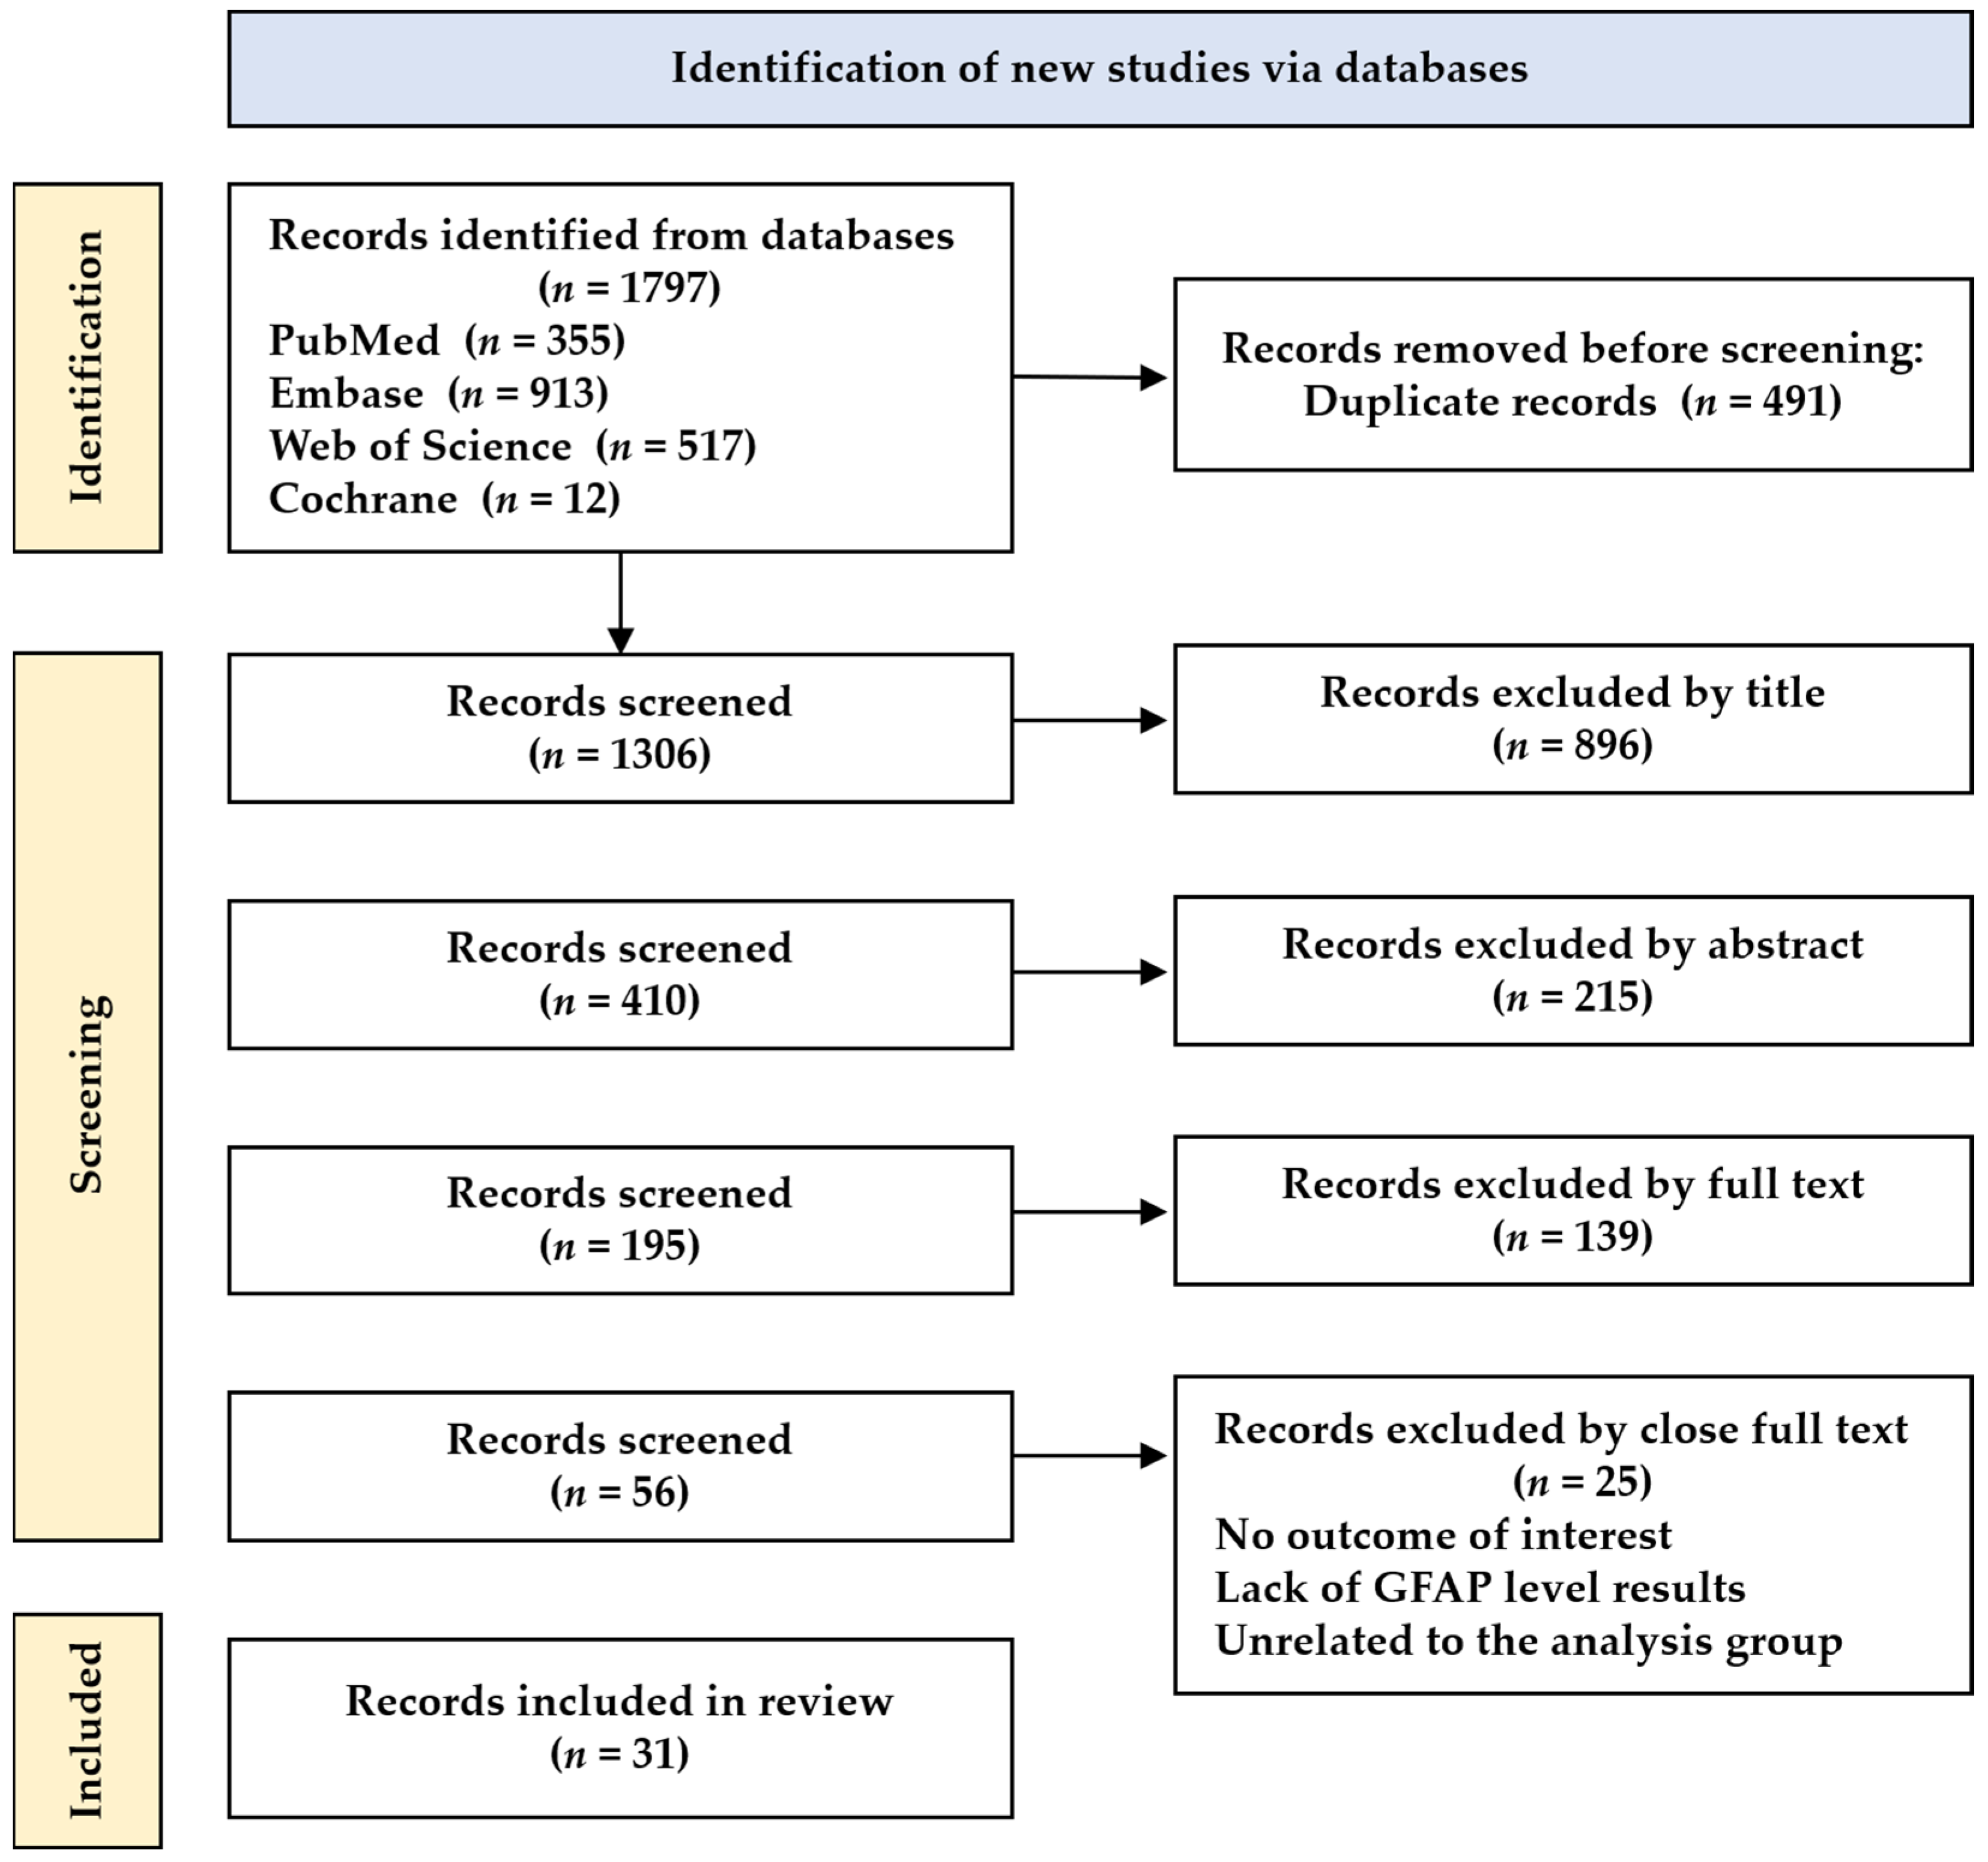
2.1. Literature Search and Selection Criteria
2.2. Data Extraction and Analysis
3. Results
3.1. Characteristics of the Selected Studies
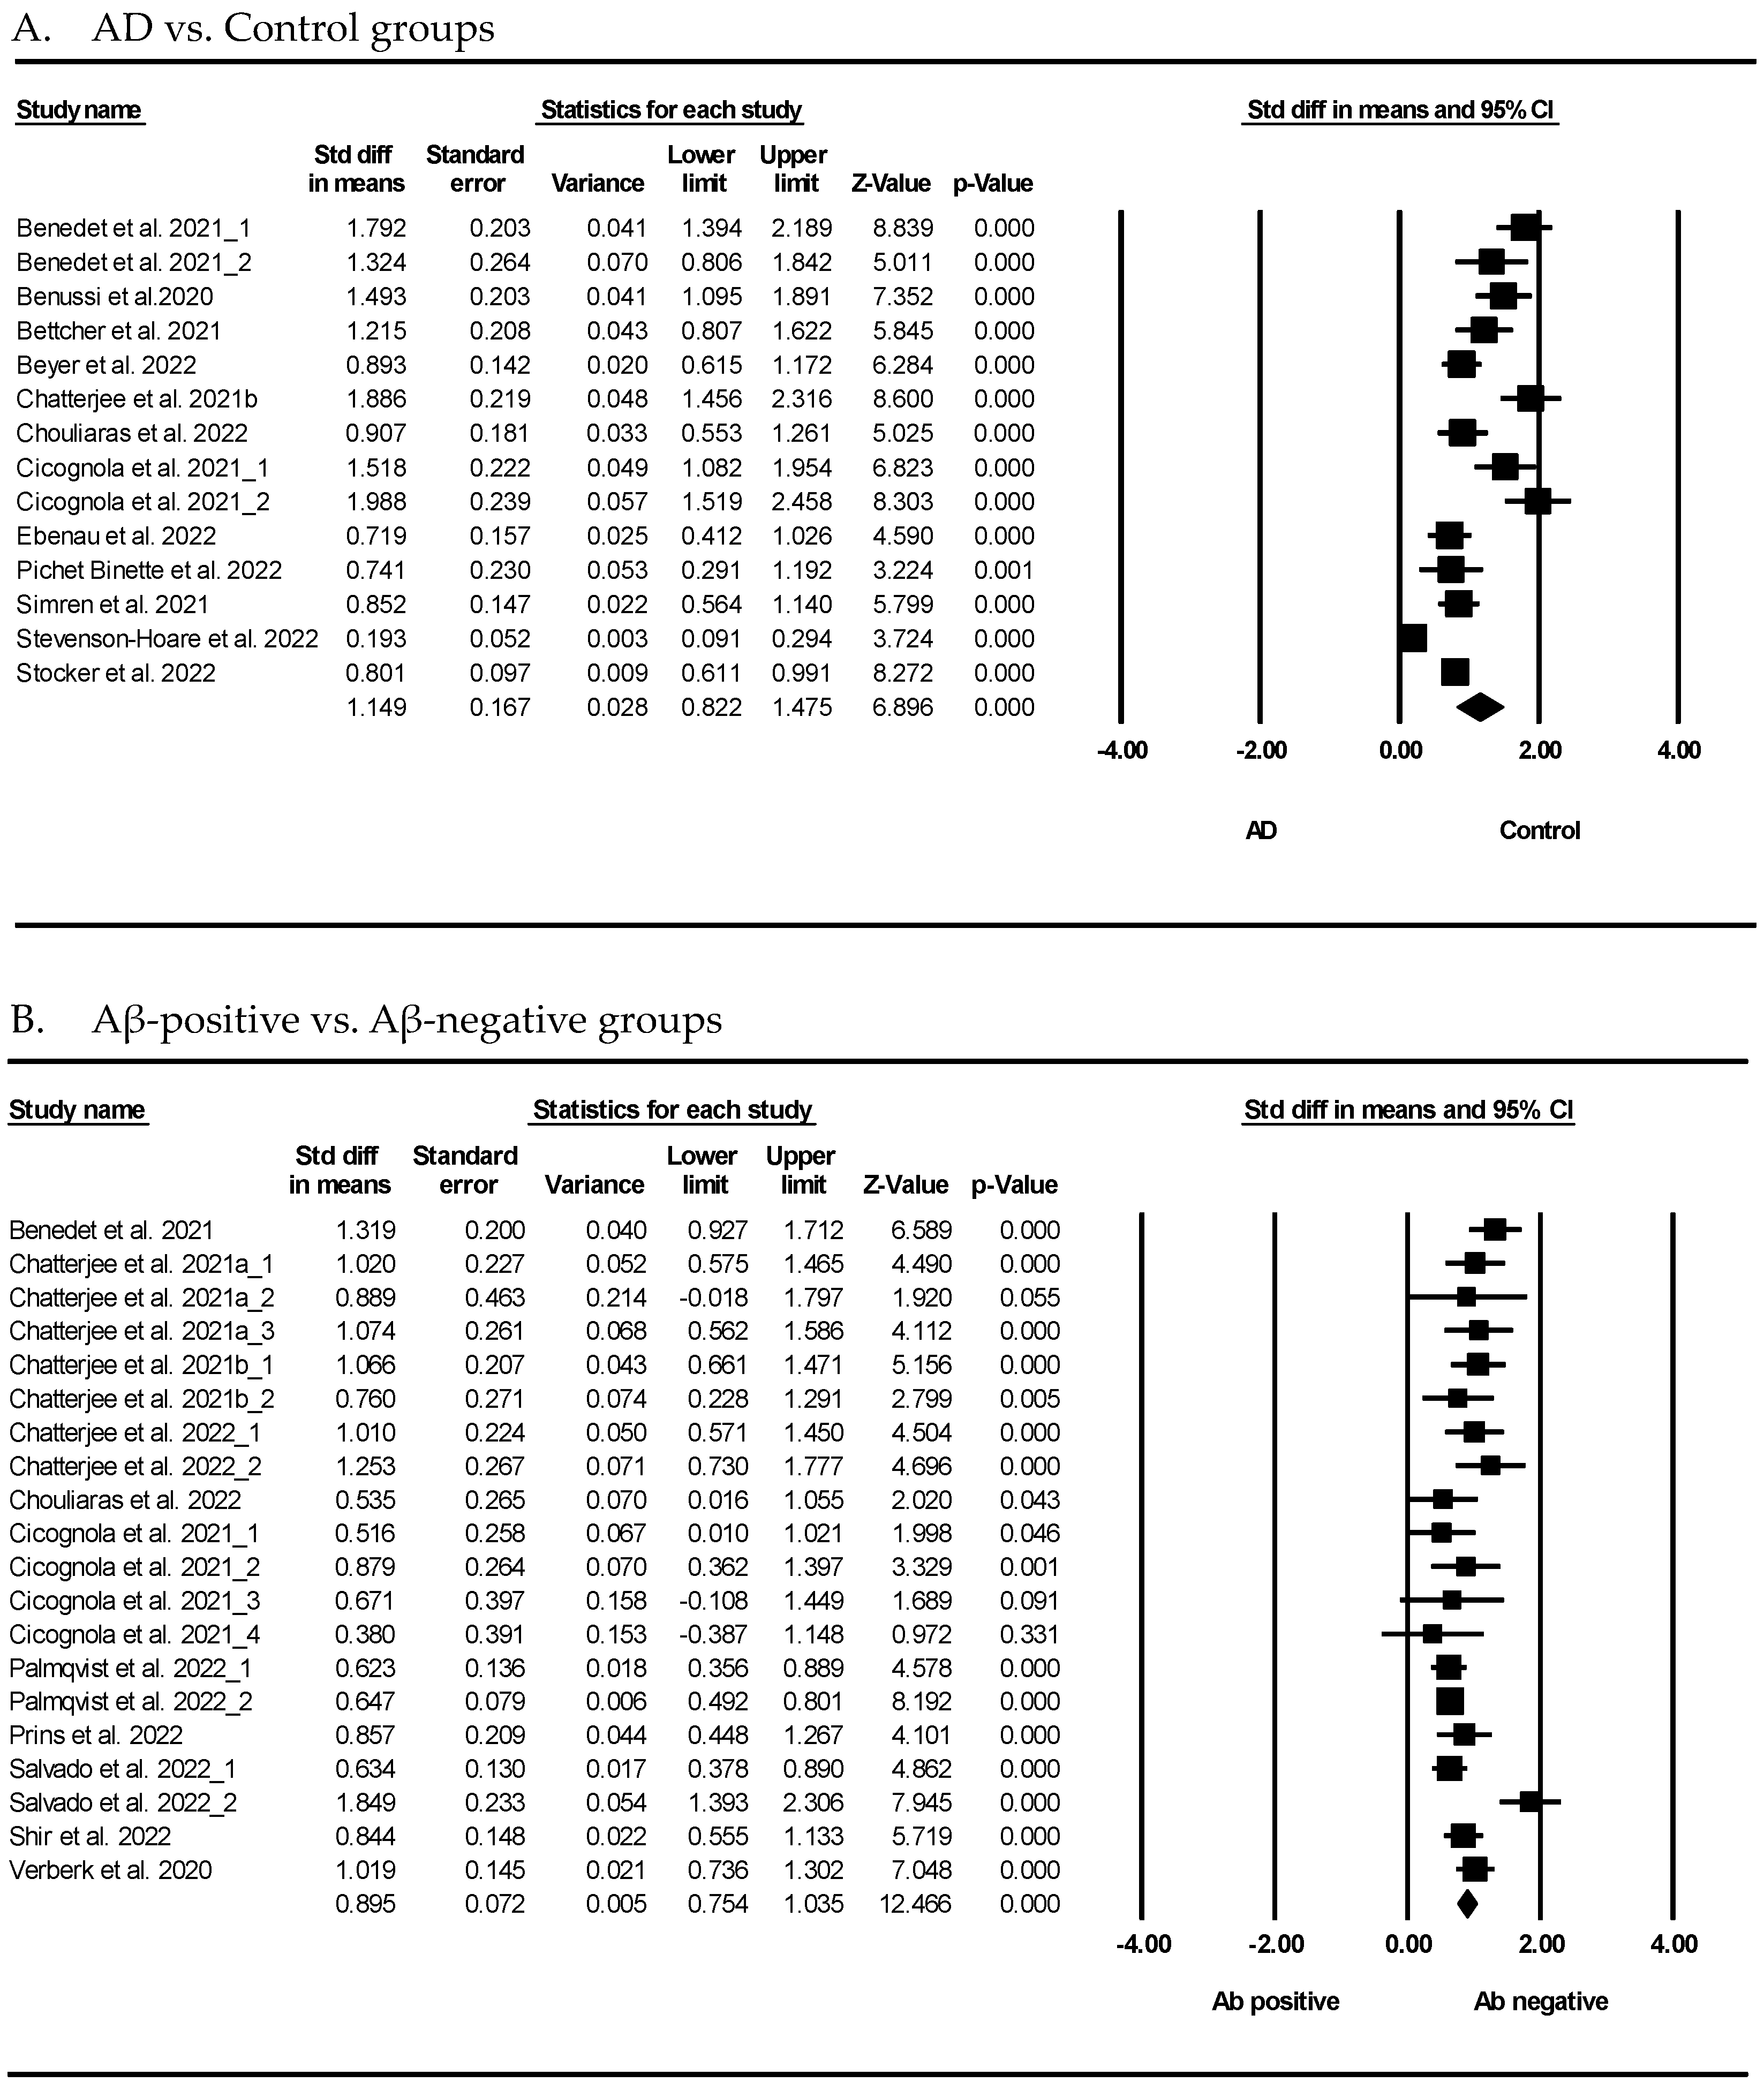
3.2. Association between GFAP and AD or Aβ-Positive Group
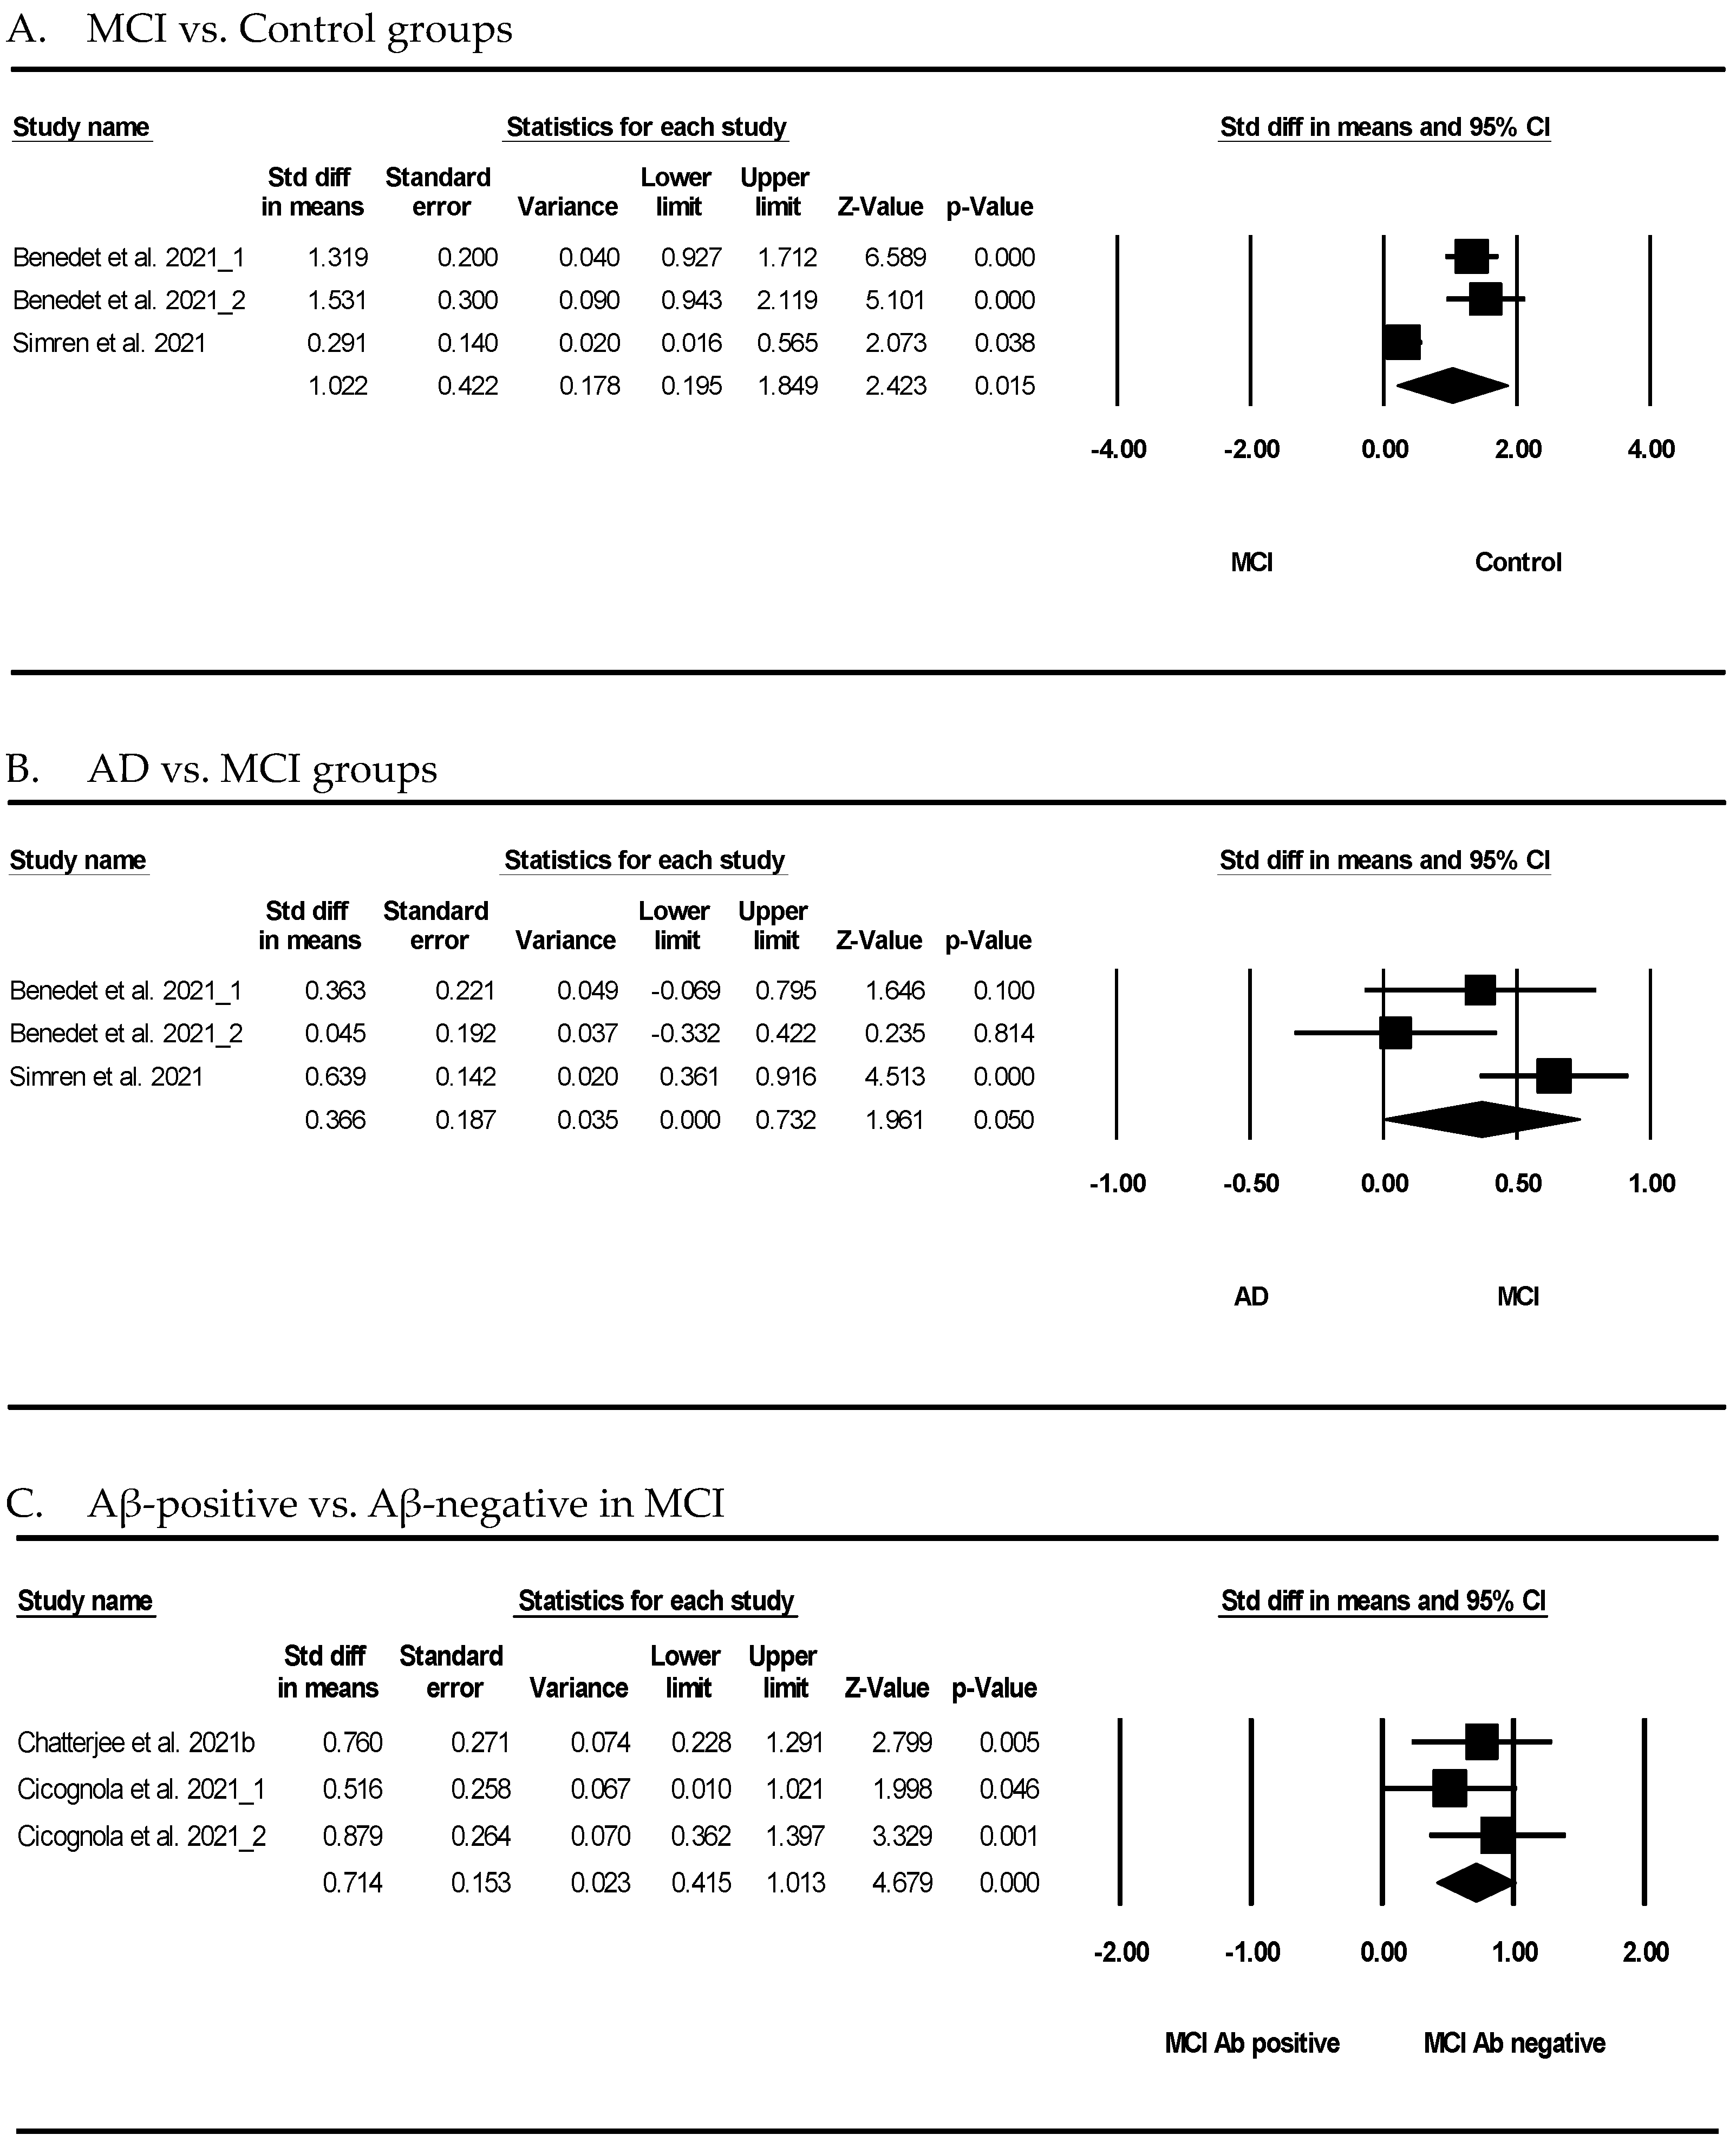
3.3. Association between GFAP and Mild Cognitive Impairment (MCI)
4. Discussion
Author Contributions
Funding
Data Availability Statement
Conflicts of Interest
References
- Molinuevo, J.L.; Ayton, S.; Batrla, R.; Bednar, M.M.; Bittner, T.; Cummings, J.; Fagan, A.M.; Hampel, H.; Mielke, M.M.; Mikulskis, A.; et al. Current state of Alzheimer’s fluid biomarkers. Acta Neuropathol. 2018, 136, 821–853. [Google Scholar] [CrossRef] [PubMed]
- Hane, F.T.; Robinson, M.; Lee, B.Y.; Bai, O.; Leonenko, Z.; Albert, M.S. Recent Progress in Alzheimer’s Disease Research, Part 3: Diagnosis and Treatment. J. Alzheimers Dis. 2017, 57, 645–665. [Google Scholar] [CrossRef] [PubMed]
- Wang, J.; Gu, B.J.; Masters, C.L.; Wang, Y.J. A systemic view of Alzheimer disease—Insights from amyloid-beta metabolism beyond the brain. Nat. Rev. Neurol. 2017, 13, 612–623. [Google Scholar] [CrossRef]
- Hardy, J.A.; Higgins, G.A. Alzheimer’s disease: The amyloid cascade hypothesis. Science 1992, 256, 184–185. [Google Scholar] [CrossRef] [PubMed]
- Alawode, D.O.T.; Fox, N.C.; Zetterberg, H.; Heslegrave, A.J. Alzheimer’s Disease Biomarkers Revisited From the Amyloid Cascade Hypothesis Standpoint. Front. Neurosci. 2022, 16, 837390. [Google Scholar] [CrossRef]
- Guzman-Martinez, L.; Maccioni, R.B.; Farias, G.A.; Fuentes, P.; Navarrete, L.P. Biomarkers for Alzheimer’s Disease. Curr. Alzheimer Res. 2019, 16, 518–528. [Google Scholar] [CrossRef] [PubMed]
- O’Brien, R.J.; Wong, P.C. Amyloid precursor protein processing and Alzheimer’s disease. Annu. Rev. Neurosci. 2011, 34, 185–204. [Google Scholar] [CrossRef]
- Zou, K.; Abdullah, M.; Michikawa, M. Current Biomarkers for Alzheimer’s Disease: From CSF to Blood. J. Pers. Med. 2020, 10, 85. [Google Scholar] [CrossRef]
- Auso, E.; Gomez-Vicente, V.; Esquiva, G. Biomarkers for Alzheimer’s Disease Early Diagnosis. J. Pers. Med. 2020, 10, 114. [Google Scholar] [CrossRef]
- Verde, F. Tau proteins in blood as biomarkers of Alzheimer’s disease and other proteinopathies. J. Neural Transm. 2022, 129, 239–259. [Google Scholar] [CrossRef]
- Kulichikhin, K.Y.; Fedotov, S.A.; Rubel, M.S.; Zalutskaya, N.M.; Zobnina, A.E.; Malikova, O.A.; Neznanov, N.G.; Chernoff, Y.O.; Rubel, A.A. Development of molecular tools for diagnosis of Alzheimer’s disease that are based on detection of amyloidogenic proteins. Prion 2021, 15, 56–69. [Google Scholar] [CrossRef] [PubMed]
- Mankhong, S.; Kim, S.; Lee, S.; Kwak, H.B.; Park, D.H.; Joa, K.L.; Kang, J.H. Development of Alzheimer’s Disease Biomarkers: From CSF- to Blood-Based Biomarkers. Biomedicines 2022, 10, 850. [Google Scholar] [CrossRef] [PubMed]
- Morris, G.P.; Clark, I.A.; Vissel, B. Inconsistencies and controversies surrounding the amyloid hypothesis of Alzheimer’s disease. Acta Neuropathol. Commun. 2014, 2, 135. [Google Scholar] [CrossRef]
- Kim, K.Y.; Shin, K.Y.; Chang, K.A. Brain-Derived Exosomal Proteins as Effective Biomarkers for Alzheimer’s Disease: A Systematic Review and Meta-Analysis. Biomolecules 2021, 11, 980. [Google Scholar] [CrossRef] [PubMed]
- Alvarez, A.; Toro, R.; Caceres, A.; Maccioni, R.B. Inhibition of tau phosphorylating protein kinase cdk5 prevents beta-amyloid-induced neuronal death. FEBS Lett. 1999, 459, 421–426. [Google Scholar] [CrossRef] [PubMed]
- Alvarez, R.; Alvarez, V.; Lahoz, C.H.; Martinez, C.; Pena, J.; Sanchez, J.M.; Guisasola, L.M.; Salas-Puig, J.; Moris, G.; Vidal, J.A.; et al. Angiotensin converting enzyme and endothelial nitric oxide synthase DNA polymorphisms and late onset Alzheimer’s disease. J. Neurol. Neurosurg. Psychiatry 1999, 67, 733–736. [Google Scholar] [CrossRef] [PubMed]
- Ittner, L.M.; Gotz, J. Amyloid-beta and tau--a toxic pas de deux in Alzheimer’s disease. Nat. Rev. Neurosci. 2011, 12, 65–72. [Google Scholar] [CrossRef]
- Guzman-Martinez, L.; Maccioni, R.B.; Andrade, V.; Navarrete, L.P.; Pastor, M.G.; Ramos-Escobar, N. Neuroinflammation as a Common Feature of Neurodegenerative Disorders. Front. Pharmacol. 2019, 10, 1008. [Google Scholar] [CrossRef]
- Blennow, K. A Review of Fluid Biomarkers for Alzheimer’s Disease: Moving from CSF to Blood. Neurol. Ther. 2017, 6, 15–24. [Google Scholar] [CrossRef]
- Simpson, J.E.; Ince, P.G.; Lace, G.; Forster, G.; Shaw, P.J.; Matthews, F.; Savva, G.; Brayne, C.; Wharton, S.B.; Function, M.R.C.C.; et al. Astrocyte phenotype in relation to Alzheimer-type pathology in the ageing brain. Neurobiol. Aging 2010, 31, 578–590. [Google Scholar] [CrossRef]
- Teunissen, C.E.; Verberk, I.M.W.; Thijssen, E.H.; Vermunt, L.; Hansson, O.; Zetterberg, H.; van der Flier, W.M.; Mielke, M.M.; Del Campo, M. Blood-based biomarkers for Alzheimer’s disease: Towards clinical implementation. Lancet Neurol. 2022, 21, 66–77. [Google Scholar] [CrossRef] [PubMed]
- Wilhelmsson, U.; Bushongt, E.A.; Price, D.L.; Smarr, B.L.; Phung, V.; Terada, M.; Ellisman, M.H.; Pekny, M. Redefining the concept of reactive astrocytes as cells that remain within their unique domains upon reaction to injury. Proc. Natl. Acad. Sci. USA 2006, 103, 17513–17518. [Google Scholar] [CrossRef]
- Heneka, M.T.; Rodriguez, J.J.; Verkhratsky, A. Neuroglia in neurodegeneration. Brain Res. Rev. 2010, 63, 189–211. [Google Scholar] [CrossRef] [PubMed]
- Carter, S.F.; Scholl, M.; Almkvist, O.; Wall, A.; Engler, H.; Langstrom, B.; Nordberg, A. Evidence for astrocytosis in prodromal Alzheimer disease provided by 11C-deuterium-L-deprenyl: A multitracer PET paradigm combining 11C-Pittsburgh compound B and 18F-FDG. J. Nucl. Med. 2012, 53, 37–46. [Google Scholar] [CrossRef] [PubMed]
- Carter, S.F.; Herholz, K.; Rosa-Neto, P.; Pellerin, L.; Nordberg, A.; Zimmer, E.R. Astrocyte Biomarkers in Alzheimer’s Disease. Trends Mol. Med. 2019, 25, 77–95. [Google Scholar] [CrossRef] [PubMed]
- Marutle, A.; Gillberg, P.G.; Bergfors, A.; Yu, W.; Ni, R.; Nennesmo, I.; Voytenko, L.; Nordberg, A. (3)H-deprenyl and (3)H-PIB autoradiography show different laminar distributions of astroglia and fibrillar beta-amyloid in Alzheimer brain. J. Neuroinflamm. 2013, 10, 90. [Google Scholar] [CrossRef]
- Rodriguez-Vieitez, E.; Ni, R.; Gulyas, B.; Toth, M.; Haggkvist, J.; Halldin, C.; Voytenko, L.; Marutle, A.; Nordberg, A. Astrocytosis precedes amyloid plaque deposition in Alzheimer APPswe transgenic mouse brain: A correlative positron emission tomography and in vitro imaging study. Eur. J. Nucl. Med. Mol. Imaging 2015, 42, 1119–1132. [Google Scholar] [CrossRef]
- Rodriguez-Vieitez, E.; Saint-Aubert, L.; Carter, S.F.; Almkvist, O.; Farid, K.; Scholl, M.; Chiotis, K.; Thordardottir, S.; Graff, C.; Wall, A.; et al. Diverging longitudinal changes in astrocytosis and amyloid PET in autosomal dominant Alzheimer’s disease. Brain 2016, 139, 922–936. [Google Scholar] [CrossRef]
- Scholl, M.; Carter, S.F.; Westman, E.; Rodriguez-Vieitez, E.; Almkvist, O.; Thordardottir, S.; Wall, A.; Graff, C.; Langstrom, B.; Nordberg, A. Early astrocytosis in autosomal dominant Alzheimer’s disease measured in vivo by multi-tracer positron emission tomography. Sci. Rep. 2015, 5, 16404. [Google Scholar] [CrossRef]
- Kumar, A.; Fontana, I.C.; Nordberg, A. Reactive astrogliosis: A friend or foe in the pathogenesis of Alzheimer’s disease. J. Neurochem. 2021, 164, 309–324. [Google Scholar] [CrossRef]
- Baiardi, S.; Quadalti, C.; Mammana, A.; Dellavalle, S.; Zenesini, C.; Sambati, L.; Pantieri, R.; Polischi, B.; Romano, L.; Suffritti, M.; et al. Diagnostic value of plasma p-tau181, NfL, and GFAP in a clinical setting cohort of prevalent neurodegenerative dementias. Alzheimers Res. Ther. 2022, 14, 153. [Google Scholar] [CrossRef] [PubMed]
- Benedet, A.L.; Milà-Alomà, M.; Vrillon, A.; Ashton, N.J.; Pascoal, T.A.; Lussier, F.; Karikari, T.K.; Hourregue, C.; Cognat, E.; Dumurgier, J.; et al. Differences between Plasma and Cerebrospinal Fluid Glial Fibrillary Acidic Protein Levels across the Alzheimer Disease Continuum. JAMA Neurol. 2021, 78, 1471–1483. [Google Scholar] [CrossRef] [PubMed]
- Oeckl, P.; Halbgebauer, S.; Anderl-Straub, S.; Steinacker, P.; Huss, A.M.; Neugebauer, H.; von Arnim, C.A.F.; Diehl-Schmid, J.; Grimmer, T.; Kornhuber, J.; et al. Glial Fibrillary Acidic Protein in Serum is Increased in Alzheimer’s Disease and Correlates with Cognitive Impairment. J. Alzheimers Dis. 2019, 67, 481–488. [Google Scholar] [CrossRef]
- Page, M.J.; McKenzie, J.E.; Bossuyt, P.M.; Boutron, I.; Hoffmann, T.C.; Mulrow, C.D.; Shamseer, L.; Tetzlaff, J.M.; Akl, E.A.; Brennan, S.E.; et al. The PRISMA 2020 statement: An updated guideline for reporting systematic reviewsDeclaracion PRISMA 2020: Una guia actualizada para la publicacion de revisiones sistematicas. Rev. Panam. Salud Publica 2022, 46, e112. [Google Scholar] [CrossRef]
- Asken, B.M.; Elahi, F.M.; La Joie, R.; Strom, A.; Staffaroni, A.M.; Lindbergh, C.A.; Apple, A.C.; You, M.; Weiner-Light, S.; Brathaban, N.; et al. Plasma Glial Fibrillary Acidic Protein Levels Differ Along the Spectra of Amyloid Burden and Clinical Disease Stage (vol 78, pg 265, 2020). J. Alzheimers Dis. 2021, 80, 471–474. [Google Scholar] [CrossRef]
- Benedet, A.L.; Brum, W.S.; Hansson, O.; Initiative, A.D.N.; Karikari, T.K.; Zimmer, E.R.; Zetterberg, H.; Blennow, K.; Ashton, N.J. The accuracy and robustness of plasma biomarker models for amyloid PET positivity. Alzheimers Res. Ther. 2022, 14, 26. [Google Scholar] [CrossRef] [PubMed]
- Benussi, A.; Ashton, N.J.; Karikari, T.K.; Gazzina, S.; Premi, E.; Benussi, L.; Ghidoni, R.; Rodriguez, J.L.; Emeršič, A.; Binetti, G.; et al. Serum Glial Fibrillary Acidic Protein (GFAP) Is a Marker of Disease Severity in Frontotemporal Lobar Degeneration. J. Alzheimer’s Dis. 2020, 77, 1129–1141. [Google Scholar] [CrossRef] [PubMed]
- Bettcher, B.M.; Olson, K.E.; Carlson, N.E.; McConnell, B.V.; Boyd, T.; Adame, V.; Solano, D.A.; Anton, P.; Markham, N.; Thaker, A.A.; et al. Astrogliosis and episodic memory in late life: Higher GFAP is related to worse memory and white matter microstructure in healthy aging and Alzheimer’s disease. Neurobiol. Aging 2021, 103, 68–77. [Google Scholar] [CrossRef]
- Beyer, L.; Stocker, H.; Rujescu, D.; Holleczek, B.; Stockmann, J.; Nabers, A.; Brenner, H.; Gerwert, K. Amyloid-beta misfolding and GFAP predict risk of clinical Alzheimer’s disease diagnosis within 17 years. Alzheimer’s Dement. 2022, 19, 1020–1028. [Google Scholar] [CrossRef]
- Chatterjee, P.; Pedrini, S.; Stoops, E.; Goozee, K.; Villemagne, V.L.; Asih, P.R.; Verberk, I.M.W.; Dave, P.; Taddei, K.; Sohrabi, H.R.; et al. Plasma glial fibrillary acidic protein is elevated in cognitively normal older adults at risk of Alzheimer’s disease. Transl. Psychiatry 2021, 11, 27. [Google Scholar] [CrossRef]
- Chatterjee, P.; Pedrini, S.; Ashton, N.J.; Tegg, M.; Goozee, K.; Singh, A.K.; Karikari, T.K.; Simrén, J.; Vanmechelen, E.; Armstrong, N.J.; et al. Diagnostic and prognostic plasma biomarkers for preclinical Alzheimer’s disease. Alzheimer’s Dement. 2021, 18, 1141–1154. [Google Scholar] [CrossRef] [PubMed]
- Chatterjee, P.; Pedrini, S.; Doecke, J.D.; Thota, R.; Villemagne, V.L.; Doré, V.; Singh, A.K.; Wang, P.; Rainey-Smith, S.; Fowler, C.; et al. Plasma Aβ42/40 ratio, p-tau181, GFAP, and NfL across the Alzheimer’s disease continuum: A cross-sectional and longitudinal study in the AIBL cohort. Alzheimer’s Dement. 2022, 19, 1117–1134. [Google Scholar] [CrossRef]
- Chouliaras, L.; Thomas, A.; Malpetti, M.; Donaghy, P.; Kane, J.; Mak, E.; Savulich, G.; Prats-Sedano, M.A.; Heslegrave, A.J.; Zetterberg, H.; et al. Differential levels of plasma biomarkers of neurodegeneration in Lewy body dementia, Alzheimer’s disease, frontotemporal dementia and progressive supranuclear palsy. J. Neurol. Neurosurg. Psychiatry 2022, 93, 651–658. [Google Scholar] [CrossRef] [PubMed]
- Cicognola, C.; Janelidze, S.; Hertze, J.; Zetterberg, H.; Blennow, K.; Mattsson-Carlgren, N.; Hansson, O. Plasma glial fibrillary acidic protein detects Alzheimer pathology and predicts future conversion to Alzheimer dementia in patients with mild cognitive impairment. Alzheimer’s Res. Ther. 2021, 13, 68. [Google Scholar] [CrossRef]
- Ebenau, J.L.; Pelkmans, W.; Verberk, I.M.W.; Verfaillie, S.C.J.; Van Den Bosch, K.A.; Van Leeuwenstijn, M.; Collij, L.E.; Scheltens, P.; Prins, N.D.; Barkhof, F.; et al. Association of CSF, Plasma, and Imaging Markers of Neurodegeneration with Clinical Progression in People with Subjective Cognitive Decline. Neurology 2022, 98, E1315–E1326. [Google Scholar] [CrossRef]
- Frontera, J.A.; Boutajangout, A.; Masurkar, A.V.; Betensky, R.A.; Ge, Y.; Vedvyas, A.; Debure, L.; Moreira, A.; Lewis, A.; Huang, J.; et al. Comparison of serum neurodegenerative biomarkers among hospitalized COVID-19 patients versus non-COVID subjects with normal cognition, mild cognitive impairment, or Alzheimer’s dementia. Alzheimer’s Dement. 2022, 18, 899–910. [Google Scholar] [CrossRef]
- Gonzales, M.M.; Short, M.I.; Satizabal, C.L.; O’ Bryant, S.; Tracy, R.P.; Zare, H.; Seshadri, S. Blood biomarkers for dementia in Hispanic and non-Hispanic White adults. Alzheimer’s Dement. Transl. Res. Clin. Interv. 2021, 7, e12164. [Google Scholar] [CrossRef]
- Gonzales, M.M.; Wang, C.P.; Short, M.I.; Parent, D.M.; Kautz, T.; MacCarthy, D.; Satizabal, C.L.; González, D.A.; Royall, D.R.; Zare, H.; et al. Blood biomarkers for cognitive decline and clinical progression in a Mexican American cohort. Alzheimers Dement. 2022, 14, e12298. [Google Scholar] [CrossRef]
- Abdelhak, A.; Foschi, M.; Abu-Rumeileh, S.; Yue, J.K.; D’Anna, L.; Huss, A.; Oeckl, P.; Ludolph, A.C.; Kuhle, J.; Petzold, A.; et al. Blood GFAP as an emerging biomarker in brain and spinal cord disorders. Nat. Rev. Neurol. 2022, 18, 158–172. [Google Scholar] [CrossRef]
- Oeckl, P.; Anderl-Straub, S.; Von Arnim, C.A.F.; Baldeiras, I.; Diehl-Schmid, J.; Grimmer, T.; Halbgebauer, S.; Kort, A.M.; Lima, M.; Marques, T.M.; et al. Serum GFAP differentiates Alzheimer’s disease from frontotemporal dementia and predicts MCI-to-dementia conversion. J. Neurol. Neurosurg. Psychiatry 2022, 93, 659–667. [Google Scholar] [CrossRef] [PubMed]
- Palmqvist, S.; Stomrud, E.; Cullen, N.; Janelidze, S.; Manuilova, E.; Jethwa, A.; Bittner, T.; Eichenlaub, U.; Suridjan, I.; Kollmorgen, G.; et al. An accurate fully automated panel of plasma biomarkers for Alzheimer’s disease. Alzheimers Dement. 2022, 19, 1204–1215. [Google Scholar] [CrossRef]
- Parvizi, T.; Konig, T.; Wurm, R.; Silvaieh, S.; Altmann, P.; Klotz, S.; Rommer, P.S.; Furtner, J.; Regelsberger, G.; Lehrner, J.; et al. Real-world applicability of glial fibrillary acidic protein and neurofilament light chain in Alzheimer’s disease. Front. Aging Neurosci. 2022, 14, 887498. [Google Scholar] [CrossRef] [PubMed]
- Pereira, J.B.; Janelidze, S.; Smith, R.; Mattsson-Carlgren, N.; Palmqvist, S.; Teunissen, C.E.; Zetterberg, H.; Stomrud, E.; Ashton, N.J.; Blennow, K.; et al. Plasma GFAP is an early marker of amyloid-beta but not tau pathology in Alzheimer’s disease. Brain 2021, 144, 3505–3516. [Google Scholar] [CrossRef] [PubMed]
- Pichet Binette, A.; Palmqvist, S.; Bali, D.; Farrar, G.; Buckley, C.J.; Wolk, D.A.; Zetterberg, H.; Blennow, K.; Janelidze, S.; Hansson, O. Combining plasma phospho-tau and accessible measures to evaluate progression to Alzheimer’s dementia in mild cognitive impairment patients. Alzheimers Res. Ther. 2022, 14, 46. [Google Scholar] [CrossRef]
- Prins, S.; de Kam, M.L.; Teunissen, C.E.; Groeneveld, G.J. Inflammatory plasma biomarkers in subjects with preclinical Alzheimer’s disease. Alzheimers Res. Ther. 2022, 14, 106. [Google Scholar] [CrossRef] [PubMed]
- Salvado, G.; Mila-Aloma, M.; Shekari, M.; Ashton, N.J.; Operto, G.; Falcon, C.; Cacciaglia, R.; Minguillon, C.; Fauria, K.; Ninerola-Baizan, A.; et al. Reactive astrogliosis is associated with higher cerebral glucose consumption in the early Alzheimer’s continuum. Eur. J. Nucl. Med. Mol. Imaging 2022, 49, 4567–4579. [Google Scholar] [CrossRef] [PubMed]
- Shir, D.; Graff-Radford, J.; Hofrenning, E.I.; Lesnick, T.G.; Przybelski, S.A.; Lowe, V.J.; Knopman, D.S.; Petersen, R.C.; Jack, C.R., Jr.; Vemuri, P.; et al. Association of plasma glial fibrillary acidic protein (GFAP) with neuroimaging of Alzheimer’s disease and vascular pathology. Alzheimers Dement. 2022, 14, e12291. [Google Scholar] [CrossRef] [PubMed]
- Simren, J.; Leuzy, A.; Karikari, T.K.; Hye, A.; Benedet, A.L.; Lantero-Rodriguez, J.; Mattsson-Carlgren, N.; Scholl, M.; Mecocci, P.; Vellas, B.; et al. The diagnostic and prognostic capabilities of plasma biomarkers in Alzheimer’s disease. Alzheimers Dement. 2021, 17, 1145–1156. [Google Scholar] [CrossRef]
- Simren, J.; Weninger, H.; Brum, W.S.; Khalil, S.; Benedet, A.L.; Blennow, K.; Zetterberg, H.; Ashton, N.J. Differences between blood and cerebrospinal fluid glial fibrillary Acidic protein levels: The effect of sample stability. Alzheimers Dement. 2022, 18, 1988–1992. [Google Scholar] [CrossRef]
- Stevenson-Hoare, J.; Heslegrave, A.; Leonenko, G.; Fathalla, D.; Bellou, E.; Luckcuck, L.; Marshall, R.; Sims, R.; Morgan, B.P.; Hardy, J.; et al. Plasma biomarkers and genetics in the diagnosis and prediction of Alzheimer’s disease. Brain 2023, 146, 690–699. [Google Scholar] [CrossRef]
- Stocker, H.; Beyer, L.; Perna, L.; Rujescu, D.; Holleczek, B.; Beyreuther, K.; Stockmann, J.; Schottker, B.; Gerwert, K.; Brenner, H. Association of plasma biomarkers, p-tau181, glial fibrillary acidic protein, and neurofilament light, with intermediate and long-term clinical Alzheimer’s disease risk: Results from a prospective cohort followed over 17 years. Alzheimers Dement. 2023, 19, 25–35. [Google Scholar] [CrossRef] [PubMed]
- Thijssen, E.H.; Verberk, I.M.W.; Kindermans, J.; Abramian, A.; Vanbrabant, J.; Ball, A.J.; Pijnenburg, Y.; Lemstra, A.W.; van der Flier, W.M.; Stoops, E.; et al. Differential diagnostic performance of a panel of plasma biomarkers for different types of dementia. Alzheimers Dement. 2022, 14, e12285. [Google Scholar] [CrossRef] [PubMed]
- Verberk, I.M.W.; Thijssen, E.; Koelewijn, J.; Mauroo, K.; Vanbrabant, J.; de Wilde, A.; Zwan, M.D.; Verfaillie, S.C.J.; Ossenkoppele, R.; Barkhof, F.; et al. Combination of plasma amyloid beta((1-42/1-40)) and glial fibrillary acidic protein strongly associates with cerebral amyloid pathology. Alzheimers Res. Ther. 2020, 12, 118. [Google Scholar] [CrossRef] [PubMed]
- Balasa, A.F.; Chircov, C.; Grumezescu, A.M. Body Fluid Biomarkers for Alzheimer’s Disease-An Up-To-Date Overview. Biomedicines 2020, 8, 421. [Google Scholar] [CrossRef]
- Paraskevaidi, M.; Allsop, D.; Karim, S.; Martin, F.L.; Crean, S. Diagnostic Biomarkers for Alzheimer’s Disease Using Non-Invasive Specimens. J. Clin. Med. 2020, 9, 1673. [Google Scholar] [CrossRef]
- Omar, S.H.; Preddy, J. Advantages and Pitfalls in Fluid Biomarkers for Diagnosis of Alzheimer’s Disease. J. Pers. Med. 2020, 10, 63. [Google Scholar] [CrossRef]
- Khan, S.; Barve, K.H.; Kumar, M.S. Recent Advancements in Pathogenesis, Diagnostics and Treatment of Alzheimer’s Disease. Curr. Neuropharmacol. 2020, 18, 1106–1125. [Google Scholar] [CrossRef]
- Mantzavinos, V.; Alexiou, A. Biomarkers for Alzheimer’s Disease Diagnosis. Curr. Alzheimer Res. 2017, 14, 1149–1154. [Google Scholar] [CrossRef]
- Frisoni, G.B.; Boccardi, M.; Barkhof, F.; Blennow, K.; Cappa, S.; Chiotis, K.; Demonet, J.F.; Garibotto, V.; Giannakopoulos, P.; Gietl, A.; et al. Strategic roadmap for an early diagnosis of Alzheimer’s disease based on biomarkers. Lancet Neurol. 2017, 16, 661–676. [Google Scholar] [CrossRef]
- Rajan, K.; McAninch, E.A.; Aggarwal, N.; Barnes, L.L.; Wilson, R.; Weuve, J.; DeCarli, C.S.; Evans, D. Longitudinal Changes in Blood Biomarkers of Clinical Alzheimer Disease in a Biracial Population Sample. Neurology 2022, 100, e874–e883. [Google Scholar] [CrossRef]
- Foerch, C.; Niessner, M.; Back, T.; Bauerle, M.; De Marchis, G.M.; Ferbert, A.; Grehl, H.; Hamann, G.F.; Jacobs, A.; Kastrup, A.; et al. Diagnostic accuracy of plasma glial fibrillary acidic protein for differentiating intracerebral hemorrhage and cerebral ischemia in patients with symptoms of acute stroke. Clin. Chem. 2012, 58, 237–245. [Google Scholar] [CrossRef] [PubMed]
- Missler, U.; Wiesmann, M.; Wittmann, G.; Magerkurth, O.; Hagenstrom, H. Measurement of glial fibrillary acidic protein in human blood: Analytical method and preliminary clinical results. Clin. Chem. 1999, 45, 138–141. [Google Scholar] [CrossRef] [PubMed]
- Qin, T.; Prins, S.; Groeneveld, G.J.; Van Westen, G.; de Vries, H.E.; Wong, Y.C.; Bischoff, L.J.M.; de Lange, E.C.M. Utility of Animal Models to Understand Human Alzheimer’s Disease, Using the Mastermind Research Approach to Avoid Unnecessary Further Sacrifices of Animals. Int. J. Mol. Sci. 2020, 21, 3158. [Google Scholar] [CrossRef] [PubMed]
- Frost, G.R.; Li, Y.M. The role of astrocytes in amyloid production and Alzheimer’s disease. Open. Biol. 2017, 7, 170228. [Google Scholar] [CrossRef] [PubMed]
- Chmielewska, N.; Szyndler, J.; Makowska, K.; Wojtyna, D.; Maciejak, P.; Plaznik, A. Looking for novel, brain-derived, peripheral biomarkers of neurological disorders. Neurol. Neurochir. Pol. 2018, 52, 318–325. [Google Scholar] [CrossRef]
- Banks, W.A. Drug delivery to the brain in Alzheimer’s disease: Consideration of the blood-brain barrier. Adv. Drug. Deliv. Rev. 2012, 64, 629–639. [Google Scholar] [CrossRef]
- Mouser, P.E.; Head, E.; Ha, K.H.; Rohn, T.T. Caspase-mediated cleavage of glial fibrillary acidic protein within degenerating astrocytes of the Alzheimer’s disease brain. Am. J. Pathol. 2006, 168, 936–946. [Google Scholar] [CrossRef] [PubMed]
- Heimfarth, L.; Passos, F.R.S.; Monteiro, B.S.; Araujo, A.A.D.; Quintans, J.L.; Quintans, J.D.S. Serum glial fibrillary acidic protein is a body fluid biomarker: A valuable prognostic for neurological disease—A systematic review. Int. Immunopharmacol. 2022, 107, 108624. [Google Scholar] [CrossRef]
- Akiyama, H.; Barger, S.; Barnum, S.; Bradt, B.; Bauer, J.; Cole, G.M.; Cooper, N.R.; Eikelenboom, P.; Emmerling, M.; Fiebich, B.L.; et al. Inflammation and Alzheimer’s disease. Neurobiol. Aging 2000, 21, 383–421. [Google Scholar] [CrossRef]
- Rajan, K.B.; Aggarwal, N.T.; McAninch, E.A.; Weuve, J.; Barnes, L.L.; Wilson, R.S.; DeCarli, C.; Evans, D.A. Remote Blood Biomarkers of Longitudinal Cognitive Outcomes in a Population Study. Ann. Neurol. 2020, 88, 1065–1076. [Google Scholar] [CrossRef]
- Hansen, N.; Rauter, C.; Wiltfang, J. Blood Based Biomarker for Optimization of Early and Differential Diagnosis of Alzheimer’s Dementia. Fortschr. Neurol. Psyc 2022, 90, 326–335. [Google Scholar] [CrossRef]
- Hol, E.M.; Pekny, M. Glial fibrillary acidic protein (GFAP) and the astrocyte intermediate filament system in diseases of the central nervous system. Curr. Opin. Cell. Biol. 2015, 32, 121–130. [Google Scholar] [CrossRef] [PubMed]
- Jurga, A.M.; Paleczna, M.; Kadluczka, J.; Kuter, K.Z. Beyond the GFAP-Astrocyte Protein Markers in the Brain. Biomolecules 2021, 11, 1361. [Google Scholar] [CrossRef] [PubMed]
- Heller, C.; Foiani, M.S.; Moore, K.; Convery, R.; Bocchetta, M.; Neason, M.; Cash, D.M.; Thomas, D.; Greaves, C.V.; Woollacott, I.O.C.; et al. Plasma glial fibrillary acidic protein is raised in progranulin-associated frontotemporal dementia. J. Neurol. Neurosurg. Psychiatry 2020, 91, 263–270. [Google Scholar] [CrossRef]
- Mayer, C.A.; Brunkhorst, R.; Niessner, M.; Pfeilschifter, W.; Steinmetz, H.; Foerch, C. Blood levels of glial fibrillary acidic protein (GFAP) in patients with neurological diseases. PLoS ONE 2013, 8, e62101. [Google Scholar] [CrossRef]
- van Ballegoij, W.J.C.; van de Stadt, S.I.W.; Huffnagel, I.C.; Kemp, S.; Willemse, E.A.J.; Teunissen, C.E.; Engelen, M. Plasma NfL and GFAP as biomarkers of spinal cord degeneration in adrenoleukodystrophy. Ann. Clin. Transl. Neur 2020, 7, 2127–2136. [Google Scholar] [CrossRef]
- Lange, R.P.; Everett, A.; Dulloor, P.; Korley, F.K.; Bettegowda, C.; Blair, C.; Grossman, S.A.; Holdhoff, M. Evaluation of eight plasma proteins as candidate blood-based biomarkers for malignant gliomas. Cancer Investig. 2014, 32, 423–429. [Google Scholar] [CrossRef]
- Dvorak, F.; Haberer, I.; Sitzer, M.; Foerch, C. Characterisation of the diagnostic window of serum glial fibrillary acidic protein for the differentiation of intracerebral haemorrhage and ischaemic stroke. Cerebrovasc. Dis. 2009, 27, 37–41. [Google Scholar] [CrossRef]
- McGrath, E.R.; Beiser, A.S.; O’Donnell, A.; Yang, Q.; Ghosh, S.; Gonzales, M.M.; Himali, J.J.; Satizabal, C.L.; Johnson, K.A.; Tracy, R.P.; et al. Blood Phosphorylated Tau 181 as a Biomarker for Amyloid Burden on Brain PET in Cognitively Healthy Adults. J. Alzheimers Dis. 2022, 87, 1517–1526. [Google Scholar] [CrossRef]


| Author, Year | Country (Cohort) | Analyzed Group | N (M/F or Female, %) | Age (Mean (SD or Range or IQR)) | Blood | GFAP (Mean (SD or IQR)) | |||
|---|---|---|---|---|---|---|---|---|---|
| Control | Case | Control | Case | Control | Case | ||||
| Asken, 2021 [35] | USA | CN/MCI (Cohort1) | 39 (78%) | 11 (22%) | 72.7 (6.3) | 70.7 (8.6) | Plasma | 183 (140, 242), | 213 (168, 254) |
| CN/MCI/AD (Cohort2) | 32 (45%) | MCI: 18 (25%)/ AD: 21 (30%) | 75.4 (4.6) | MCI: 70.4 (11.2)/AD: 68.9 (11.2) | Plasma | 110 (75, 184) | MCI: 172 (151, 233)/AD: 167 (137, 265) | ||
| Benedet, 2021 [32] | Canada (TRIAD) | CU Aβ−/CU+ Aβ+/MCI Aβ+/AD | CU Aβ−: 114 (41/73)/CU Aβ+: 42 (13/29) | MCI Aβ+: 39 (18/21)/AD: 45 (24/21) | CU Aβ−: 69.9 (9.4)/CU Aβ+: 4.1 (7.7) | MCI Aβ+: 71.2 (7.7)/AD: 66.1 (9.7) | Plasma | CU Aβ−: 185.1 (93.5)/CU Aβ+: 285.0 (142.6) | MCI Aβ+: 332.5 (153.6)/AD: 388.1 (152.8) |
| Aβ− Aβ+ | Aβ−: 185.1 (95.5) | Aβ+: 285.0 (142.6) | |||||||
| Spain (ALFA) | CU−/CU+ | CU−: 249 (96/153)/CU+: 135 (54/81) | CU−: 60.5 (4.50)/ CU+: 62.2 (4.9) | Plasma | CU−: 121.9 (42.4)/CU+: 169.9 (78.5) | ||||
| France (BioCogBank) | CU Aβ−/MCI Aβ+/AD | 21 (7/14) | MCI Aβ+: 42 (16/26)/AD: 76 (39/47) | 64.4 (9.5) | MCI Aβ+: 72.4 (7.9)/AD: 72.2 (8.4) | Plasma | 161.2 (67.1) | MCI Aβ+: 368.6 (158.5)/AD: 376.4 (179.6) | |
| Benedet, 2022 [36] | USA/Canada (ADNI) | Aβ−/Aβ+ | 58 (34/24) | 60 (34/26) | 70.8 (66.5, 75.7) | 73.8 (69.9, 77.4) | Plasma | 113 (80.7, 154) | 164 (125, 223) |
| Benussi, 2020 [37] | Italy | HC/AD | 61 (20.6%) | 63 (31.7%) | 65.5 (12.3) | 75.5 (8.1) | Serum | 183.1 (93.7) | 394.8 (176.2) |
| Bettcher, 2022 [38] | USA | Asymptomatic/Symptomatic (MCI/AD) | 69 (21/48) | 45 (23/22) | 69.5 (6.4) | 71.7 (7.5) | Plasma | 148.1 (72.7) | 265.9 (125.6) |
| Beyer, 2022 [39] | Germany (ESTHER) | Con/AD (within 17 y) | 240 (114/126) | 68 (25/43) | 66.1 (4.6) | 68.8 (4.3) | Plasma | 99.6 (46.7) | 159.0 (111.1) |
| Chatterjee, 2021a [40] | Australia (KARVIAH) | Aβ−/Aβ+ | 63 (18/45) | 33 (13/20) | 77.41 (5.45) | 79.64 (5.20) | Plasma | 151.42 (58.49) | 240.12 (124.88) |
| Non-SMC Aβ−/Non-SMC Aβ+/SMC Aβ-/SMC Aβ+ | Non-SMC Aβ−: 14/Non-SMC Aβ+: 8 | SMC Aβ−: 49/SMC Aβ+: 25 | Non-SMC Aβ−: 146.83 (61.58)/Non-SMC Aβ+: 202.28 (63.81) | SMC Aβ−: 152.73 (58.18)/SMC Aβ+: 252.22 (137.75) | |||||
| Chatterjee, 2021b [41] | Australia (KARVIAH) | Aβ−/Aβ+ | 67 (19/48) | 33 (13/20) | 77.78 (5.56) | 79.00 (5.44) | 146.96 (49.48) | 211.39 (86.04) | |
| Chatterjee, 2022 [42] | Australia (AIBL) | SMCs Aβ−/SMCs Aβ+ | SMCs Aβ−: 52 (77.61%) | SMCs Aβ+: 24 (72.72%) | SMCs Aβ−: 147.85 (47.07) | SMCs Aβ+: 229.50 (93.49) | |||
| Chouliaras, 2022 [43] | UK (NIMROD/AMPLE/MIDAS/MILOS) | Con/MCI + AD | 73 (43/30) | 63 (43/20) | 70.2 (7.79) | 73.9 (7.80) | Plasma | 154 (96.5) | 243 (99.9) |
| LBD Aβ−/LBD Aβ+ | 30 (25/5) | 29 (23/6) | 73.9 (6.25) | 75.2 (6.75) | 179 (62.0) | 219 (85.9) | |||
| Cicognola, 2021 [44] | Sweden | Stable MCI Aβ−/Stable MCI Aβ+/MCI-AD Aβ+/MCI-other Aβ−/MCI-other Aβ+ | Stable MCI Aβ−: 58 (55%)/MCI-other Aβ-: 25 (44%) | Stable MCI Aβ+: 21 (48%)/MCI-AD Aβ+: 47 (75%)/MCI-other Aβ+: 9 (33%) | Stable MCI Aβ−: 69 (8)/MCI-other Aβ−: 73 (7) | Stable MCI Aβ+: 69 (6)/MCI-AD Aβ+: 76 (7)/MCI-other Aβ+: 74 (6) | Plasma | Stable MCI Aβ−: 36 (17)/MCI-other Aβ−: 42 (16) | Stable MCI Aβ+: 46 (25)/MCI-AD Aβ+: 67 (24)/MCI-other Aβ+: 52 (11) |
| Ebenau, 2022 [45] | Netherlands (ADC) | Stable/Progression | 337 (196/141), | 64 (38/26) | Serum | 190.8 (124.9) | 281.1 (128.6) | ||
| Frontera, 2021 [46] | USA (ADRC) | Normal/MCI/AD (COVID-19 patients) | 54 (19/35) | MCI: 54 (11/43)/AD: 53 (21/32) | 71 (65–76) | MCI: 77 (70–86)/AD: 82 (72–88) | Plasma | 111.4 | MCI: 152.5/AD: 257.1 |
| Gonzales, 2021 [47] | USA (TARCC) | CU/MCI/Dementia (Hispanic) | 711 (196/515) | MCI: 325(102/223)/Dementia: 157 (55/102) | 63 (8) | MCI: 70 (9)/Dementia: 75 (8) | Serum | 134 (98, 186) | MCI: 174 (120, 249)/Dementia: 279 (182, 432) |
| CU/MCI/Dementia (Non-Hispanic) | 184 (67/117) | MCI: 115 (62/52)/Dementia: 351 (162/189) | 72 (8) | MCI: 73 (9)/Dementia: 75 (9) | Serum | 206 (145, 367) | MCI: 253 (175, 380)/Dementia: 429 (308, 591) | ||
| Gonzales, 2022 [48] | USA (TARCC) | CU/MCI/Dementia | 479 (125/354) | MCI: 207 (67/140)/Dementia: 59 (20/39) | 63 (7) | MCI: 71 (8)/Dementia: 74 (8) | Serum | 136 (102, 189) | MCI: 179 (123, 261)/Dementia: 223 (160, 391) |
| Mila-Aloma, 2022 [49] | Spain (ALFA+) | Aβ−/Aβ+ | 262 (61.8) | 135 (60) | 60.6 (4.45) | 62.2 (4.91) | Plasma | 122 (42.8) | 170 (78.5) |
| Oeckl, 2022 [50] | Portugal/Netherlands/Germany | Con/MCI-AD/AD | 129 (66/63) | MCI-AD: 111 (47/64)/AD: 230 (91/139) | Con: 63 (57–69) | MCI-AD: 71 (64–74)/AD: 69 (62–76) | Serum | 167 (108–234) | MCI-AD: 300 (232–433)/AD: 375 (276–505) |
| Oeckl, 2019 [33] | Germany | Con/AD | 34 (25/9) | 28 (9/19) | 66 (57–74) | 71 (67–78) | Serum | 157 (126–218) | 376 (294–537) |
| Palmqvist, 2022 [51] | Germany (Panel A+ study) | Aβ−/Aβ+ | 117 (65/52) | 110 (48/62) | 63.6 (10.8) | 69.5 (7.9) | Plasma | 98.9 (86.3) | 155 (94) |
| Sweden (Swedish BioFINDER) | Aβ−/Aβ+ | 403 (187/216) | 290 (137/153) | 71.9 (5.6) | 73.0 (5.3) | 89.6 (59) | 130 (67) | ||
| Parvizi, 2022 [52] | Austria | HC/MCI | 44 (20/24) | 63 (34/29) | 61.2 (55.8, 69.5) | 69.9 (59.3, 77.8) | Plasma | 79 (53.7, 120.6) | 167.5 (93.8, 256.3) |
| HC/AD | 60 (24/36) | 69 (61.3, 75) | 181.9 (129.6, 269.6) | ||||||
| Pereira, 2021 [53] | Sweden (Swedish BioFINDER-2) | CU Aβ−/CU Aβ+/CI Aβ+/CI Aβ− | CU Aβ−: 217 (98/119)/ | CI Aβ−: 63 (36/27) | 63.8 (41.2–87.9) | 67.9 (45.2–83.4) | Plasma | 179.6 (31.1–534.9) | 166.9 (24.5–476.0) |
| CU Aβ+: 71 (35/36) | CI Aβ+: 78 (34/44) | 72.1 (51.0–88.7) | 73.0 (53.7–93.3) | 252.1 (86.1–672.9) | 262.6 (94.0–650.7) | ||||
| Pichet Binette, 2022 [54] | Sweden | Non-progression to AD/Progression to AD | 84 (46/38) | 26 (12/14) | 71.52 (8.20) | 74.77 (8.12) | Plasma | 164.69 (117.31) | 251.30 (115.21) |
| Prins, 2022 [55] | Netherlands | Aβ−/Aβ+ | 50 (29/21) | 50 (33/17) | 71.88 (4.45) | 73.4 (4.72) | Plasma | 134.0 (50.71) | 195.1 (87.13) |
| Salvadó, 2022 [56] | Spain (ALFA+) | Aβ−Tau−/Aβ+Tau−/Aβ+Tau+ | Aβ−Tau−: 202 (72/130) | Aβ+Tau−: 88 (39/49)/Aβ+Tau−: 24 (7/17) | Aβ−Tau−: 60.5 (4.3) | Aβ+Tau−: 61.7 (5.1)/Aβ+Tau−: 64.3 (4.7) | Plasma | Aβ−Tau−:121 (42) | Aβ+Tau−: 153 (66)/Aβ+Tau+: 201 (53) |
| Shir, 2022 [57] | USA | Aβ−/Aβ+ | 99 (57/42) | 101 (44/57) | 75 (9) | 81 (8) | Plasma | 134 (65) | 197 (83) |
| Simrén, 2021 [58] | Finland/Italy/Greece/UK/Poland/France (Add NeuroMed) | CU/MCI/AD | CU: 99 (46/53) | MCI: 107 (51/56)/AD: 103 (40/63) | CU:73 (6.14) | MCI: 74.47 (5.89)/AD: 76.35 (5.76) | Plasma | CU:125.23 (73.76) | MCI: 147.81 (81.14)/AD: 219.04 (136.1) |
| Simrén, 2022 [59] | Sweden | Aβ−/Aβ+ | 28 (17/11) | 21 (9/12) | 73.5 (62.8–76.3) | 73 (67.0–76.0) | Serum | 160 (115–282) | 231 (167–283) |
| Stevenson-Hoare, 2022 [60] | UK (ADCC) | Con/AD | 508 (221/287) | 1439 (748/691) | 82.2 (6.72) | 68.1 (8.03) | Plasma | 196 (85.3) | 215 (103) |
| Stocker, 2022 [61] | Germany (ESTHER) | Con/AD (0–17 y) | 507 (229/278) | 145 (56/89) | 61.2 (6.5) | 66.7 (5.2) | Plasma | 87.0 (46.7) | 133.3 (86.0) |
| Thijssen, 2022 [62] | Netherlands (Amsterdam Dementia) | Con/AD (Cohort1) | 40 (20/20) | 40 (20/20) | 56 (53–59) | 58 (55–59) | Plasma | 534 (342–693) | 1580 (1091–1970) |
| Con/AD (Cohort2) | 38 (18/20) | 38 (18/20) | 63 (59–66) | 63 (59–67) | 66.6 (47.1–85.9) | 119 (99.4–178) | |||
| Verberk, 2020 [63] | Netherlands (Amsterdam Dementia) | Aβ−/Aβ+ | 76 (49/27) | 176 (89/87) | 61 (9) | 63 (7) | Plasma | 96 (53) | 168 (77) |
Disclaimer/Publisher’s Note: The statements, opinions and data contained in all publications are solely those of the individual author(s) and contributor(s) and not of MDPI and/or the editor(s). MDPI and/or the editor(s) disclaim responsibility for any injury to people or property resulting from any ideas, methods, instructions or products referred to in the content. |
© 2023 by the authors. Licensee MDPI, Basel, Switzerland. This article is an open access article distributed under the terms and conditions of the Creative Commons Attribution (CC BY) license (https://creativecommons.org/licenses/by/4.0/).
Share and Cite
Kim, K.Y.; Shin, K.Y.; Chang, K.-A. GFAP as a Potential Biomarker for Alzheimer’s Disease: A Systematic Review and Meta-Analysis. Cells 2023, 12, 1309. https://doi.org/10.3390/cells12091309
Kim KY, Shin KY, Chang K-A. GFAP as a Potential Biomarker for Alzheimer’s Disease: A Systematic Review and Meta-Analysis. Cells. 2023; 12(9):1309. https://doi.org/10.3390/cells12091309
Chicago/Turabian StyleKim, Ka Young, Ki Young Shin, and Keun-A Chang. 2023. "GFAP as a Potential Biomarker for Alzheimer’s Disease: A Systematic Review and Meta-Analysis" Cells 12, no. 9: 1309. https://doi.org/10.3390/cells12091309