
The αMSH-Dependent PI3K Pathway Supports Energy Metabolism, via Glucose Uptake, in Melanoma Cells
 , , , , and
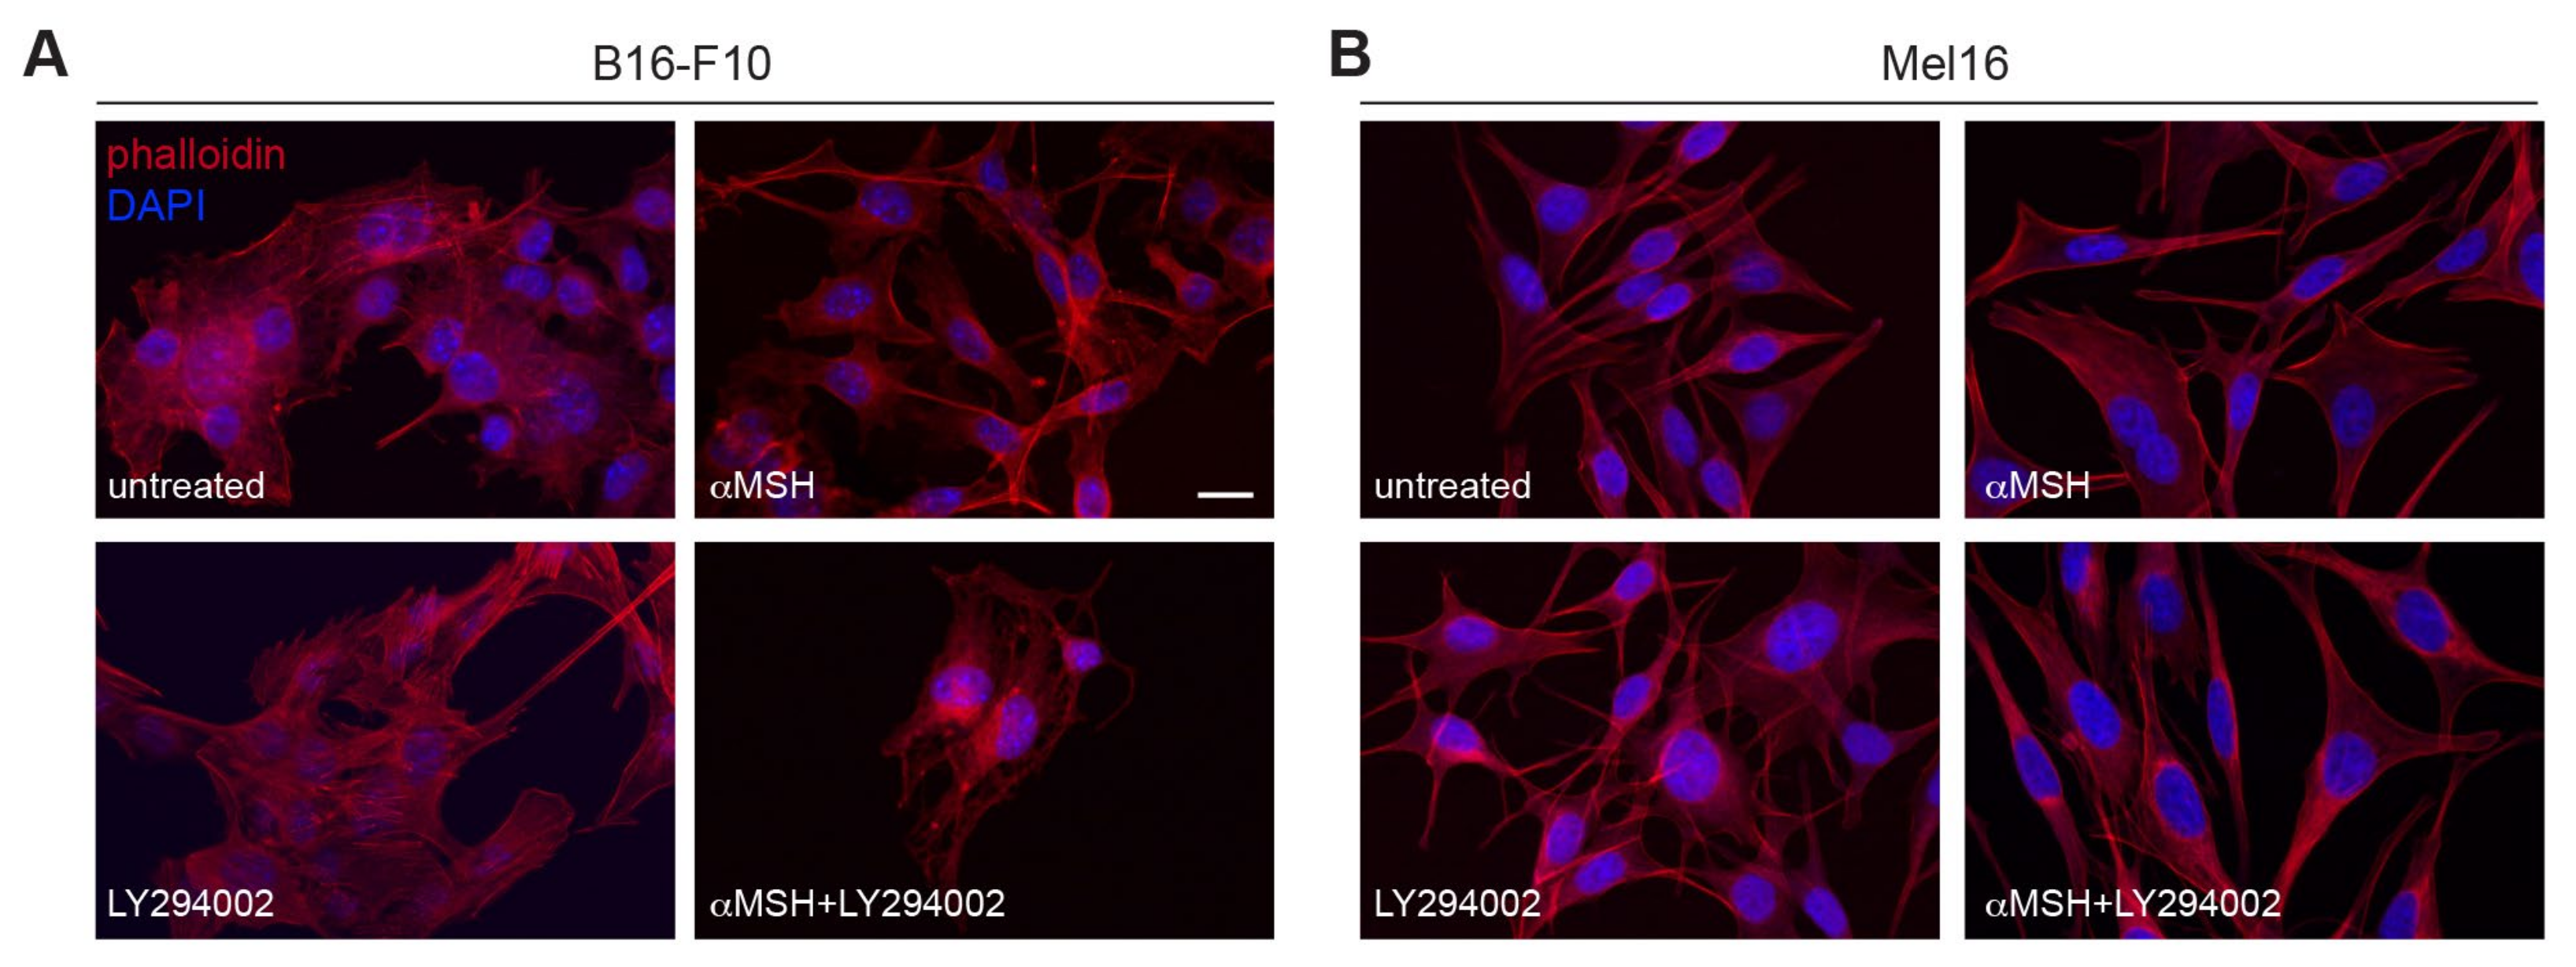
Abstract
:1. Introduction
2. Materials and Methods
2.1. Cell Cultures and Treatments
2.2. Cell Viability
2.3. Cellular ATP Content
2.4. Western Blot Analysis
2.5. Immunofluorescence Analysis
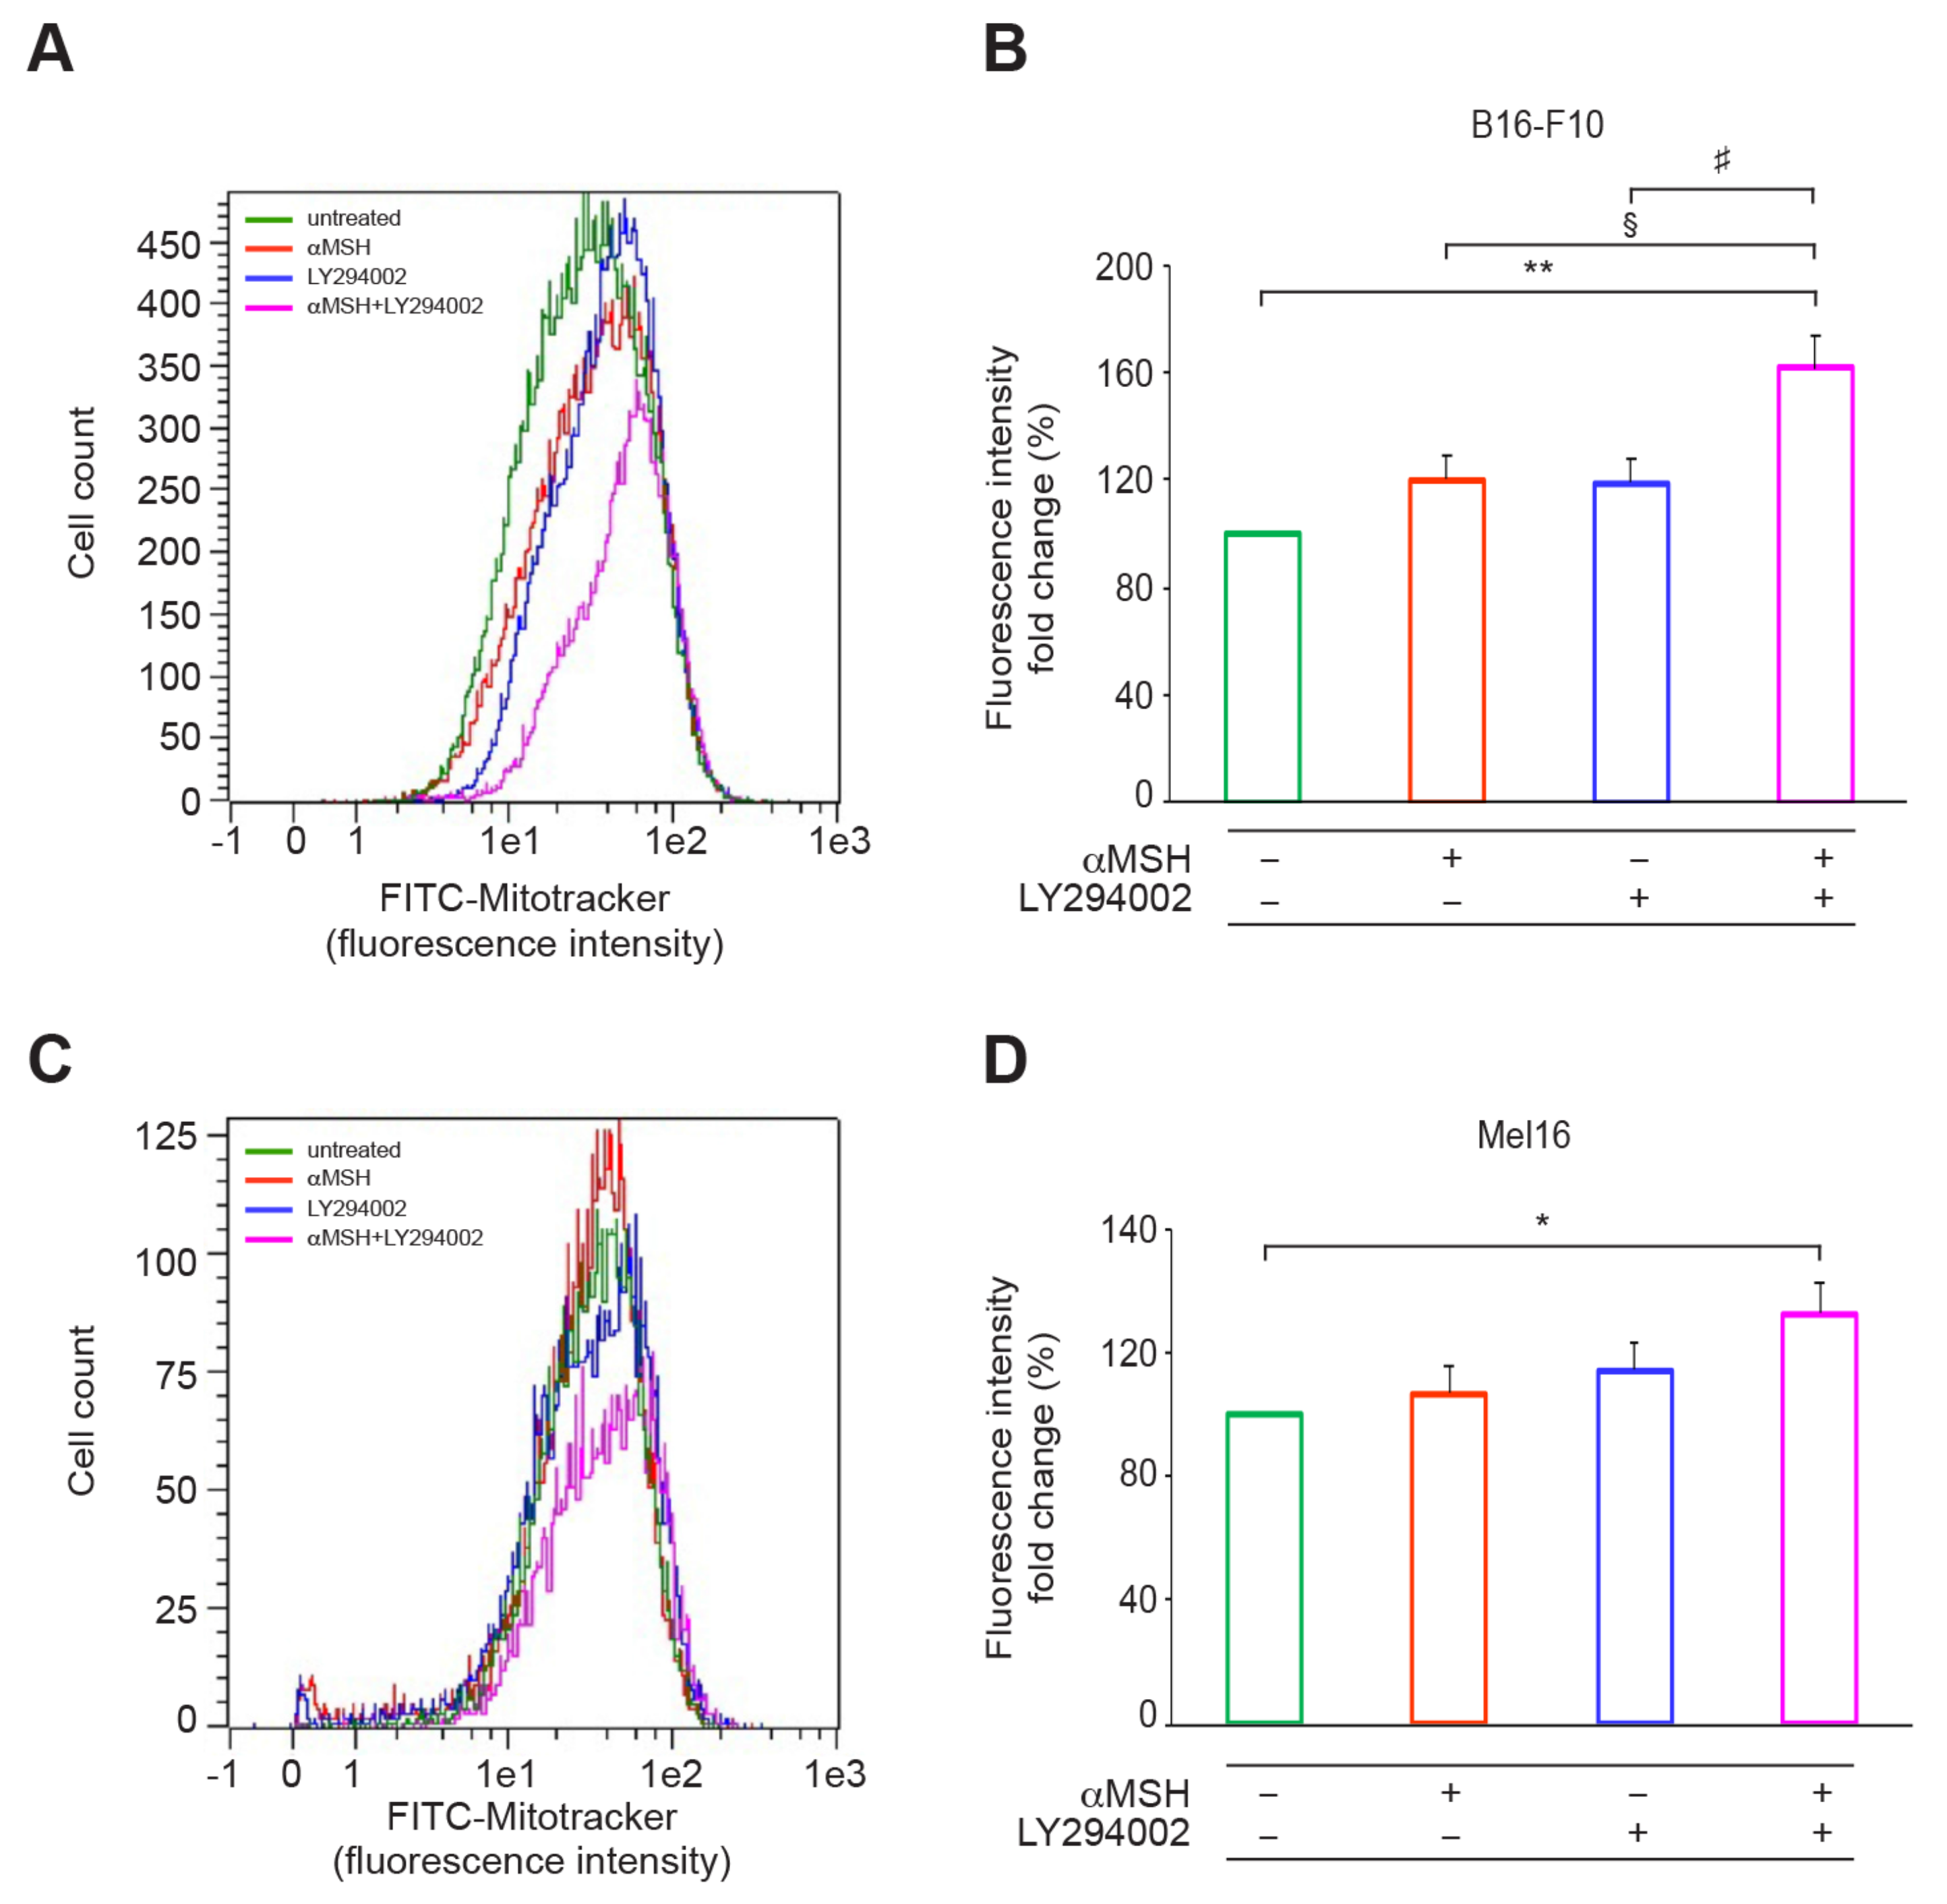
2.6. Analysis of Mitochondrial Mass
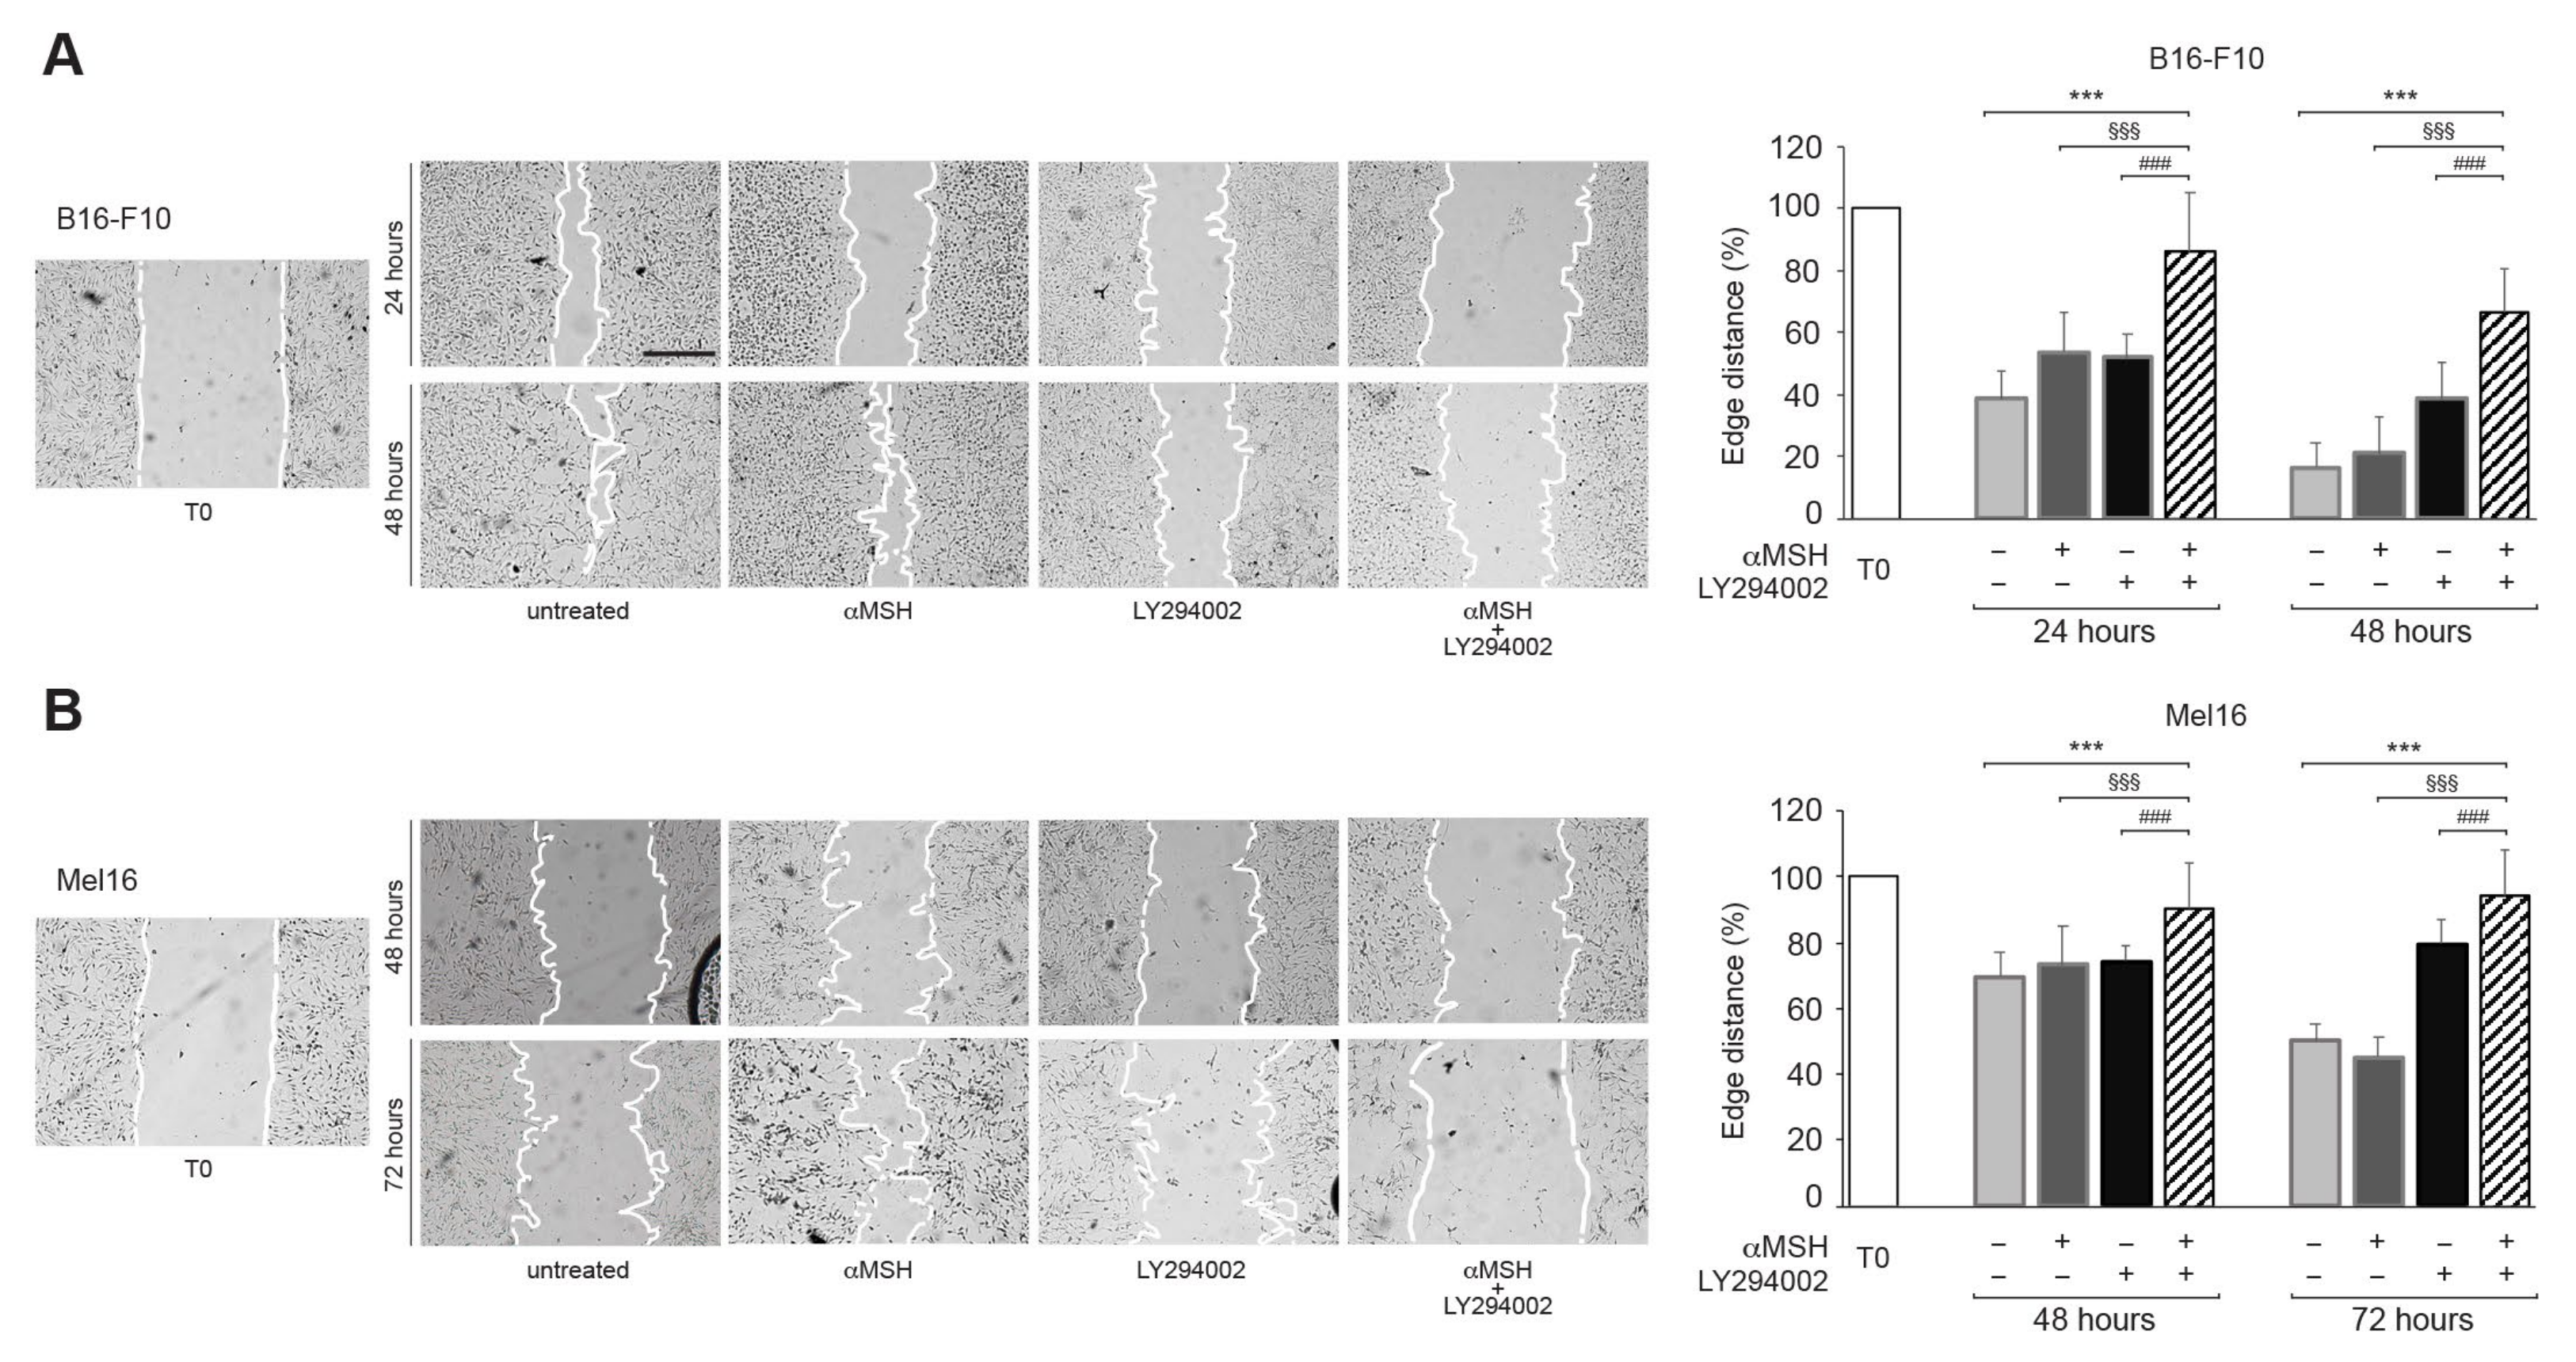
2.7. Scratch Assay
2.8. Statistical Analyses
3. Results
3.1. The αMSH-Mediated PI3K Pathway Exerts a Key Role in Maintaining the Cytoskeletal Integrity
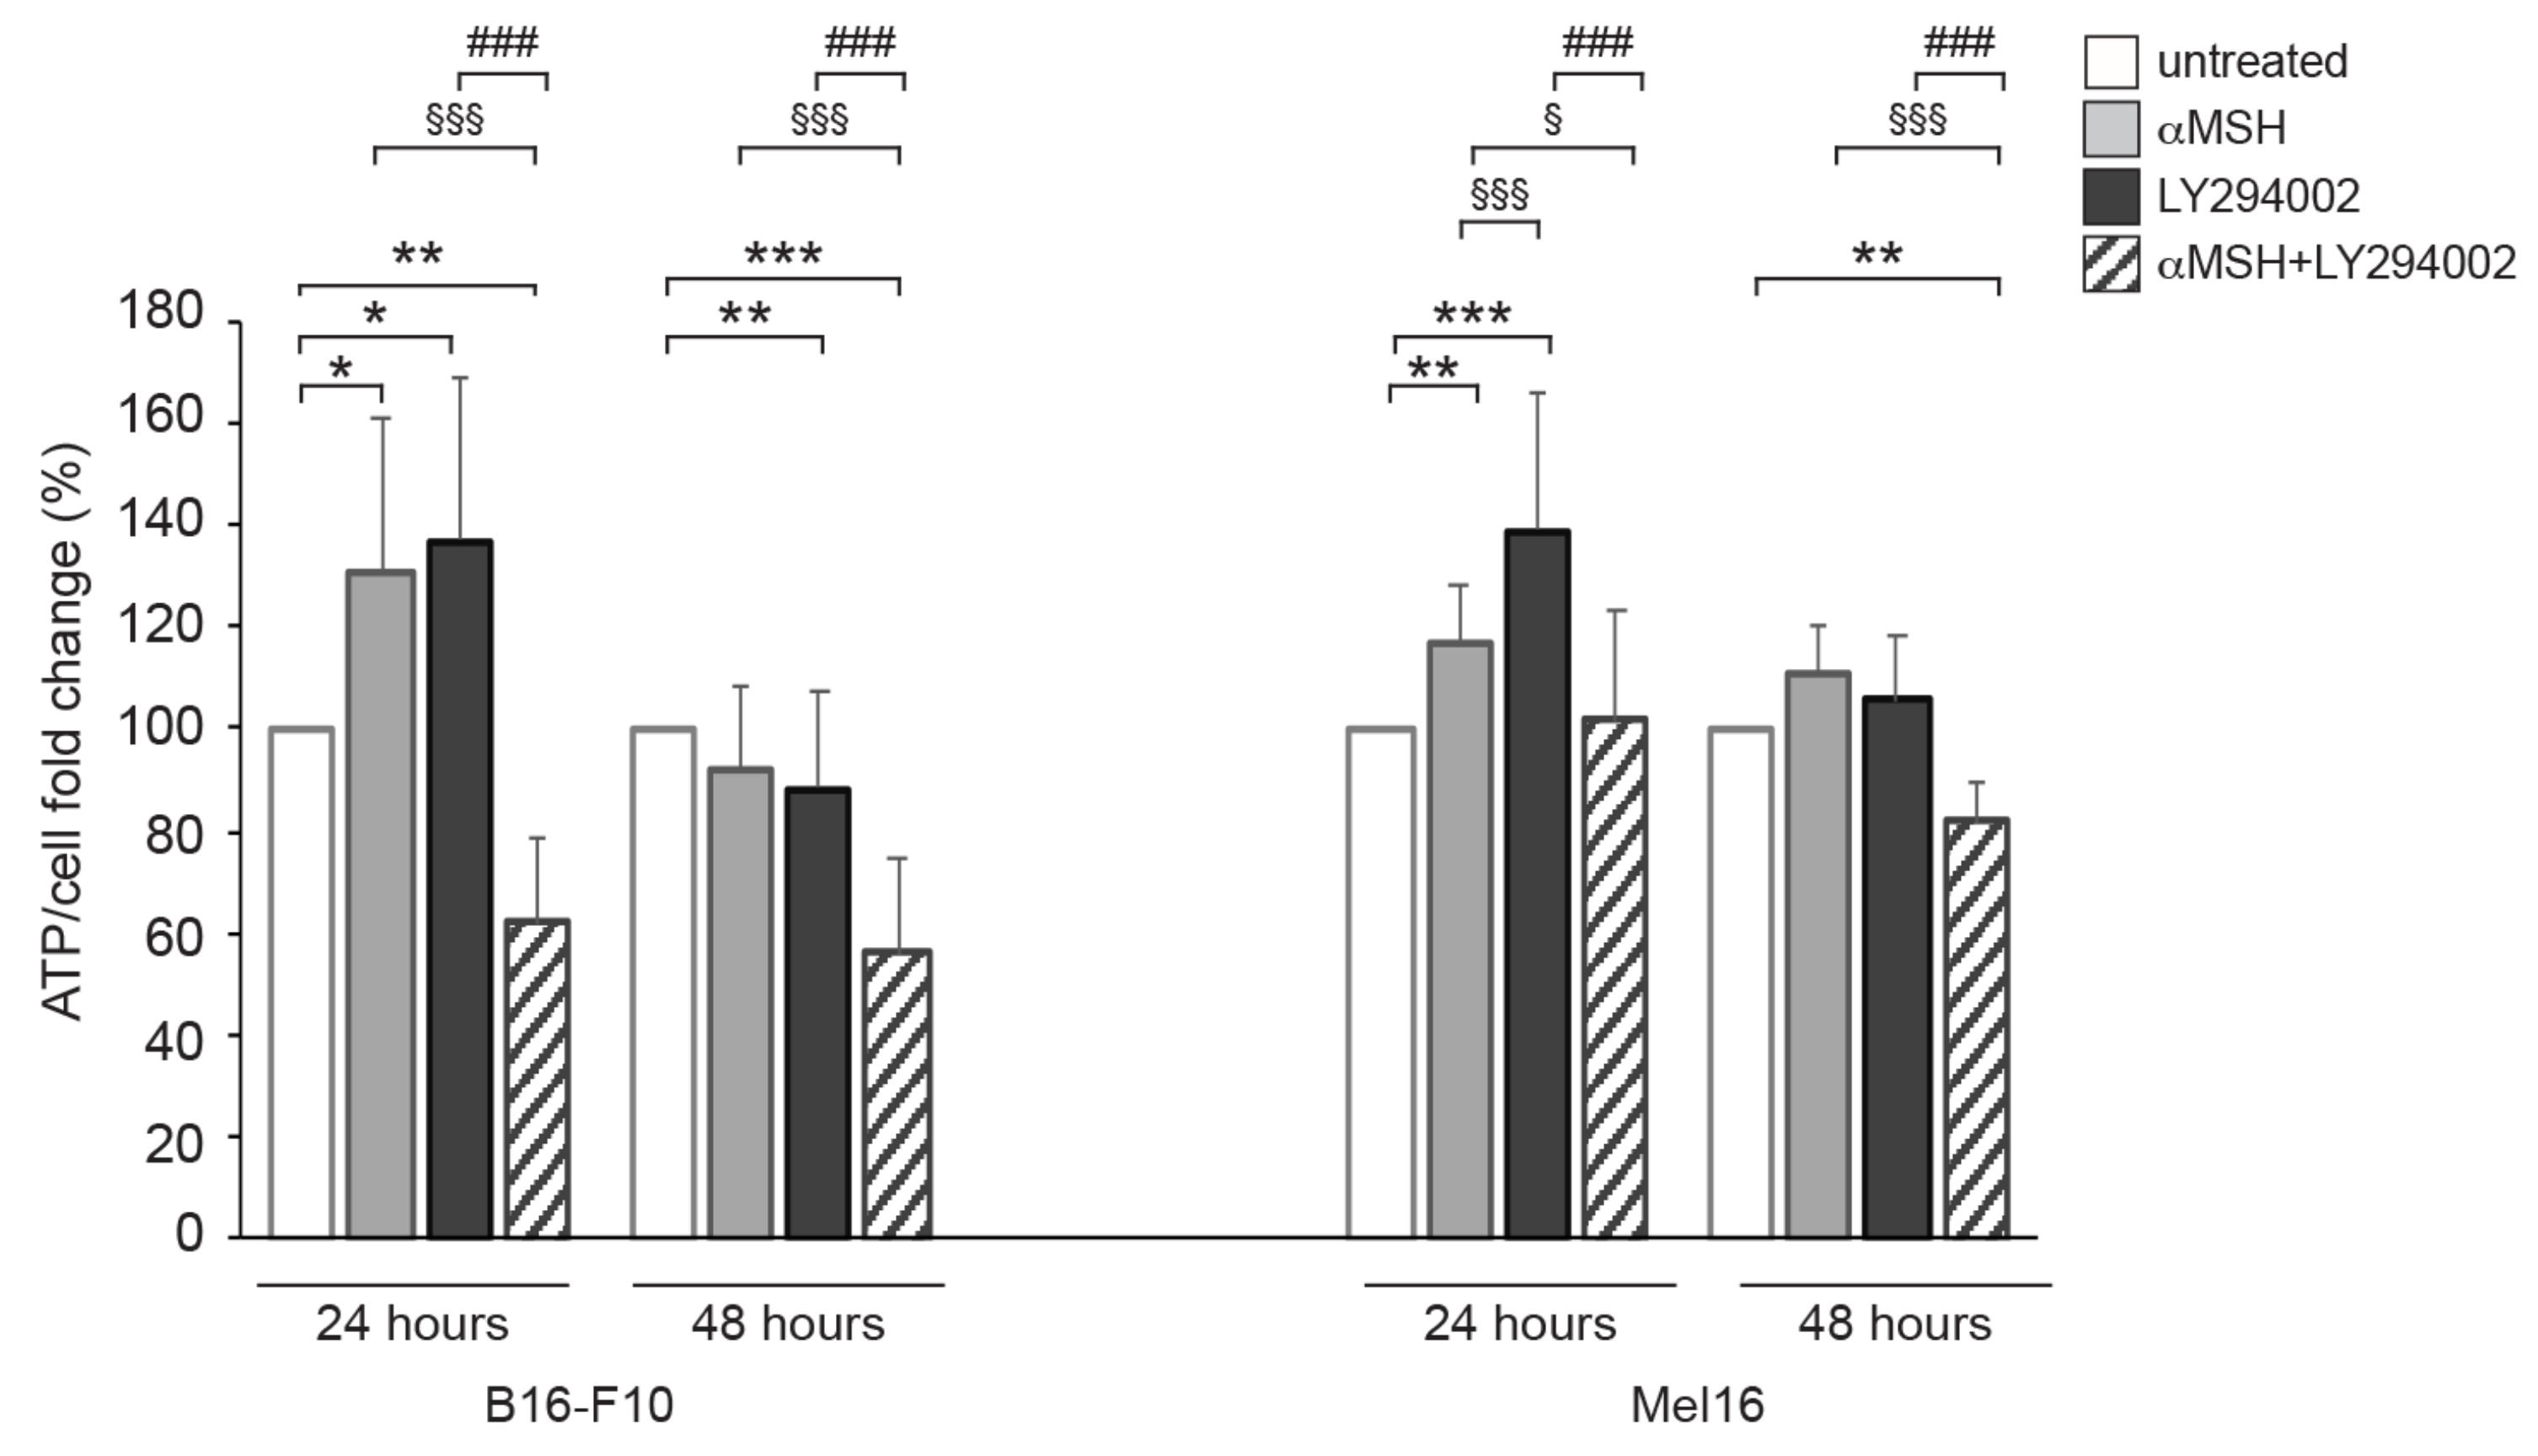
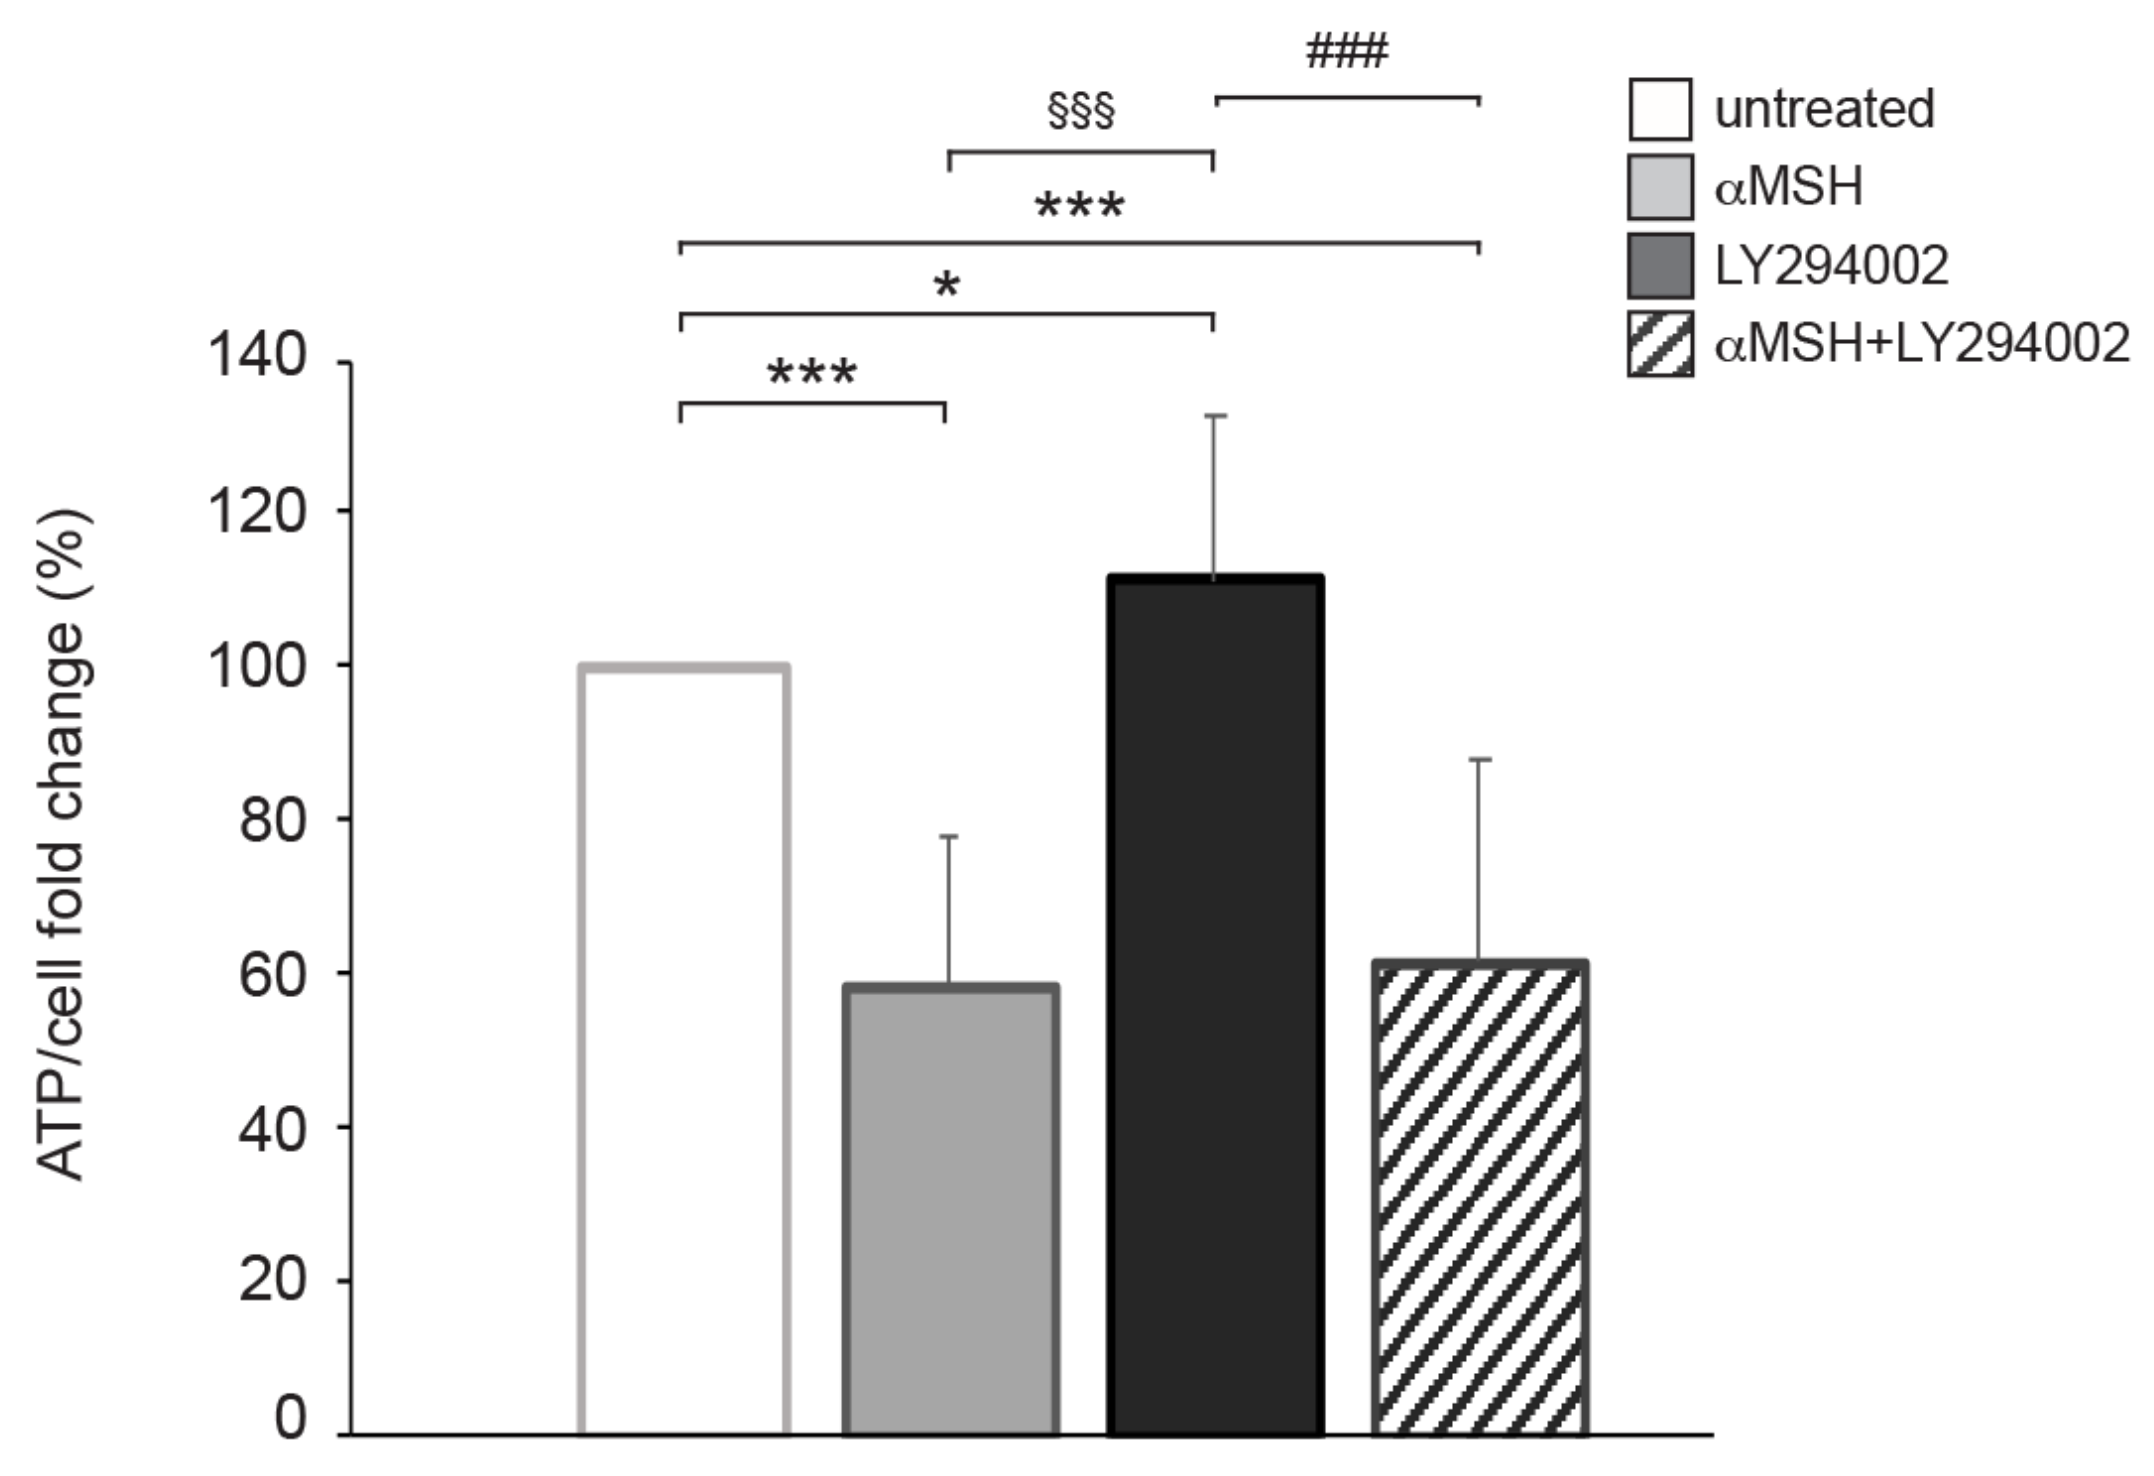
3.2. The αMSH-Dependent PI3K Pathway Exerts a Crucial Role in ATP Intracellular Production
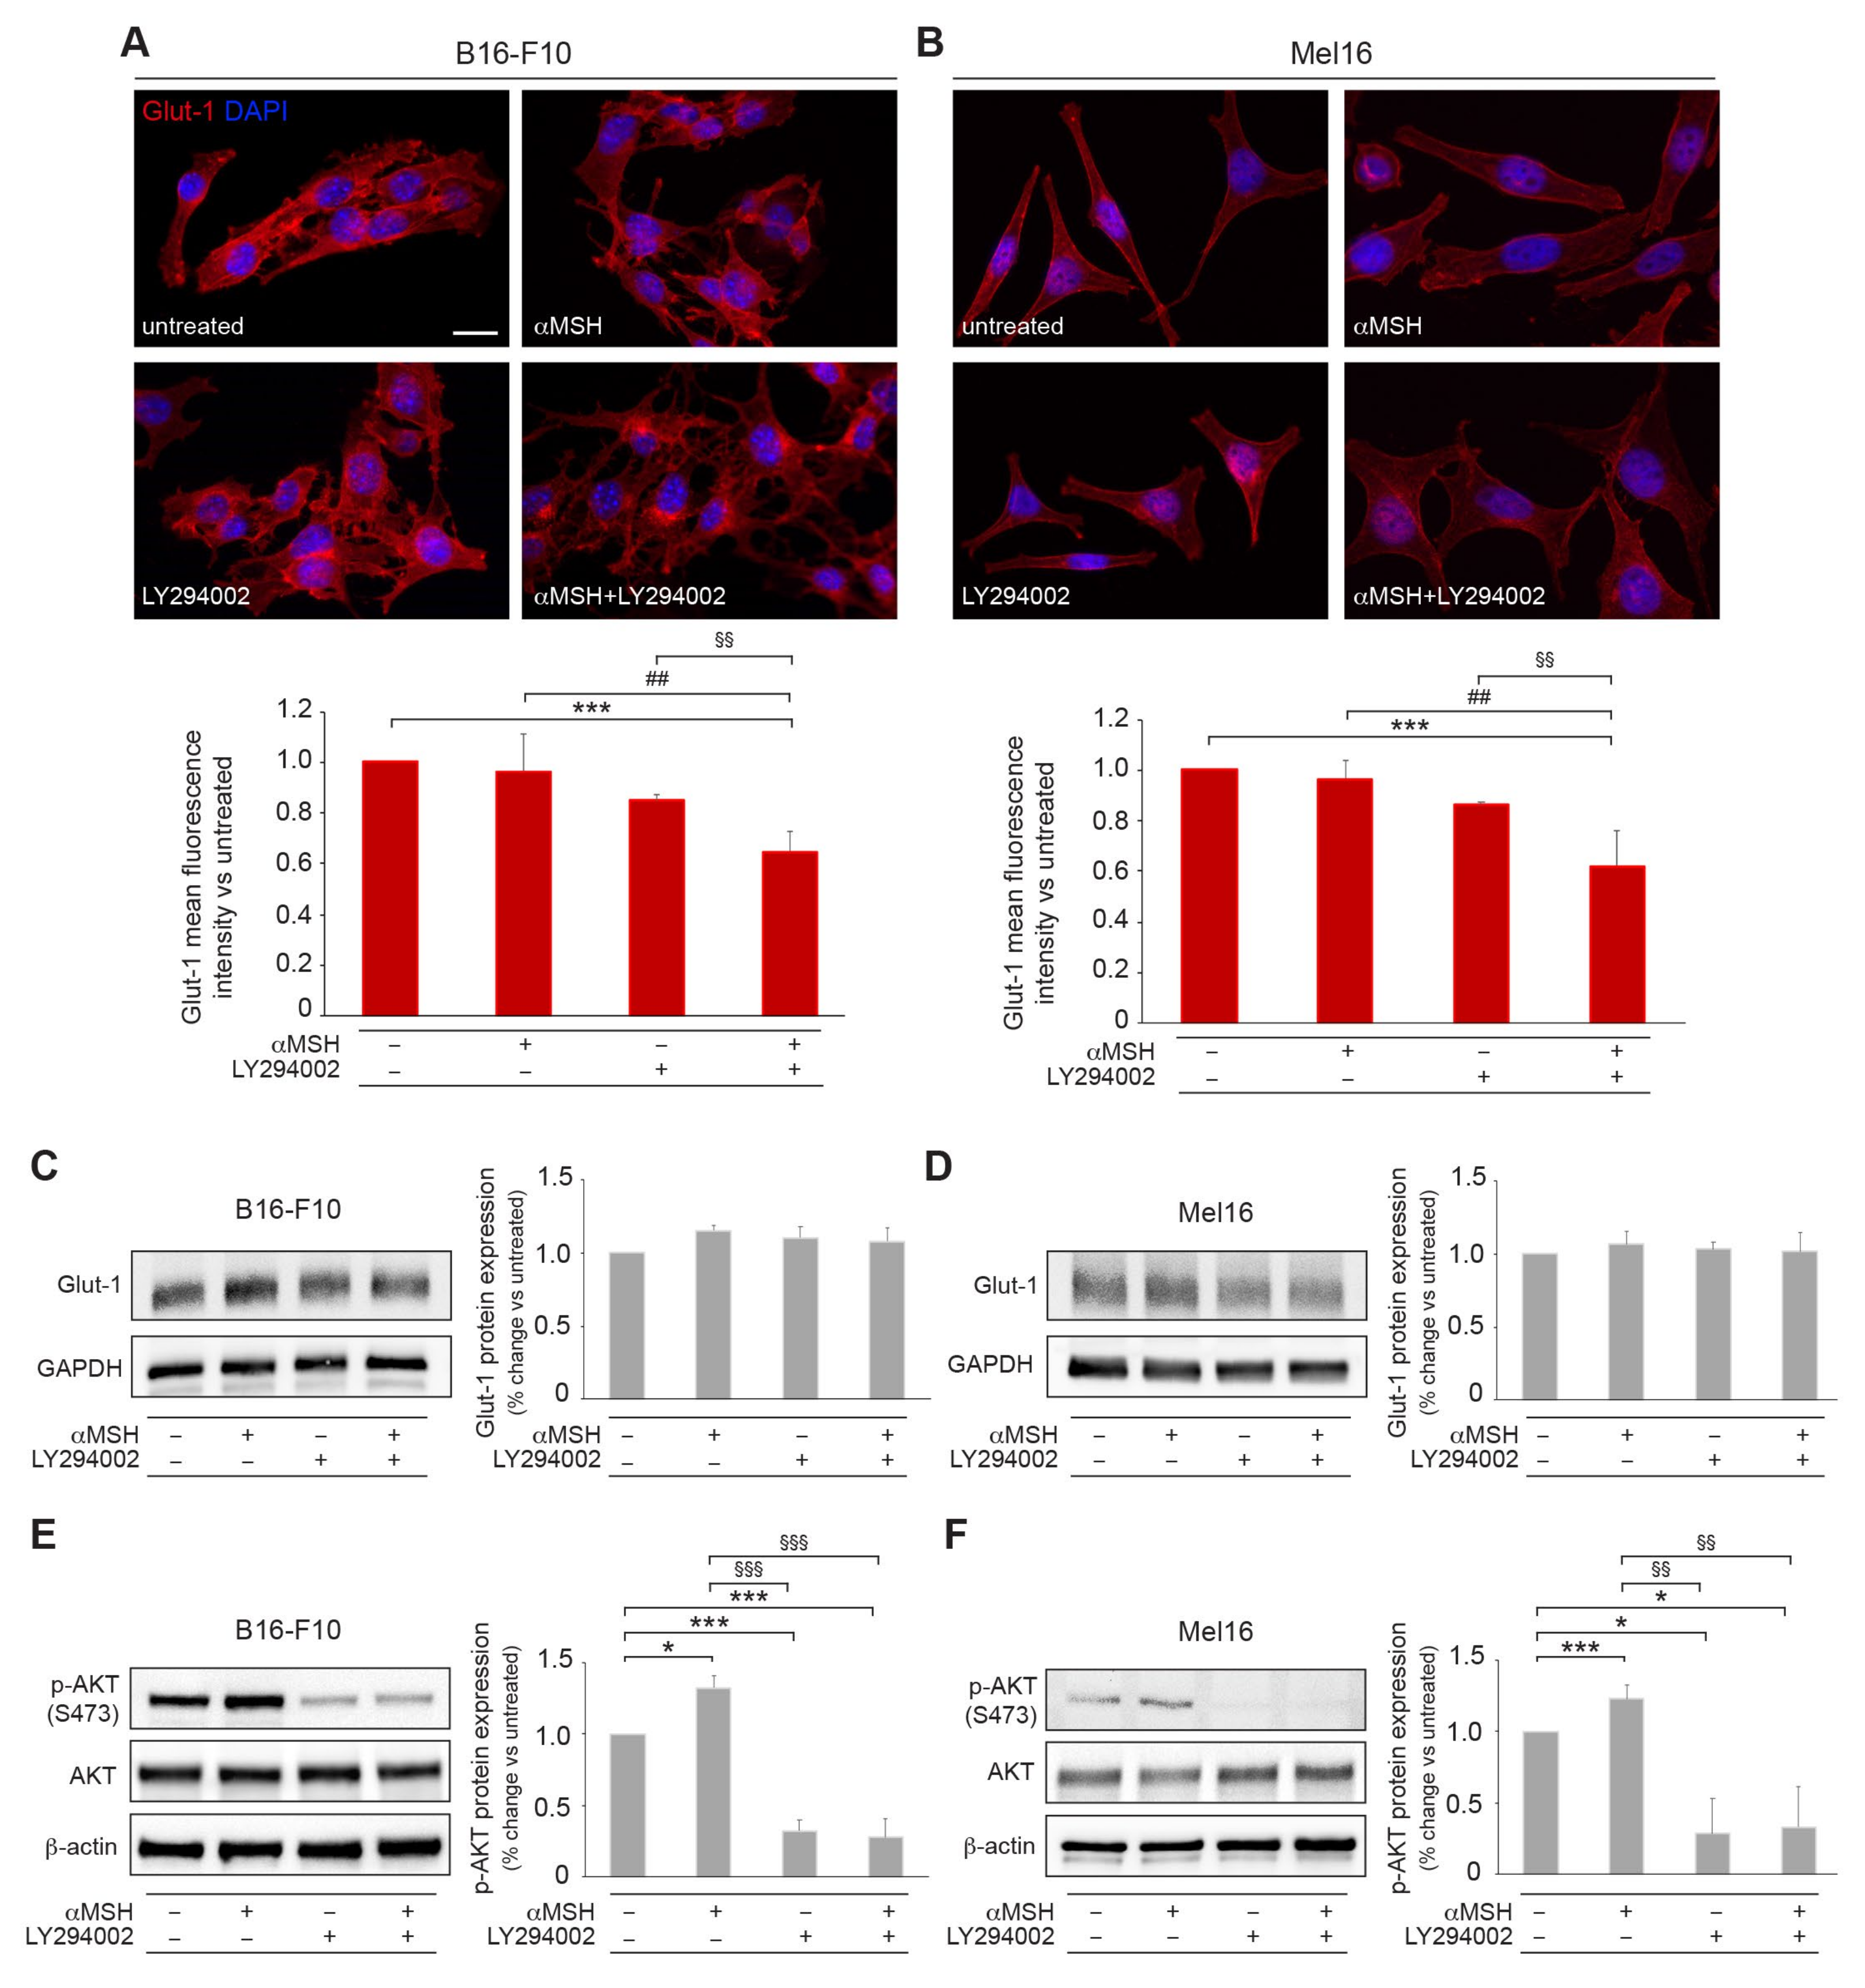
3.3. The αMSH-Mediated PI3K Pathway Affects Membrane Recycling of the Glut-1 Transporter
3.4. In Response to αMSH, the PI3K Pathway Affects Cell Motility
4. Discussion
5. Conclusions
Supplementary Materials
Author Contributions
Funding
Institutional Review Board Statement
Informed Consent Statement
Data Availability Statement
Acknowledgments
Conflicts of Interest
References
- García-Borrón, J.C.; Abdel-Malek, Z.; Jiménez-Cervantes, C. MC1R, the cAMP pathway, and the response to solar UV: Extending the horizon beyond pigmentation. Pigment Cell Melanoma Res. 2014, 27, 699–720. [Google Scholar] [CrossRef] [PubMed] [Green Version]
- Herraiz, C.; García-Borrón, J.C.; Jiménez-Cervantes, C.; Olivares, C. MC1R signaling. Intracellular partners and pathophysiological implications. Biochim. Biophys. Acta (BBA) Mol. Basis Dis. 2017, 1863, 2448–2461. [Google Scholar] [CrossRef] [PubMed]
- Herraiz, C.; Martínez-Vicente, I.; Maresca, V. The α-melanocyte-stimulating hormone/melanocortin-1 receptor interaction: A driver of pleiotropic effects beyond pigmentation. Pigment Cell Melanoma Res. 2021, 34, 748–761. [Google Scholar] [CrossRef] [PubMed]
- Maresca, V.; Flori, E.; Picardo, M. Skin phototype: A new perspective. Pigment Cell Melanoma Res. 2015, 28, 378–389. [Google Scholar] [CrossRef] [PubMed] [Green Version]
- Swope, V.B.; Abdel-Malek, Z.A. MC1R: Front and Center in the Bright Side of Dark Eumelanin and DNA Repair. Int. J. Mol. Sci. 2018, 9, 2667. [Google Scholar] [CrossRef] [Green Version]
- Tagliabue, E.; Fargnoli, M.C.; Gandini, S.; Maisonneuve, P.; Liu, F.; Kayser, M.; Raimondi, S. MC1R gene variants and non-melanoma skin cancer: A pooled-analysis from the M-SKIP project. Br. J. Cancer. 2015, 113, 354–363. [Google Scholar] [CrossRef] [Green Version]
- Busca, R.; Ballotti, R. Cyclic AMP a key messenger in the regulation of skin pigmentation. Pigment Cell Res. 2000, 13, 60–69. [Google Scholar] [CrossRef]
- D’Orazio, J.; Fisher, D.E. Central role for cAMP signaling in pigmentation and UV resistance. Cell Cycle 2011, 10, 8–9. [Google Scholar] [CrossRef]
- Wolf Horrell, E.M.; Boulanger, M.C.; D’Orazio, J.A. Melanocortin 1 Receptor: Structure, Function, and Regulation. Front. Genet. 2016, 7, 95. [Google Scholar] [CrossRef] [Green Version]
- Flori, E.; Rosati, E.; Cardinali, G.; Kovacs, D.; Bellei, B.; Picardo, M.; Maresca, V. The α-melanocyte stimulating hormone/peroxisome proliferator activated receptor-γ pathway down-regulates proliferation in melanoma cell lines. J. Exp. Clin. Cancer Res. 2017, 36, 142. [Google Scholar] [CrossRef] [Green Version]
- Maresca, V.; Flori, E.; Camera, E.; Bellei, B.; Aspite, N.; Ludovici, M.; Catricalà, C.; Cardinali, G.; Picardo, M. Linking αMSH with PPAR-γ in B16-F10 melanoma. Pigment Cell Melanoma Res. 2013, 26, 113–127. [Google Scholar] [CrossRef] [PubMed]
- Fanale, D.; Amodeo, V.; Caruso, S. The Interplay between Metabolism, PPAR Signaling Pathway, and Cancer. PPAR Res. 2017, 2017, 830626. [Google Scholar] [CrossRef] [PubMed] [Green Version]
- Varga, T.; Czimmerer, Z.; Nagy, L. PPARs are a unique set of fatty acid regulated transcription factors controlling both lipid metabolism and inflammation. Biochim. Biophys. Acta. 2011, 1812, 1007–1022. [Google Scholar] [CrossRef] [PubMed]
- Mosca, S.; Cardinali, G.; Flori, E.; Briganti, S.; Bottillo, I.; Mileo, A.M.; Maresca, V. The PI3K pathway induced by αMSH exerts a negative feedback on melanogenesis and contributes to the release of pigment. Pigment Cell Melanoma Res. 2021, 34, 72–88. [Google Scholar] [CrossRef]
- Cao, J.; Wan, L.; Hacker, E.; Dai, X.; Lenna, S.; Jiménez-Cervantes, C.; Wang, Y.; Leslie, N.R.; Xu, G.X.; Widlund, H.R.; et al. MC1R is a potent regulator of PTEN after UV exposure in melanocytes. Mol. Cell 2013, 51, 409–422. [Google Scholar] [CrossRef] [Green Version]
- Castejón-Griñán, M.; Herraiz, C.; Olivares, C.; Jiménez-Cervantes, C.; García-Borrón, J.C. cAMP-independent non-pigmentary actions of variant melanocortin 1 receptor: AKT-mediated activation of protective responses to oxidative DNA damage. Oncogene 2018, 37, 3631–3646. [Google Scholar] [CrossRef]
- Cheng, L.B.; Cheng, L.; Bi, H.E.; Zhang, Z.Q.; Yao, J.; Zhou, X.Z.; Jiang, Q. Alpha-melanocyte stimulating hormone protects retinal pigment epithelium cells from oxidative stress through activation of melanocortin 1 receptor-Akt-mTOR signaling. Biochem. Biophys. Res. Commun. 2014, 443, 447–452. [Google Scholar] [CrossRef]
- Kadekaro, A.L.; Kavanagh, R.; Kanto, H.; Terzieva, S.; Hauser, J.; Kobayashi, N.; Schwemberger, S.; Cornelius, J.; Babcock, G.; Shertzer, H.G.; et al. alpha-Melanocortin and endothelin-1 activate antiapoptotic pathways and reduce DNA damage in human melanocytes. Cancer Res. 2015, 65, 4292–4299. [Google Scholar] [CrossRef] [Green Version]
- Jiang, N.; Dai, Q.; Su, X.; Fu, J.; Feng, X.; Peng, J. Role of PI3K/AKT pathway in cancer: The framework of malignant behavior. Mol. Biol. Rep. 2020, 47, 4587–4629. [Google Scholar] [CrossRef] [Green Version]
- Khezri, M.R.; Jafari, R.; Yousefi, K.; Zolbanin, N.M. The PI3K/AKT signaling pathway in cancer: Molecular mechanisms and possible therapeutic interventions. Exp. Mol. Pathol. 2022, 127, 104787. [Google Scholar] [CrossRef]
- Hoxhaj, G.; Manning, B.D. The PI3K-AKT network at the interface of oncogenic signalling and cancer metabolism. Nat. Rev. Cancer 2020, 20, 74–88. [Google Scholar] [CrossRef]
- Zhu, J.; Thompson, C.B. Metabolic regulation of cell growth and proliferation. Nat. Rev. Mol. Cell Biol. 2019, 20, 436–450. [Google Scholar] [CrossRef]
- Ferguson, J.; Smith, M.; Zudaire, I.; Wellbrock, C.; Arozarena, I. Glucose availability controls ATF4-mediated MITF suppression to drive melanoma cell growth. Oncotarget 2017, 8, 32946–32959. [Google Scholar] [CrossRef] [PubMed] [Green Version]
- Nava, G.M.; Perez, L.A.M. Metabolic profile of the Warburg effect as a tool for molecular prognosis and diagnosis of cancer. Expert Rev. Mol. Diagn. 2022, 22, 439–447. [Google Scholar] [CrossRef] [PubMed]
- Zheng, J. Energy metabolism of cancer: Glycolysis versus oxidative phosphorylation. Oncol. Lett. 2012, 4, 1151–1157. [Google Scholar] [CrossRef] [PubMed] [Green Version]
- Rusciano, D.; Lorenzoni, P.; Burger, M.M. Regulation of c-met expression in B16 murine melanoma cells by melanocyte stimulating hormone. J. Cell Sci. 1999, 112, 623–630. [Google Scholar] [CrossRef]
- Kovacs, D.; Migliano, E.; Muscardin, L.; Silipo, V.; Catricalà, C.; Picardo, M.; Bellei, B. The role of Wnt/β-catenin signaling pathway in melanoma epithelial-to-mesenchymal-like switching: Evidences from patients-derived cell lines. Oncotarget 2016, 7, 43295–43314. [Google Scholar] [CrossRef] [Green Version]
- Ohashi, P.S.; Woodgett, J.R. Modulating autoimmunity: Pick your PI3 kinase. Nat. Med. 2005, 11, 924–925. [Google Scholar] [CrossRef]
- Fukuda, M. Rab GTPases: Key players in melanosome biogenesis, transport, and transfer. Pigment Cell Melanoma Res. 2021, 34, 222–235. [Google Scholar] [CrossRef]
- Lambert, J.; Onderwater, J.; Vander Haeghen, Y.; Vancoillie, G.; Koerten, H.K.; Mommaas, A.M.; Naeyaert, J.M. Myosin V colocalizes with melanosomes and subcortical actin bundles not associated with stress fibers in human epidermal melanocytes. J. Investig. Dermatol. 1998, 111, 835–840. [Google Scholar] [CrossRef] [Green Version]
- Koch, K.A.; Lang, S.A.; Wild, P.J.; Gantner, S.; Mahli, A.; Spanier, G.; Berneburg, M.; Müller, M.; Bosserhoff, A.K.; Hellerbrand, C. Glucose transporter isoform 1 expression enhances metastasis of malignant melanoma cells. Oncotarget 2015, 6, 32748–32760. [Google Scholar] [CrossRef] [PubMed] [Green Version]
- Fang, J.; Zhou, S.H.; Fan, J.; Yan, S.X. Roles of glucose transporter-1 and the phosphatidylinositol 3-kinase/protein kinase B pathway in cancer radioresistance (review). Mol. Med. Rep. 2015, 11, 1573–1581. [Google Scholar] [CrossRef] [PubMed] [Green Version]
- Jacobs, S.R.; Herman, C.E.; Maciver, N.J.; Wofford, J.A.; Wieman, H.L.; Hammen, J.J.; Rathmell, J.C. Glucose uptake is limiting in T cell activation and requires CD28-mediated Akt-dependent and independent pathways. J. Immunol. 2008, 180, 4476. [Google Scholar] [CrossRef] [Green Version]
- Melstrom, L.G.; Salabat, M.R.; Ding, X.Z.; Milam, B.M.; Strouch, M.; Pelling, J.C.; Bentrem, D.J. Apigenin inhibits the GLUT-1 glucose transporter and the phosphoinositide 3-kinase/Akt pathway in human pancreatic cancer cells. Pancreas 2008, 37, 426–431. [Google Scholar] [CrossRef]
- Wieman, H.L.; Wofford, J.A.; Rathmell, J.C. Cytokine stimulation promotes glucose uptake via phosphatidylinositol-3 kinase/Akt regulation of Glut1 activity and trafficking. Mol. Biol. Cell 2007, 18, 1437–1446. [Google Scholar] [CrossRef] [Green Version]
- Wofford, J.A.; Wieman, H.L.; Jacobs, S.R.; Zhao, Y.; Rathmell, J.C. IL-7 promotes Glut1 trafficking and glucose uptake via STAT5-mediated activation of Akt to support T-cell survival. Blood 2008, 111, 2101–2111. [Google Scholar] [CrossRef] [PubMed] [Green Version]
- Song, S.B.; Hwang, E.S. A Rise in ATP, ROS, and Mitochondrial Content upon Glucose Withdrawal Correlates with a Dysregulated Mitochondria Turnover Mediated by the Activation of the Protein Deacetylase SIRT1. Cells 2018, 8, 11. [Google Scholar] [CrossRef] [Green Version]
- Dilshat, R.; Fock, V.; Kenny, C.; Gerritsen, I.; Lasseur, R.M.J.; Travnickova, J.; Eichhoff, O.M.; Cerny, P.; Möller, K.; Sigurbjörnsdóttir, S.; et al. MITF reprograms the extracellular matrix and focal adhesion in melanoma. eLife 2021, 10, e63093. [Google Scholar] [CrossRef] [PubMed]
- Pavlova, N.N.; Zhu, J.; Thompson, C.B. The hallmarks of cancer metabolism: Still emerging. Cell Metab. 2022, 34, 355–377. [Google Scholar] [CrossRef]
- De Wane, G.; Salvi, A.M.; DeMali, K.A. Fueling the cytoskeleton-links between cell metabolism and actin remodeling. J. Cell Sci. 2021, 134, jcs248385. [Google Scholar] [CrossRef]
- Rathmell, J.C.; Fox, C.J.; Plas, D.R.; Hammerman, P.S.; Cinalli, R.M.; Thompson, C.B. Akt-directed glucose metabolism can prevent Bax conformation change and promote growth factor-independent survival. Mol. Cell Biol. 2003, 23, 7315–7328. [Google Scholar] [CrossRef] [PubMed] [Green Version]
- Ward, P.; Thompson, C.B. Signaling in control of cell growth and metabolism. Cold Spring Harb. Perspect. Biol. 2012, 4, a006783. [Google Scholar] [CrossRef] [PubMed] [Green Version]
- Barthel, A.; Okino, S.T.; Liao, J.; Nakatani, K.; Li, J.; Whitlock, J.P., Jr.; Roth, R.A. Regulation of GLUT1 gene transcription by the serine/threonine kinase Akt1. J. Biol. Chem. 1999, 274, 20281–20286. [Google Scholar] [CrossRef] [PubMed] [Green Version]
- Costa, J.L.; Hochgeschwender, U.; Brennan, M. The role of melanocyte stimulating hormone in insulin resistance and type 2 diabetes mellitus. Treat Endocrinol. 2006, 5, 7–13. [Google Scholar] [CrossRef]
- Fan, W.; Dinulescu, D.M.; Butler, A.A.; Zhou, J.; Marks, D.L.; Cone, R.D. The central melanocortin system can directly regulate serum insulin levels. Endocrinology 2000, 141, e3072–e3079. [Google Scholar] [CrossRef]
- Hill, J.W.; Faulkner, L.D. The Role of the Melanocortin System in Metabolic Disease: New Developments and Advances. Neuroendocrinology 2017, 104, 330–346. [Google Scholar] [CrossRef]
- Enriori, P.J.; Chen, W.; Garcia-Rudaz, M.C.; Grayson, B.E.; Evans, A.E.; Comstock, S.M.; Gebhardt, U.; Müller, H.L.; Reinehr, T.; Henry, B.A.; et al. α-Melanocyte stimulating hormone promotes muscle glucose uptake via melanocortin 5 receptors. Mol. Metab. 2016, 5, 807–822. [Google Scholar] [CrossRef]
- Adekola, K.; Rosen, S.T.; Shanmugam, M. Glucose transporters in cancer metabolism. Curr. Opin. Oncol. 2012, 24, 650–654. [Google Scholar] [CrossRef]
- Dasgupta, S.; Rai, R.C. PPAR-γ and Akt regulate GLUT1 and GLUT3 surface localization during Mycobacterium tuberculosis infection. Mol. Cell Biochem. 2018, 440, 127–138. [Google Scholar] [CrossRef]
- Cazzato, G.; Colagrande, A.; Cimmino, A.; Abbatepaolo, C.; Bellitti, E.; Romita, P.; Lospalluti, L.; Foti, C.; Arezzo, F.; Loizzi, V.; et al. GLUT1, GLUT3 Expression and 18FDG-PET/CT in Human Malignant Melanoma: What Relationship Exists? New Insights and Perspectives. Cells 2021, 10, 3090. [Google Scholar] [CrossRef]
- Fischer, G.M.; Gopa, Y.N.V.; McQuade, J.L.; Peng, W.; DeBerardinis, R.J.; Davies, M.A. Metabolic Strategies of Melanoma Cells: Mechanisms, Interactions with the Tumor Microenvironment, and Therapeutic Implications. Pigment Cell Melanoma Res. 2018, 31, 11–30. [Google Scholar] [CrossRef] [PubMed] [Green Version]
- Chan, D.C. Mitochondrial Dynamics and Its Involvement in Disease. Annu. Rev. Pathol. 2020, 15, 235–259. [Google Scholar] [CrossRef] [PubMed] [Green Version]
- Yapa, N.M.B.; Lisnyak, V.; Reljic, B.; Ryan, M.T. Mitochondrial dynamics in health and disease. FEBS Lett. 2021, 595, 1184–1204. [Google Scholar] [CrossRef] [PubMed]
- Zhou, H.; Zhang, B.; Zheng, J.; Yu, M.; Zhou, T.; Zhao, K.; Jia, Y.; Gao, X.; Chen, C.; Wei, T. The inhibition of migration and invasion of cancer cells by graphene via the impairment of mitochondrial respiration. Biomaterials 2014, 35, 1597–1607. [Google Scholar] [CrossRef] [PubMed]


Disclaimer/Publisher’s Note: The statements, opinions and data contained in all publications are solely those of the individual author(s) and contributor(s) and not of MDPI and/or the editor(s). MDPI and/or the editor(s) disclaim responsibility for any injury to people or property resulting from any ideas, methods, instructions or products referred to in the content. |
© 2023 by the authors. Licensee MDPI, Basel, Switzerland. This article is an open access article distributed under the terms and conditions of the Creative Commons Attribution (CC BY) license (https://creativecommons.org/licenses/by/4.0/).
Share and Cite
Cardinali, G.; Kovacs, D.; Mosca, S.; Bellei, B.; Flori, E.; Morrone, A.; Mileo, A.M.; Maresca, V. The αMSH-Dependent PI3K Pathway Supports Energy Metabolism, via Glucose Uptake, in Melanoma Cells. Cells 2023, 12, 1099. https://doi.org/10.3390/cells12071099
Cardinali G, Kovacs D, Mosca S, Bellei B, Flori E, Morrone A, Mileo AM, Maresca V. The αMSH-Dependent PI3K Pathway Supports Energy Metabolism, via Glucose Uptake, in Melanoma Cells. Cells. 2023; 12(7):1099. https://doi.org/10.3390/cells12071099
Chicago/Turabian StyleCardinali, Giorgia, Daniela Kovacs, Sarah Mosca, Barbara Bellei, Enrica Flori, Aldo Morrone, Anna Maria Mileo, and Vittoria Maresca. 2023. "The αMSH-Dependent PI3K Pathway Supports Energy Metabolism, via Glucose Uptake, in Melanoma Cells" Cells 12, no. 7: 1099. https://doi.org/10.3390/cells12071099