Article

Early Alterations of RNA Binding Protein (RBP) Homeostasis and ER Stress-Mediated Autophagy Contributes to Progressive Retinal Degeneration in the rd10 Mouse Model of Retinitis Pigmentosa (RP)

1
Institute of Neuropathology, University Hospital RWTH Aachen, 52074 Aachen, Germany
2
EURON—European Graduate School of Neuroscience, Maastricht University, 6229 ER Maastricht, The Netherlands
3
Department of Ophthalmology, University Hospital RWTH Aachen, 52074 Aachen, Germany
4
Institute of Biological Information Processing, Molecular and Cellular Physiology, IBI-1, Forschungszentrum Jülich GmbH, 52425 Jülich, Germany
5
Department of Neurology, Center for Motor Neuron Biology and Disease, Columbia University, New York, NY 10032, USA
6
Department of Neurology, Eleanor and Lou Gehrig ALS Center, Columbia University, New York, NY 10032, USA
*
Authors to whom correspondence should be addressed.
These authors contributed equally to this work.
Cells 2023, 12(7), 1094; https://doi.org/10.3390/cells12071094
Submission received: 22 December 2022 / Revised: 13 March 2023 / Accepted: 14 March 2023 / Published: 6 April 2023
(This article belongs to the Special Issue Model Organisms to Study Autophagy)

Abstract

:
The retinal degeneration 10 (rd10) mouse model is widely used to study retinitis pigmentosa (RP) pathomechanisms. It offers a rather unique opportunity to study trans-neuronal degeneration because the cell populations in question are separated anatomically and the mutated Pde6b gene is selectively expressed in rod photoreceptors. We hypothesized that RNA binding protein (RBP) aggregation and abnormal autophagy might serve as early pathogenic events, damaging non-photoreceptor retinal cell types that are not primarily targeted by the Pde6b gene defect. We used a combination of immunohistochemistry (DAB, immunofluorescence), electron microscopy (EM), subcellular fractionation, and Western blot analysis on the retinal preparations obtained from both rd10 and wild-type mice. We found early, robust increases in levels of the protective endoplasmic reticulum (ER) calcium (Ca2+) buffering chaperone Sigma receptor 1 (SigR1) together with other ER-Ca2+ buffering proteins in both photoreceptors and non-photoreceptor neuronal cells before any noticeable photoreceptor degeneration. In line with this, we found markedly altered expression of the autophagy proteins p62 and LC3, together with abnormal ER widening and large autophagic vacuoles as detected by EM. Interestingly, these changes were accompanied by early, prominent cytoplasmic and nuclear aggregation of the key RBPs including pTDP-43 and FET family RBPs and stress granule formation. We conclude that progressive neurodegeneration in the rd10 mouse retina is associated with early disturbances of proteostasis and autophagy, along with abnormal cytoplasmic RBP aggregation.

1. Introduction

Retinitis pigmentosa (RP) is an inherited retinal disease resulting in the progressive degeneration of retinal photoreceptors and ultimately leading to blindness [1,2]. Mutations in more than 100 genes are known to cause RP [3,4] (also see the homepage of the retinal information network, http://www.sph.uth.tmc.edu/Retnet/ (accessed on 21 December 2022)). Mutations in genes involved in the phototransduction cascade, including opsins, transducin, cyclic GMP (cGMP) phosphodiesterase type 6 (Pde6), guanylate-cyclase-activating protein, and cGMP-gated channels, are major causes of retinal photoreceptor degeneration in human patients [5,6,7,8].
Several mouse models of RP have been described thus far [9,10,11,12]. The rd10 mouse carries a spontaneous point mutation in the Pde6b gene and displays progressive photoreceptor degeneration starting at postnatal day P17-18 with peak photoreceptor death at P25. This model has been widely used to study RP pathophysiology [11,12,13,14,15]. The Pde6b gene encodes rod phosphodiesterase (PDE), an enzyme that hydrolyzes cGMP to GMP in response to light. A point mutation in the Pde6b gene dramatically decreases maximal and basal PDE6 activity, apparently caused by a decrease in protein stability and reduced transport of the PDE6 protein to the outer segment of the retina [16]. The reduced availability of PDE6 results in reduced activity, which eventually leads to the accumulation of free cGMP in photoreceptor cells. This further leads to uncontrolled opening of the cGMP-gated channels, causing excessive Ca2+ influx [11,12,13,14,15,16]. Altered Ca2+ homeostasis can trigger photoreceptor degeneration involving excitotoxicity, endoplasmic reticulum (ER) stress, autophagy defects, inflammation, and apoptosis [17,18,19,20,21]. Interestingly this mutation produces no alteration of Pde6b RNA, and the enzymatic properties of the remaining mutant PDE6 appear to be nearly normal [11,12,13,14,15,16].
In many forms of RP, and especially in rd10 mice carrying the Pde6b gene mutation, the disease is characterized by the degeneration of rods followed by cones. The cones do not begin to extensively degenerate until almost all rods have been lost [22,23,24]. Quite intriguingly, an age-dependent degeneration of other retinal cell types including cells in the inner nuclear layer (INL) and ganglion cell layer (GCL) has been found in both RP patients and rd10 mice [22,23,24]. Notably, rd10 retinal cells of the INL and GCL are not the primary targets of the Pde6b gene defect [11,12,13,14,15,16]; the molecular mechanisms of their sequential degeneration are still largely unknown.
Aberrant ER-Ca2+ homeostasis serves as a major player in many other neurodegenerative disorders including Alzheimer’s disease (AD), Huntington’s disease (HD), Parkinson’s disease (PD), and amyotrophic lateral sclerosis (ALS) [25,26,27]. Irrespective of the genetic and anatomical, as well as phenotypic, variability among these diseases, altered ER-Ca2+ homeostasis initiates and/or orchestrates pathomechanisms such as proteotoxicity due to misfolded protein aggregation, impaired autophagy, and altered RNA metabolism (reviewed in [25]).
Based on our previous work on these pathomechanisms in age-related neurodegenerative diseases [28,29,30], we examined the time course of the development of hallmarks of abnormal autophagy and of RBPs’ alterations in the photoreceptor and non-photoreceptor cells of the rd10 retina to determine whether they serve as early pathogenic events. Consistent with this notion, we observed altered ER-Ca2+ homeostasis, impaired autophagy, and cytoplasmic RBP aggregation in non-photoreceptor cells of the rd10 retina by P17. At this stage, neurodegenerative changes just start to emerge, without any obvious photoreceptor loss, and these are difficult to detect with light microscopy. The fact that cytoplasmic RBP aggregation occurs in non-photoreceptor retinal neuronal cells before the demise of photoreceptors suggests that functional alterations of connectivity may be sufficient to trigger cytoplasmic RBP mislocalization. These findings in rd10 mice might benefit our understanding of the spread of pathology in many age-related progressive neurodegenerative diseases that are characterized by Ca2+ imbalance, autophagy dysregulation, and altered RBP homeostasis.

2. Materials and Methods

2.1. Antibodies

All primary and secondary antibodies and their dilutions used in this study are listed in Table S1. Many of these antibodies have been used by us in both mice and human tissue in previously published studies (see references in Table S1).

2.2. rd10 Mouse Model

Studies were performed using retinae from male and female rd10 mice (C57BL/6J-Pde6b rd10/J) [11] and age-matched wild-type (WT) mice (C57BL/6) as controls. It is important to note that the two mouse strains share the same genetic background. The breeding of rd10 mice has been described previously in detail [31]. The animals were kept on a 12 h light/dark cycle with food and water ad libitum. All experiments were performed in accordance with the ARVO statement for the Use of Animals in Ophthalmic and Vision Research and the German Law for the Protection of Animals and after approval had been obtained by the regulatory authorities of the Forschungszentrum Jülich and the Institute of Laboratory Animal Science (Faculty of Medicine, RWTH Aachen University). A4 application number 11280A4.

2.3. Preparation of Retinal Sections and Homogenates

Both rd10 and wild-type mice were deeply anesthetized by isoflurane and sacrificed by decapitation on the following postnatal day: P16, P17, P19, P22, P25, P26, P50 (n = 3 in each age group, otherwise mentioned in the legend). Both the eyeballs were enucleated and used for hematoxylin and eosin staining (H&E), immunohistochemistry, immunofluorescence, transmission electron microscopy (TEM), Western blotting, filter trap assay (FTA), and subcellular fractionation (see also Table S3). For H&E histology, immunohistochemistry, and immunofluorescence analyses, the eyes were cut open at the limbus. The cornea and lens were removed and the retina in the eyecup was fixed in 4% paraformaldehyde (PFA) for 1 h at room temperature. The unfixed eyeballs of WT mice (P26: n = 3) and rd10 (P17: n = 4, P26: n = 3) mice were used for Western blotting. For the filter trap assay, a pool of WT (P26: n = 3) and rd10 (P17: n = 3, P26: n = 3) was used. For the purification of subcellular protein fractions, a Subcellular Protein Fractionation Kit for Tissues (Thermo Scientific, Rockford, IL, USA) was used. Based upon the Western blot analysis performed on these purified protein fractions, the distributions of RBPs in rd10 and age-matched WT mice were determined. Both the left and right retinae of each of rd10-P17 (n = 3), WT-P17 (n = 3) and WT-P26 (n = 3), rd10-P17 (n = 3), and rd10-P26 (n = 3) were collected (see also Table S3). For these analyses, the cornea and lens were removed, and the retina was carefully dissected out of the eyecup for homogenization.

2.4. Diaminobenzidine (DAB) Immunohistochemistry

Paraffin sections of 3–4 µm were placed on poly-L-lysine coated slides and allowed to dry in an oven at 37 °C overnight and then processed for immunohistochemistry as described in detail elsewhere [30,32]. The sections were deparaffinized in xylene for 20 min and rehydrated in 100%, 96%, and 70% ethanol for 5 min each, followed by endogenous peroxidase quenching (0.3% H2O2 in methanol) for 20 min. For antigen retrieval, sections were heated in citrate buffer (Dako Target Retrieval solution), pH 6 (Dako, Glostrup, Denmark), for 20 min in a pressure cooker. After washing in PBS, sections were incubated with primary antibody (Table S1) for 1 h at room temperature or 4 °C overnight. After washing in PBS, sections were incubated with appropriate HRP-linked secondary antibodies (ImmunoLogic, Duiven, The Netherlands) for 30 min at room temperature. DAB reagent (ImmunoLogic, Duiven, The Netherlands) was used to visualize antibody binding. The sections were then counter-stained with 6% Mayer’s hemalum solution (Merck KGaA, Darmstadt, Germany) for 3 min. All procedures were performed at room temperature. Representative sections formed each eye: WT-P26 (n = 3), rd10-P17 (n = 3), and rd10-P26 (n = 3) were analyzed (see also Table S3).

2.5. Immunofluorescence

Single and double immunofluorescence staining were performed as already described [30,32]; representative sections from every genotype were analyzed, (n = 3) WT-P26, (n = 3) rd10-P17, and (n = 3) rd10-P26—and for certain stains, WT-P50 and rd10-P50 were analyzed. Briefly, deparaffinized sections were heated in citrate buffer (Dako Target Retrieval solution), pH 6 (Dako, Glostrup, Denmark) for 20 min in a pressure cooker. Sections were then blocked (to avoid non-specific binding) with ready-to-use 10% normal goat serum (Life Technologies, Frederick, MD, USA) for 1 h at room temperature before incubating with primary antibody at 4 °C overnight. After two washes in TBS-T for 10 min, the sections were incubated with Alexa-conjugated secondary antibody (1:500 in TBS-T) at room temperature for 2 h. Sections were then washed in TBS-T (2 × 10 min) and incubated for 10 min in 0.1% Sudan Black/80% ethanol to suppress endogenous autofluorescence. Finally, the sections were washed for 5 min in TBST and mounted with antifade mounting medium with DAPI (Vectashield with DAPI, H-1200, Vector Laboratories Inc., Burlingame, CA, USA).

2.6. Image Acquisition and Semi-Quantitative Analysis

Images of the H&E-stained sections (representative sections from each genotype (n = 3 WT-P17, n = 3 WT-P19, n = 3 WT-P26, n = 3 WT-P50, n = 3 rd10-P17, n = 3 rd10-P19, n = 3 rd10-P26, and n = 3 rd10-P50) and DAB-stained sections (n = 3 WT-P26, n = 3 rd10-P17, and n = 3 rd10-P26) were taken with a Zeiss Axioplan microscope equipped with a 40× objective and an Axio Cam 506 camera. Images from immunofluorescence labeled sections were taken with a Zeiss LSM 700 laser scanning confocal microscope using 20×, 40×, and 63× objectives. Images were acquired by averaging 4 scans per area of interest resulting in an image size of 1024 × 1024 pixels. The laser intensity was kept constant for all of the samples examined. Captured confocal images were analyzed using Adobe Photoshop CS5 and ZEN (Blue edition) 2009 software. Semi-quantitative analysis (See Table S2) was performed manually by examining the sections (one representative section) from each of the three mice from each genotype and assigning the following scores based on the pattern of immunoreactivity (+++ strong immunoreactivity/accumulation, ++ moderate immunoreactivity/accumulation, + mild immunoreactivity, ● aggregates, NA, not available/not included in the study).
Semi-quantitative analysis of fluorescence intensity: The average pixel intensity of the target proteins (Calreticulin, SigR1, GRP78, LC3)/field of view were quantified in one representative section from each of three rd10-P17 and rd10-P26 and one representative section each from three age-matched wild type controls of WT-P26. A total of 8-10 random fields at low magnification (20×) were examined, capturing approx. 15-20-30 ROI with a 40× lens from different parts of the retina (quantification was performed only from the ONL and INL). The average background pixel intensity was subtracted. We used the unpaired Student’s t-test for comparison between two sample groups. Values represent the mean ± standard deviation (SD). Differences between values were regarded as significant when = (* p <0.05, ** p <0.01).

2.7. Western Blot Analysis

Western blots of retina homogenates were performed as described previously [30,32]. Briefly, both the left and right retinae of WT (P26: n = 3) and rd10 mice (P17: n = 4, P26: n = 3) were homogenized in ice-cold radioimmunoprecipitation assay (RIPA) lysis buffer containing protease inhibitor cocktail (Roche Life Science, Penzberg, Germany). The crude lysates were briefly centrifuged and then processed for the bicinchoninic acid protein assay (BCA; Thermo Scientific, Rockford, IL, USA) according to the manufacturer’s protocol. Equal amounts of protein were boiled in Laemmli sample buffer for 5–10 min and processed for SDS-PAGE. The protein gels were transferred onto polyvinylidene fluoride (PVDF) membranes (Merck KGaA, Darmstadt, Germany). The blots were then blocked with 4% skim milk (Sigma-Aldrich, St. Louis, MO. USA) in TBS-T for 30 min and incubated with a specific primary antibody (Table S1) overnight at 4 °C under agitation. Thereafter, the blots were washed three times in TBS-T for 10 min each and incubated for 1 h with an appropriate horseradish peroxidase (HRP)-conjugated secondary antibody (Thermo Scientific). Immunoreactive protein bands were visualized by exposing the blots on an X-ray film (Thermo Scientific, Rockford, IL, USA). Quantification of the band intensities was performed after normalizing to tubulin levels using Adobe Photoshop CS5. Values represent the mean ± SD (* p < 0.05, ** p < 0.01).

2.8. Subcellular Fractionation

Briefly, the subcellular protein fractionation kit (Thermo Scientific/Life Technologies) was used to determine subcellular distributions of RNA binding proteins in rd10 and age-matched WT mice. Both the left and right retinae of each of WT-P17 (n = 3), rd10-P17 (n = 3) WT-P26 (n = 3), rd10-P17 (n = 3), rd10-P26 (n = 3) were collected, pooled, and homogenized (each group containing a total of 6 retinae). Four subcellular fractions were obtained per sample (see below). The standard procedure of subcellular fractionation was performed as previously described [32,33]. In brief, both the left and right retinae were washed gently with ice-cold PBS and processed for subcellular protein fractionation according to the manufacturer’s protocol. The RBP levels were analyzed in the cytoplasmic extract (Ce), membrane extract (Me), soluble nuclear extract (Ne), and chromatin-bound nuclear extract (Cbe) fractions by immunoblotting.

2.9. Transmission Electron Microscopy (TEM)

TEM of the retinae of rd10, as well as that of age-matched WT, mice were performed using standard protocols [32,33]. Briefly, retinae were fixed in 2.5% glutaraldehyde in 0.1 M phosphate buffer for 24 h followed by washing in the buffer for another 24 h. These samples were then incubated in 1% osmium tetroxide (OsO4, in 0.2 M phosphate buffer) for 3 h, washed twice in distilled water, and dehydrated using ascending alcohol concentrations (i.e., 25%, 35%, 50%, 70%, 85%, 95%, 100%; each step for 5 min). Dehydrated blocks were incubated in propylene oxide followed by a subsequent 20 min incubation in a 1:1 mixture of epon (47.5% glycidether, 26.5% dodenylsuccinic acid anhydride, 24.5% methylnadic anhydride, and 1.5% Tris (dimethyl aminomethyl phenol) and propylene oxide. The samples were then incubated in epoxy resin for 1 h at room temperature followed by polymerization (28 °C for 8 h, 80 °C for 2.5 h, and finally at room temperature for 4 h). Ultra-thin sections (70 nm) were mounted on grids, contrast-enhanced with uranyl acetate and lead citrate, and examined using a Philips CM10 transmission electron microscope equipped with a Morada digital camera as already described [32,33].

2.10. Statistics

We used densitometric analysis on the protein bands on the Western blots by using Adobe Photoshop, representing the relative band intensity of the test proteins normalized with tubulin levels. Graphpad prism was used to conduct unpaired Student’s t-tests for comparisons between two sample groups. Values were expressed as mean ± standard error of the mean (SEM) from three independent experiments. The asterisks (*) denote significant differences (* p < 0.05, ** p < 0.01). The (#) denotes not significant.

3. Results

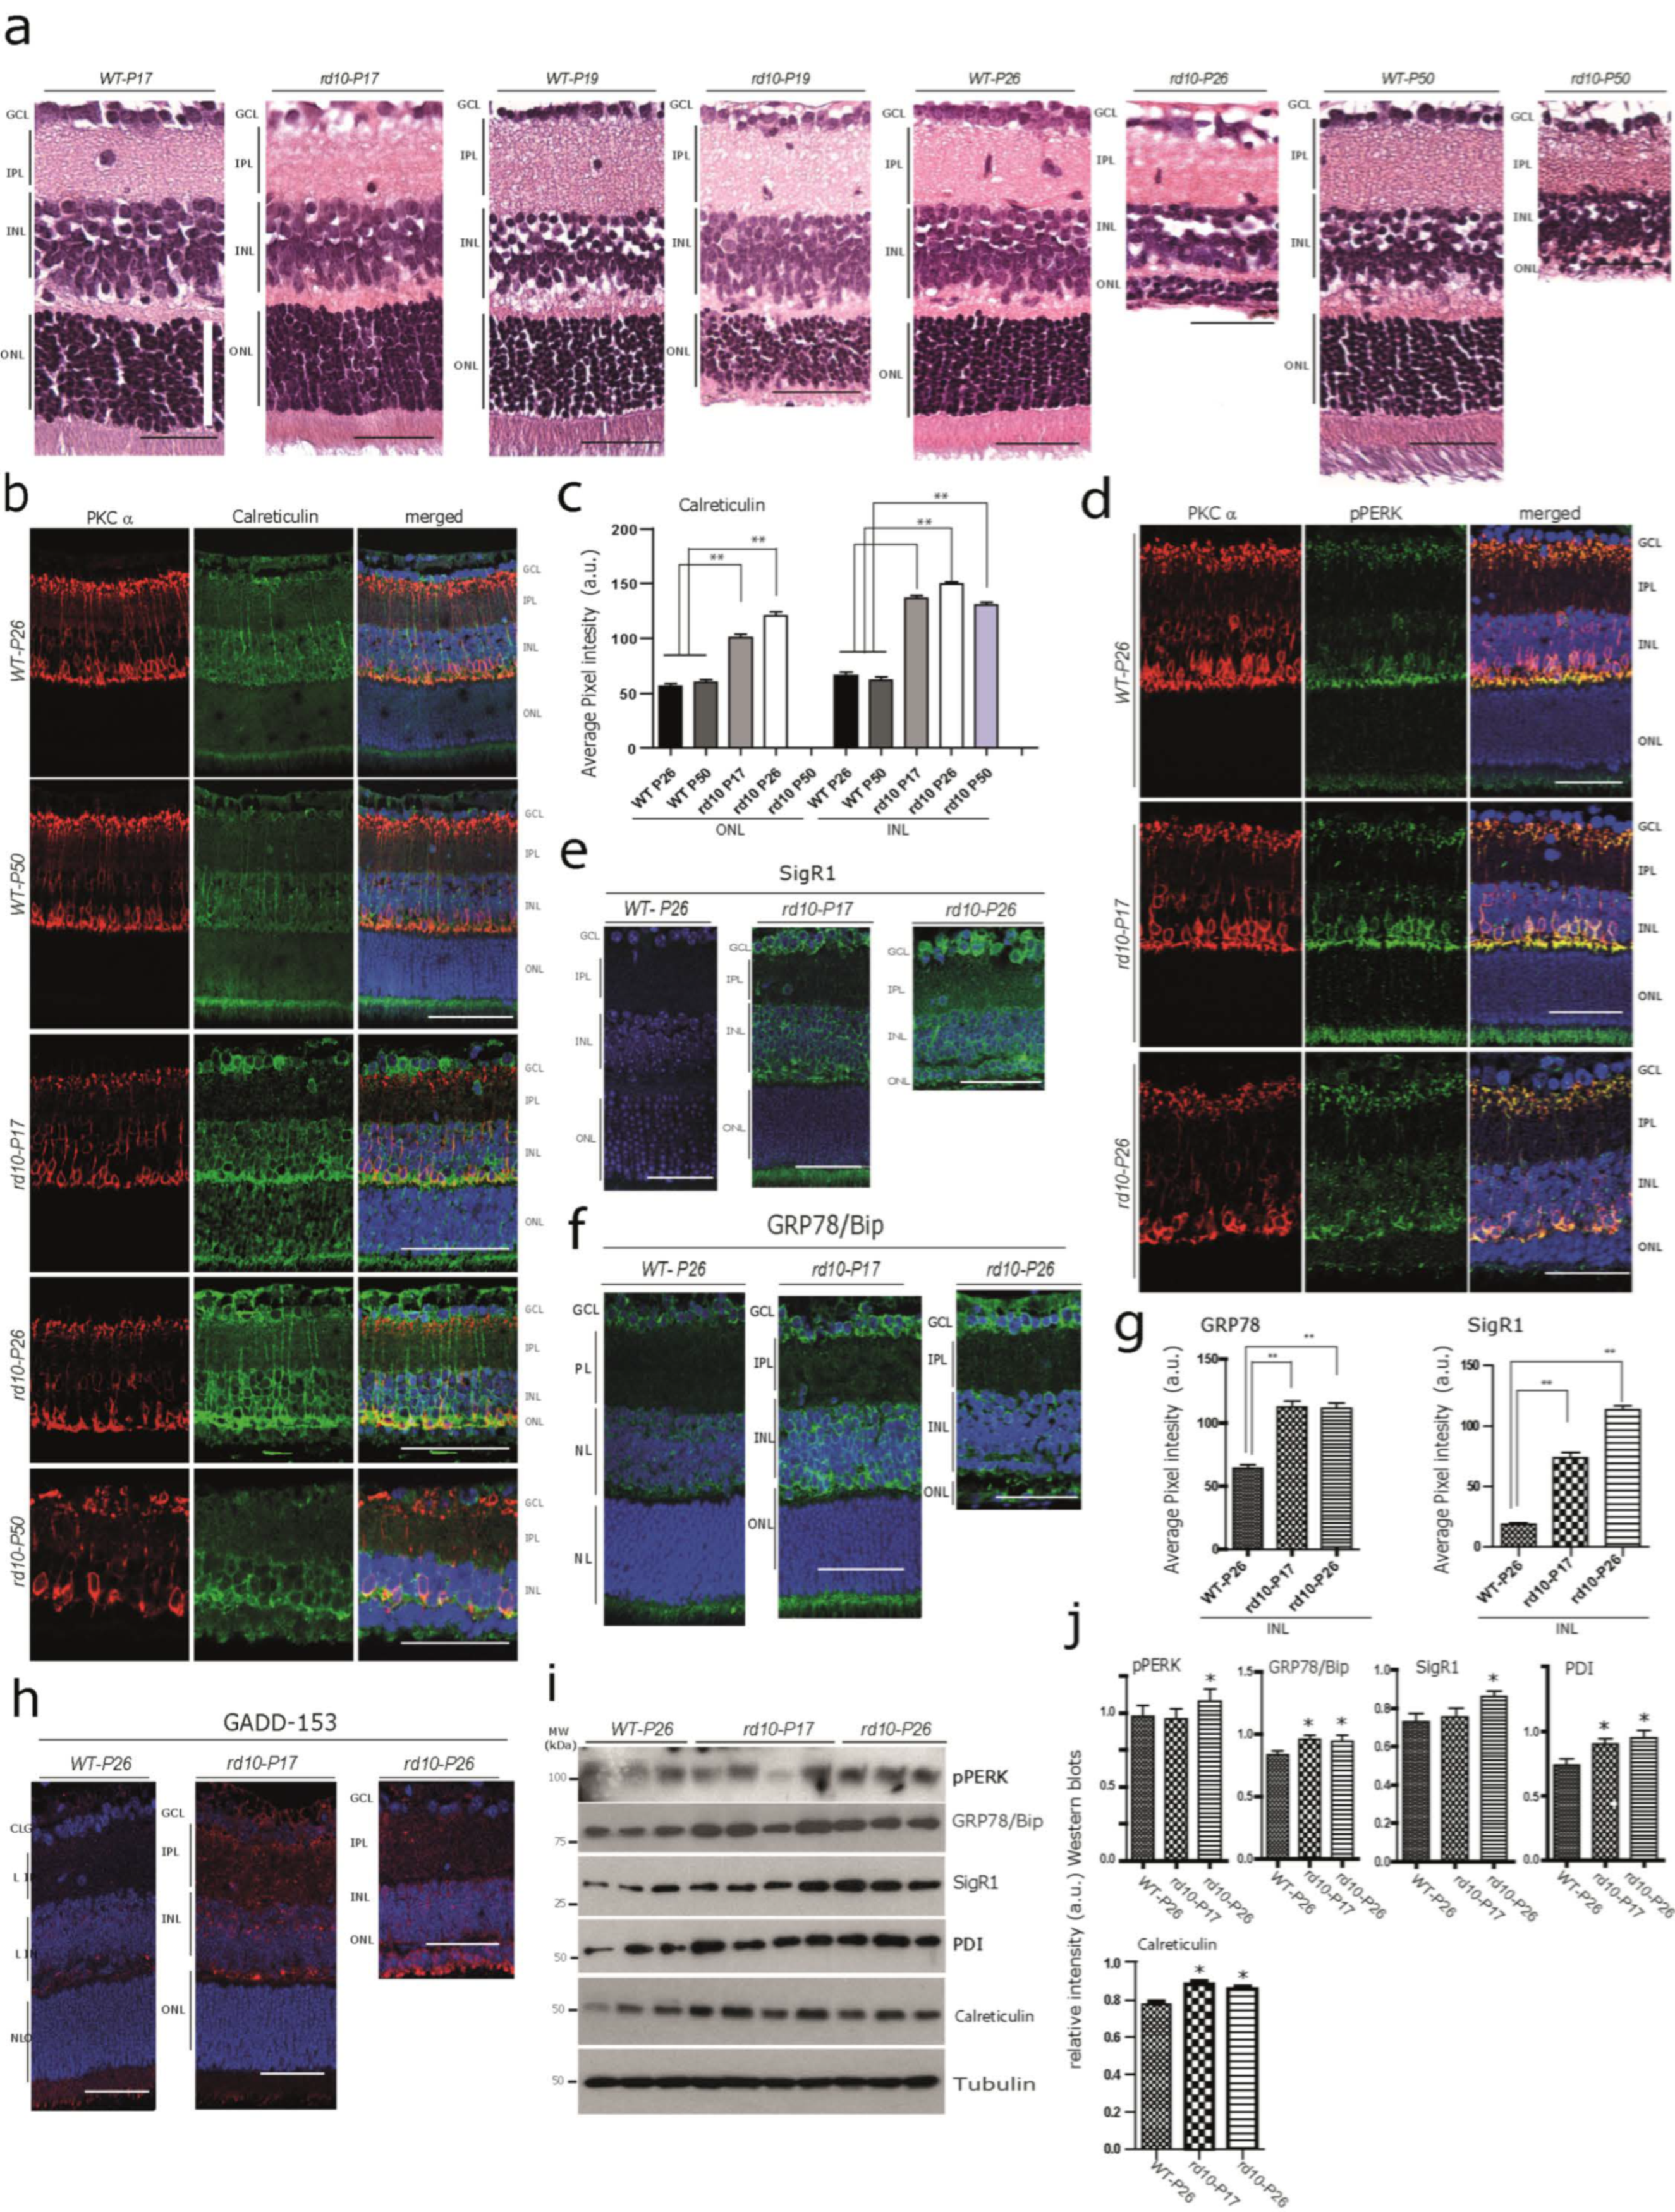
3.1. Increased Immunoreactivity and Protein Expression Levels of Calcium-Binding/Buffering Chaperones and ER Stress Markers in the rd10 Retina before any Noticeable Photoreceptor Loss at P17

Photoreceptor degeneration in the rd10 retina starts at 17–18 days after birth [11,13,14,21]. Consistent with the above studies, there was no obvious difference detected in the overall thickness measurements of the outer nuclear layer (ONL) of rd10-17 (see white scale bar), and any degenerative changes were hardly noticeable morphologically at this point when compared with the wild-type controls (Figure 1a) by light microscopy. At P19, photoreceptor loss became apparent by detectable thinning of the ONL (Figure 1a). At P26, the thickness of the ONL was dramatically reduced due to a massive loss of photoreceptors (Figure 1a). At this stage, around 70–80% of the rod and at least 60–70% of the cone photoreceptor cells were already lost [21,22]. At P50, nearly all the photoreceptors from ONL had degenerated, while the inner retinal layers (INL and GCL) were barely affected (Figure 1a). In contrast, no neurodegeneration was detected and there was no difference in the staining intensity and pattern of immunoreactivity of any of the test markers (used in this study) among the controls (WT) from P17, P19, P26, and P50.
Considering an overall calcium imbalance as an outcome of the Pde6b gene defect, we anticipated the dysregulation of Ca2+-associated proteins in photoreceptors at rd10-P17 and P26. In order to confirm this, we stained for the Ca2+ binding protein calreticulin, which is involved in Ca2+ buffering and storage. We found an increased calreticulin immunoreactivity at rd10-P17 and P26 in photoreceptor layers. Interestingly, we also observed increased immunostaining in the somata of the INL and GCL from rd10-P17 and P26 compared with WT-P26 and P50 (Figure 1b, quantification c), indicating that downstream targets are also affected. In addition, we observed increased calreticulin immunoreactivity in rod bipolar cells of rd10-P17 and P26 and even at P50, when the photoreceptors were almost completely lost (Figure 1b, lower panel, quantification c). We used PKCα as a marker to detect rod bipolar cells, which are postsynaptic to rods. Their loss was apparent at the later stages of rd10 neurodegeneration [34,35]. These results were consistent with the Western blot analysis of the calreticulin protein performed on rd10 retinal lysates (Figure 1i, quantification j). Subsequently, we examined the immunoreactivity patterns of two other Ca2+ buffering chaperones, PDI and pPERK. pPERK was also slightly increased in rod bipolar cells and photoreceptor inner segments (below the ONL) (Figure 1d, see also Table S2 for semi-quantitative analysis), while PDI was expressed more strongly in the processes running vertically through the retina, most likely originating from the Müller cells (the major retinal glia cell type) at rd10-P26 (Figure S1a, see also Table S2 for semi-quantitative analysis) in rd10 mice. Taken together, these results suggest alterations in Ca2+ homeostasis already at an early stage before any obvious/major photoreceptor loss.
Next, we examined whether the ongoing Ca2+ imbalance/altered Ca2+ homeostasis is associated with increased ER stress levels. For this purpose, we used antibodies against the ER chaperones SigR1, GRP78/Bip, and GADD-153 (Figure 1e,f,h, quantification g). Whilst only a low level of SigR1 immunoreactivity was observed in WT retina, we found significant expression of SigR1 in the photoreceptor inner segments and in INL and GCL somata at rd10 P17, and also in photoreceptor somata at P26 (Figure 1e, quantification g). Immunoreactivity for GRP78/Bip and GADD-153 was only mildly increased (Figure 1f–h, quantification g, see also Table S2 for semi-quantitative analysis). GRP78/Bip was increased in the ganglion cell layer (GCL), suggesting chronic ER stress in these cells. Consistent with the immunohistochemical results, Western blotting analysis revealed significantly increased levels of GRP78/Bip, PDI, and calreticulin in both the rd10 retinae at P17 and P26 compared with the wild-type (WT) at P26, while pPERK and SigR1 protein levels were found to be significantly increased only at P26 of rd10 retinae (Figure 1i, quantification j).

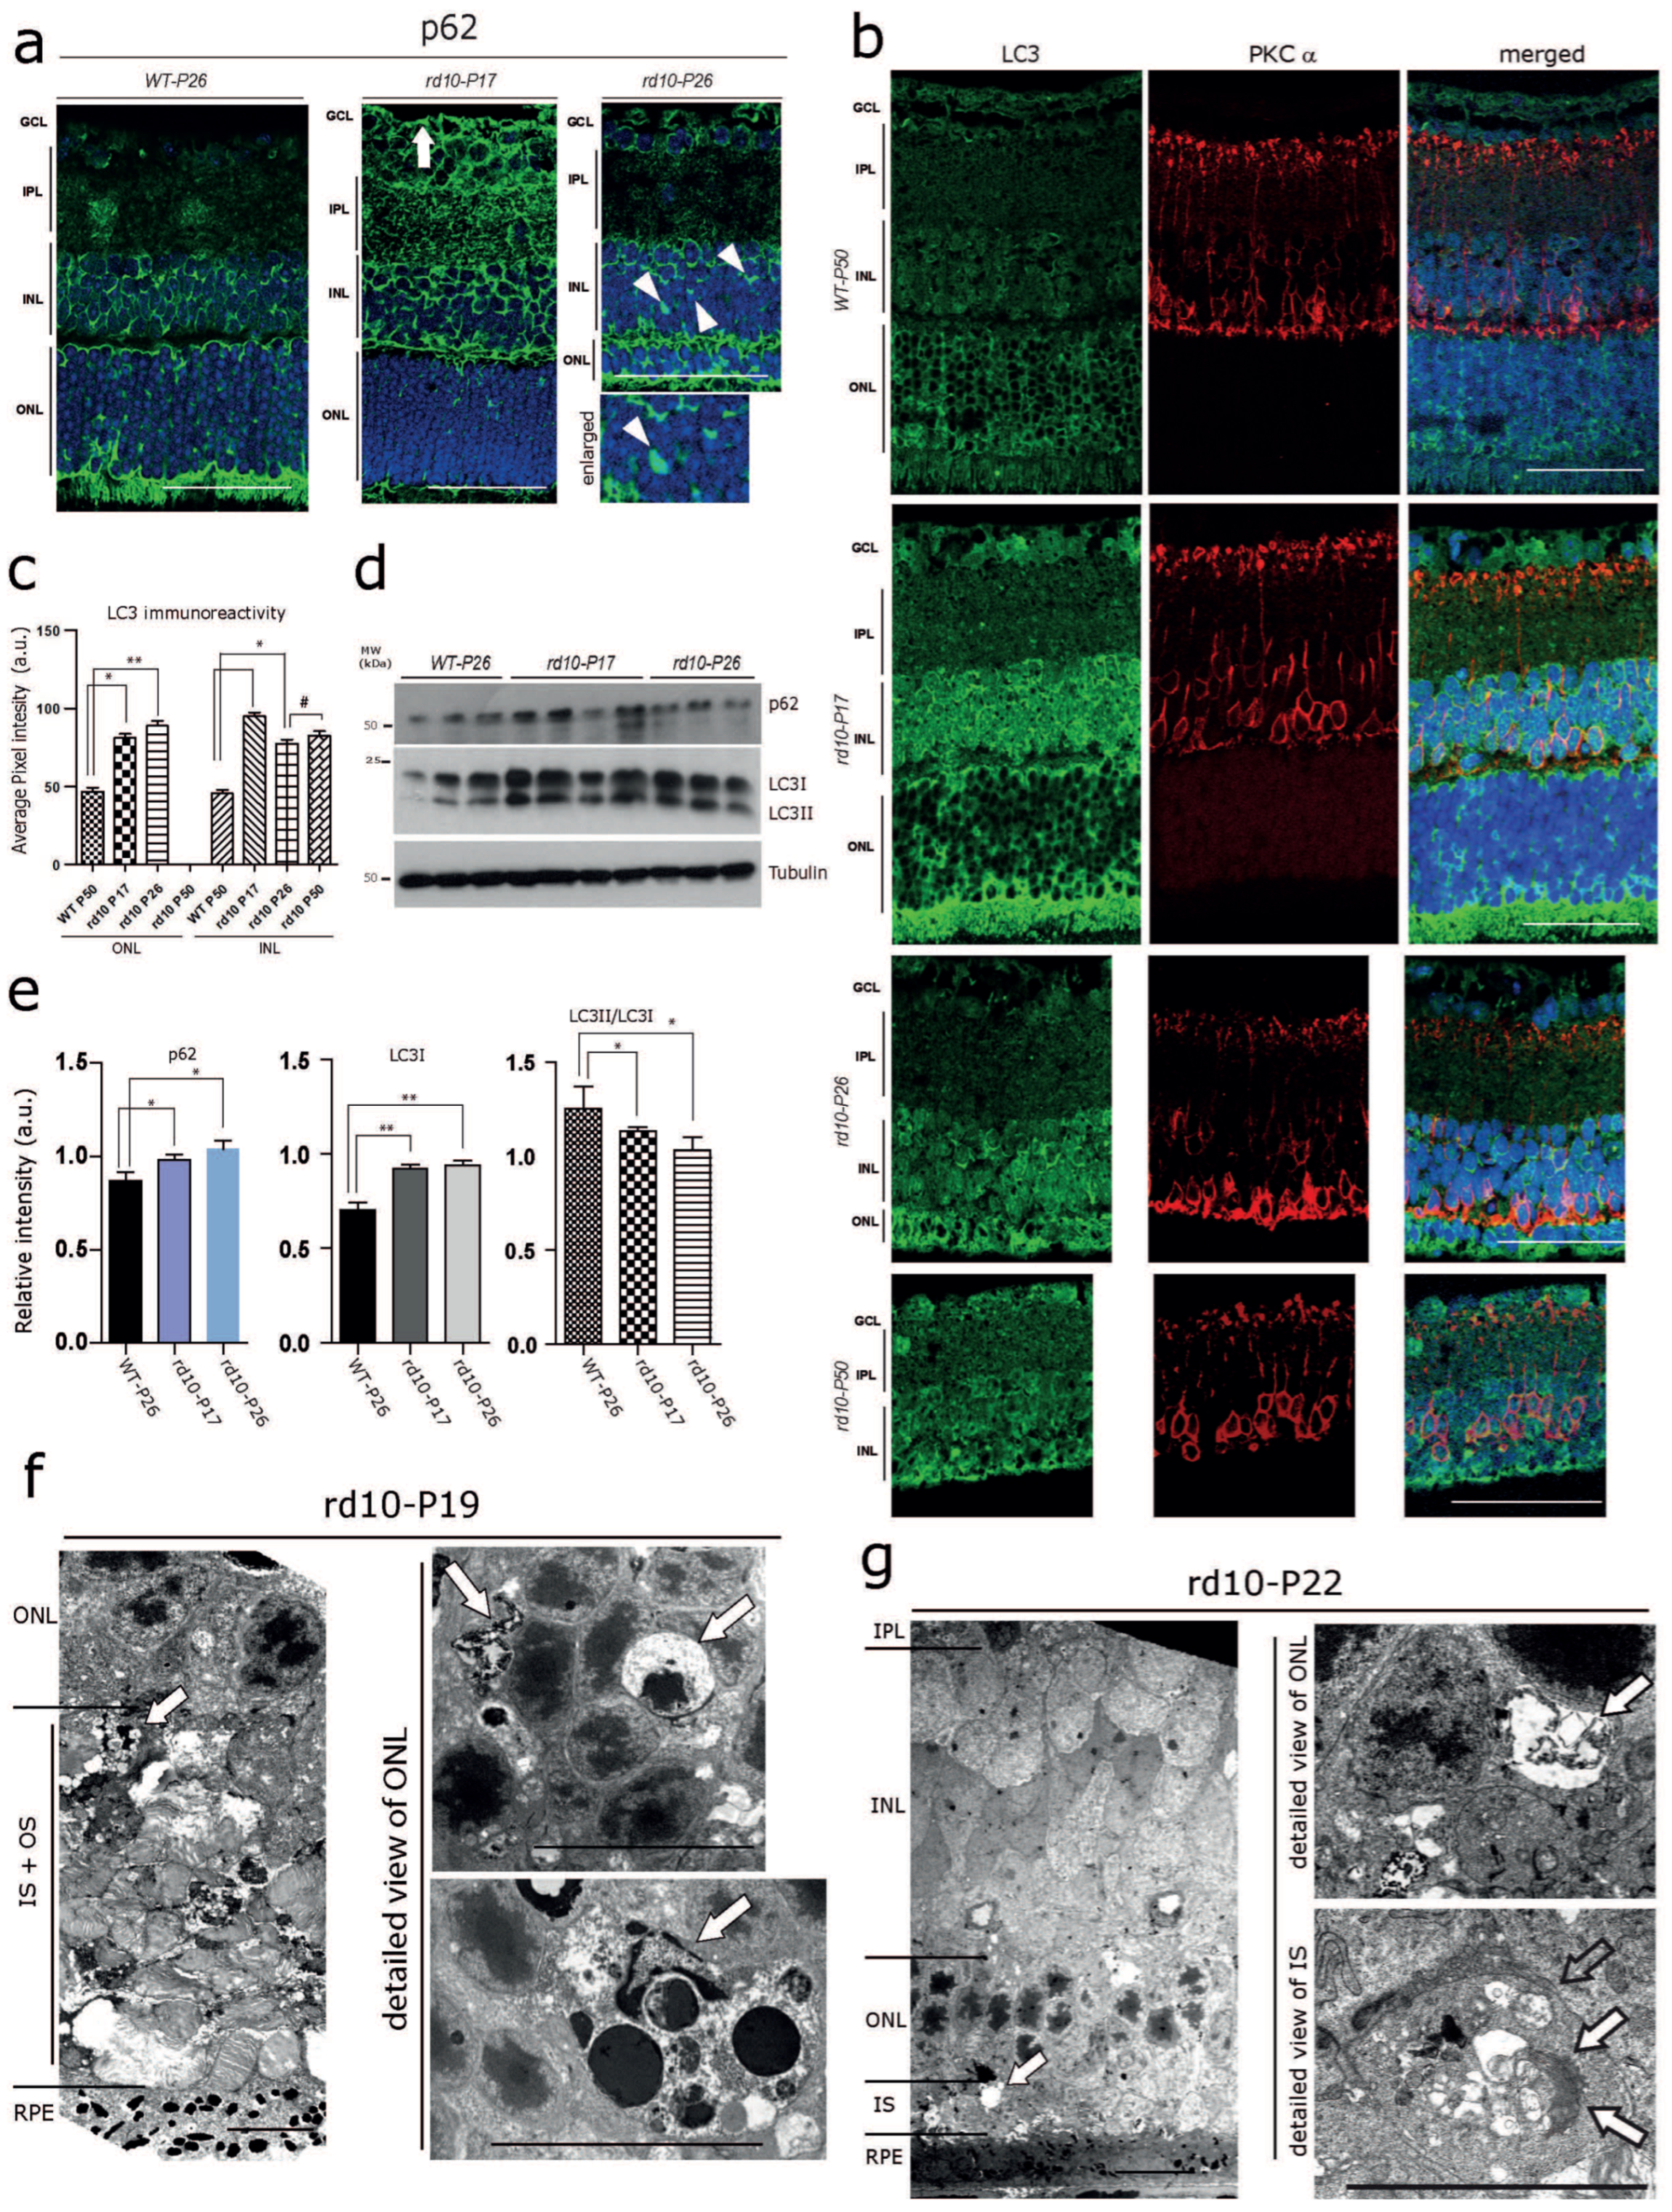
3.2. Early Autophagy Alterations in the rd10 Retina

Autophagy is known to be tightly linked to the ER and decisive in preventing neurodegeneration mediated by ER stress [36,37]. Therefore, we hypothesized that altered ER-Ca2+ homeostasis in the rd10 retina might lead to alterations in the autophagy process. As expected, immunoreactivities for the autophagy adaptor protein p62 and the autophagosome marker LC3 were significantly increased in the INL and the GCL of rd10-P17, and to a lesser extent of rd10-P26, compared with WT-P26 (Figure 2a,b; see also Table S2 for semi-quantitative analysis). In addition, several cells of rd10-P17 mice harbored cytoplasmic accumulations of p62-positive material/inclusions (Figure 2a, arrows, arrowhead). There was a significantly increased level of LC3 at rd10-P17, and a slight increase at P26; however, LC3 levels were not increased further at P50 (Figure 2b). Consistent with the immunolabelling results, immunoblot analysis revealed an overall increase in levels of p62 and increased levels of both LC3I [36] and LC3II in rd10-P17, as well as rd10-P26 retinal lysates (Figure 2d; quantification e; WT-P26 n = 3, rd10-P17 n = 4, rd10-P26 n = 3). Increased levels of both LC3I and lipidated LC3II (not shown) and altered levels of the ratio between LC3II/LC3I were suggestive of altered autophagy, most likely at both the initial (autophagosome formation/maturation) and final steps (autophagosome fusion to lysosomes) [38,39,40]. Neurodegeneration along with marked autophagy impairment in photoreceptors was later confirmed by the presence of large abnormal cytoplasmic autophagic vacuoles filled with membranous and granular debris in photoreceptor inner segments (IS) and somata in the ONL of rd10 mice at P19 (Figure 2f) and at P22 (Figure 2g) examined by electron microscopy. Such vacuoles were absent from WT controls (not shown). Taken together, these data show that signs of ER stress and defective autophagy are already manifested in photoreceptor and non-photoreceptor cell populations in the rd10 retina at early stages of photoreceptor degeneration.

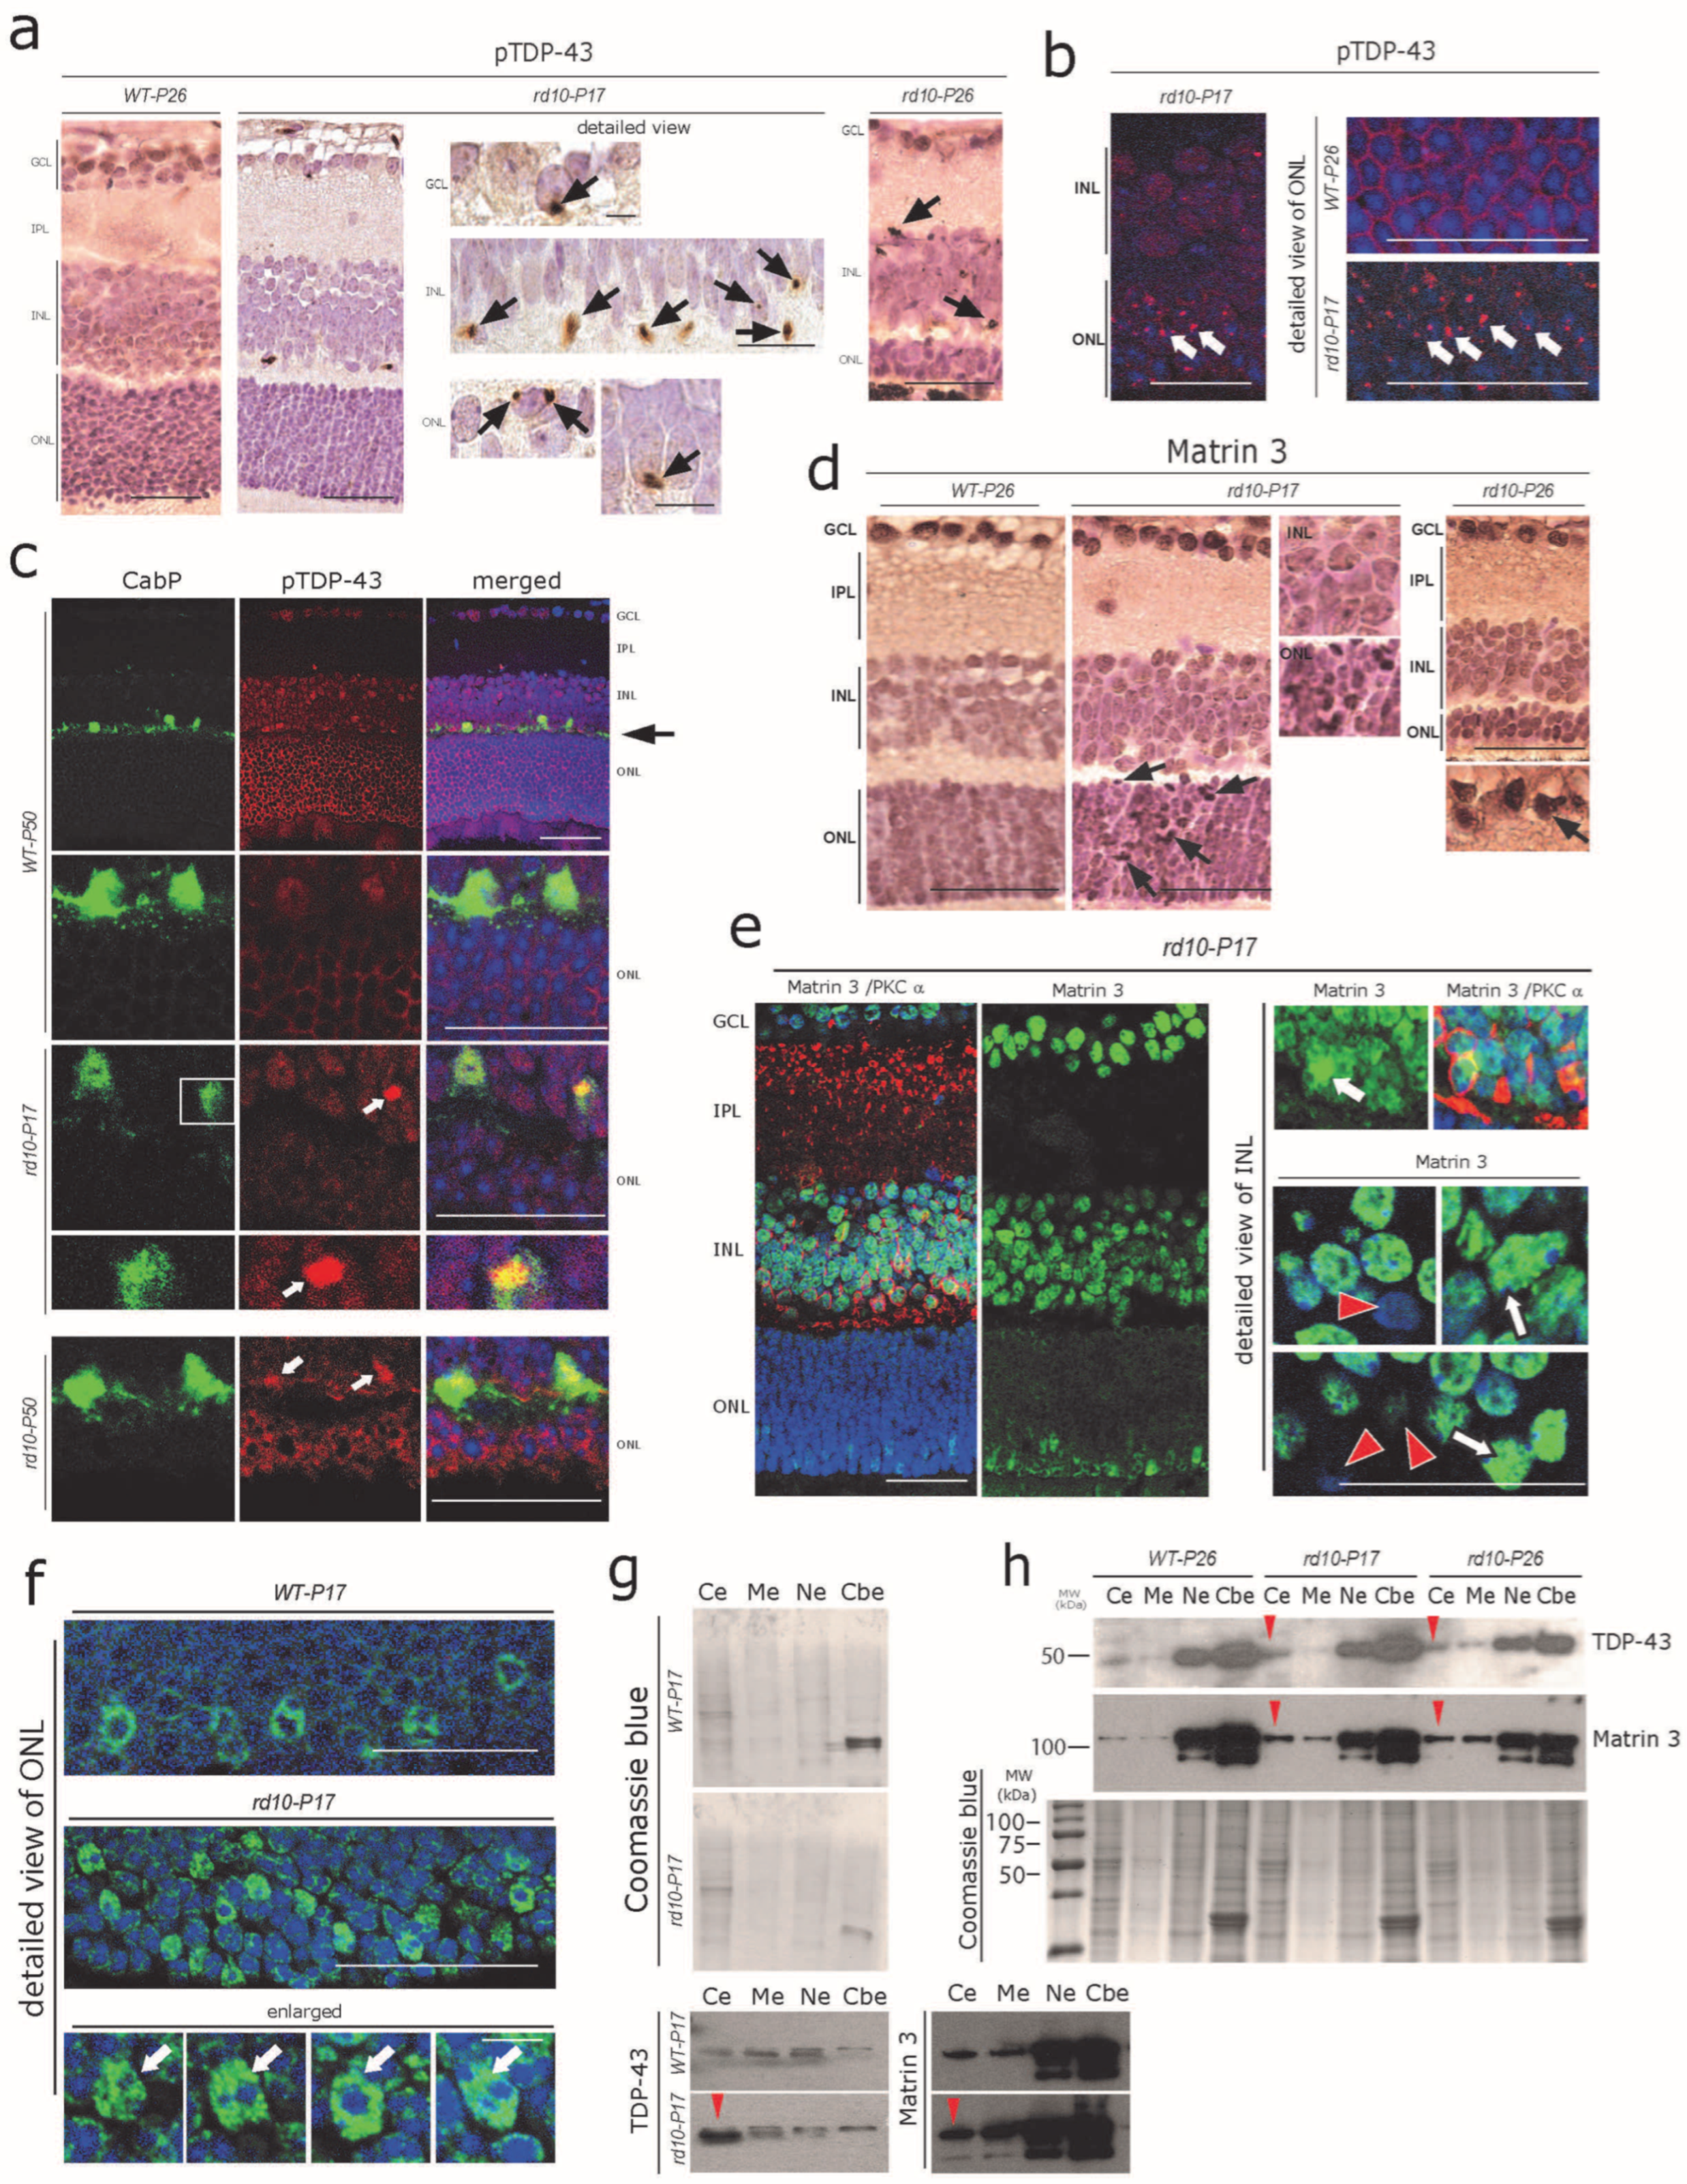
3.3. Abnormal Cytoplasmic Aggregation of pTDP-43 and Matrin 3 at Early Stages of rd10 Retina Degeneration

ER-Ca2+ dynamics can efficiently regulate autophagy as well as RBP homeostasis; on the other hand, aberrant ER-Ca2+ may serve as a major driver for RBPs’ alterations including TDP-43-mediated neuronal toxicity [41,42]. Similarly, the effective turnover/clearance of many disease-associated RBPs such as TDP-43 and FUS is regulated by the ubiquitin-proteasome system (UPS) and autophagy [43,44]. Thus, we aimed to determine whether ongoing ER-Ca2+ autophagy defects are associated with altered distribution of key RBPs linked to neurodegenerative disease, in particular TDP-43, FUS, and Matrin 3. These RBPs normally reside in the nucleus. In pathological/neurodegenerative conditions such as amyotrophic lateral sclerosis/frontotemporal lobar degeneration (ALS/FTLD), they often accumulate in the cytoplasm of affected neurons [45,46,47]. Using DAB immunohistochemistry, we found globular cytoplasmic pTDP-43 aggregates already present at P17 throughout the retinal cell layers including many photoreceptors, INL cells, and ganglion cells (Figure 3a; see also Table S2 for semi-quantitative analysis). pTDP-43 aggregates were also evident at considerable numbers at P26, but there was no further increment regarding their number nor their staining intensity (Figure 3a, right panel, see also Table S2 for semi-quantitative analysis) compared with P17. Immunofluorescence using the same antibody showed a higher sensitivity and revealed the accumulation of pTDP-43 in more than one-third of the photoreceptors (Figure 3b) at P17 and nearly 40% at P19 in the ONL, when the acute degeneration of the photoreceptors was the most pronounced (not shown). In line with the results obtained from the sections stained with DAB-immunohistochemistry mentioned above, pTDP-43 aggregation did not increase further at P26 nor at P50 (not shown) compared with P17. Interestingly, both DAB and immunofluorescence labelling consistently depicted pTDP-43 immunoreactive inclusions also present in cells at the outer margin of the inner nuclear layer. We recognized these cells as horizontal cells by using co-immunolabelling against the CabP antibody (Figure 3c).
The expression of TDP-43 is tightly regulated by another closely related RBP, Matrin 3 [48]. We found a mild cytoplasmic and stronger nuclear accumulation of Matrin 3 in rd10 mouse ONL, INL, and GCL cells at rd10-P17 and P26 (Figure 3d, arrows). Again, immunofluorescence labeling using the same antibody was very sensitive and revealed an altered pattern of Matrin 3 immunoreactivity, with increased granular nuclear accumulation of Matrin 3 in many cells (Figure 3e, arrows, right panel); on the other hand, several adjacent cells showed reduced levels of nuclear Matrin 3 immunoreactivity (Figure 3e, red arrowheads). Interestingly the photoreceptors showed an overall increase in the nuclear accumulation of Matrin 3 (arrows) in rd10-P17 compared with WT-P17 (Figure 3f, arrows). These results were further verified by Western blot analysis of subcellular fractions obtained from the retinal lysates (Figure 3g, red arrowheads; a pool of n = 3 WT-P17 and n = 3 rd10-P17, and Figure 3h, red arrowhead, pool of n = 3 WT-P26, n = 3 rd10-P17, and n = 3 rd10-P26), see Section 2 (Methods for details).

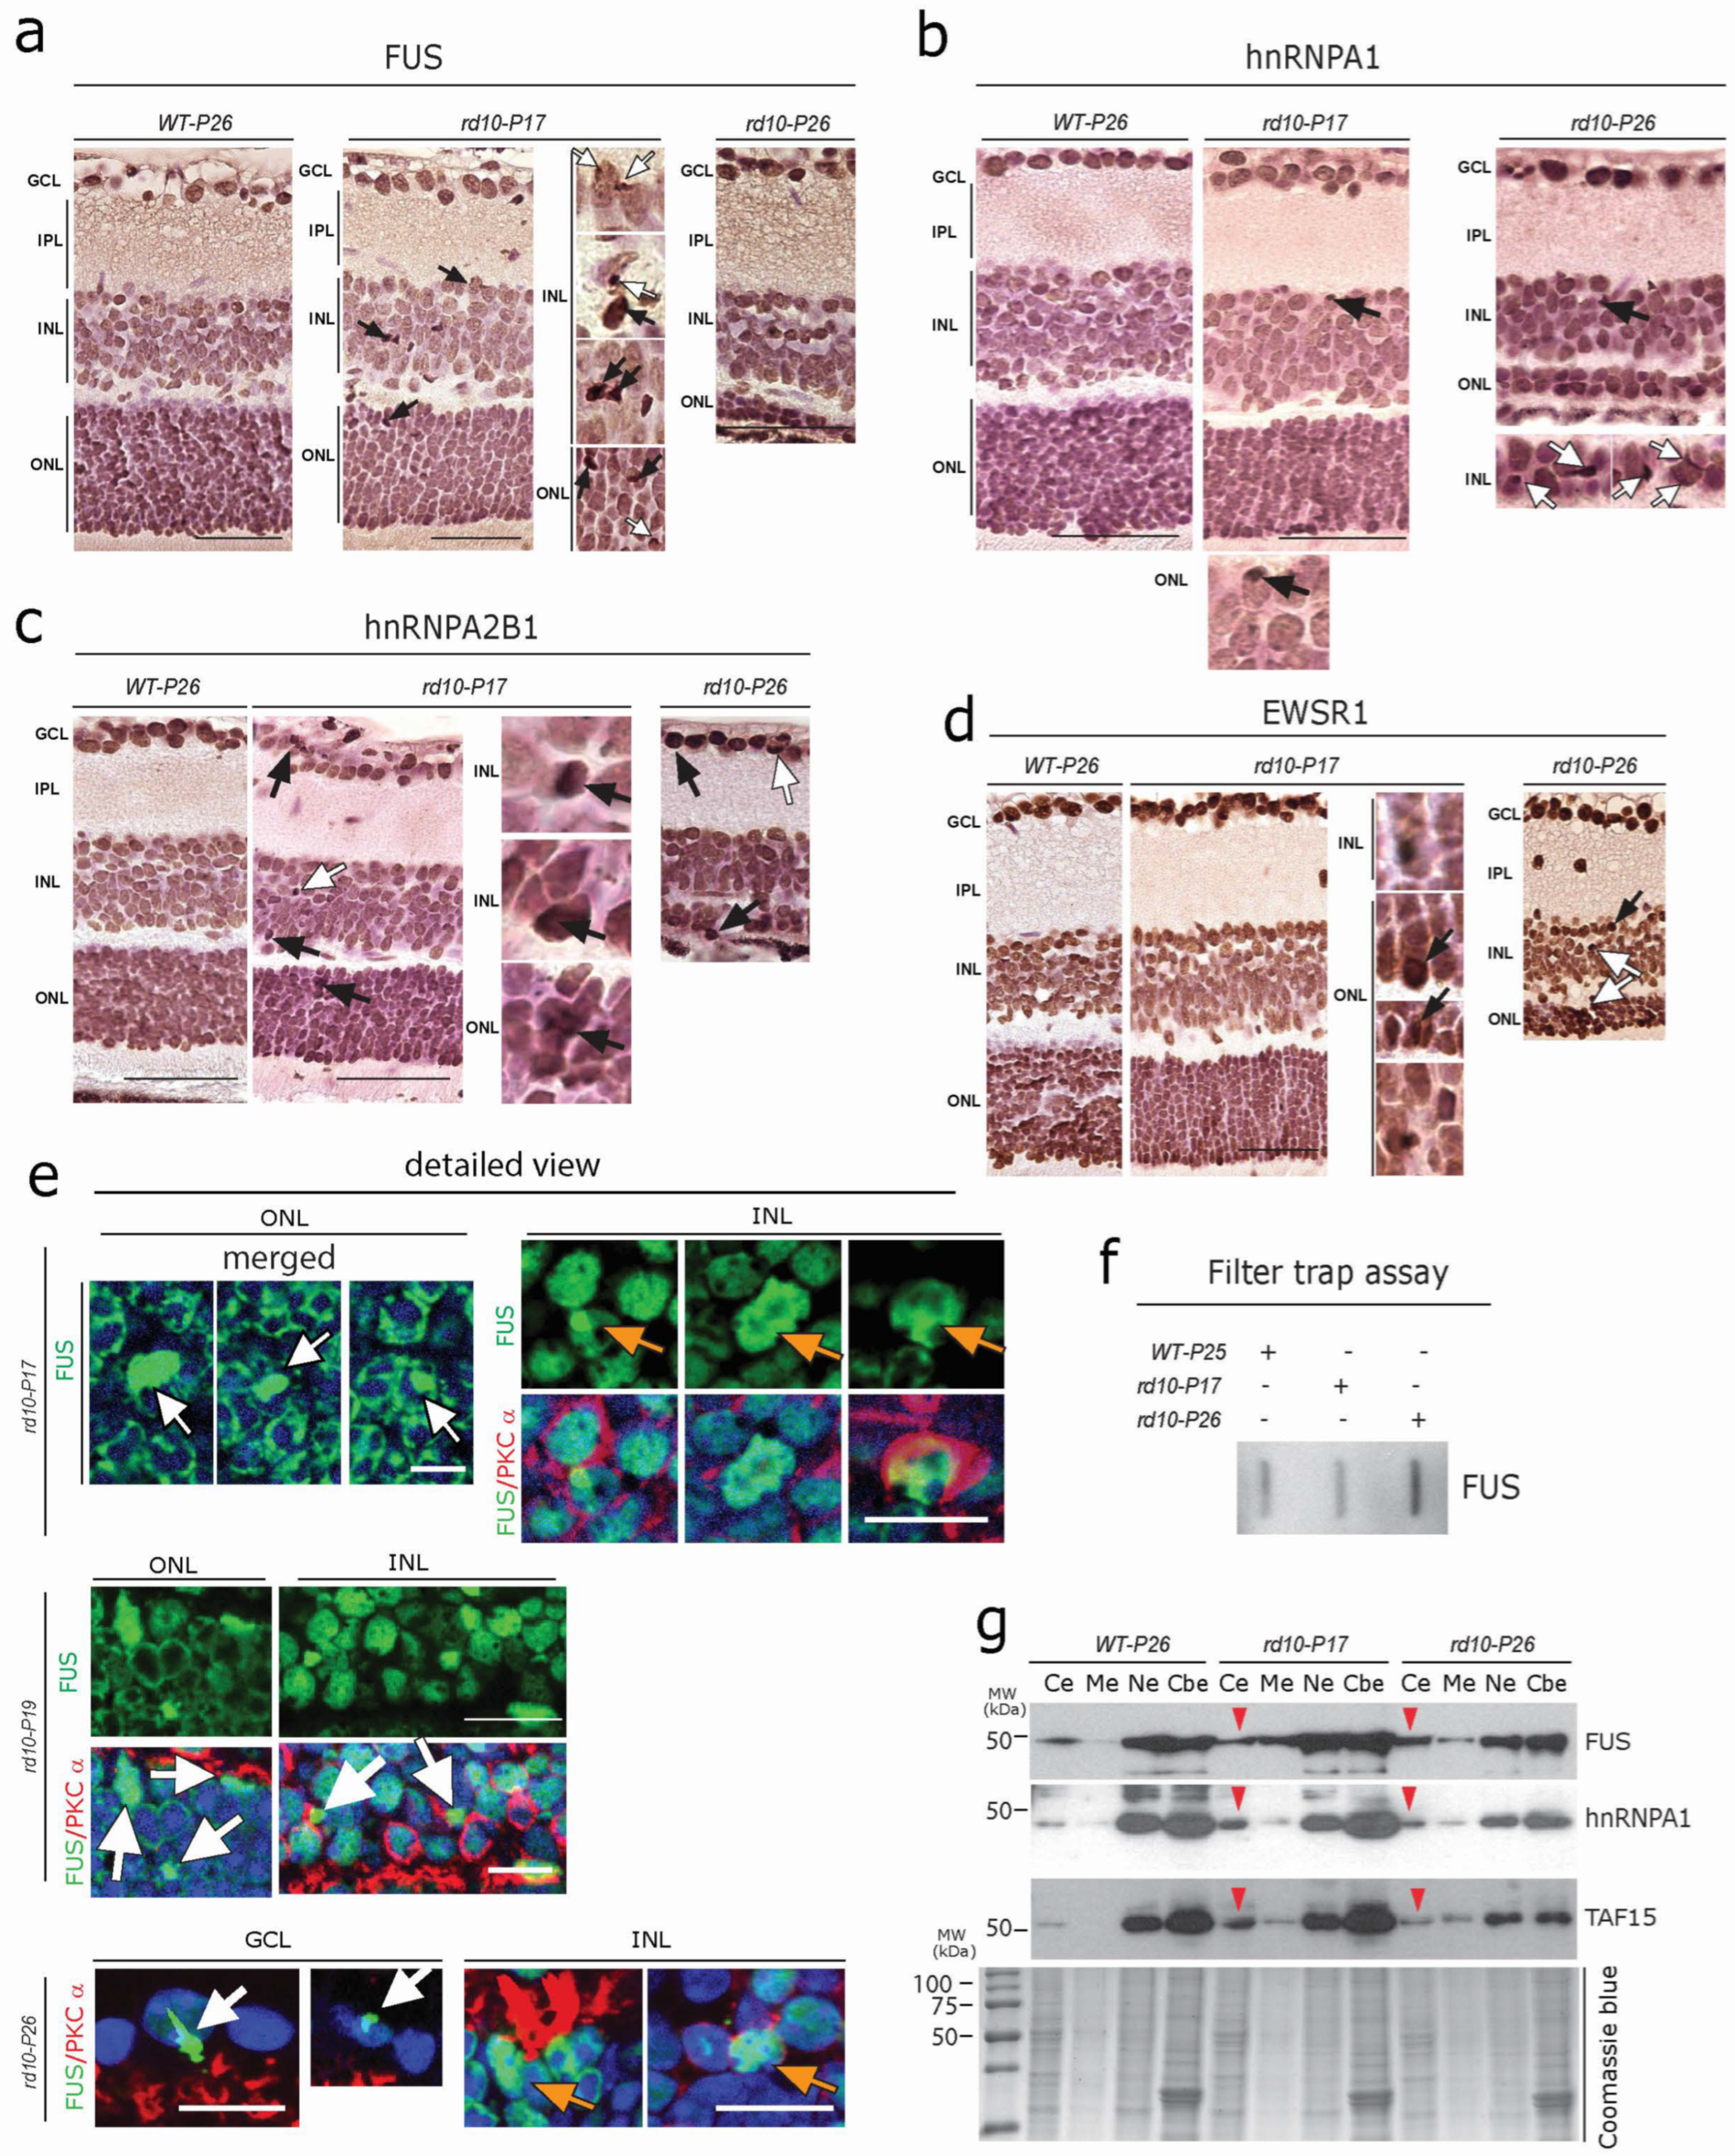
3.4. Aggregation of FET Family Proteins (FUS, EWRS1, and TAF15) in rd10 Retina

Members of the FET protein family (FUS, EWSR1, and TAF15) bind to RNA/DNA and regulate transcription, RNA processing, and other aspects of RNA/DNA homeostasis [49,50,51,52]. FET proteins are involved in several neurodegenerative diseases as they can also form toxic aggregates, and perturb protein homeostasis, thus driving neurodegeneration [49,52]. We observed globular cytoplasmic FUS protein accumulation in both photoreceptors and many cells of the INL (Figure 4a, white arrows). Focal intra-nuclear FUS-positive accumulations, as well as strongly labeled FUS-positive condensed/pyknotic nuclei (Figure 4a, black arrows), were also evident. Similar to the pattern of FUS immunoreactivity, other FET family member proteins such as hnRNPA1, hnRNPA2B1, and EWSR1 often showed focal intranuclear accumulation (Figure 4b–d, black arrows). hnRNPA1 and EWSR1, however, did not show significant cytoplasmic accumulation at P17, but at P26, several cytoplasmic globular aggregates were visible in photoreceptors and INL cells (Figure 4b–d, white arrows). Here again, immunofluorescence showed a higher sensitivity; large globular FUS immunoreactive aggregates were extensively observed in the photoreceptors of rd10-P17 mice (Figure 4e, white arrows, upper left). Similarly, both focal intranuclear accumulation (Figure 4e, orange arrows, upper right), as well as cytoplasmic inclusions of FUS in rod bipolar cells (labeled for PKCα) (Figure 4e, white arrows), were evident in rd10 mice at P17, P19, and P26. In addition to this, large FUS-immunoreactive aggregates were also evident in GCL cells at rd10-P17 (not shown) and P26 (Figure 4e, white arrow, lower panel). The formation of SDS-resistant FUS aggregates in the rd10 retina was further confirmed by using a standard filter trap assay (Figure 4f). Consistent with this, subcellular fraction analysis using Western blots of retinal lysates further confirmed the cytoplasmic mislocalization (red arrowhead) of FUS, hnRNPA1, and TAF15 in rd10-P17 and rd10-P26 retinae (pool of n = 3 WT-P26, n = 3 rd10-P17, and n = 3 rd10-P26, Figure 4g).

3.5. Formation of RNA Stress Granules (SGs) in rd10 Retina

The aggregation of the above-mentioned RBPs mostly proceeds through the SG pathway and might thus serve as a seed for further pathological aggregates, if persistent [46,47,53,54,55]. Therefore, we asked whether the accumulations of the RBPs studied were accompanied by SG formation. We found small globular cytoplasmic aggregations of the widely studied SG protein Tia1 in photoreceptors and INL cells of rd10-P17 and P26 mice (Figure 5a, white arrows), together with focal intranuclear accumulation (Figure 5a, black arrows). Interestingly, Tia1-positive SG accumulations were abundant especially at early stages of retinal degeneration (P17), and they appeared less frequently at a later stage (P26) (Figure 5a, right panel P26). Co-immunolabelling using a combination of Tia1 and FUS or TDP-43 antibodies revealed a clear pattern of sequestration of Tia1 with FUS and TDP-43 within these aggregates (Figure 5b, arrows). Consistent with this, subcellular fraction analysis using Western blots of retinal lysates further confirmed the cytoplasmic accumulation of Tia1 (red arrowheads) at P17 and P26 (pool of n = 3 each of WT-P26, rd10-P17, and rd10-P26, Figure 5c). These results further confirm the notion that RBP aggregates proceed through the SG pathway and that aberrant SGs containing RBPs can be considered to be an early pathological event in the aggregation of RBPs.

4. Discussion

In the commonly used rd10 mouse model of retinitis pigmentosa, a mutation in the Pde6 gene leads to photoreceptor degeneration and consequent blindness [11,12,13,14,15]. Milder and slower degeneration in certain second and third-order neurons also occurs. As Pde6 is exclusively expressed in rod photoreceptors, this degeneration must be a secondary effect, e.g., as a consequence of the lack of synaptic input by the photoreceptors [11,12,13,14,15,21]. However, the pathomechanisms of the degeneration of non-photoreceptor neuronal cell types in RP are poorly understood. Photoreceptor degeneration in the rd10 retina starts at 17–18 days after birth [11,12,13,14,15,21]. At P17, all cell layers still appear anatomically unchanged compared with age-matched WT retina (Figure 1), and light responses can be recorded on the level of the electroretinogram or individual ganglion cells [14,56]. Interestingly, at P17, we could already find the expression of several markers commonly observed in other types of neuronal degeneration, not only in photoreceptors but also in cells of the INL and GCL. We found (a) increases in the Ca2+ buffering chaperones calreticulin, PDI, and pPERK, together with the ER chaperones SigR1 and GRP78/Bip; (b) altered expression of the autophagy proteins p62 and LC3, together with the accumulation of autophagic vacuoles; (c) cytoplasmic and nuclear aggregation of RBPs such as pTDP-43 and FET-family RBPs (see also schematic representation Figure 6). In the early stage, only rod photoreceptors die, followed by cones later in the process. In line with this, we found that the two cell types that receive direct input from rods and which display considerable loss at later stages of retinal degeneration [34,35], i.e., the rod bipolar cells and the horizontal cells (see, e.g., Figure 1 and Figure 3), express the markers summarized above. These results suggest that deleterious effects due to altered Ca2+ homeostasis and ER stress initiated in rods lead to similar alterations in interconnected cell types. From this point of view, it appears logical that these cell populations upregulate levels of neuroprotective ER chaperones. In fact, SigR1 is extensively studied for its neuroprotective role in retinal cells [57,58,59,60].
Above-threshold Ca2+ imbalance and ER stress that cannot be managed by the above-mentioned factors should eventually lead to the failure of cellular proteostasis networks including protein quality control/autophagy pathways, resulting in misfolded protein aggregation and associated neurotoxicity (see also schematic representation Figure 6). This has been observed in major chronic neurodegenerative disorders including Alzheimer’s disease (AD), Huntington’s disease (HD), Parkinson’s disease (PD), and amyotrophic lateral sclerosis (ALS) [25,61,62]. Altered proteostasis has also been previously discussed as a factor contributing to the spread of degenerative pathology in RP retina cell populations [15,21]. The results of the present study add credibility to this concept. They add the surprising observation that abnormal protein aggregates can already be observed at the early stages of neurodegeneration, not only in photoreceptors but also in non-photoreceptor cell types, and that they include aggregates of RBPs—most prominently of TDP-43, an important player in the pathophysiology of several major neurodegenerative diseases including ALS/FTLD [45,52]. Additionally, toxic modifications of these protective proteins caused by chronic cellular stress conditions could contribute to progressive neurodegenerative phenotypes as seen in rd10 retina [15,21,22,63].
RBPs regulate several crucial aspects of neuronal gene expression including splicing regulation, mRNA transport, and modulation of mRNA translation and decay. In addition, RBPs are known to regulate proteostasis and autophagy at multiple steps [45]; in turn, the efficient turnover of several disease-associated RBPs including TDP-43, FUS, and SGs is regulated by UPS and autophagy [43,44]. One of the intriguing aspects observed here is that the build-up of RBP aggregates is happening rather early and quickly, along with the build-up of altered ER-Ca2+ homeostasis and ER stress. Thus, it appears reasonable to assume that the ongoing chronic cellular stress conditions may quickly lead to defects in the nucleus regarding cytoplasmic shuttling and thus to impaired RBP homeostasis [45,46,47,50,53].
Altered RBP homeostasis and defective proteostasis/autophagy are key mechanisms triggering neurodegeneration in many neurodegenerative diseases including ALS [45,46,47,50,53]. We observed both altered autophagy and RBP aggregations at early stages throughout the retinal cell layers, even though the Pde6b gene defect selectively affects rod photoreceptor cells. Moreover, the Pde6b gene does not primarily target RBP metabolism. The RBPs studied here, including TDP-43 and FET proteins such as FUS and EWSR1, are particularly susceptible to aggregation due to the presence of both RNA-binding domains and prion-like domains enriched in uncharged polar amino acids (such as asparagine, glutamine, and tyrosine), which contribute strongly to aggregate formation under stressful stimuli including ER-Ca2+ imbalance, ER-stress, and autophagy impairment [50,51,55,64]. These findings are also reminiscent of various age-related neurodegenerative diseases such as AD, PD, HD, and prion diseases, where specific subsets of neurons are affected and the disease-causing protein aggregates initially appear in a restricted distribution and only later spread throughout the CNS [42]. We observed a close association of RBP build-up with stress granule formation in affected neuronal cells, especially at an early stage (P17) of retinal degeneration in rd10 mice, suggesting that these aggregates arise de novo in these cells.
Further studies will be required to determine how the Pde6b gene mutation leads to this cascade of events. Regardless of the initial events, considering the hierarchical cluster of heterogeneous types of neurons and interconnected, interdependent units, we cannot exclude the possibility that a prion-like seeding and spreading of the above-mentioned RBPs could be implicated further downstream, similar to the spreading of RBP aggregates in other neurodegenerative diseases [65,66].
We conclude that—owing to the clear separation of cell types affected by primary and secondary degeneration—the retina provides an exquisite model to study neuronal degeneration processes, in particular as many similarities were found to processes described for other neurodegenerative disorders. Progressive neurodegeneration in the rd10 mouse retina is associated with early disturbances of proteostasis and autophagy and with abnormal cytoplasmic RBP aggregation and stress granule formation. These processes are already triggered in the very early phases of retinal degeneration (see also schematic representation Figure 6).

Supplementary Materials

The following supporting information can be downloaded at: https://www.mdpi.com/article/10.3390/cells12071094/s1. Figure S1; Figure S2; Table S1: List of primary and secondary antibodies used in this study, previously used by us in the references below: [28,30,32,33,67,68,69]; Table S2: Semi-quantitative analysis of DAB and immunofluorescence staining. Table S3: Age group of wild-type/rd10 mouse retinae and fixation protocols.

Author Contributions

Conceptualization, J.W., F.M. and A.G.; methodology, J.W., F.M., A.G. and A.Y.; Experimental validation, A.Y., P.T., H.G., F.M. and L.S.; EM analysis, F.M. and J.W.; resources, J.W., F.M., S.J. and P.W.; data curation, F.M., A.G. and A.Y.; writing—original draft preparation, A.G. and A.Y.; writing—review and editing, J.W., F.M., A.G., A.Y., S.J. and P.W.; supervision, J.W., F.M. and A.G.; project administration, J.W., F.M. and A.G.; funding acquisition, J.W., F.M., S.J., P.W. and A.G. All authors have read and agreed to the published version of the manuscript.

Funding

This research was supported by the DFG grants, WE1406/14-3 to J.W., WE 1406/16-1 to J.W. and A.G., MU-3036/3-3 to F.M., WA-1472/6-3 to P.W., and JO-1263/1-3 to S.J., by the Interdisciplinary Centre for Clinical Research (IZKF Aachen, N7-4, to A.G. and J.W.) and by the EU Joint Program Neurodegenerative Disease Research (JPND, Fly-SMALS, to J.W.).

Institutional Review Board Statement

All experiments were performed in accordance with the ARVO statement for the Use of Animals in Ophthalmic and Vision Research and the German Law for the Protection of Animals and after approval was obtained by the regulatory authorities of the Forschungszentrum Jülich and the Institute of Laboratory Animal Science (Faculty of Medicine, RWTH Aachen University). A4 application number 11280A4.

Data Availability Statement

The data presented in this study are available on request from the corresponding author.

Acknowledgments

We thank A. Knischewski, C. Krude, H. Mader (Institute of Neuropathology, RWTH Aachen University Hospital), and Christoph Aretzweiler (Institute of Biological Information processing, Forschungszentrum Jülich) for technical support, and S. Gründer (Institute of Physiology, RWTH Aachen University Hospital) and his lab members for support with confocal microscopy. We specially thank Anja Mataruga (Institute of Biological Information Processing, Forschungszentrum Jülich) for her support in performing electron microscopy.

Conflicts of Interest

The authors declare no conflict of interest.

References

  1. Russell, S.; Bennett, J.; Wellman, J.A.; Chung, D.C.; Yu, Z.F.; Tillman, A.; Wittes, J.; Pappas, J.; Elci, O.; McCague, S.; et al. Efficacy and safety of voretigene neparvovec (AAV2-hRPE65v2) in patients with RPE65-mediated inherited retinal dystrophy: A randomised, controlled, open-label, phase 3 trial. Lancet 2017, 390, 849–860. [Google Scholar] [CrossRef] [PubMed]
  2. Sahel, J.A.; Boulanger-Scemama, E.; Pagot, C.; Arleo, A.; Galluppi, F.; Martel, J.N.; Esposti, S.D.; Delaux, A.; de Saint Aubert, J.B.; de Montleau, C.; et al. Partial recovery of visual function in a blind patient after optogenetic therapy. Nat. Med. 2021, 27, 1223–1229. [Google Scholar] [CrossRef] [PubMed]
  3. Kennan, A.; Aherne, A.; Humphries, P. Light in retinitis pigmentosa. Trends. Genet. 2005, 21, 103–110. [Google Scholar] [CrossRef] [PubMed]
  4. Pacione, L.R.; Szego, M.J.; Ikeda, S.; Nishina, P.M.; McInnes, R.R. Progress toward understanding the genetic and biochemical mechanisms of inherited photoreceptor degenerations. Annu. Rev. Neurosci. 2003, 26, 657–700. [Google Scholar] [CrossRef] [Green Version]
  5. Rattner, A.; Sun, H.; Nathans, J. Molecular genetics of human retinal disease. Annu. Rev. Genet. 1999, 33, 89–131. [Google Scholar] [CrossRef]
  6. McLaughlin, M.E.; Ehrhart, T.L.; Berson, E.L.; Dryja, T.P. Mutation spectrum of the gene encoding the beta subunit of rod phosphodiesterase among patients with autosomal recessive retinitis pigmentosa. Proc. Natl. Acad. Sci. USA 1995, 92, 3249–3253. [Google Scholar] [CrossRef] [Green Version]
  7. Lolley, R.N.; Farber, D.B.; Rayborn, M.E.; Hollyfield, J.G. Cyclic GMP accumulation causes degeneration of photoreceptor cells: Simulation of an inherited disease. Science 1977, 196, 664–666. [Google Scholar] [CrossRef]
  8. Nishiwaki, Y.; Komori, A.; Sagara, H.; Suzuki, E.; Manabe, T.; Hosoya, T.; Nojima, Y.; Wada, H.; Tanaka, H.; Okamoto, H.; et al. Mutation of cGMP phosphodiesterase 6alpha’-subunit gene causes progressive degeneration of cone photoreceptors in zebrafish. Mech. Dev. 2008, 125, 932–946. [Google Scholar] [CrossRef]
  9. Hong, D.H.; Pawlyk, B.S.; Shang, J.; Sandberg, M.A.; Berson, E.L.; Li, T. A retinitis pigmentosa GTPase regulator (RPGR)-deficient mouse model for X-linked retinitis pigmentosa (RP3). Proc. Natl. Acad. Sci. USA 2000, 97, 3649–3654. [Google Scholar] [CrossRef]
  10. Naash, M.I.; Hollyfield, J.G.; al-Ubaidi, M.R.; Baehr, W. Simulation of human autosomal dominant retinitis pigmentosa in transgenic mice expressing a mutated murine opsin gene. Proc. Natl. Acad. Sci. USA 1993, 90, 5499–5503. [Google Scholar] [CrossRef] [Green Version]
  11. Chang, B.; Hawes, N.L.; Pardue, M.T.; German, A.M.; Hurd, R.E.; Davisson, M.T.; Nusinowitz, S.; Rengarajan, K.; Boyd, A.P.; Sidney, S.S.; et al. Two mouse retinal degenerations caused by missense mutations in the beta-subunit of rod cGMP phosphodiesterase gene. Vision Res. 2007, 47, 624–633. [Google Scholar] [CrossRef] [PubMed] [Green Version]
  12. Chang, B.; Hawes, N.L.; Hurd, R.E.; Davisson, M.T.; Nusinowitz, S.; Heckenlively, J.R. Retinal degeneration mutants in the mouse. Vision Res. 2002, 42, 517–525. [Google Scholar] [CrossRef] [PubMed] [Green Version]
  13. Roche, S.L.; Wyse-Jackson, A.C.; Byrne, A.M.; Ruiz-Lopez, A.M.; Cotter, T.G. Alterations to retinal architecture prior to photoreceptor loss in a mouse model of retinitis pigmentosa. Int. J. Dev. Biol. 2016, 60, 127–139. [Google Scholar] [CrossRef] [PubMed]
  14. Gargini, C.; Terzibasi, E.; Mazzoni, F.; Strettoi, E. Retinal organization in the retinal degeneration 10 (rd10) mutant mouse: A morphological and ERG study. J. Comp. Neurol. 2007, 500, 222–238. [Google Scholar] [CrossRef] [PubMed] [Green Version]
  15. Newton, F.; Megaw, R. Mechanisms of Photoreceptor Death in Retinitis Pigmentosa. Genes 2020, 11, 1120. [Google Scholar] [CrossRef] [PubMed]
  16. Wang, T.; Reingruber, J.; Woodruff, M.L.; Majumder, A.; Camarena, A.; Artemyev, N.O.; Fain, G.L.; Chen, J. The PDE6 mutation in the rd10 retinal degeneration mouse model causes protein mislocalization and instability and promotes cell death through increased ion influx. J. Biol. Chem. 2018, 293, 15332–15346. [Google Scholar] [CrossRef] [PubMed] [Green Version]
  17. Comitato, A.; Sanges, D.; Rossi, A.; Humphries, M.M.; Marigo, V. Activation of Bax in three models of retinitis pigmentosa. Investig. Ophthalmol. Vis. Sci. 2014, 55, 3555–3562. [Google Scholar] [CrossRef] [Green Version]
  18. Arango-Gonzalez, B.; Trifunovic, D.; Sahaboglu, A.; Kranz, K.; Michalakis, S.; Farinelli, P.; Koch, S.; Koch, F.; Cottet, S.; Janssen-Bienhold, U.; et al. Identification of a common non-apoptotic cell death mechanism in hereditary retinal degeneration. PLoS ONE 2014, 9, e112142. [Google Scholar] [CrossRef]
  19. Rodriguez-Muela, N.; Hernandez-Pinto, A.M.; Serrano-Puebla, A.; Garcia-Ledo, L.; Latorre, S.H.; de la Rosa, E.J.; Boya, P. Lysosomal membrane permeabilization and autophagy blockade contribute to photoreceptor cell death in a mouse model of retinitis pigmentosa. Cell Death Differ. 2015, 22, 476–487. [Google Scholar] [CrossRef] [Green Version]
  20. Li, Y.; Wang, C.; Liu, Y.; You, J.; Su, G. Autophagy, lysosome dysfunction and mTOR inhibition in MNU-induced photoreceptor cell damage. Tissue Cell 2019, 61, 98–108. [Google Scholar] [CrossRef]
  21. De la Rosa, E.J.; Cotter, T.G. The Cellular Course of Retinal Degenerative Conditions : Therapies for Retinal Degeneration: Targeting Common Processes. R. Soc. Chem. 2018, 66, 1–30. [Google Scholar]
  22. Narayan, D.S.; Wood, J.P.; Chidlow, G.; Casson, R.J. A review of the mechanisms of cone degeneration in retinitis pigmentosa. Acta Ophthalmol. 2016, 94, 748–754. [Google Scholar] [CrossRef]
  23. Wang, A.L.; Knight, D.K.; Vu, T.T.; Mehta, M.C. Retinitis Pigmentosa: Review of Current Treatment. Int. Ophthalmol. Clin. 2019, 59, 263–280. [Google Scholar] [CrossRef] [PubMed]
  24. Duncan, J.L.; Pierce, E.A.; Laster, A.M.; Daiger, S.P.; Birch, D.G.; Ash, J.D.; Iannaccone, A.; Flannery, J.G.; Sahel, J.A.; Zack, D.J.; et al. Inherited Retinal Degenerations: Current Landscape and Knowledge Gaps. Transl. Vis. Sci. Technol. 2018, 7, 6. [Google Scholar] [CrossRef] [PubMed] [Green Version]
  25. Hetz, C.; Saxena, S. ER stress and the unfolded protein response in neurodegeneration. Nat. Rev. Neurol. 2017, 13, 477–491. [Google Scholar] [CrossRef] [PubMed]
  26. Mattson, M.P.; LaFerla, F.M.; Chan, S.L.; Leissring, M.A.; Shepel, P.N.; Geiger, J.D. Calcium signaling in the ER: Its role in neuronal plasticity and neurodegenerative disorders. Trends. Neurosci. 2000, 23, 222–229. [Google Scholar] [CrossRef] [PubMed]
  27. Pchitskaya, E.; Popugaeva, E.; Bezprozvanny, I. Calcium signaling and molecular mechanisms underlying neurodegenerative diseases. Cell Calcium. 2018, 70, 87–94. [Google Scholar] [CrossRef]
  28. Jesse, C.M.; Bushuven, E.; Tripathi, P.; Chandrasekar, A.; Simon, C.M.; Drepper, C.; Yamoah, A.; Dreser, A.; Katona, I.; Johann, S.; et al. ALS-Associated Endoplasmic Reticulum Proteins in Denervated Skeletal Muscle: Implications for Motor Neuron Disease Pathology. Brain. Pathl. 2017, 27, 781–794. [Google Scholar] [CrossRef]
  29. Prause, J.; Goswami, A.; Katona, I.; Roos, A.; Schnizler, M.; Bushuven, E.; Dreier, A.; Buchkremer, S.; Johann, S.; Beyer, C.; et al. Altered localization, abnormal modification and loss of function of Sigma receptor-1 in amyotrophic lateral sclerosis. Hum. Mol. Genet. 2013, 22, 1581–1600. [Google Scholar] [CrossRef]
  30. Yamoah, A.; Tripathi, P.; Sechi, A.; Kohler, C.; Guo, H.; Chandrasekar, A.; Nolte, K.W.; Wruck, C.J.; Katona, I.; Anink, J.; et al. Aggregates of RNA Binding Proteins and ER Chaperones Linked to Exosomes in Granulovacuolar Degeneration of the Alzheimer’s Disease Brain. J. Alzheimers Dis. 2020, 75, 139–156. [Google Scholar] [CrossRef] [Green Version]
  31. Biswas, S.; Haselier, C.; Mataruga, A.; Thumann, G.; Walter, P.; Muller, F. Pharmacological analysis of intrinsic neuronal oscillations in rd10 retina. PLoS ONE 2014, 9, e99075. [Google Scholar] [CrossRef] [PubMed] [Green Version]
  32. Tripathi, P.; Guo, H.; Dreser, A.; Yamoah, A.; Sechi, A.; Jesse, C.M.; Katona, I.; Doukas, P.; Nikolin, S.; Ernst, S.; et al. Pathomechanisms of ALS8: Altered autophagy and defective RNA binding protein (RBP) homeostasis due to the VAPB P56S mutation. Cell Death. Dis. 2021, 12, 466. [Google Scholar] [CrossRef] [PubMed]
  33. Dreser, A.; Vollrath, J.T.; Sechi, A.; Johann, S.; Roos, A.; Yamoah, A.; Katona, I.; Bohlega, S.; Wiemuth, D.; Tian, Y.; et al. The ALS-linked E102Q mutation in Sigma receptor-1 leads to ER stress-mediated defects in protein homeostasis and dysregulation of RNA-binding proteins. Cell Death Differ. 2017, 24, 1655–1671. [Google Scholar] [CrossRef] [PubMed]
  34. Phillips, M.J.; Otteson, D.C.; Sherry, D.M. Progression of neuronal and synaptic remodeling in the rd10 mouse model of retinitis pigmentosa. J. Comp. Neurol. 2010, 518, 2071–2089. [Google Scholar] [CrossRef] [PubMed] [Green Version]
  35. Puthussery, T.; Taylor, W.R. Functional changes in inner retinal neurons in animal models of photoreceptor degeneration. Adv Exp. Med. Biol. 2010, 664, 525–532. [Google Scholar] [CrossRef]
  36. Engedal, N.; Torgersen, M.L.; Guldvik, I.J.; Barfeld, S.J.; Bakula, D.; Saetre, F.; Hagen, L.K.; Patterson, J.B.; Proikas-Cezanne, T.; Seglen, P.O.; et al. Modulation of intracellular calcium homeostasis blocks autophagosome formation. Autophagy 2013, 9, 1475–1490. [Google Scholar] [CrossRef] [PubMed] [Green Version]
  37. Grotemeier, A.; Alers, S.; Pfisterer, S.G.; Paasch, F.; Daubrawa, M.; Dieterle, A.; Viollet, B.; Wesselborg, S.; Proikas-Cezanne, T.; Stork, B. AMPK-independent induction of autophagy by cytosolic Ca2+ increase. Cell Signal. 2010, 22, 914–925. [Google Scholar] [CrossRef]
  38. Rubinsztein, D.C.; Cuervo, A.M.; Ravikumar, B.; Sarkar, S.; Korolchuk, V.; Kaushik, S.; Klionsky, D.J. In search of an “autophagomometer”. Autophagy 2009, 5, 585–589. [Google Scholar] [CrossRef]
  39. He, C.; Klionsky, D.J. Regulation mechanisms and signaling pathways of autophagy. Annu. Rev. Genet. 2009, 43, 67–93. [Google Scholar] [CrossRef] [Green Version]
  40. Klionsky, D.J.; Cuervo, A.M.; Seglen, P.O. Methods for monitoring autophagy from yeast to human. Autophagy 2007, 3, 181–206. [Google Scholar] [CrossRef] [Green Version]
  41. Aggad, D.; Veriepe, J.; Tauffenberger, A.; Parker, J.A. TDP-43 toxicity proceeds via calcium dysregulation and necrosis in aging Caenorhabditis elegans motor neurons. J. Neurosci. 2014, 34, 12093–12103. [Google Scholar] [CrossRef] [PubMed] [Green Version]
  42. Jucker, M.; Walker, L.C. Self-propagation of pathogenic protein aggregates in neurodegenerative diseases. Nature 2013, 501, 45–51. [Google Scholar] [CrossRef] [PubMed] [Green Version]
  43. Wang, X.; Fan, H.; Ying, Z.; Li, B.; Wang, H.; Wang, G. Degradation of TDP-43 and its pathogenic form by autophagy and the ubiquitin-proteasome system. Neurosci. Lett. 2010, 469, 112–116. [Google Scholar] [CrossRef] [PubMed]
  44. Ryu, H.H.; Jun, M.H.; Min, K.J.; Jang, D.J.; Lee, Y.S.; Kim, H.K.; Lee, J.A. Autophagy regulates amyotrophic lateral sclerosis-linked fused in sarcoma-positive stress granules in neurons. Neurobiol. Aging 2014, 35, 2822–2831. [Google Scholar] [CrossRef]
  45. Ling, S.C.; Polymenidou, M.; Cleveland, D.W. Converging mechanisms in ALS and FTD: Disrupted RNA and protein homeostasis. Neuron 2013, 79, 416–438. [Google Scholar] [CrossRef] [Green Version]
  46. Conlon, E.G.; Manley, J.L. RNA-binding proteins in neurodegeneration: Mechanisms in aggregate. Genes Dev. 2017, 31, 1509–1528. [Google Scholar] [CrossRef]
  47. Ito, D.; Hatano, M.; Suzuki, N. RNA binding proteins and the pathological cascade in ALS/FTD neurodegeneration. Sci. Transl. Med. 2017, 9, 5436. [Google Scholar] [CrossRef] [Green Version]
  48. Salton, M.; Elkon, R.; Borodina, T.; Davydov, A.; Yaspo, M.L.; Halperin, E.; Shiloh, Y. Matrin 3 binds and stabilizes mRNA. PLoS ONE 2011, 6, e23882. [Google Scholar] [CrossRef] [Green Version]
  49. Neumann, M.; Bentmann, E.; Dormann, D.; Jawaid, A.; DeJesus-Hernandez, M.; Ansorge, O.; Roeber, S.; Kretzschmar, H.A.; Munoz, D.G.; Kusaka, H.; et al. FET proteins TAF15 and EWS are selective markers that distinguish FTLD with FUS pathology from amyotrophic lateral sclerosis with FUS mutations. Brain 2011, 134, 2595–2609. [Google Scholar] [CrossRef] [Green Version]
  50. Ramaswami, M.; Taylor, J.P.; Parker, R. Altered ribostasis: RNA-protein granules in degenerative disorders. Cell 2013, 154, 727–736. [Google Scholar] [CrossRef] [Green Version]
  51. Gerstberger, S.; Hafner, M.; Tuschl, T. A census of human RNA-binding proteins. Nat. Rev. Genet. 2014, 15, 829–845. [Google Scholar] [CrossRef] [PubMed]
  52. Mackenzie, I.R.; Neumann, M. FET proteins in frontotemporal dementia and amyotrophic lateral sclerosis. Brain Res. 2012, 1462, 40–43. [Google Scholar] [CrossRef] [PubMed] [Green Version]
  53. Buchan, J.R. mRNP granules. Assembly, function, and connections with disease. RNA Biol. 2014, 11, 1019–1030. [Google Scholar] [CrossRef] [PubMed] [Green Version]
  54. Alberti, S.; Mateju, D.; Mediani, L.; Carra, S. Granulostasis: Protein Quality Control of RNP Granules. Front. Mol. Neurosci. 2017, 10, 84. [Google Scholar] [CrossRef] [Green Version]
  55. Wolozin, B. Regulated protein aggregation: Stress granules and neurodegeneration. Mol. Neurodegener. 2012, 7, 56. [Google Scholar] [CrossRef] [Green Version]
  56. Stasheff, S.F. Emergence of sustained spontaneous hyperactivity and temporary preservation of OFF responses in ganglion cells of the retinal degeneration (rd1) mouse. J. Neurophysiol. 2008, 99, 1408–1421. [Google Scholar] [CrossRef]
  57. Wang, J.; Zhao, J.; Cui, X.; Mysona, B.A.; Navneet, S.; Saul, A.; Ahuja, M.; Lambert, N.; Gazaryan, I.G.; Thomas, B.; et al. The molecular chaperone sigma 1 receptor mediates rescue of retinal cone photoreceptor cells via modulation of NRF2. Free Radic. Biol. Med. 2019, 134, 604–616. [Google Scholar] [CrossRef]
  58. Wang, J.; Saul, A.; Roon, P.; Smith, S.B. Activation of the molecular chaperone, sigma 1 receptor, preserves cone function in a murine model of inherited retinal degeneration. Proc. Natl. Acad. Sci. USA 2016, 113, E3764–E3772. [Google Scholar] [CrossRef] [Green Version]
  59. Wang, J.; Saul, A.; Cui, X.; Roon, P.; Smith, S.B. Absence of Sigma 1 Receptor Accelerates Photoreceptor Cell Death in a Murine Model of Retinitis Pigmentosa. InvestIG. Ophthalmol. Vis. Sci. 2017, 58, 4545–4558. [Google Scholar] [CrossRef] [Green Version]
  60. Yang, H.; Fu, Y.; Liu, X.; Shahi, P.K.; Mavlyutov, T.A.; Li, J.; Yao, A.; Guo, S.Z.; Pattnaik, B.R.; Guo, L.W. Role of the sigma-1 receptor chaperone in rod and cone photoreceptor degenerations in a mouse model of retinitis pigmentosa. Mol. Neurodegener. 2017, 12, 68. [Google Scholar] [CrossRef]
  61. Ilieva, E.V.; Ayala, V.; Jove, M.; Dalfo, E.; Cacabelos, D.; Povedano, M.; Bellmunt, M.J.; Ferrer, I.; Pamplona, R.; Portero-Otin, M. Oxidative and endoplasmic reticulum stress interplay in sporadic amyotrophic lateral sclerosis. Brain 2007, 130, 3111–3123. [Google Scholar] [CrossRef] [PubMed]
  62. Julien, J.P. Amyotrophic lateral sclerosis. unfolding the toxicity of the misfolded. Cell 2001, 104, 581–591. [Google Scholar] [CrossRef] [Green Version]
  63. Lohr, H.R.; Kuntchithapautham, K.; Sharma, A.K.; Rohrer, B. Multiple, parallel cellular suicide mechanisms participate in photoreceptor cell death. Exp. Eye Re.s 2006, 83, 380–389. [Google Scholar] [CrossRef] [PubMed]
  64. Sun, Z.; Diaz, Z.; Fang, X.; Hart, M.P.; Chesi, A.; Shorter, J.; Gitler, A.D. Molecular determinants and genetic modifiers of aggregation and toxicity for the ALS disease protein FUS/TLS. PLoS Biol. 2011, 9, e1000614. [Google Scholar] [CrossRef]
  65. Mammadova, N.; Baron, T.; Verchere, J.; Greenlee, J.J.; Greenlee, M.H.W. Retina as a Model to Study In Vivo Transmission of alpha-Synuclein in the A53T Mouse Model of Parkinson’s Disease. Methods Mol. Biol. 2021, 2224, 75–85. [Google Scholar] [CrossRef] [PubMed]
  66. Pfeiffer, R.L.; Marc, R.E.; Jones, B.W. Persistent remodeling and neurodegeneration in late-stage retinal degeneration. Prog. Retin. Eye Res. 2020, 74, 100771. [Google Scholar] [CrossRef]
  67. Goswami, A.; Jesse, C.M.; Chandrasekar, A.; Bushuven, E.; Vollrath, J.T.; Dreser, A.; Katona, I.; Beyer, C.; Johann, S.; Feller, A.C.; et al. Accumulation of STIM1 is asso-ciated with the degenerative muscle fibre phenotype in ALS and other neurogenic atrophies. Neuropathol. Appl. Neurobiol. 2015, 41, 304–318. [Google Scholar] [CrossRef]
  68. Vollrath, J.T.; Sechi, A.; Dreser, A.; Katona, I.; Wiemuth, D.; Vervoorts, J.; Dohmen, M.; Chandrasekar, A.; Prause, J.; Brauers, E.; et al. Loss of function of the ALS protein SigR1 leads to ER pathology associated with defective autophagy and lipid raft disturbances. Cell Death. Dis. 2014, 12, 243. [Google Scholar] [CrossRef] [Green Version]
  69. Filezac de L’Etang, A.; Maharjan, N.; Cordeiro Brana, M.; Ruegsegger, C.; Rehmann, R.; Goswami, A.; Roos, A.; Troost, D.; Schneider, B.L.; Weis, J.; et al. Marinesco-Sjogren syndrome protein SIL1 regulates motor neuron subtype-selective ER stress in ALS. Nat. Neurosci. 2015, 18, 227–238. [Google Scholar] [CrossRef]
Figure 1. Early alterations of Calcium-Binding/ ER Chaperones in the rd10 Retina (a) Hematoxylin–eosin (H&E)-stained retinal paraffin sections showing age-dependent progressive neurodegeneration in rd10 mice at P17, P19, P2,6 and P50 compared with age-matched wild-type mice. The retinal cell layers: the outer nuclear layer (ONL), inner nuclear layer (INL), inner plexiform layer (IPL), and ganglion cell layer (GCL). Note the lack of noticeable degeneration in the cells of ONL, INL and GCL in rd10-P17 compared with the WT-P17 (white scale bar—70 µm). In the WT retina (WT-P17, WT-P19, WT-P26, and WT-P50), there were no differences in the staining pattern of any markers used in this study. Thus, throughout the remainder of the manuscript, only one representative WT-control retina is shown for comparison. Scale bars = 50 µm. (b,c) Double immunofluorescence using the rod bipolar cell marker, protein kinase c alpha (PKC α) with calreticulin ((b), quantification (c)), and with pPERK (d). Note the increased immunoreactivity for calreticulin and the mild-to-moderate increase in pPERK immunoreactivity observed in many retinal cell layers in rd10 mice, especially at rd10-P17, but also at rd10-P26 compared with WT-P26 and WT-P50. (eh) Increased levels of the ER chaperones sigma receptor 1 (SigR1) (e) and GRP78/Bip (f), and activation of the ER stress marker GADD-153 (h) in the rd10-P17 mouse retina. (b,dh) Images from a single representative section from n = 3 WT-P26, n = 3 WT-P50, n = 3 rd10-P17, n = 3 rd10-P26, and n = 3 rd10-P50. Scale bars (dh) = 45 µm. (c,g) Quantifications for (b,e,f). (i) Immunoblot analysis of retinal tissue homogenates from rd10 and WT mice of the calcium-binding/buffering chaperones pPERK, PDI, and calreticulin and of the ER chaperones SigR1 and GRP78/Bip in early (P17) and peak (P26) stages of rd10 retina degeneration compared with WT-P26. (j) Quantitative densitometry analysis of relative band intensities (WT-P26 n = 3, rd10-P17 n = 4, rd10-P26 n = 3). The asterisks (*) denote significant differences (* p < 0.05, ** p < 0.01).
Cells 12 01094 g001
Figure 2. Early Autophagy Alterations in the rd10 Retina (a) Immunofluorescence labelling of the autophagy adaptor protein p62. Markedly increased p62 levels in the INL, the inner plexiform layer (IPL), and the GCL (white arrow) at rd10-P17, and a moderate increase at rd10-P26 compared with WT-P26. Note the p62-positive globular cytoplasmic accumulations in the INL in the rd10-P26 retina (white arrowheads). (b) Increased LC3 immunoreactivity in PKCα-positive rod bipolar cells at rd10-P17 and P26 and in the ONL of rd10-P26 mice. Images from a single representative section taken from n = 3 WT-P50, n = 3 rd10-P17, n = 3 rd10-P26, and n = 3 rd10-P50. (c) Quantification for (b). Scale bars (a,b) = 40 µm. (d) Immunoblot analysis of retinal tissue homogenates showing slightly increased overall levels of p62 and markedly increased levels of both LC3I and LC3II in rd10-P17 and rd10-P26 retinas compared with WT-P26 (WT-P26 n = 3, rd10-P17 n = 4, rd10-P26 n = 3). (e) Quantification of p62 (below) and LC3 immunoblots (middle and right). Note the decrease in the ratio between the lipidated form of LC3II/LC3I (right). (f,g) Electron micrographs showing neurodegeneration and cytoplasmic accumulations of vacuolar material (arrows) at rd10-P19 (f) and at rd10-P22 (g). Note the large, abnormal autophagic vacuoles filled with membranous and granular osmiophilic material (arrows) in the somata of the ONL and inner segments (IS) of photoreceptor cells. Scale bars= left panel: 10 µm, detailed view in the right panel: 2 µm. The asterisks (*) denote significant differences (* p < 0.05, ** p < 0.01). The (#) denotes not significant.
Cells 12 01094 g002
Figure 3. Early cytoplasmic aggregation of pTDP-43 and Matrin 3 in rd10 retina (a) Small globular pTDP-43-immunoreactive cytoplasmic aggregates in ONL, INL, and GCL cells of rd10-P17 and rd10-P26 mice (arrows). Such pTDP-43-immunoreactive aggregates were absent in WT-P26 mouse retinas. (b) Immunofluorescence staining showing massive aggregation (arrows) of pTDP-43 in the cells of the ONL of rd10-P17 (right panel: detailed view), while such pTDP-43 aggregates are absent in WT-P26 control (right upper, enlarged). (c) CabP-positive horizontal cells (green) harbor pTDP43-immunoreactive cytoplasmic aggregates (white arrows) in rd10-P17 (inset enlarged) and rd10-P50 mice. Scale bars = 40 µm (d) Mild-to-moderate nuclear accumulation of Matrin 3 in cells of the ONL, INL, and GCL of rd10-P17 and P26 mice (arrows in ONL) as shown by DAB immunohistochemistry. Scale bars = 50 µm (e) General overview of altered Matrin 3 immunofluorescence in the rd10-P17 retina (left panel). Note the loss of nuclear localization in some cells (red arrows, lower right) and strong nuclear granular accumulation (white arrows) in other cells of the INL of rd10-P17 retinae. Scale bars = 40 µm (f) Photoreceptors in the ONL show an overall increase in the nuclear accumulation of Matrin 3 (arrows) in rd10-P17 compared with WT-P17 mice. (af) Representative sections from n = 3 WT-P26, n = 3 WT-P50, n = 3 rd10-P17, n = 3 rd10-P26, and n = 3 rd10-P50 are depicted. Detailed view panel (e,f) = 15 µm. (g,h) Subcellular fraction analysis of retinal lysates, pool of n = 3 WT-P17, n = 3 rd10-P17 (g), and n = 3 WT-P26, n = 3 rd10-P17, and n = 3 rd10-P26 (h). Note the cytoplasmic mislocalization of TDP-43 and Matrin 3 in rd10-P17 (g) and in both rd10-P17 and rd10-P26 (h) (red arrowheads). Cytoplasmic extract (Ce), membrane extract (Me), soluble nuclear extract (Ne), and chromatin-bound nuclear extract (Cbe) fractions by immunoblotting.
Cells 12 01094 g003
Figure 4. Early aggregation of FET Family Proteins in rd10 retina (ad) DAB immunolabelling using antibodies against the FET family proteins FUS (a), hnRNPA1 (b), hnRNPA2B1 (c), and EWSR1 (d) revealed globular cytoplasmic accumulation (white arrows in (ad)) in photoreceptors of the ONL and many cells of the INL. Focal intranuclear accumulations (black arrows), as well as condensed/pyknotic nuclei, were also evident. A single representative section from every genotype (n = 3 WT-P26, n = 3 WT-P50, n = 3 rd10-P17, n = 3 rd10-P26, and n = 3 rd10-P50) is depicted. (e) Immunofluorescence revealed large globular FUS-immunoreactive aggregates in the photoreceptors of rd10-P17 mice (white arrows) and focal intranuclear accumulation (orange arrows), as well as cytoplasmic inclusions of FUS (white arrows, lower panels) in rod bipolar cells of the INL at rd10-P17 and P19. Note the large FUS-immunoreactive aggregates in GCL cells at later stages (rd10-P26) (white arrow, lower panel) together with the focal intranuclear accumulation in INL cells (orange arrows). Scale bars = (ad) 60 µm, (e) 15 µm (f) Filter trap assay showing SDS-resistant FUS aggregates in rd10-P26. (g) Subcellular fraction analysis of retinal lysates, showing the cytoplasmic mislocalization of FUS, hnRNPA1, and TAF15 in rd10-P17 and rd10-P26 (red arrowheads): a pool of n = 3 WT-P26, n = 3 rd10-P1,7 and n = 3 rd10-P26. Cytoplasmic extract (Ce), membrane extract (Me), soluble nuclear extract (Ne), and chromatin-bound nuclear extract (Cbe) fractions by immunoblotting.
Cells 12 01094 g004
Figure 5. Formation of RNA stress granules in rd10 retina. (a) DAB immunohistochemistry showing a large globular accumulation (black arrow) and small granular aggregation of Tia1 (white arrows) in the ONL and INL cells of P17 and P26 rd10 mice. Single representative sections are depicted from each genotype; n = 3 WT-P26, n = 3 rd10-P17, n = 3 rd10-P26, rd10-P50. Scale bars = 30 µm. (b) Co-immunolabelling showing the colocalization of FUS and pTDP-43 with SG marker Tia1. Scale bars = 20 µm, scale bars = 5 µm enlarged figure. (c) Subcellular fraction analysis of retinal lysates showing the cytoplasmic mislocalization of the stress granule protein/marker Tia1 in a pool of n = 3 WT-P26, n = 3 rd10-P17, and n = 3 rd10-P26. Cytoplasmic extract (Ce), membrane extract (Me), soluble nuclear extract (Ne), and chromatin-bound nuclear extract (Cbe) fractions by immunoblotting.
Cells 12 01094 g005
Figure 6. Schematic representation of the proposed molecular mechanism associated with the retinal degeneration in a rd10 mouse model of retinitis pigmentosa (modified from [11,12,13,14,15,16], image created in BioRender (by BioRender.com).
Cells 12 01094 g006
Disclaimer/Publisher’s Note: The statements, opinions and data contained in all publications are solely those of the individual author(s) and contributor(s) and not of MDPI and/or the editor(s). MDPI and/or the editor(s) disclaim responsibility for any injury to people or property resulting from any ideas, methods, instructions or products referred to in the content.

