
High Mobility Group Box 1 (HMGB1): Potential Target in Sepsis-Associated Encephalopathy
 , and
, and
Abstract
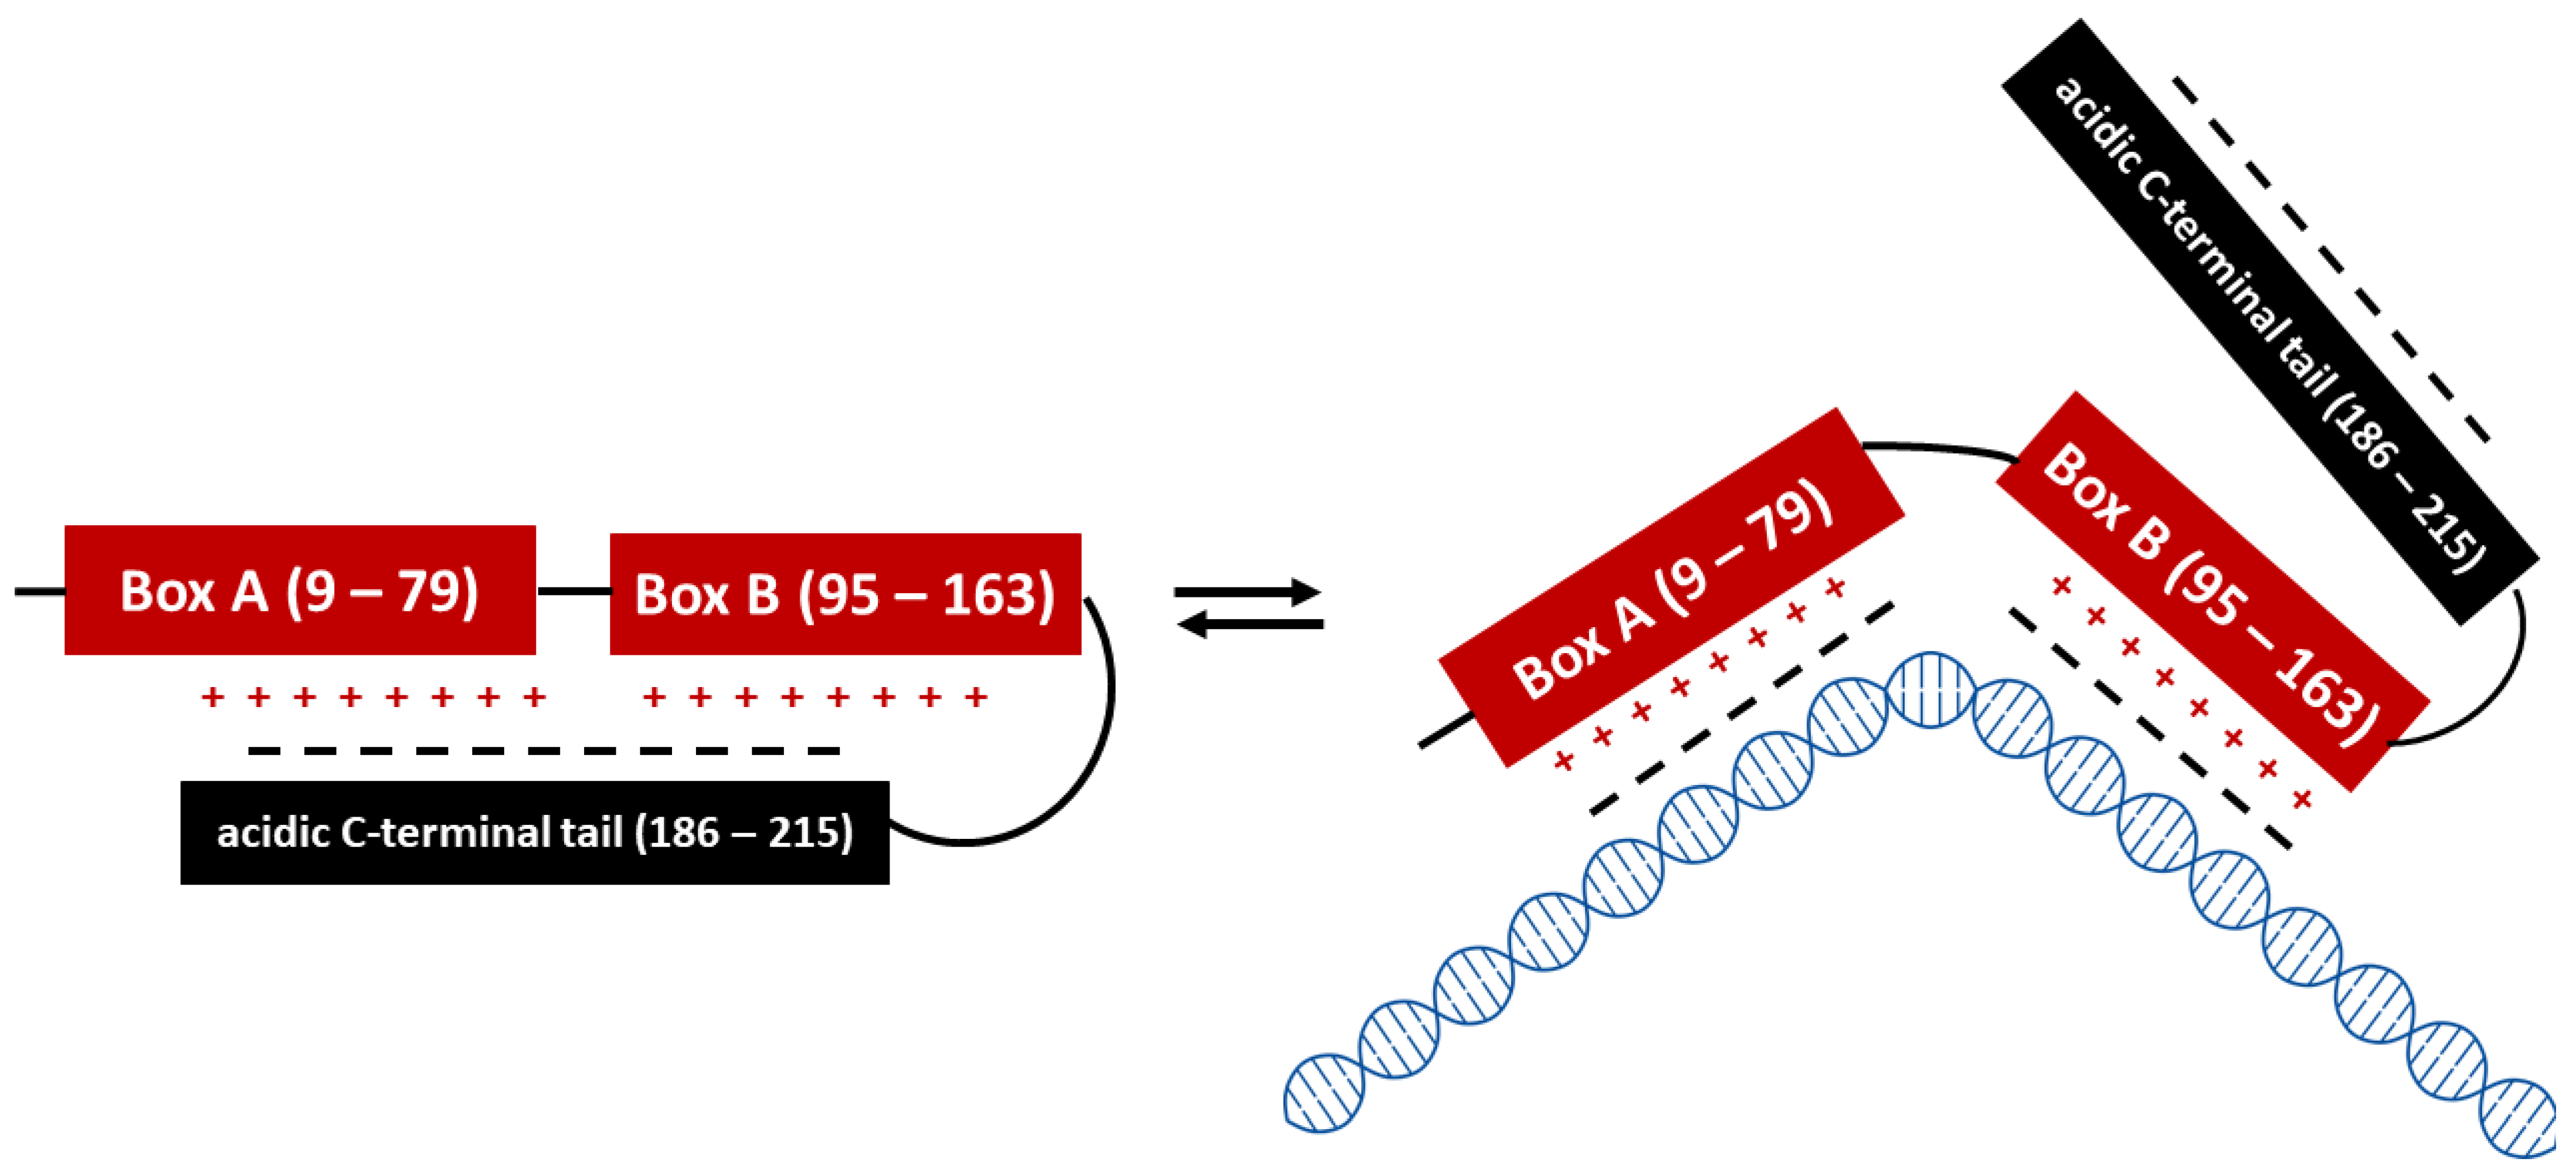
:1. High Mobility Group Box 1 (HMGB1)
2. Sepsis-Associated Encephalopathy
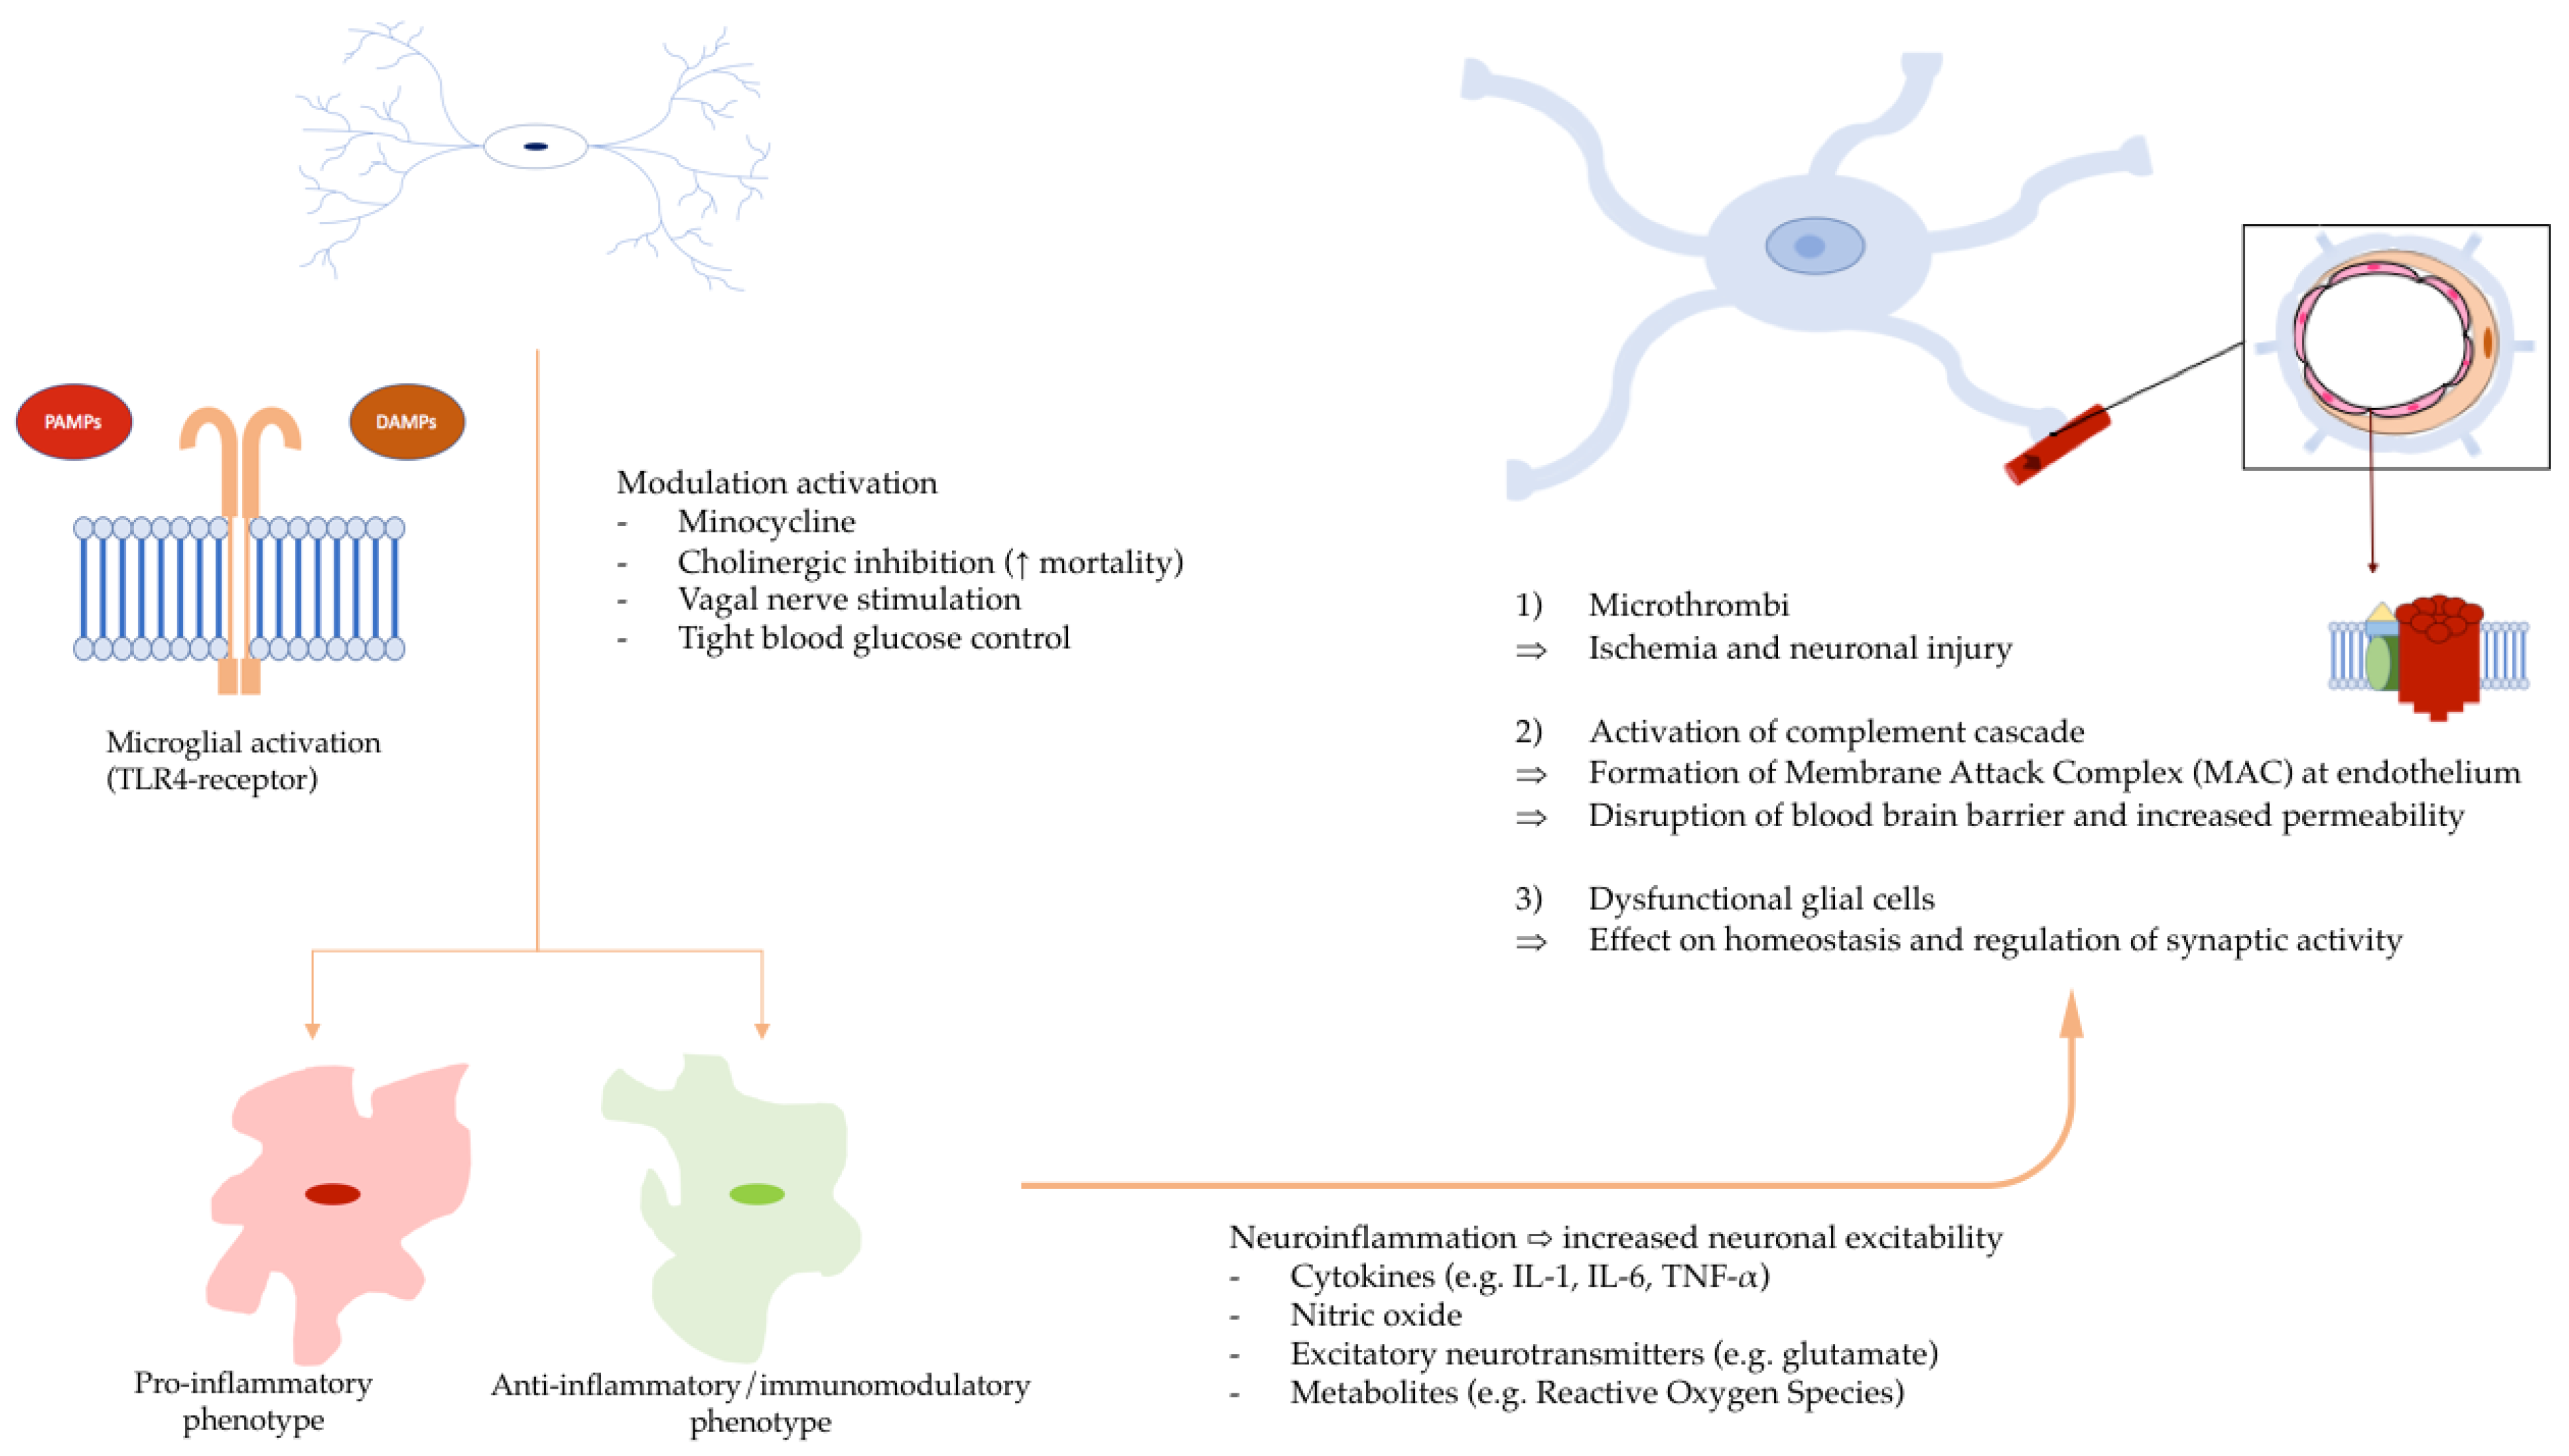
3. Pathogenesis of SAE
4. Role of HMGB1 in SAE Development
5. Neutralizing HMGB1
6. Possible Role of HMGB1 in the Risk Factors for SAE Development
6.1. Genetic and Racial Factors

| Non-Modifiable Risk Factors | ||
|---|---|---|
| Age | ||
| Research article | Incidence of SAE/Distribution of SAE and non-SAE | Mortality of SAE patients |
| Zhang L et al. (2012) [96] Retrospective analysis | No statistically significant association Mean age 54y ± 18 SAE vs. 51y ± 14 non-SAE (p-value = 0.30) | n/a |
| Sonneville R et al. (2017) [37] Retrospective analysis | OR 1.02 (95% CI: 1.01–1.02; p-value < 0.01) Per 1-year increment | HR 1.03 (95% CI: 1.02–1.03; p-value < 0.01) Per 1-year increment |
| Feng Q et al. (2019) [97] Retrospective analysis | Mean age 55y ± 14 SAE vs. 57y ± 15 non-SAE (p-value = 0.334) | n/a |
| Chen J et al. (2020) [92] Retrospective analysis | n/a | OR 1.059 (95% CI: 1.027–1.093; p-value < 0.001) Per 1-year increment (28-day mortality) |
| Jin G et al. (2022) [89] Retrospective analysis | OR 1.054 (95% CI: 1.019–1.089; p-value = 0.002) Median age 77y (IQR 69–83.75) SAE vs. 73.5y (IQR 65–81) non-SAE (p-value = 0.012) | n/a |
| Lei W et al. (2022) [91] Prospective longitudinal study | SAE mean age 70.59 ± 8.56 vs. non-SAE mean age 56.36 ± 16.81 (p-value = 0.022) | n/a |
| Lu X et al. (2022) [90] Retrospective analysis | Increasing age as independent risk factor (cutoff 72y according to Shapley additive explanation/SHAP model) Mean age 68.1y ± 16.44 SAE vs. 66.33y ± 16.26 non-SAE (p-value < 0.001) | n/a |
| Genetic and racial factors | ||
| Research article | Genetical factor | Incidence of SAE |
| Samuels DC et al. (2019) [95] Retrospective analysis | mtDNA haplogroup | Age-adjusted RR 1.36 (95% CI: 1.13–1.64; p-value = 0.001) Haplogroup clade IWX (7% caucasians) vs. Haplogroup H (most common in Caucasians) Age-adjusted RR 0.60 (95% CI: 0.38–0.94; p-value = 0.03) Haplogroup L2 (24% African Americans) vs. Haplogroup L3 (most common in African Americans) |
| Research article | Racial factor | Distribution of SAE and non-SAE |
| Lu X et al. (2022) [90] Retrospective analysis (SAE n = 4684, non-SAE n = 4251) | Ethnicity | In Asian cohort: incidence of SAE 2.4% vs. non-SAE 2.1% (p-value = 0.007; overall ethnic subgroups) |
6.2. Cardiovascular Diseases
6.3. Respiratory Diseases
| Pre-Existing Conditions | ||
|---|---|---|
| Cardiovascular Disease | ||
| Research article | Pre-existing condition | Distribution of SAE and non-SAE |
| Zhang L et al. (2012) [96] Retrospective analysis (SAE n = 41, non-SAE n = 191) | Coronary heart disease | 9.8% SAE vs. 9.4% non-SAE (p-value = 0.573) |
| Arterial hypertension | 19.5% SAE vs. 19.4% non-SAE (p-value = 0.567) | |
| Sonneville R et al. (2017) [37] Retrospective analysis (SAE n = 1341, non-SAE n = 1172) | Arterial hypertension | 38.2% SAE vs. 35.4% non-SAE (p-value = 0.15) |
| Chen J et al. (2020) [92] Retrospective analysis (SAE n = 127, non-SAE n = 164) | Arterial hypertension | 32.3% SAE vs. 20.7% non-SAE (p-value = 0.025) |
| Jin G et al. (2022) [89] Retrospective analysis (SAE n = 132, non-SAE n = 90) | Coronary heart disease | 33.3% SAE vs. 18.9% non-SAE (p-value = 0.018) |
| Arterial hypertension | 57.6% SAE vs. 57.8% non-SAE (p-value = 0.976) | |
| Lei W et al. (2022) [91] Prospective longitudinal study (SAE n = 17, non-SAE n = 11) | Coronary heart disease | 29.4% SAE vs. 27.3% non-SAE (p-value = 0.624) |
| Arterial hypertension | 35.3% SAE vs. 54.5% non-SAE (p-value = 0.441) | |
| Respiratory disease | ||
| Research article | Pre-existing condition | Mortality of SAE |
| Jin G et al. (2022) [89] Retrospective analysis (SAE n = 132, non-SAE n = 90) | COPD | 20% survival vs. 13.9% non-survival (p-value = 0.008) |
| Research article | Pre-existing condition | Distribution of SAE and non-SAE |
| Zhang L et al. (2012) [96] Retrospective analysis (SAE n = 41, non-SAE n = 191) | Obstructive lung disease | 7.3% SAE vs. 5.8% non-SAE (p-value = 0.718) |
| Sonneville R et al. (2017) [37] Retrospective analysis (SAE n = 1341, non-SAE n = 1172) | COPD | 10.9% SAE vs. 8.8% non-SAE (p-value = 0.08) |
| Chen J et al. (2020) [92] Retrospective analysis (SAE n = 127, non-SAE n = 164) | COPD | 7.9% SAE vs. 11.0% non-SAE (p-value = 0.374) |
| Jin G et al. (2022) [89] Retrospective analysis (SAE n = 132, non-SAE n = 90) | COPD | 16.7% SAE vs. 27.8% non-SAE (p-value = 0.047) |
| Lei W et al. (2022) [91] Prospective longitudinal study (SAE n = 17, non-SAE n = 11) | COPD | 11.8% SAE vs. 9.1% non-SAE (p-value = 0.664) |
| Chronic liver disease | ||
| Research article | Mortality from SAE | |
| Sonneville R et al. (2017) [37] Retrospective analysis (SAE n = 1341, non-SAE n = 1172) | HR 1.92 (95% CI: 1.54–2.39; p-value < 0.01) 9.5% SAE vs. 4.7% non-SAE (p-value < 0.01) | |
| Research article | Distribution of SAE and non-SAE | |
| Chen J et al. (2020) [92] Retrospective analysis (SAE n = 127, non-SAE n = 164) | 3.1% SAE vs. 4.9% non-SAE (p-value = 0.462) | |
| Jin G et al. (2022) [89] Retrospective analysis (SAE n = 132, non-SAE n = 90) | 4.5% SAE vs. 6.7% non-SAE (p-value = 0.553) | |
| Lei W et al. (2022) [91] Prospective longitudinal study (SAE n = 17, non-SAE n = 11) | 29.4% SAE vs. 27.3% non-SAE (p-value = 0.624) | |
| Chronic alcohol abuse | ||
| Research article | Incidence of SAE/Distribution of SAE and non-SAE | |
| Sonneville R et al. (2017) [37] Retrospective analysis (SAE n = 1341, non-SAE n = 1172) | OR 3.38 (95% CI: 2.34–4.89; p-value < 0.01) 11% SAE vs. 3.6% non-SAE (p-value < 0.01) | |
| Diabetes mellitus | ||
| Research article | Distribution of SAE and non-SAE | |
| Zhang L et al. (2012) [96] Retrospective analysis (SAE n = 41, non-SAE n = 191) | 7.3% SAE vs. 11% non-SAE (p-value = 0.471) | |
| Sonneville R et al. (2017) [37] Retrospective analysis (SAE n = 1341, non-SAE n = 1172) | 19.7% SAE vs. 14.9% non-SAE (p-value < 0.01) | |
| Chen J et al. (2020) [92] Retrospective analysis (SAE n = 127, non-SAE n = 164) | 18.1% SAE vs. 10.4% non-SAE (p-value = 0.057) | |
| Jin G et al. (2022) [89] Retrospective analysis (SAE n = 132, non-SAE n = 90) | 28.8% SAE vs. 24.4% non-SAE (p-value = 0.474) | |
| Lei W et al. (2022) [91] Prospective longitudinal study (SAE n = 17, non-SAE n = 11) | 35.3% SAE vs. 45.5% non-SAE (p-value = 0.701) | |
| Lu X et al. (2022) [90] Retrospective analysis (SAE n = 4684, non-SAE n = 4251) | 26.3% SAE vs. 30.7% non-SAE (p-value = 0.001) | |
| Neurological and psychiatric conditions | ||
| Research article | Pre-existing condition | Incidence of SAE |
| Sonneville R et al. (2017) [37] Retrospective analysis (SAE n=1341, non-SAE n = 1172) | Neurological disease | OR 1.56 (95% CI: 1.18–2.06; p-value < 0.01) 13.6% SAE vs. 8.2% non-SAE (p-value < 0.01) |
| Cognitive impairment | OR 2.25 (95% CI: 1.09–4.67; p-value = 0.03) 2.9% SAE vs. 0.9% non-SAE (p-value < 0.01) | |
| Chronic psychoactive drugs | OR 1.37 (95% CI: 1.11–1.70; p-value < 0.01) 22.1% SAE vs. 16% non-SAE (p-value < 0.01) | |
| Research article | Pre-existing condition | Distribution of SAE and non-SAE |
| Sonneville R et al. (2017) [37] Retrospective analysis (SAE n = 1341, non-SAE n = 1172) | Stroke (neurological disease) | 7.4% SAE vs. 3.9% non-SAE (p-value < 0.01) |
| Epilepsy (neurological disease) | 2.6% SAE vs. 1.0% non-SAE (p-value < 0.01) | |
| Jin G et al. (2022) [89] Retrospective analysis (SAE n = 132, non-SAE n = 90) | Stroke | 33.3.% SAE vs. 21.1% non-SAE (p-value = 0.047) |
| Chronic immunodepression | ||
| Research article | Pre-existing condition | Mortality of SAE |
| Sonneville R et al. (2017) [37] Retrospective analysis (SAE n = 1341, non-SAE n = 1172) | Chronic immunodepression | HR 1.58 (95% CI: 1.34–1.87; p-value < 0.01) 25.2% SAE vs. 35.2% non-SAE (p-value < 0.01) |
| Research article | Pre-existing condition | Distribution of SAE and non-SAE |
| Sonneville R et al. (2017) [37] Retrospective analysis (SAE n = 1341, non-SAE n = 1172) | Chronic steroid use | 6.3% SAE vs. 7.1% non-SAE (p-value = 0.46) |
| Chen J et al. (2020) [92] Retrospective analysis (SAE n = 127, non-SAE n = 164) | Immune diseases | 1.8% SAE vs. 0.8% non-SAE (p-value = 0.803) |
6.4. Chronic Liver Disease
6.5. Diabetes Mellitus
6.6. Neurological and Psychiatric Conditions
6.7. Chronic Immunodepression
7. Characteristics of SAE Patients at Admission to the Intensive Care Unit (ICU)
7.1. Disease Severity Scores
7.2. Site of Infection and Identified Pathogen
8. ICU Management of SAE
8.1. SAE Diagnosis
8.2. EEG
8.3. Transcranial Doppler (TCD)
9. Pharmacological Management of SAE
10. Non-Pharmacological Management of SAE
11. Unknowns
Author Contributions
Funding
Institutional Review Board Statement
Informed Consent Statement
Data Availability Statement
Conflicts of Interest
References
- Goodwin, G.H.; Sanders, C.; Johns, E.W. A new group of chromatin-associated proteins with a high content of acidic and basic amino acids. Eur. J. Biochem. 1973, 38, 14–19. [Google Scholar] [CrossRef] [PubMed]
- Calogero, S.; Grassi, F.; Aguzzi, A.; Voigtländer, T.; Ferrier, P.; Ferrari, S.; Bianchi, M.E. The lack of chromosomal protein Hmg1 does not disrupt cell growth but causes lethal hypoglycaemia in newborn mice. Nat. Genet. 1999, 22, 276–280. [Google Scholar] [CrossRef] [PubMed]
- Yang, H.; Antoine, D.J.; Andersson, U.; Tracey, K.J. The many faces of HMGB1: Molecular structure-functional activity in inflammation, apoptosis, and chemotaxis. J. Leukoc. Biol. 2013, 93, 865–873. [Google Scholar] [CrossRef] [Green Version]
- Thomas, J.O.; Travers, A.A. HMG1 and 2, and related ‘architectural’ DNA-binding proteins. Trends Biochem. Sci. 2001, 26, 167–174. [Google Scholar] [CrossRef]
- Agresti, A.; Bianchi, M.E. HMGB proteins and gene expression. Curr. Opin. Genet. Dev. 2003, 13, 170–178. [Google Scholar] [CrossRef]
- Stros, M. HMGB proteins: Interactions with DNA and chromatin. Biochim. Biophys. Acta 2010, 1799, 101–113. [Google Scholar] [CrossRef]
- Knapp, S.; Müller, S.; Digilio, G.; Bonaldi, T.; Bianchi, M.E.; Musco, G. The long acidic tail of high mobility group box 1 (HMGB1) protein forms an extended and flexible structure that interacts with specific residues within and between the HMG boxes. Biochemistry 2004, 43, 11992–11997. [Google Scholar] [CrossRef] [PubMed]
- Stott, K.; Watson, M.; Howe, F.S.; Grossmann, J.G.; Thomas, J.O. Tail-mediated collapse of HMGB1 is dynamic and occurs via differential binding of the acidic tail to the A and B domains. J. Mol. Biol. 2010, 403, 706–722. [Google Scholar] [CrossRef]
- Yang, H.; Lundbäck, P.; Ottosson, L.; Erlandsson-Harris, H.; Venereau, E.; Bianchi, M.E.; Al-Abed, Y.; Andersson, U.; Tracey, K.J. Redox modifications of cysteine residues regulate the cytokine activity of HMGB1. Mol. Med. 2021, 27, 58. [Google Scholar] [CrossRef]
- Bonaldi, T.; Talamo, F.; Scaffidi, P.; Ferrera, D.; Porto, A.; Bachi, A.; Rubartelli, A.; Agresti, A.; Bianchi, M.E. Monocytic cells hyperacetylate chromatin protein HMGB1 to redirect it towards secretion. EMBO J. 2003, 22, 5551–5560. [Google Scholar] [CrossRef] [Green Version]
- Lu, B.; Antoine, D.J.; Kwan, K.; Lundbäck, P.; Wähämaa, H.; Schierbeck, H.; Robinson, M.; Van Zoelen, M.A.; Yang, H.; Li, J.; et al. JAK/STAT1 signaling promotes HMGB1 hyperacetylation and nuclear translocation. Proc. Natl. Acad. Sci. USA 2014, 111, 3068–3073. [Google Scholar] [CrossRef] [Green Version]
- Dhupar, R.; Klune, J.R.; Evankovich, J.; Cardinal, J.; Zhang, M.; Ross, M.; Murase, N.; Geller, D.A.; Billiar, T.R.; Tsung, A. Interferon regulatory factor 1 mediates acetylation and release of high mobility group box 1 from hepatocytes during murine liver ischemia-reperfusion injury. Shock 2011, 35, 293–301. [Google Scholar] [CrossRef]
- Youn, J.H.; Shin, J.S. Nucleocytoplasmic shuttling of HMGB1 is regulated by phosphorylation that redirects it toward secretion. J. Immunol. 2006, 177, 7889–7897. [Google Scholar] [CrossRef] [PubMed] [Green Version]
- Ito, I.; Fukazawa, J.; Yoshida, M. Post-translational methylation of high mobility group box 1 (HMGB1) causes its cytoplasmic localization in neutrophils. J. Biol. Chem. 2007, 282, 16336–16344. [Google Scholar] [CrossRef] [PubMed] [Green Version]
- Kang, R.; Livesey, K.M.; Zeh, H.J.; Loze, M.T.; Tang, D. HMGB1: A novel Beclin 1-binding protein active in autophagy. Autophagy 2010, 6, 1209–1211. [Google Scholar] [CrossRef] [PubMed]
- Lamkanfi, M.; Sarkar, A.; Vande Walle, L.; Vitari, A.C.; Amer, A.O.; Wewers, M.D.; Tracey, K.J.; Kanneganti, T.D.; Dixit, V.M. Inflammasome-dependent release of the alarmin HMGB1 in endotoxemia. J. Immunol. 2010, 185, 4385–4392. [Google Scholar] [CrossRef] [PubMed] [Green Version]
- Deng, M.; Scott, M.J.; Fan, J.; Billiar, T.R. Location is the key to function: HMGB1 in sepsis and trauma-induced inflammation. J. Leukoc. Biol. 2019, 106, 161–169. [Google Scholar] [CrossRef] [PubMed]
- Yang, D.; Han, Z.; Oppenheim, J.J. Alarmins and immunity. Immunol. Rev. 2017, 280, 41–56. [Google Scholar] [CrossRef]
- Yang, H.; Wang, H.; Chavan, S.S.; Andersson, U. High Mobility Group Box Protein 1 (HMGB1): The Prototypical Endogenous Danger Molecule. Mol. Med. 2015, 21 (Suppl. S1), S6–S12. [Google Scholar] [CrossRef]
- Andersson, U.; Yang, H.; Harris, H. High-mobility group box 1 protein (HMGB1) operates as an alarmin outside as well as inside cells. Semin. Immunol. 2018, 38, 40–48. [Google Scholar] [CrossRef] [PubMed]
- Schiraldi, M.; Raucci, A.; Muñoz, L.M.; Livoti, E.; Celona, B.; Venereau, E.; Apuzzo, T.; De Marchis, F.; Pedotti, M.; Bachi, A.; et al. HMGB1 promotes recruitment of inflammatory cells to damaged tissues by forming a complex with CXCL12 and signaling via CXCR4. J. Exp. Med. 2012, 209, 551–563. [Google Scholar] [CrossRef] [PubMed] [Green Version]
- Ge, Y.; Huang, M.; Yao, Y.M. The Effect and Regulatory Mechanism of High Mobility Group Box-1 Protein on Immune Cells in Inflammatory Diseases. Cells 2021, 10, 1044. [Google Scholar] [CrossRef] [PubMed]
- Yang, H.; Wang, H.; Ju, Z.; Ragab, A.A.; Lundbäck, P.; Long, W.; Valdes-Ferrer, S.I.; He, M.; Pribis, J.P.; Li, J.; et al. MD-2 is required for disulfide HMGB1-dependent TLR4 signaling. J. Exp. Med. 2015, 212, 5–14. [Google Scholar] [CrossRef] [Green Version]
- Deng, M.; Tang, Y.; Li, W.; Wang, X.; Zhang, R.; Zhang, X.; Zhao, X.; Liu, J.; Tang, C.; Liu, Z.; et al. The Endotoxin Delivery Protein HMGB1 Mediates Caspase-11-Dependent Lethality in Sepsis. Immunity 2018, 49, 740–753.e747. [Google Scholar] [CrossRef] [PubMed] [Green Version]
- Hori, O.; Brett, J.; Slattery, T.; Cao, R.; Zhang, J.; Chen, J.X.; Nagashima, M.; Lundh, E.R.; Vijay, S.; Nitecki, D.; et al. The receptor for advanced glycation end products (RAGE) is a cellular binding site for amphoterin. Mediation of neurite outgrowth and co-expression of rage and amphoterin in the developing nervous system. J. Biol. Chem. 1995, 270, 25752–25761. [Google Scholar] [CrossRef] [Green Version]
- LeBlanc, P.M.; Doggett, T.A.; Choi, J.; Hancock, M.A.; Durocher, Y.; Frank, F.; Nagar, B.; Ferguson, T.A.; Saleh, M. An immunogenic peptide in the A-box of HMGB1 protein reverses apoptosis-induced tolerance through RAGE receptor. J. Biol. Chem. 2014, 289, 7777–7786. [Google Scholar] [CrossRef] [Green Version]
- Yang, H.; Wang, H.; Levine, Y.A.; Gunasekaran, M.K.; Wang, Y.; Addorisio, M.; Zhu, S.; Li, W.; Li, J.; de Kleijn, D.P.; et al. Identification of CD163 as an antiinflammatory receptor for HMGB1-haptoglobin complexes. JCI Insight 2018, 3, e126617. [Google Scholar] [CrossRef] [Green Version]
- Son, M.; Porat, A.; He, M.; Suurmond, J.; Santiago-Schwarz, F.; Andersson, U.; Coleman, T.R.; Volpe, B.T.; Tracey, K.J.; Al-Abed, Y.; et al. C1q and HMGB1 reciprocally regulate human macrophage polarization. Blood 2016, 128, 2218–2228. [Google Scholar] [CrossRef] [Green Version]
- Wild, C.A.; Bergmann, C.; Fritz, G.; Schuler, P.; Hoffmann, T.K.; Lotfi, R.; Westendorf, A.; Brandau, S.; Lang, S. HMGB1 conveys immunosuppressive characteristics on regulatory and conventional T cells. Int. Immunol. 2012, 24, 485–494. [Google Scholar] [CrossRef] [Green Version]
- Bandala-Sanchez, E.; Bediaga, N.G.; Goddard-Borger, E.D.; Ngui, K.; Naselli, G.; Stone, N.L.; Neale, A.M.; Pearce, L.A.; Wardak, A.; Czabotar, P.; et al. CD52 glycan binds the proinflammatory B box of HMGB1 to engage the Siglec-10 receptor and suppress human T cell function. Proc. Natl. Acad. Sci. USA 2018, 115, 7783–7788. [Google Scholar] [CrossRef] [Green Version]
- Rudd, K.E.; Johnson, S.C.; Agesa, K.M.; Shackelford, K.A.; Tsoi, D.; Kievlan, D.R.; Colombara, D.V.; Ikuta, K.S.; Kissoon, N.; Finfer, S.; et al. Global, regional, and national sepsis incidence and mortality, 1990–2017: Analysis for the Global Burden of Disease Study. Lancet 2020, 395, 200–211. [Google Scholar] [CrossRef] [PubMed] [Green Version]
- Singer, M.; Deutschman, C.S.; Seymour, C.W.; Shankar-Hari, M.; Annane, D.; Bauer, M.; Bellomo, R.; Bernard, G.R.; Chiche, J.D.; Coopersmith, C.M.; et al. The Third International Consensus Definitions for Sepsis and Septic Shock (Sepsis-3). JAMA 2016, 315, 801–810. [Google Scholar] [CrossRef] [PubMed]
- Gofton, T.E.; Young, G.B. Sepsis-associated encephalopathy. Nat. Rev. Neurol. 2012, 8, 557–566. [Google Scholar] [CrossRef] [PubMed]
- Ferlini, L.; Gaspard, N. What’s new on septic encephalopathy? Ten things you need to know. Minerva Anestesiol. 2022, 89, 217–225. [Google Scholar] [CrossRef]
- Bleck, T.P.; Smith, M.C.; Pierre-Louis, S.J.; Jares, J.J.; Murray, J.; Hansen, C.A. Neurologic complications of critical medical illnesses. Crit. Care Med. 1993, 21, 98–103. [Google Scholar] [CrossRef] [PubMed]
- Eidelman, L.A.; Putterman, D.; Putterman, C.; Sprung, C.L. The spectrum of septic encephalopathy. Definitions, etiologies, and mortalities. JAMA 1996, 275, 470–473. [Google Scholar] [CrossRef] [PubMed]
- Sonneville, R.; de Montmollin, E.; Poujade, J.; Garrouste-Orgeas, M.; Souweine, B.; Darmon, M.; Mariotte, E.; Argaud, L.; Barbier, F.; Goldgran-Toledano, D.; et al. Potentially modifiable factors contributing to sepsis-associated encephalopathy. Intensive Care Med. 2017, 43, 1075–1084. [Google Scholar] [CrossRef]
- Ebersoldt, M.; Sharshar, T.; Annane, D. Sepsis-associated delirium. Intensive Care Med. 2007, 33, 941–950. [Google Scholar] [CrossRef]
- Iwashyna, T.J.; Ely, E.W.; Smith, D.M.; Langa, K.M. Long-term cognitive impairment and functional disability among survivors of severe sepsis. JAMA 2010, 304, 1787–1794. [Google Scholar] [CrossRef] [Green Version]
- Chung, H.Y.; Wickel, J.; Brunkhorst, F.M.; Geis, C. Sepsis-Associated Encephalopathy: From Delirium to Dementia? J. Clin. Med. 2020, 9, 703. [Google Scholar] [CrossRef] [PubMed] [Green Version]
- Pandharipande, P.P.; Girard, T.D.; Jackson, J.C.; Morandi, A.; Thompson, J.L.; Pun, B.T.; Brummel, N.E.; Hughes, C.G.; Vasilevskis, E.E.; Shintani, A.K.; et al. Long-term cognitive impairment after critical illness. N. Engl. J. Med. 2013, 369, 1306–1316. [Google Scholar] [CrossRef] [PubMed] [Green Version]
- Bozza, F.A.; D’Avila, J.C.; Ritter, C.; Sonneville, R.; Sharshar, T.; Dal-Pizzol, F. Bioenergetics, mitochondrial dysfunction, and oxidative stress in the pathophysiology of septic encephalopathy. Shock 2013, 39 (Suppl. S1), 10–16. [Google Scholar] [CrossRef]
- Annane, D.; Sharshar, T. Cognitive decline after sepsis. Lancet Respir. Med. 2015, 3, 61–69. [Google Scholar] [CrossRef]
- Rosengarten, B.; Krekel, D.; Kuhnert, S.; Schulz, R. Early neurovascular uncoupling in the brain during community acquired pneumonia. Crit. Care 2012, 16, R64. [Google Scholar] [CrossRef] [PubMed] [Green Version]
- Manfredini, A.; Constantino, L.; Pinto, M.C.; Michels, M.; Burger, H.; Kist, L.W.; Silva, M.C.; Gomes, L.M.; Dominguini, D.; Steckert, A.; et al. Mitochondrial dysfunction is associated with long-term cognitive impairment in an animal sepsis model. Clin. Sci. 2019, 133, 1993–2004. [Google Scholar] [CrossRef]
- Ginhoux, F.; Lim, S.; Hoeffel, G.; Low, D.; Huber, T. Origin and differentiation of microglia. Front. Cell. Neurosci. 2013, 7, 45. [Google Scholar] [CrossRef] [Green Version]
- Solito, E.; Sastre, M. Microglia function in Alzheimer’s disease. Front. Pharmacol. 2012, 3, 14. [Google Scholar] [CrossRef] [PubMed] [Green Version]
- van Gool, W.A.; van de Beek, D.; Eikelenboom, P. Systemic infection and delirium: When cytokines and acetylcholine collide. Lancet 2010, 375, 773–775. [Google Scholar] [CrossRef] [PubMed]
- Zaghloul, N.; Addorisio, M.E.; Silverman, H.A.; Patel, H.L.; Valdés-Ferrer, S.I.; Ayasolla, K.R.; Lehner, K.R.; Olofsson, P.S.; Nasim, M.; Metz, C.N.; et al. Forebrain Cholinergic Dysfunction and Systemic and Brain Inflammation in Murine Sepsis Survivors. Front. Immunol. 2017, 8, 1673. [Google Scholar] [CrossRef] [Green Version]
- Chhor, V.; Le Charpentier, T.; Lebon, S.; Oré, M.V.; Celador, I.L.; Josserand, J.; Degos, V.; Jacotot, E.; Hagberg, H.; Sävman, K.; et al. Characterization of phenotype markers and neuronotoxic potential of polarised primary microglia in vitro. Brain Behav. Immun. 2013, 32, 70–85. [Google Scholar] [CrossRef] [PubMed]
- Wolf, S.A.; Boddeke, H.W.; Kettenmann, H. Microglia in Physiology and Disease. Annu. Rev. Physiol. 2017, 79, 619–643. [Google Scholar] [CrossRef] [PubMed]
- Paolicelli, R.C.; Sierra, A.; Stevens, B.; Tremblay, M.E.; Aguzzi, A.; Ajami, B.; Amit, I.; Audinat, E.; Bechmann, I.; Bennett, M.; et al. Microglia states and nomenclature: A field at its crossroads. Neuron 2022, 110, 3458–3483. [Google Scholar] [CrossRef] [PubMed]
- Fukushima, S.; Furube, E.; Itoh, M.; Nakashima, T.; Miyata, S. Robust increase of microglia proliferation in the fornix of hippocampal axonal pathway after a single LPS stimulation. J. Neuroimmunol. 2015, 285, 31–40. [Google Scholar] [CrossRef]
- Sonneville, R.; Verdonk, F.; Rauturier, C.; Klein, I.F.; Wolff, M.; Annane, D.; Chretien, F.; Sharshar, T. Understanding brain dysfunction in sepsis. Ann. Intensive Care 2013, 3, 15. [Google Scholar] [CrossRef] [Green Version]
- Singer, B.H.; Dickson, R.P.; Denstaedt, S.J.; Newstead, M.W.; Kim, K.; Falkowski, N.R.; Erb-Downward, J.R.; Schmidt, T.M.; Huffnagle, G.B.; Standiford, T.J. Bacterial Dissemination to the Brain in Sepsis. Am. J. Respir. Crit. Care Med. 2018, 197, 747–756. [Google Scholar] [CrossRef]
- Adembri, C.; Selmi, V.; Vitali, L.; Tani, A.; Margheri, M.; Loriga, B.; Carlucci, M.; Nosi, D.; Formigli, L.; De Gaudio, A.R. Minocycline but not tigecycline is neuroprotective and reduces the neuroinflammatory response induced by the superimposition of sepsis upon traumatic brain injury. Crit. Care Med. 2014, 42, e570–e582. [Google Scholar] [CrossRef]
- Verdonk, F.; Petit, A.C.; Abdel-Ahad, P.; Vinckier, F.; Jouvion, G.; de Maricourt, P.; De Medeiros, G.F.; Danckaert, A.; Van Steenwinckel, J.; Blatzer, M.; et al. Microglial production of quinolinic acid as a target and a biomarker of the antidepressant effect of ketamine. Brain Behav. Immun. 2019, 81, 361–373. [Google Scholar] [CrossRef] [PubMed]
- Comim, C.M.; Pereira, J.G.; Steckert, A.; Petronilho, F.; Barichello, T.; Quevedo, J.; Dal-Pizzol, F. Rivastigmine reverses habituation memory impairment observed in sepsis survivor rats. Shock 2009, 32, 270–271. [Google Scholar] [CrossRef] [PubMed]
- Niederbichler, A.D.; Papst, S.; Claassen, L.; Jokuszies, A.; Steinstraesser, L.; Hirsch, T.; Altintas, M.A.; Ipaktchi, K.R.; Reimers, K.; Kraft, T.; et al. Burn-induced organ dysfunction: Vagus nerve stimulation attenuates organ and serum cytokine levels. Burns 2009, 35, 783–789. [Google Scholar] [CrossRef]
- Lai, I.K.; Valdearcos, M.; Morioka, K.; Saxena, S.; Feng, X.; Li, R.; Uchida, Y.; Lijun, A.; Li, W.; Pan, J.; et al. Blocking Kv1.3 potassium channels prevents postoperative neuroinflammation and cognitive decline without impairing wound healing in mice. Br. J. Anaesth. 2020, 125, 298–307. [Google Scholar] [CrossRef]
- Sonneville, R.; Derese, I.; Marques, M.B.; Langouche, L.; Derde, S.; Chatre, L.; Chrétien, F.; Annane, D.; Sharshar, T.; Van den Berghe, G.; et al. Neuropathological Correlates of Hyperglycemia During Prolonged Polymicrobial Sepsis in Mice. Shock 2015, 44, 245–251. [Google Scholar] [CrossRef]
- van Eijk, M.M.; Roes, K.C.; Honing, M.L.; Kuiper, M.A.; Karakus, A.; van der Jagt, M.; Spronk, P.E.; van Gool, W.A.; van der Mast, R.C.; Kesecioglu, J.; et al. Effect of rivastigmine as an adjunct to usual care with haloperidol on duration of delirium and mortality in critically ill patients: A multicentre, double-blind, placebo-controlled randomised trial. Lancet 2010, 376, 1829–1837. [Google Scholar] [CrossRef] [PubMed] [Green Version]
- Sharshar, T.; Annane, D.; de la Grandmaison, G.L.; Brouland, J.P.; Hopkinson, N.S.; Françoise, G. The neuropathology of septic shock. Brain Pathol. 2004, 14, 21–33. [Google Scholar] [CrossRef] [PubMed]
- Vasek, M.J.; Garber, C.; Dorsey, D.; Durrant, D.M.; Bollman, B.; Soung, A.; Yu, J.; Perez-Torres, C.; Frouin, A.; Wilton, D.K.; et al. A complement-microglial axis drives synapse loss during virus-induced memory impairment. Nature 2016, 534, 538–543. [Google Scholar] [CrossRef] [PubMed] [Green Version]
- Mahmoud, S.; Gharagozloo, M.; Simard, C.; Gris, D. Astrocytes Maintain Glutamate Homeostasis in the CNS by Controlling the Balance between Glutamate Uptake and Release. Cells 2019, 8, 184. [Google Scholar] [CrossRef] [PubMed] [Green Version]
- Sekino, N.; Selim, M.; Shehadah, A. Sepsis-associated brain injury: Underlying mechanisms and potential therapeutic strategies for acute and long-term cognitive impairments. J. Neuroinflammation 2022, 19, 101. [Google Scholar] [CrossRef]
- Delano, M.J.; Ward, P.A. The immune system’s role in sepsis progression, resolution, and long-term outcome. Immunol. Rev. 2016, 274, 330–353. [Google Scholar] [CrossRef] [PubMed] [Green Version]
- Diener, K.R.; Al-Dasooqi, N.; Lousberg, E.L.; Hayball, J.D. The multifunctional alarmin HMGB1 with roles in the pathophysiology of sepsis and cancer. Immunol. Cell Biol. 2013, 91, 443–450. [Google Scholar] [CrossRef] [PubMed]
- Yu, M.; Wang, H.; Ding, A.; Golenbock, D.T.; Latz, E.; Czura, C.J.; Fenton, M.J.; Tracey, K.J.; Yang, H. HMGB1 signals through toll-like receptor (TLR) 4 and TLR2. Shock 2006, 26, 174–179. [Google Scholar] [CrossRef] [PubMed]
- Sims, G.P.; Rowe, D.C.; Rietdijk, S.T.; Herbst, R.; Coyle, A.J. HMGB1 and RAGE in inflammation and cancer. Annu. Rev. Immunol. 2010, 28, 367–388. [Google Scholar] [CrossRef] [PubMed]
- Terrando, N.; Yang, T.; Wang, X.; Fang, J.; Cao, M.; Andersson, U.; Erlandsson, H.H.; Ouyang, W.; Tong, J. Systemic HMGB1 Neutralization Prevents Postoperative Neurocognitive Dysfunction in Aged Rats. Front. Immunol. 2016, 7, 441. [Google Scholar] [CrossRef] [Green Version]
- Wei, L.; Zhang, W.; Li, Y.; Zhai, J. The SIRT1-HMGB1 axis: Therapeutic potential to ameliorate inflammatory responses and tumor occurrence. Front. Cell Dev. Biol. 2022, 10, 986511. [Google Scholar] [CrossRef]
- Okuma, Y.; Liu, K.; Wake, H.; Zhang, J.; Maruo, T.; Date, I.; Yoshino, T.; Ohtsuka, A.; Otani, N.; Tomura, S.; et al. Anti-high mobility group box-1 antibody therapy for traumatic brain injury. Ann. Neurol. 2012, 72, 373–384. [Google Scholar] [CrossRef] [Green Version]
- Sun, Q.; Wu, W.; Hu, Y.C.; Li, H.; Zhang, D.; Li, S.; Li, W.; Li, W.D.; Ma, B.; Zhu, J.H.; et al. Early release of high-mobility group box 1 (HMGB1) from neurons in experimental subarachnoid hemorrhage in vivo and in vitro. J. Neuroinflammation 2014, 11, 106. [Google Scholar] [CrossRef] [PubMed] [Green Version]
- Fujita, K.; Motoki, K.; Tagawa, K.; Chen, X.; Hama, H.; Nakajima, K.; Homma, H.; Tamura, T.; Watanabe, H.; Katsuno, M.; et al. HMGB1, a pathogenic molecule that induces neurite degeneration via TLR4-MARCKS, is a potential therapeutic target for Alzheimer’s disease. Sci. Rep. 2016, 6, 31895. [Google Scholar] [CrossRef] [PubMed] [Green Version]
- Sun, Y.; Hei, M.; Fang, Z.; Tang, Z.; Wang, B.; Hu, N. High-Mobility Group Box 1 Contributes to Cerebral Cortex Injury in a Neonatal Hypoxic-Ischemic Rat Model by Regulating the Phenotypic Polarization of Microglia. Front. Cell Neurosci. 2019, 13, 506. [Google Scholar] [CrossRef] [PubMed] [Green Version]
- Zhang, J.; Takahashi, H.K.; Liu, K.; Wake, H.; Liu, R.; Maruo, T.; Date, I.; Yoshino, T.; Ohtsuka, A.; Mori, S.; et al. Anti-high mobility group box-1 monoclonal antibody protects the blood-brain barrier from ischemia-induced disruption in rats. Stroke 2011, 42, 1420–1428. [Google Scholar] [CrossRef] [PubMed] [Green Version]
- Paudel, Y.N.; Angelopoulou, E.; Piperi, C.; Othman, I.; Shaikh, M.F. HMGB1-Mediated Neuroinflammatory Responses in Brain Injuries: Potential Mechanisms and Therapeutic Opportunities. Int. J. Mol. Sci. 2020, 21, 4609. [Google Scholar] [CrossRef] [PubMed]
- Okuma, Y.; Liu, K.; Wake, H.; Liu, R.; Nishimura, Y.; Hui, Z.; Teshigawara, K.; Haruma, J.; Yamamoto, Y.; Yamamoto, H.; et al. Glycyrrhizin inhibits traumatic brain injury by reducing HMGB1-RAGE interaction. Neuropharmacology 2014, 85, 18–26. [Google Scholar] [CrossRef] [PubMed]
- Haruma, J.; Teshigawara, K.; Hishikawa, T.; Wang, D.; Liu, K.; Wake, H.; Mori, S.; Takahashi, H.K.; Sugiu, K.; Date, I.; et al. Anti-high mobility group box-1 (HMGB1) antibody attenuates delayed cerebral vasospasm and brain injury after subarachnoid hemorrhage in rats. Sci. Rep. 2016, 6, 37755. [Google Scholar] [CrossRef] [PubMed] [Green Version]
- Ieong, C.; Sun, H.; Wang, Q.; Ma, J. Glycyrrhizin suppresses the expressions of HMGB1 and ameliorates inflammative effect after acute subarachnoid hemorrhage in rat model. J. Clin. Neurosci. 2018, 47, 278–284. [Google Scholar] [CrossRef] [PubMed]
- Nishibori, M.; Mori, S.; Takahashi, H.K. Anti-HMGB1 monoclonal antibody therapy for a wide range of CNS and PNS diseases. J. Pharmacol. Sci. 2019, 140, 94–101. [Google Scholar] [CrossRef]
- Sloan, R.P. Dietary Modulation of Neuroinflammation in Age-Related Memory Disorders; Columbia University Health Sciences: New York, NY, USA, 2018. [Google Scholar]
- Bahaa, M.M. Clinical Study Evaluating Safety of Pentoxifylline in Patients with Grand-Mal Epilepsy Treated by Phenytoin Monotherapy; ClinicalTrials.gov: Bethesda, MD, USA, 2023. [Google Scholar]
- Ji, J.; Fu, T.; Dong, C.; Zhu, W.; Yang, J.; Kong, X.; Zhang, Z.; Bao, Y.; Zhao, R.; Ge, X.; et al. Targeting HMGB1 by ethyl pyruvate ameliorates systemic lupus erythematosus and reverses the senescent phenotype of bone marrow-mesenchymal stem cells. Aging 2019, 11, 4338–4353. [Google Scholar] [CrossRef]
- Calder, P.C. Omega-3 fatty acids and inflammatory processes: From molecules to man. Biochem. Soc. Trans. 2017, 45, 1105–1115. [Google Scholar] [CrossRef] [PubMed] [Green Version]
- Chen, X.; Wu, S.; Chen, C.; Xie, B.; Fang, Z.; Hu, W.; Chen, J.; Fu, H.; He, H. Omega-3 polyunsaturated fatty acid supplementation attenuates microglial-induced inflammation by inhibiting the HMGB1/TLR4/NF-κB pathway following experimental traumatic brain injury. J. Neuroinflammation 2017, 14, 143. [Google Scholar] [CrossRef]
- Aneja, R.K.; Alcamo, A.M.; Cummings, J.; Vagni, V.; Feldman, K.; Wang, Q.; Dixon, C.E.; Billiar, T.R.; Kochanek, P.M. Lack of Benefit on Brain Edema, Blood-Brain Barrier Permeability, or Cognitive Outcome in Global Inducible High Mobility Group Box 1 Knockout Mice Despite Tissue Sparing after Experimental Traumatic Brain Injury. J. Neurotrauma. 2019, 36, 360–369. [Google Scholar] [CrossRef]
- Jin, G.; Wang, S.; Chen, J.; Hu, W.; Zhu, Y.; Xi, S. Identification of sepsis-associated encephalopathy risk factors in elderly patients: A retrospective observational cohort study. Turk. J. Med. Sci. 2022, 52, 1513–1522. [Google Scholar] [CrossRef]
- Lu, X.; Kang, H.; Zhou, D.; Li, Q. Prediction and risk assessment of sepsis-associated encephalopathy in ICU based on interpretable machine learning. Sci. Rep. 2022, 12, 22621. [Google Scholar] [CrossRef]
- Lei, W.; Ren, Z.; Su, J.; Zheng, X.; Gao, L.; Xu, Y.; Deng, J.; Xiao, C.; Sheng, S.; Cheng, Y.; et al. Immunological risk factors for sepsis-associated delirium and mortality in ICU patients. Front. Immunol. 2022, 13, 940779. [Google Scholar] [CrossRef]
- Chen, J.; Shi, X.; Diao, M.; Jin, G.; Zhu, Y.; Hu, W.; Xi, S. A retrospective study of sepsis-associated encephalopathy: Epidemiology, clinical features and adverse outcomes. BMC Emerg. Med. 2020, 20, 77. [Google Scholar] [CrossRef] [PubMed]
- Angus, D.C.; Linde-Zwirble, W.T.; Lidicker, J.; Clermont, G.; Carcillo, J.; Pinsky, M.R. Epidemiology of severe sepsis in the United States: Analysis of incidence, outcome, and associated costs of care. Crit. Care Med. 2001, 29, 1303–1310. [Google Scholar] [CrossRef] [PubMed]
- Chen, L.; Zhu, H.; Su, S.; Harshfield, G.; Sullivan, J.; Webb, C.; Blumenthal, J.A.; Wang, X.; Huang, Y.; Treiber, F.A.; et al. High-Mobility Group Box-1 Is Associated With Obesity, Inflammation, and Subclinical Cardiovascular Risk Among Young Adults: A Longitudinal Cohort Study. Arterioscler. Thromb. Vasc. Biol. 2020, 40, 2776–2784. [Google Scholar] [CrossRef] [PubMed]
- Samuels, D.C.; Hulgan, T.; Fessel, J.P.; Billings, F.T.t.; Thompson, J.L.; Chandrasekhar, R.; Girard, T.D. Mitochondrial DNA Haplogroups and Delirium During Sepsis. Crit. Care Med. 2019, 47, 1065–1071. [Google Scholar] [CrossRef] [PubMed]
- Zhang, L.N.; Wang, X.T.; Ai, Y.H.; Guo, Q.L.; Huang, L.; Liu, Z.Y.; Yao, B. Epidemiological features and risk factors of sepsis-associated encephalopathy in intensive care unit patients: 2008–2011. Chin. Med. J. 2012, 125, 828–831. [Google Scholar]
- Feng, Q.; Ai, Y.H.; Gong, H.; Wu, L.; Ai, M.L.; Deng, S.Y.; Huang, L.; Peng, Q.Y.; Zhang, L.N. Characterization of Sepsis and Sepsis-Associated Encephalopathy. J. Intensive Care Med. 2019, 34, 938–945. [Google Scholar] [CrossRef] [PubMed]
- Stepanikova, I.; Bateman, L.B.; Oates, G.R. Systemic Inflammation in Midlife: Race, Socioeconomic Status, and Perceived Discrimination. Am. J. Prev. Med. 2017, 52, S63–S76. [Google Scholar] [CrossRef] [PubMed] [Green Version]
- Paalani, M.; Lee, J.W.; Haddad, E.; Tonstad, S. Determinants of inflammatory markers in a bi-ethnic population. Ethn. Dis. 2011, 21, 142–149. [Google Scholar]
- Starzak, D.E.; Semple, S.J.; Smith, L.L.; McKune, A.J. Differing cytokine responses by ethnic groups to a bout of exercise-induced muscle damage: A preliminary report. J. Sports Med. Phys. Fitness 2016, 56, 665–677. [Google Scholar] [PubMed]
- Zhang, S.; Hu, L.; Jiang, J.; Li, H.; Wu, Q.; Ooi, K.; Wang, J.; Feng, Y.; Zhu, D.; Xia, C. HMGB1/RAGE axis mediates stress-induced RVLM neuroinflammation in mice via impairing mitophagy flux in microglia. J. Neuroinflammation 2020, 17, 15. [Google Scholar] [CrossRef]
- Qu, C.; Wang, X.W.; Huang, C.; Qiu, F.; Xiang, X.Y.; Lu, Z.Q. High mobility group box 1 gene polymorphism is associated with the risk of postoperative atrial fibrillation after coronary artery bypass surgery. J. Cardiothorac. Surg. 2015, 10, 88. [Google Scholar] [CrossRef] [Green Version]
- Hu, X.R.; Wang, X.H.; Liu, H.F.; Zhou, W.J.; Jiang, H. High mobility group box 1 protein: Possible pathogenic link to atrial fibrillation. Chin. Med. J. 2012, 125, 2346–2348. [Google Scholar] [PubMed]
- Yan, X.X.; Lu, L.; Peng, W.H.; Wang, L.J.; Zhang, Q.; Zhang, R.Y.; Chen, Q.J.; Shen, W.F. Increased serum HMGB1 level is associated with coronary artery disease in nondiabetic and type 2 diabetic patients. Atherosclerosis 2009, 205, 544–548. [Google Scholar] [CrossRef] [PubMed]
- Andrassy, M.; Volz, H.C.; Maack, B.; Schuessler, A.; Gitsioudis, G.; Hofmann, N.; Laohachewin, D.; Wienbrandt, A.R.; Kaya, Z.; Bierhaus, A.; et al. HMGB1 is associated with atherosclerotic plaque composition and burden in patients with stable coronary artery disease. PLoS ONE 2012, 7, e52081. [Google Scholar] [CrossRef]
- Hashimoto, T.; Ishii, J.; Kitagawa, F.; Yamada, S.; Hattori, K.; Okumura, M.; Naruse, H.; Motoyama, S.; Matsui, S.; Tanaka, I.; et al. Circulating high-mobility group box 1 and cardiovascular mortality in unstable angina and non-ST-segment elevation myocardial infarction. Atherosclerosis 2012, 221, 490–495. [Google Scholar] [CrossRef] [PubMed]
- Hong, S.M.; Cho, J.S.; Um, J.Y.; Shin, J.M.; Park, I.H.; Lee, S.H.; Lee, S.H.; Lee, H.M. Increased expression of high-mobility group protein B1 in chronic rhinosinusitis. Am. J. Rhinol. Allergy 2013, 27, 278–282. [Google Scholar] [CrossRef]
- Dzaman, K.; Szczepanski, M.J.; Molinska-Glura, M.; Krzeski, A.; Zagor, M. Expression of the receptor for advanced glycation end products, a target for high mobility group box 1 protein, and its role in chronic recalcitrant rhinosinusitis with nasal polyps. Arch. Immunol. Ther. Exp. 2015, 63, 223–230. [Google Scholar] [CrossRef] [Green Version]
- Watanabe, T.; Asai, K.; Fujimoto, H.; Tanaka, H.; Kanazawa, H.; Hirata, K. Increased levels of HMGB-1 and endogenous secretory RAGE in induced sputum from asthmatic patients. Respir. Med. 2011, 105, 519–525. [Google Scholar] [CrossRef] [Green Version]
- Shim, E.J.; Chun, E.; Lee, H.S.; Bang, B.R.; Kim, T.W.; Cho, S.H.; Min, K.U.; Park, H.W. The role of high-mobility group box-1 (HMGB1) in the pathogenesis of asthma. Clin. Exp. Allergy 2012, 42, 958–965. [Google Scholar] [CrossRef] [PubMed]
- Cuppari, C.; Manti, S.; Chirico, V.; Caruso, R.; Salpietro, V.; Giacchi, V.; Laganà, F.; Arrigo, T.; Salpietro, C.; Leonardi, S. Sputum high mobility group box-1 in asthmatic children: A noninvasive sensitive biomarker reflecting disease status. Ann. Allergy Asthma. Immunol. 2015, 115, 103–107. [Google Scholar] [CrossRef] [PubMed]
- Ko, H.K.; Hsu, W.H.; Hsieh, C.C.; Lien, T.C.; Lee, T.S.; Kou, Y.R. High expression of high-mobility group box 1 in the blood and lungs is associated with the development of chronic obstructive pulmonary disease in smokers. Respirology 2014, 19, 253–261. [Google Scholar] [CrossRef] [PubMed]
- Ferhani, N.; Letuve, S.; Kozhich, A.; Thibaudeau, O.; Grandsaigne, M.; Maret, M.; Dombret, M.C.; Sims, G.P.; Kolbeck, R.; Coyle, A.J.; et al. Expression of high-mobility group box 1 and of receptor for advanced glycation end products in chronic obstructive pulmonary disease. Am. J. Respir. Crit. Care Med. 2010, 181, 917–927. [Google Scholar] [CrossRef] [PubMed]
- Kanazawa, H.; Tochino, Y.; Asai, K.; Ichimaru, Y.; Watanabe, T.; Hirata, K. Validity of HMGB1 measurement in epithelial lining fluid in patients with COPD. Eur. J. Clin. Investig. 2012, 42, 419–426. [Google Scholar] [CrossRef]
- Alisi, A.; Nobili, V.; Ceccarelli, S.; Panera, N.; De Stefanis, C.; De Vito, R.; Vitali, R.; Bedogni, G.; Balsano, C.; Cucchiara, S.; et al. Plasma high mobility group box 1 protein reflects fibrosis in pediatric nonalcoholic fatty liver disease. Expert Rev. Mol. Diagn. 2014, 14, 763–771. [Google Scholar] [CrossRef] [PubMed]
- Ganz, M.; Bukong, T.N.; Csak, T.; Saha, B.; Park, J.K.; Ambade, A.; Kodys, K.; Szabo, G. Progression of non-alcoholic steatosis to steatohepatitis and fibrosis parallels cumulative accumulation of danger signals that promote inflammation and liver tumors in a high fat-cholesterol-sugar diet model in mice. J. Transl. Med. 2015, 13, 193. [Google Scholar] [CrossRef] [PubMed] [Green Version]
- Zhang, W.; Wang, L.W.; Wang, L.K.; Li, X.; Zhang, H.; Luo, L.P.; Song, J.C.; Gong, Z.J. Betaine protects against high-fat-diet-induced liver injury by inhibition of high-mobility group box 1 and Toll-like receptor 4 expression in rats. Dig. Dis. Sci. 2013, 58, 3198–3206. [Google Scholar] [CrossRef]
- Inkaya, A.C.; Demir, N.A.; Kolgelier, S.; Sumer, S.; Demir, L.S.; Ural, O.; Pehlivan, F.S.; Aslan, M.; Arpaci, A. Is serum high-mobility group box 1 (HMGB-1) level correlated with liver fibrosis in chronic hepatitis B? Medicine 2017, 96, e7547. [Google Scholar] [CrossRef]
- Albayrak, A.; Uyanik, M.H.; Cerrah, S.; Altas, S.; Dursun, H.; Demir, M.; Uslu, H. Is HMGB1 a new indirect marker for revealing fibrosis in chronic hepatitis and a new therapeutic target in treatment? Viral Immunol. 2010, 23, 633–638. [Google Scholar] [CrossRef]
- Li, L.; Chen, N.; He, L.; Wen, X. Significance of P53 and high mobility group box 1 protein in different levels of liver fibrosis in chronic hepatitis B. Zhong Nan Da Xue Xue Bao Yi Xue Ban 2015, 40, 1217–1222. [Google Scholar]
- Kao, Y.H.; Lin, Y.C.; Tsai, M.S.; Sun, C.K.; Yuan, S.S.; Chang, C.Y.; Jawan, B.; Lee, P.H. Involvement of the nuclear high mobility group B1 peptides released from injured hepatocytes in murine hepatic fibrogenesis. Biochim. Biophys. Acta 2014, 1842, 1720–1732. [Google Scholar] [CrossRef] [Green Version]
- Vicentino, A.R.R.; Carneiro, V.C.; Allonso, D.; Guilherme, R.F.; Benjamim, C.F.; Dos Santos, H.A.M.; Xavier, F.; Pyrrho, A.D.S.; Gomes, J.A.S.; Fonseca, M.C.; et al. Emerging Role of HMGB1 in the Pathogenesis of Schistosomiasis Liver Fibrosis. Front. Immunol. 2018, 9, 1979. [Google Scholar] [CrossRef] [Green Version]
- Wang, H.; Qu, H.; Deng, H. Plasma HMGB-1 Levels in Subjects with Obesity and Type 2 Diabetes: A Cross-Sectional Study in China. PLoS ONE 2015, 10, e0136564. [Google Scholar] [CrossRef] [PubMed] [Green Version]
- Dasu, M.R.; Devaraj, S.; Park, S.; Jialal, I. Increased toll-like receptor (TLR) activation and TLR ligands in recently diagnosed type 2 diabetic subjects. Diabetes Care 2010, 33, 861–868. [Google Scholar] [CrossRef] [PubMed] [Green Version]
- Biscetti, F.; Rando, M.M.; Nardella, E.; Cecchini, A.L.; Pecorini, G.; Landolfi, R.; Flex, A. High Mobility Group Box-1 and Diabetes Mellitus Complications: State of the Art and Future Perspectives. Int. J. Mol. Sci. 2019, 20, 6258. [Google Scholar] [CrossRef] [PubMed] [Green Version]
- Skrha, J., Jr.; Kalousová, M.; Svarcová, J.; Muravská, A.; Kvasnička, J.; Landová, L.; Zima, T.; Skrha, J. Relationship of soluble RAGE and RAGE ligands HMGB1 and EN-RAGE to endothelial dysfunction in type 1 and type 2 diabetes mellitus. Exp. Clin. Endocrinol. Diabetes 2012, 120, 277–281. [Google Scholar] [PubMed]
- Zhao, D.; Wang, Y.; Tang, K.; Xu, Y. Increased serum HMGB1 related with HbA1c in coronary artery disease with type 2 diabetes mellitus. Int. J. Cardiol. 2013, 168, 1559–1560. [Google Scholar] [CrossRef]
- McNicoll, L.; Pisani, M.A.; Zhang, Y.; Ely, E.W.; Siegel, M.D.; Inouye, S.K. Delirium in the intensive care unit: Occurrence and clinical course in older patients. J. Am. Geriatr. Soc. 2003, 51, 591–598. [Google Scholar] [CrossRef] [PubMed]
- Pisani, M.A.; Murphy, T.E.; Van Ness, P.H.; Araujo, K.L.; Inouye, S.K. Characteristics associated with delirium in older patients in a medical intensive care unit. Arch. Intern. Med. 2007, 167, 1629–1634. [Google Scholar] [CrossRef] [Green Version]
- Maroso, M.; Balosso, S.; Ravizza, T.; Liu, J.; Aronica, E.; Iyer, A.M.; Rossetti, C.; Molteni, M.; Casalgrandi, M.; Manfredi, A.A.; et al. Toll-like receptor 4 and high-mobility group box-1 are involved in ictogenesis and can be targeted to reduce seizures. Nat. Med. 2010, 16, 413–419. [Google Scholar] [CrossRef] [Green Version]
- Fu, L.; Liu, K.; Wake, H.; Teshigawara, K.; Yoshino, T.; Takahashi, H.; Mori, S.; Nishibori, M. Therapeutic effects of anti-HMGB1 monoclonal antibody on pilocarpine-induced status epilepticus in mice. Sci. Rep. 2017, 7, 1179. [Google Scholar] [CrossRef] [Green Version]
- Sasaki, T.; Liu, K.; Agari, T.; Yasuhara, T.; Morimoto, J.; Okazaki, M.; Takeuchi, H.; Toyoshima, A.; Sasada, S.; Shinko, A.; et al. Anti-high mobility group box 1 antibody exerts neuroprotection in a rat model of Parkinson’s disease. Exp. Neurol. 2016, 275 Pt 1, 220–231. [Google Scholar] [CrossRef] [Green Version]
- Santoro, M.; Maetzler, W.; Stathakos, P.; Martin, H.L.; Hobert, M.A.; Rattay, T.W.; Gasser, T.; Forrester, J.V.; Berg, D.; Tracey, K.J.; et al. In-vivo evidence that high mobility group box 1 exerts deleterious effects in the 1-methyl-4-phenyl-1,2,3,6-tetrahydropyridine model and Parkinson’s disease which can be attenuated by glycyrrhizin. Neurobiol. Dis. 2016, 91, 59–68. [Google Scholar] [PubMed] [Green Version]
- Andersson, U.; Wang, H.; Palmblad, K.; Aveberger, A.C.; Bloom, O.; Erlandsson-Harris, H.; Janson, A.; Kokkola, R.; Zhang, M.; Yang, H.; et al. High mobility group 1 protein (HMG-1) stimulates proinflammatory cytokine synthesis in human monocytes. J. Exp. Med. 2000, 192, 565–570. [Google Scholar] [CrossRef]
- Palmblad, K.; Sundberg, E.; Diez, M.; Söderling, R.; Aveberger, A.C.; Andersson, U.; Harris, H.E. Morphological characterization of intra-articular HMGB1 expression during the course of collagen-induced arthritis. Arthritis. Res. Ther. 2007, 9, R35. [Google Scholar] [CrossRef] [PubMed] [Green Version]
- Pullerits, R.; Jonsson, I.M.; Verdrengh, M.; Bokarewa, M.; Andersson, U.; Erlandsson-Harris, H.; Tarkowski, A. High mobility group box chromosomal protein 1, a DNA binding cytokine, induces arthritis. Arthritis Rheum. 2003, 48, 1693–1700. [Google Scholar] [CrossRef] [PubMed]
- Knaus, W.A.; Draper, E.A.; Wagner, D.P.; Zimmerman, J.E. APACHE II: A severity of disease classification system. Crit. Care Med. 1985, 13, 818–829. [Google Scholar] [CrossRef]
- Vincent, J.L.; Moreno, R.; Takala, J.; Willatts, S.; De Mendonça, A.; Bruining, H.; Reinhart, C.K.; Suter, P.M.; Thijs, L.G. The SOFA (Sepsis-related Organ Failure Assessment) score to describe organ dysfunction/failure. On behalf of the Working Group on Sepsis-Related Problems of the European Society of Intensive Care Medicine. Intensive Care Med. 1996, 22, 707–710. [Google Scholar] [CrossRef] [PubMed]
- Charoensup, J.; Sermswan, R.W.; Paeyao, A.; Promakhejohn, S.; Punasee, S.; Chularari, C.; Krabkraikaew, S.; Lertanekawattana, S.; Wongratanacheewin, S. High HMGB1 level is associated with poor outcome of septicemic melioidosis. Int. J. Infect. Dis. 2014, 28, 111–116. [Google Scholar] [CrossRef] [PubMed] [Green Version]
- Gibot, S.; Massin, F.; Cravoisy, A.; Barraud, D.; Nace, L.; Levy, B.; Bollaert, P.E. High-mobility group box 1 protein plasma concentrations during septic shock. Intensive Care Med. 2007, 33, 1347–1353. [Google Scholar] [CrossRef]
- Freedberg, D.E.; Zhou, M.J.; Cohen, M.E.; Annavajhala, M.K.; Khan, S.; Moscoso, D.I.; Brooks, C.; Whittier, S.; Chong, D.H.; Uhlemann, A.C.; et al. Pathogen colonization of the gastrointestinal microbiome at intensive care unit admission and risk for subsequent death or infection. Intensive Care Med. 2018, 44, 1203–1211. [Google Scholar] [CrossRef] [PubMed]
- Dahlberg, D.; Mariussen, E.; Goverud, I.L.; Tønjum, T.; Mæhlen, J.; Antal, E.A.; Hassel, B. Staphylococcal α-hemolysin is neurotoxic and causes lysis of brain cells in vivo and in vitro. Neurotoxicology 2015, 48, 61–67. [Google Scholar] [CrossRef] [PubMed]
- Sonneville, R.; Mirabel, M.; Hajage, D.; Tubach, F.; Vignon, P.; Perez, P.; Lavoué, S.; Kouatchet, A.; Pajot, O.; Mekontso Dessap, A.; et al. Neurologic complications and outcomes of infective endocarditis in critically ill patients: The ENDOcardite en REAnimation prospective multicenter study. Crit. Care Med. 2011, 39, 1474–1481. [Google Scholar] [CrossRef] [PubMed]
- Kelly, J.R.; Minuto, C.; Cryan, J.F.; Clarke, G.; Dinan, T.G. Cross Talk: The Microbiota and Neurodevelopmental Disorders. Front. Neurosci. 2017, 11, 490. [Google Scholar] [CrossRef] [Green Version]
- Xu, X.; Hu, Y.; Yan, E.; Zhan, G.; Liu, C.; Yang, C. Perioperative neurocognitive dysfunction: Thinking from the gut? Aging 2020, 12, 15797–15817. [Google Scholar] [CrossRef]
- Tang, W.; Meng, Z.; Li, N.; Liu, Y.; Li, L.; Chen, D.; Yang, Y. Roles of Gut Microbiota in the Regulation of Hippocampal Plasticity, Inflammation, and Hippocampus-Dependent Behaviors. Front. Cell Infect. Microbiol. 2020, 10, 611014. [Google Scholar]
- Iacobone, E.; Bailly-Salin, J.; Polito, A.; Friedman, D.; Stevens, R.D.; Sharshar, T. Sepsis-associated encephalopathy and its differential diagnosis. Crit. Care Med. 2009, 37, S331–S336. [Google Scholar] [CrossRef] [PubMed]
- Gilmore, E.J.; Gaspard, N.; Choi, H.A.; Cohen, E.; Burkart, K.M.; Chong, D.H.; Claassen, J.; Hirsch, L.J. Acute brain failure in severe sepsis: A prospective study in the medical intensive care unit utilizing continuous EEG monitoring. Intensive Care Med. 2015, 41, 686–694. [Google Scholar] [CrossRef]
- Hughes, C.G.; Patel, M.B.; Pandharipande, P.P. Pathophysiology of acute brain dysfunction: What’s the cause of all this confusion? Curr. Opin. Crit. Care 2012, 18, 518–526. [Google Scholar] [CrossRef] [PubMed]
- Nielsen, R.M.; Urdanibia-Centelles, O.; Vedel-Larsen, E.; Thomsen, K.J.; Møller, K.; Olsen, K.S.; Lauritsen, A.; Eddelien, H.S.; Lauritzen, M.; Benedek, K. Continuous EEG Monitoring in a Consecutive Patient Cohort with Sepsis and Delirium. Neurocrit. Care 2020, 32, 121–130. [Google Scholar] [CrossRef]
- Azabou, E.; Magalhaes, E.; Braconnier, A.; Yahiaoui, L.; Moneger, G.; Heming, N.; Annane, D.; Mantz, J.; Chrétien, F.; Durand, M.C.; et al. Early Standard Electroencephalogram Abnormalities Predict Mortality in Septic Intensive Care Unit Patients. PLoS ONE 2015, 10, e0139969. [Google Scholar] [CrossRef] [PubMed]
- Crippa, I.A.; Subirà, C.; Vincent, J.L.; Fernandez, R.F.; Hernandez, S.C.; Cavicchi, F.Z.; Creteur, J.; Taccone, F.S. Impaired cerebral autoregulation is associated with brain dysfunction in patients with sepsis. Crit. Care 2018, 22, 327. [Google Scholar] [PubMed] [Green Version]
- Schramm, P.; Klein, K.U.; Falkenberg, L.; Berres, M.; Closhen, D.; Werhahn, K.J.; David, M.; Werner, C.; Engelhard, K. Impaired cerebrovascular autoregulation in patients with severe sepsis and sepsis-associated delirium. Crit. Care 2012, 16, R181. [Google Scholar] [CrossRef] [Green Version]
- Molnár, L.; Fülesdi, B.; Németh, N.; Molnár, C. Sepsis-associated encephalopathy: A review of literature. Neurol. India 2018, 66, 352–361. [Google Scholar] [CrossRef] [PubMed] [Green Version]
- Pandharipande, P.P.; Sanders, R.D.; Girard, T.D.; McGrane, S.; Thompson, J.L.; Shintani, A.K.; Herr, D.L.; Maze, M.; Ely, E.W. Effect of dexmedetomidine versus lorazepam on outcome in patients with sepsis: An a priori-designed analysis of the MENDS randomized controlled trial. Crit. Care 2010, 14, R38. [Google Scholar] [CrossRef] [Green Version]
- Shehabi, Y.; Serpa Neto, A.; Howe, B.D.; Bellomo, R.; Arabi, Y.M.; Bailey, M.; Bass, F.E.; Kadiman, S.B.; McArthur, C.J.; Reade, M.C.; et al. Early sedation with dexmedetomidine in ventilated critically ill patients and heterogeneity of treatment effect in the SPICE III randomised controlled trial. Intensive Care Med. 2021, 47, 455–466. [Google Scholar] [CrossRef] [PubMed]
- Chang, Y.; Huang, X.; Liu, Z.; Han, G.; Huang, L.; Xiong, Y.C.; Wang, Z. Dexmedetomidine inhibits the secretion of high mobility group box 1 from lipopolysaccharide-activated macrophages in vitro. J. Surg. Res. 2013, 181, 308–314. [Google Scholar] [CrossRef]
- Shehabi, Y.; Howe, B.D.; Bellomo, R.; Arabi, Y.M.; Bailey, M.; Bass, F.E.; Bin Kadiman, S.; McArthur, C.J.; Murray, L.; Reade, M.C.; et al. Early Sedation with Dexmedetomidine in Critically Ill Patients. N. Engl. J. Med. 2019, 380, 2506–2517. [Google Scholar] [CrossRef] [PubMed]
- Devlin, J.W.; Skrobik, Y.; Gélinas, C.; Needham, D.M.; Slooter, A.J.C.; Pandharipande, P.P.; Watson, P.L.; Weinhouse, G.L.; Nunnally, M.E.; Rochwerg, B.; et al. Clinical Practice Guidelines for the Prevention and Management of Pain, Agitation/Sedation, Delirium, Immobility, and Sleep Disruption in Adult Patients in the ICU. Crit. Care Med. 2018, 46, e825–e873. [Google Scholar] [CrossRef] [PubMed] [Green Version]


| Patient Characteristics at ICU Admission | |||
|---|---|---|---|
| Severity scores | |||
| Research article | Score | Incidence of SAE/Distribution of SAE and non-SAE | Mortality of SAE |
| Zhang L et al. (2012) [96] Retrospective analysis (SAE n = 41, non-SAE n = 191) | APACHE-II | Mean score 22 ± 7 SAE vs. 17 ± 7 non-SAE (p-value = 0.000) | n/a |
| Sonneville R et al. (2017) [37] Retrospective analysis (SAE n = 1341, non-SAE n = 1172) | Modified SOFA (non-neurological SOFA) | Median score 7 (IQR 5–10) SAE vs. 6 (IQR 3–8) non-SAE (p-value < 0.01) | HR 1.10 (95% CI: 1.08–1.12; p-value < 0.01) Per 1-point increment |
| Renal SOFA >2 | OR 1.41 (95% CI: 1.19–1.67; p-value < 0.01) 62.6% SAE vs. 50.4% non-SAE (p-value < 0.01) | n/a | |
| Respiration SOFA >2 | 69.7% SAE vs. 58.3% non-SAE (p-value < 0.01) | n/a | |
| Liver SOFA >2 | 28.5% SAE vs. 23.4% non-SAE (p-value < 0.01) | n/a | |
| Feng Q et al. (2019) [97] Retrospective analysis (SAE n = 74, non-SAE n = 101) | APACHE-II | Mean score 19 ± 6 SAE vs. 13 ± 6 non-SAE (p-value < 0.001) | n/a |
| SOFA | Mean score 11 ± 4 SAE vs. 8 ± 5 non-SAE (p-value < 0.001) | n/a | |
| Chen J et al. (2020) [92] Retrospective analysis (SAE n = 127, non-SAE n = 164) | APACHE-II | OR 1.239 (95% CI: 1.144–1.341; p-value < 0.001) Median score 15 (IQR 12–19.5) SAE vs. 9 (IQR 6–11) non-SAE (p-value < 0.01) | OR 1.178 (95% CI: 1.063–1.305; p-value < 0.01) Per 1-point increment (28-day mortality) |
| SOFA | OR 1.421 (95% CI: 1.244–1.623; p-value < 0.001) Median score 7 (IQR 5–10) SAE vs. 3 (IQR 1–5) non-SAE (p-value < 0.01) | OR 1.167 (95% CI: 1.009–1.349; p-value = 0.037) Per 1-point increment (28-day mortality) | |
| Jin G et al. (2022) [89] Retrospective analysis (SAE n = 132, non-SAE n = 90) | SOFA | Median score 10 (IQR 6–13) SAE vs. 4 (IQR 2–7) non-SAE (p-value < 0.001) | OR 1.185 (95% CI: 1.074–1.307; p-value < 0.001) |
| APACHE-II | Median score 23 (IQR 15–13) SAE vs. 12 (IQR 9–17) non-SAE (p-value < 0.001) | n/a | |
| Lei W et al. (2022) [91] Prospective longitudinal study (SAE n = 17, non-SAE n = 11) | APACHE-II | Median score 24 (IQR 18–28) SAE vs. 15 (IQR 12–20) non-SAE (p-value = 0.005) | n/a |
| Lu X et al. (2022) [90] Retrospective analysis (SAE n = 4684, non-SAE n = 4251) | SOFA | Mean score 5.58 ± 2.71 SAE vs. 4.27 ± 2.15 non-SAE (p-value < 0.001) | n/a |
| Site of infection and identified pathogen | |||
| Research article | Site/type of infection | Incidence of SAE/Distribution of SAE and non-SAE | |
| Zhang L et al. (2012) [96] Retrospective analysis (SAE n = 41, non-SAE n = 191) | Biliary tract | 24.39% SAE vs. 12.57 non-SAE (p-value = 0.05) | |
| Intestines | 43.90% SAE vs. 27.23% non-SAE (p-value = 0.029) | ||
| Pulmonary | 41.46% SAE vs. 33.51% non-SAE (p-value = 0.214) | ||
| Skin and soft tissue | 19.51% SAE vs. 11.52% non-SAE (p-value = 0.131) | ||
| Sonneville R et al. (2017) [37] Retrospective analysis (SAE n = 1341, non-SAE n = 1172) | Intra-abdominal | 23.4% SAE vs. 27.8% non-SAE (p-value = 0.01) | |
| Pulmonary | 32% SAE vs. 24.6% non-SAE (p-value < 0.01) | ||
| Endocarditis | 2.2% SAE vs. 1% non-SAE (p-value = 0.02) | ||
| Skin and soft tissue | OR 0.57 (95% CI: 0.39–0.82; p-value < 0.01) 4.4% SAE vs. 7.3% non-SAE (p-value < 0.01) | ||
| Catheter-related | OR 0.53 (95% CI: 0.32–0.88; p-value = 0.01) 2.1% SAE vs. 4.4% non-SAE (p-value < 0.01) | ||
| Chen J et al. (2020) [92] Retrospective analysis (SAE n = 127, non-SAE n = 164) | Biliary tract | 6.3% SAE vs. 10.4% non-SAE (p-value = 0.22) | |
| Gastrointestinal tract | 26.8% SAE vs. 15.2% non-SAE (p-value = 0.015) | ||
| Pulmonary | 59.8% SAE vs. 50.6% non-SAE (p-value = 0.076) | ||
| Skin and soft tissue | 3.9% SAE vs. 6.1% non-SAE (p-value = 0.408) | ||
| Jin G et al. (2022) [89] Retrospective analysis (SAE n = 132, non-SAE n = 90) | Biliary tract | 9.1% SAE vs. 13.3% non-SAE (p-value = 0.318) | |
| Gastrointestinal tract | 7.6% SAE vs. 2.2% non-SAE (p-value = 0.129) | ||
| Intra-abdominal | 13.6% SAE vs. 17.8% non-SAE (p-value = 0.40) | ||
| Pulmonary | 78.8% SAE vs. 65.6% non-SAE (p-value = 0.028) | ||
| Skin and soft tissue | 3.0% SAE vs. 6.7% non-SAE (p-value = 0.20) | ||
| Research article | Identified pathogen | Incidence of SAE/Distribution of SAE and non-SAE | |
| Zhang L et al. (2012) [96] Retrospective analysis (SAE n = 41, non-SAE n = 191) | Acinetobacter | 39.02% SAE vs. 17.28% non-SAE (p-value = 0.005) | |
| P. aeruginosa | 24.39% SAE vs. 8.38% non-SAE (p-value = 0.011) | ||
| S. maltophila | 12.19% SAE vs. 1.05% non-SAE (p-value = 0.002) | ||
| S. aureus | 12.19% SAE vs. 3.14% non-SAE (p-value = 0.028) | ||
| E. faecium | 24.39% SAE vs. 9.42% non-SAE (p-value = 0.015) | ||
| E. coli | 26.83% SAE vs. 14.14% non-SAE (p-value = 0.061) | ||
| Sonneville R et al. (2017) [37] Retrospective analysis (SAE n = 1341, non-SAE n = 1172) | P. aeruginosa | 7.2% SAE vs. 6.1% non-SAE (p-value = 0.24) | |
| S. aureus | OR 1.54 (95% CI: 1.05–2.25; p-value = 0.03) 6.9% SAE vs. 4.4% non-SAE (p-value < 0.01) | ||
| Enterobacteriaceae | 28.3% SAE vs. 30.4 non-SAE (p-value = 0.26) | ||
| Feng Q et al. (2019) [97] Retrospective analysis (SAE n = 74, non-SAE n = 101) | Acinetobacter | 21.6% SAE vs. 12.87% non-SAE (p-value = 0.124) | |
| P. aeruginosa | 12.16% SAE vs. 3.96% non-SAE (p-value = 0.083) | ||
| S. aureus | 9.46% SAE vs. 7.92% non-SAE (p-value = 0.719) | ||
| E. coli | 35.14% SAE vs. 20.79% non-SAE (p-value = 0.031) | ||
| Chen J et al. (2020) [92] Retrospective analysis (SAE n = 127, non-SAE n = 164) | Acinetobacter | 21.3% SAE vs. 20.7% non-SAE (p-value = 0.913) | |
| Pseudomonas | 6.3% SAE vs. 6.1% non-SAE (p-value = 0.944) | ||
| Staphylococcus | 12.6% SAE vs. 11.6% non-SAE (p-value = 0.792) | ||
| Enterococcus | 16.5% SAE vs. 7.9% non-SAE (p-value = 0.023) | ||
| E. coli | 24.4% SAE vs. 21.9% non-SAE (p-value = 0.621) | ||
| Jin G et al. (2022) [89] Retrospective analysis (SAE n = 132, non-SAE n = 90) | A. baumannii | 30.3% SAE vs. 25.6% non-SAE (p-value = 0.441) | |
| P. aeruginosa | 10.6% SAE vs. 8.9% non-SAE (p-value = 0.674) | ||
| S. maltophila | 6.82% SAE vs. 5.6% non-SAE (p-value = 0.704) | ||
| Staphylococcus | 16.7% SAE vs. 14.4% non-SAE (p-value 0.656) | ||
| Enterococcus | 6.82% SAE vs. 8.9% non-SAE (p-value = 0.569) | ||
| E. coli | 10.6% SAE vs. 12.2% non-SAE (p-value = 0.708) | ||
Disclaimer/Publisher’s Note: The statements, opinions and data contained in all publications are solely those of the individual author(s) and contributor(s) and not of MDPI and/or the editor(s). MDPI and/or the editor(s) disclaim responsibility for any injury to people or property resulting from any ideas, methods, instructions or products referred to in the content. |
© 2023 by the authors. Licensee MDPI, Basel, Switzerland. This article is an open access article distributed under the terms and conditions of the Creative Commons Attribution (CC BY) license (https://creativecommons.org/licenses/by/4.0/).
Share and Cite
DeWulf, B.; Minsart, L.; Verdonk, F.; Kruys, V.; Piagnerelli, M.; Maze, M.; Saxena, S. High Mobility Group Box 1 (HMGB1): Potential Target in Sepsis-Associated Encephalopathy. Cells 2023, 12, 1088. https://doi.org/10.3390/cells12071088
DeWulf B, Minsart L, Verdonk F, Kruys V, Piagnerelli M, Maze M, Saxena S. High Mobility Group Box 1 (HMGB1): Potential Target in Sepsis-Associated Encephalopathy. Cells. 2023; 12(7):1088. https://doi.org/10.3390/cells12071088
Chicago/Turabian StyleDeWulf, Bram, Laurens Minsart, Franck Verdonk, Véronique Kruys, Michael Piagnerelli, Mervyn Maze, and Sarah Saxena. 2023. "High Mobility Group Box 1 (HMGB1): Potential Target in Sepsis-Associated Encephalopathy" Cells 12, no. 7: 1088. https://doi.org/10.3390/cells12071088