

Inhibition of LRRK2 Attenuates Depression-Related Symptoms in Mice with Moderate Traumatic Brain Injury
 , and
, and 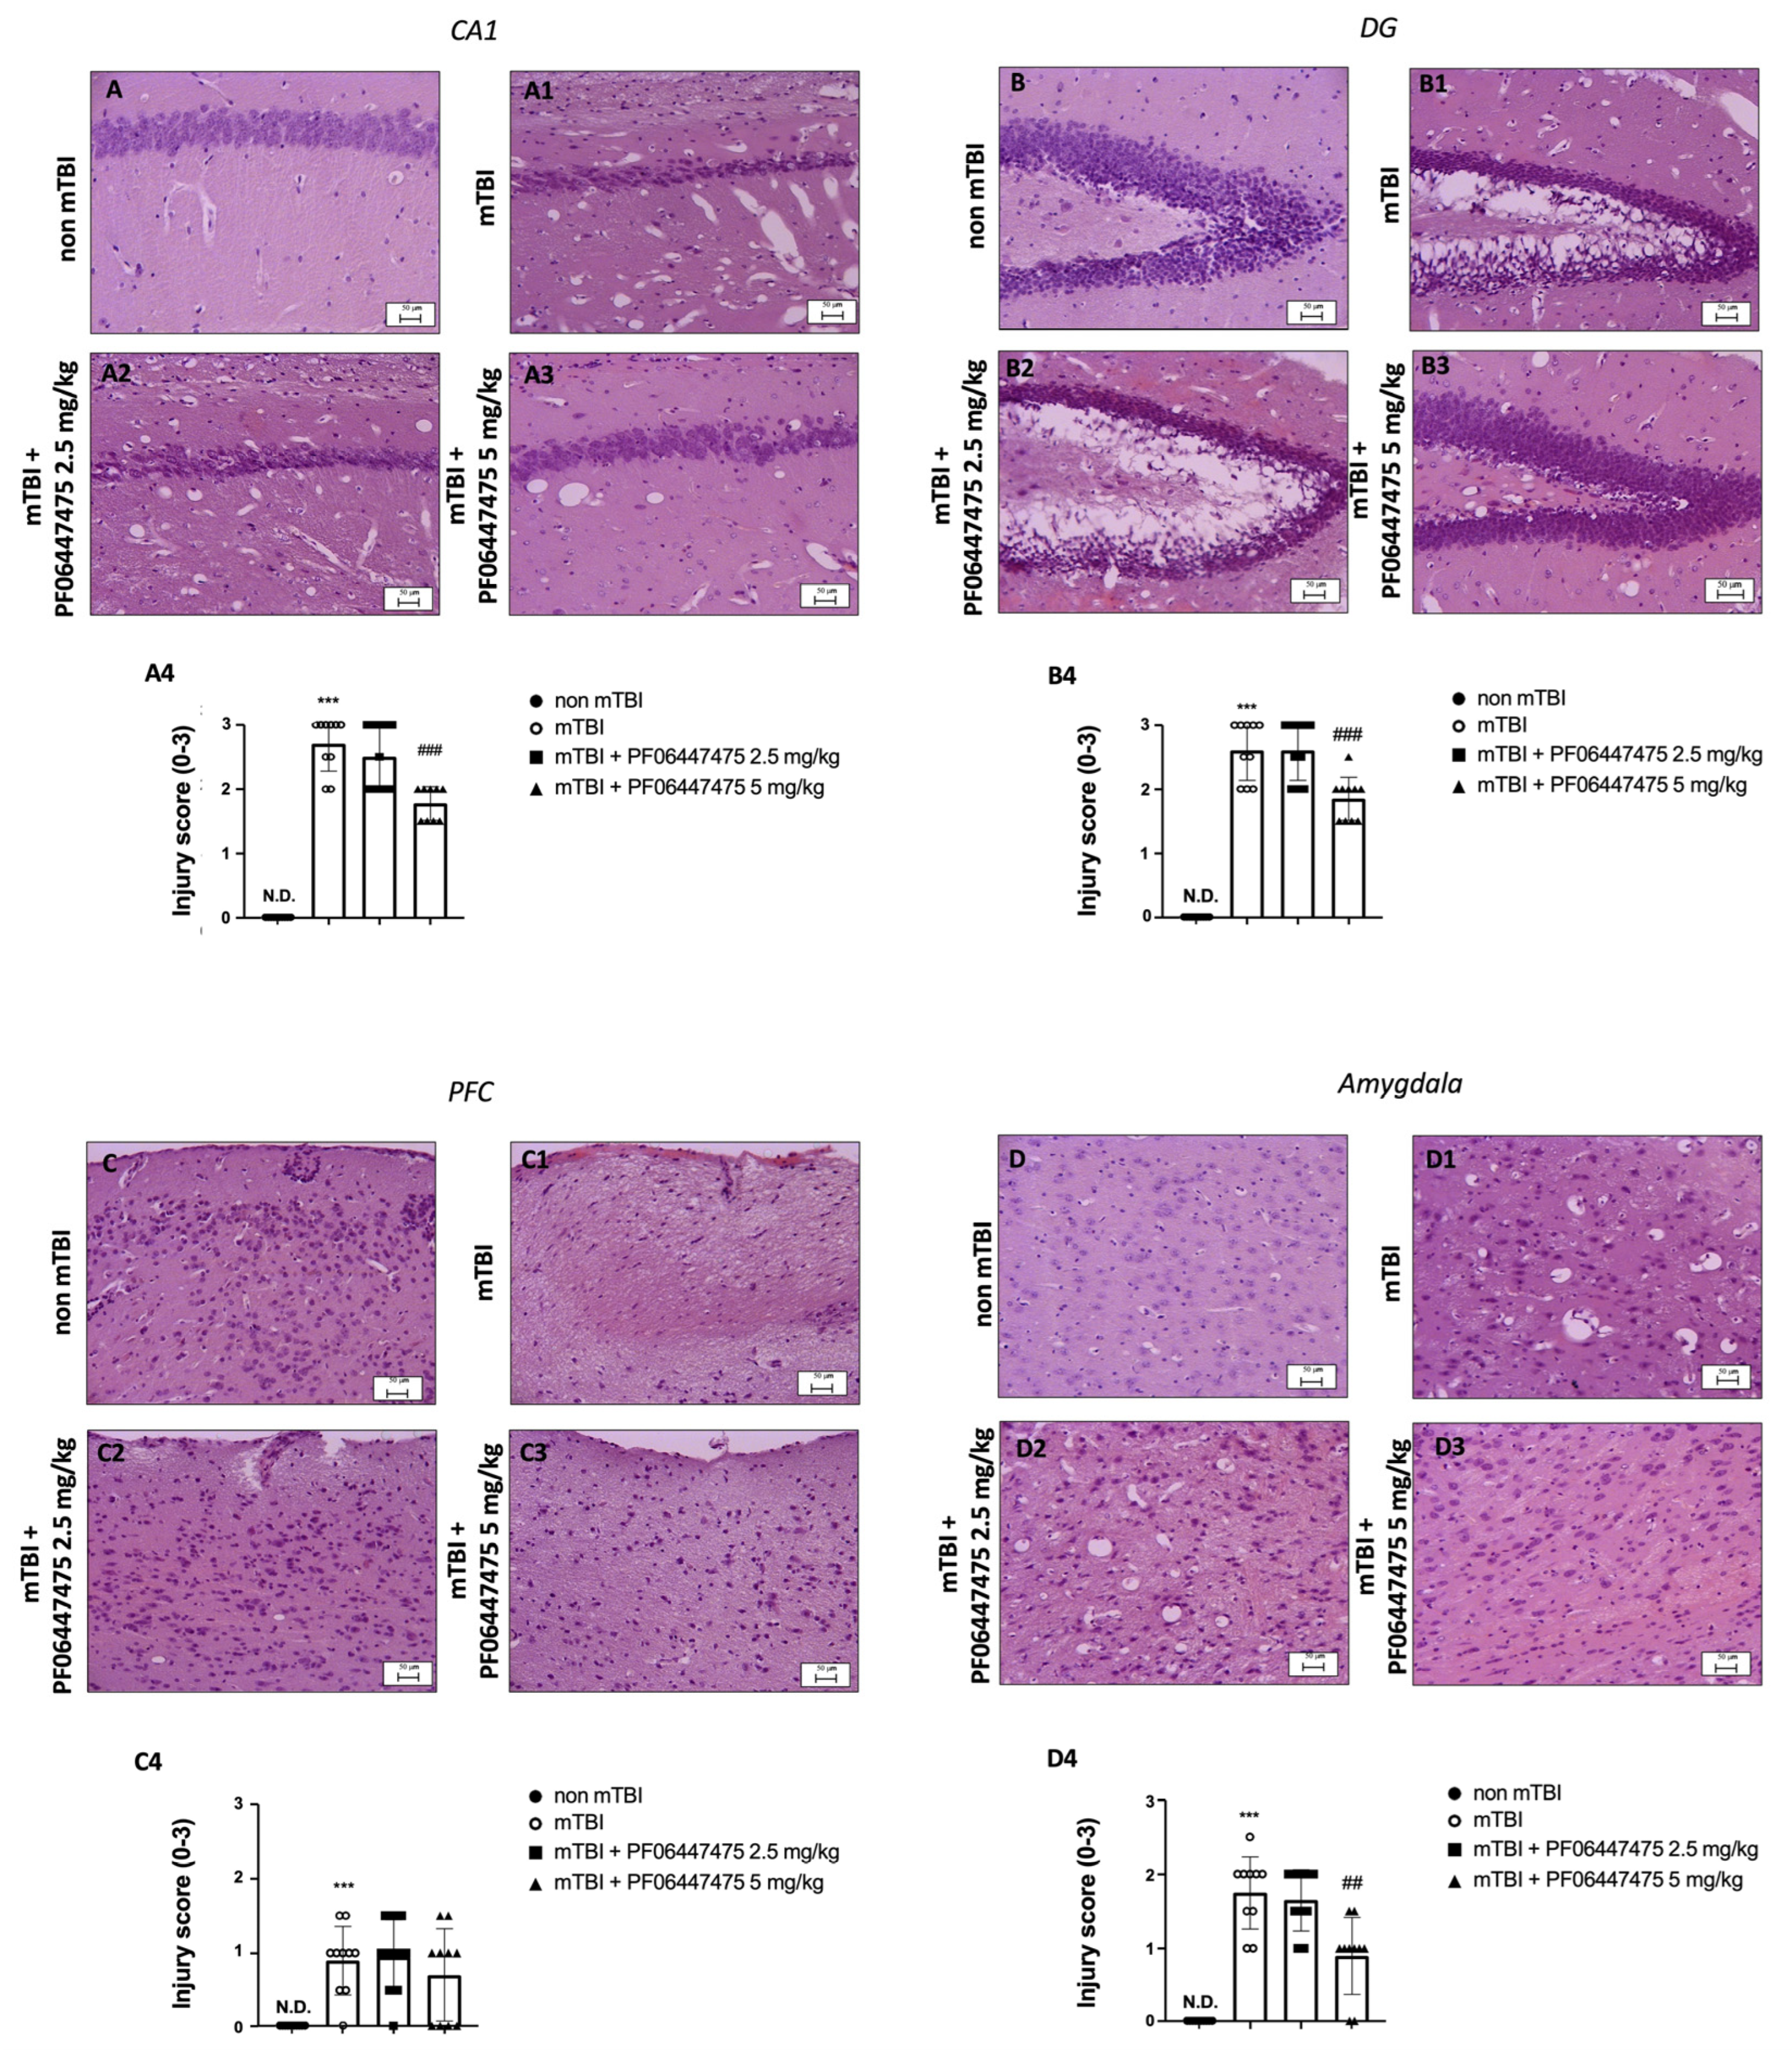
Abstract
:1. Introduction
2. Materials and Methods
2.1. Materials
2.2. Animals
2.3. Controlled Cortical Impact (CCI) Experimental TBI
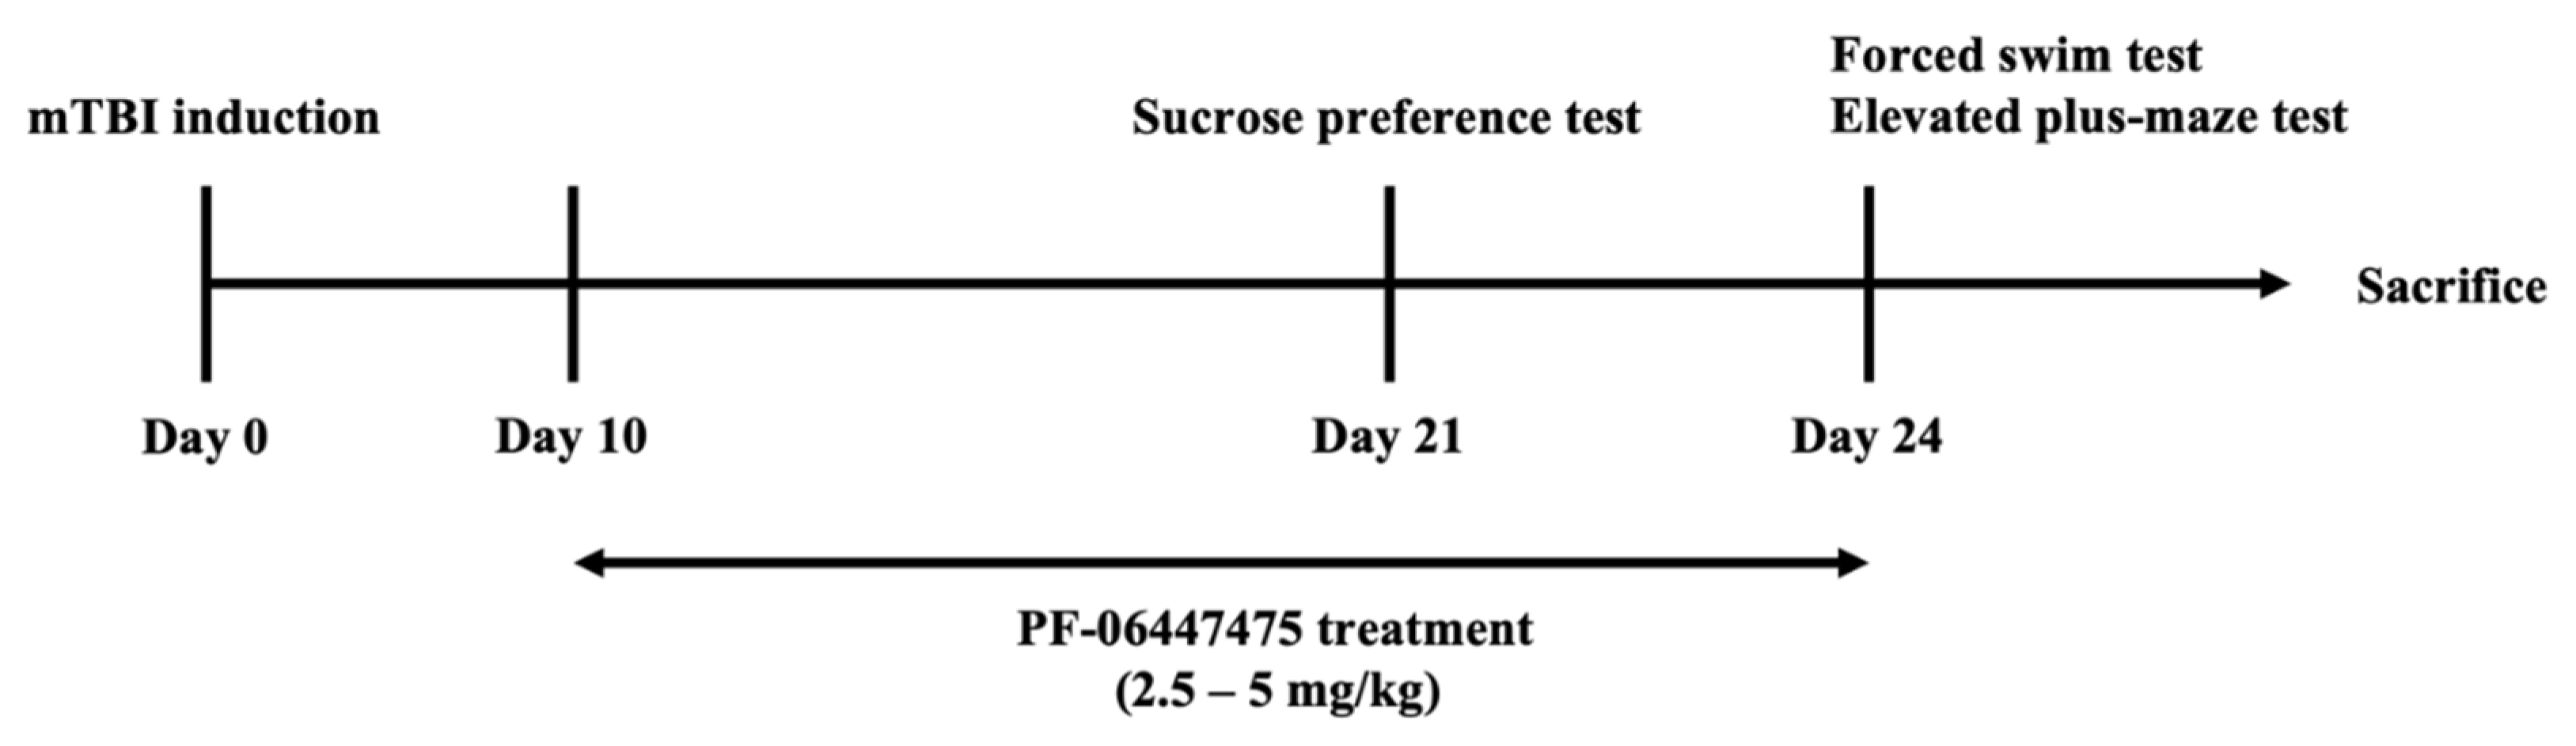
2.4. Experimental Design
- -
- Non-moderate TBI: mice were subjected to identical surgical procedures except for CCI and were kept under anesthesia for the duration of the experiment;
- -
- Moderate TBI group: mice were subjected to CCI (n = 10) and were kept under anesthesia for the duration of the experiment;
- -
- Moderate TBI + PF-475 (dose of 1 mg/kg) group: mice were subjected to CCI and subsequently treated with PF-475, i.p. administration for 14 days, 10 days after mTBI;
- -
- Moderate TBI + PF-475 (dose of 2.5 mg/kg) group: mice were subjected to CCI and subsequently treated with PF-475, i.p. administration for 14 days, 10 days after mTBI;
- -
- Moderate TBI + PF-475 (dose of 5 mg/kg) group: mice were subjected to CCI and subsequently treated with PF-475, i.p. administration for 14 days, 10 days after mTBI.
2.5. Behavioral Tests
2.5.1. Sucrose Preference Test (SPT)
2.5.2. Forced Swim Test (FST)
2.5.3. Elevated Plus-Maze (EPM) Test
2.6. Histological Evaluation
2.7. Copper Staining
2.8. Immunohistochemistry Analysis of NMDAR2B
2.9. Enzyme-Linked Immunosorbent Assay (ELISA Kit)
2.10. Western Blot Analysis of Iba-1, GFAP, CTR1, ATP7A and ATP7B
2.11. Statistical Analysis
3. Results
3.1. PF-06447475 Administration Reduced Brain Tissue Damage after TBI-Induced
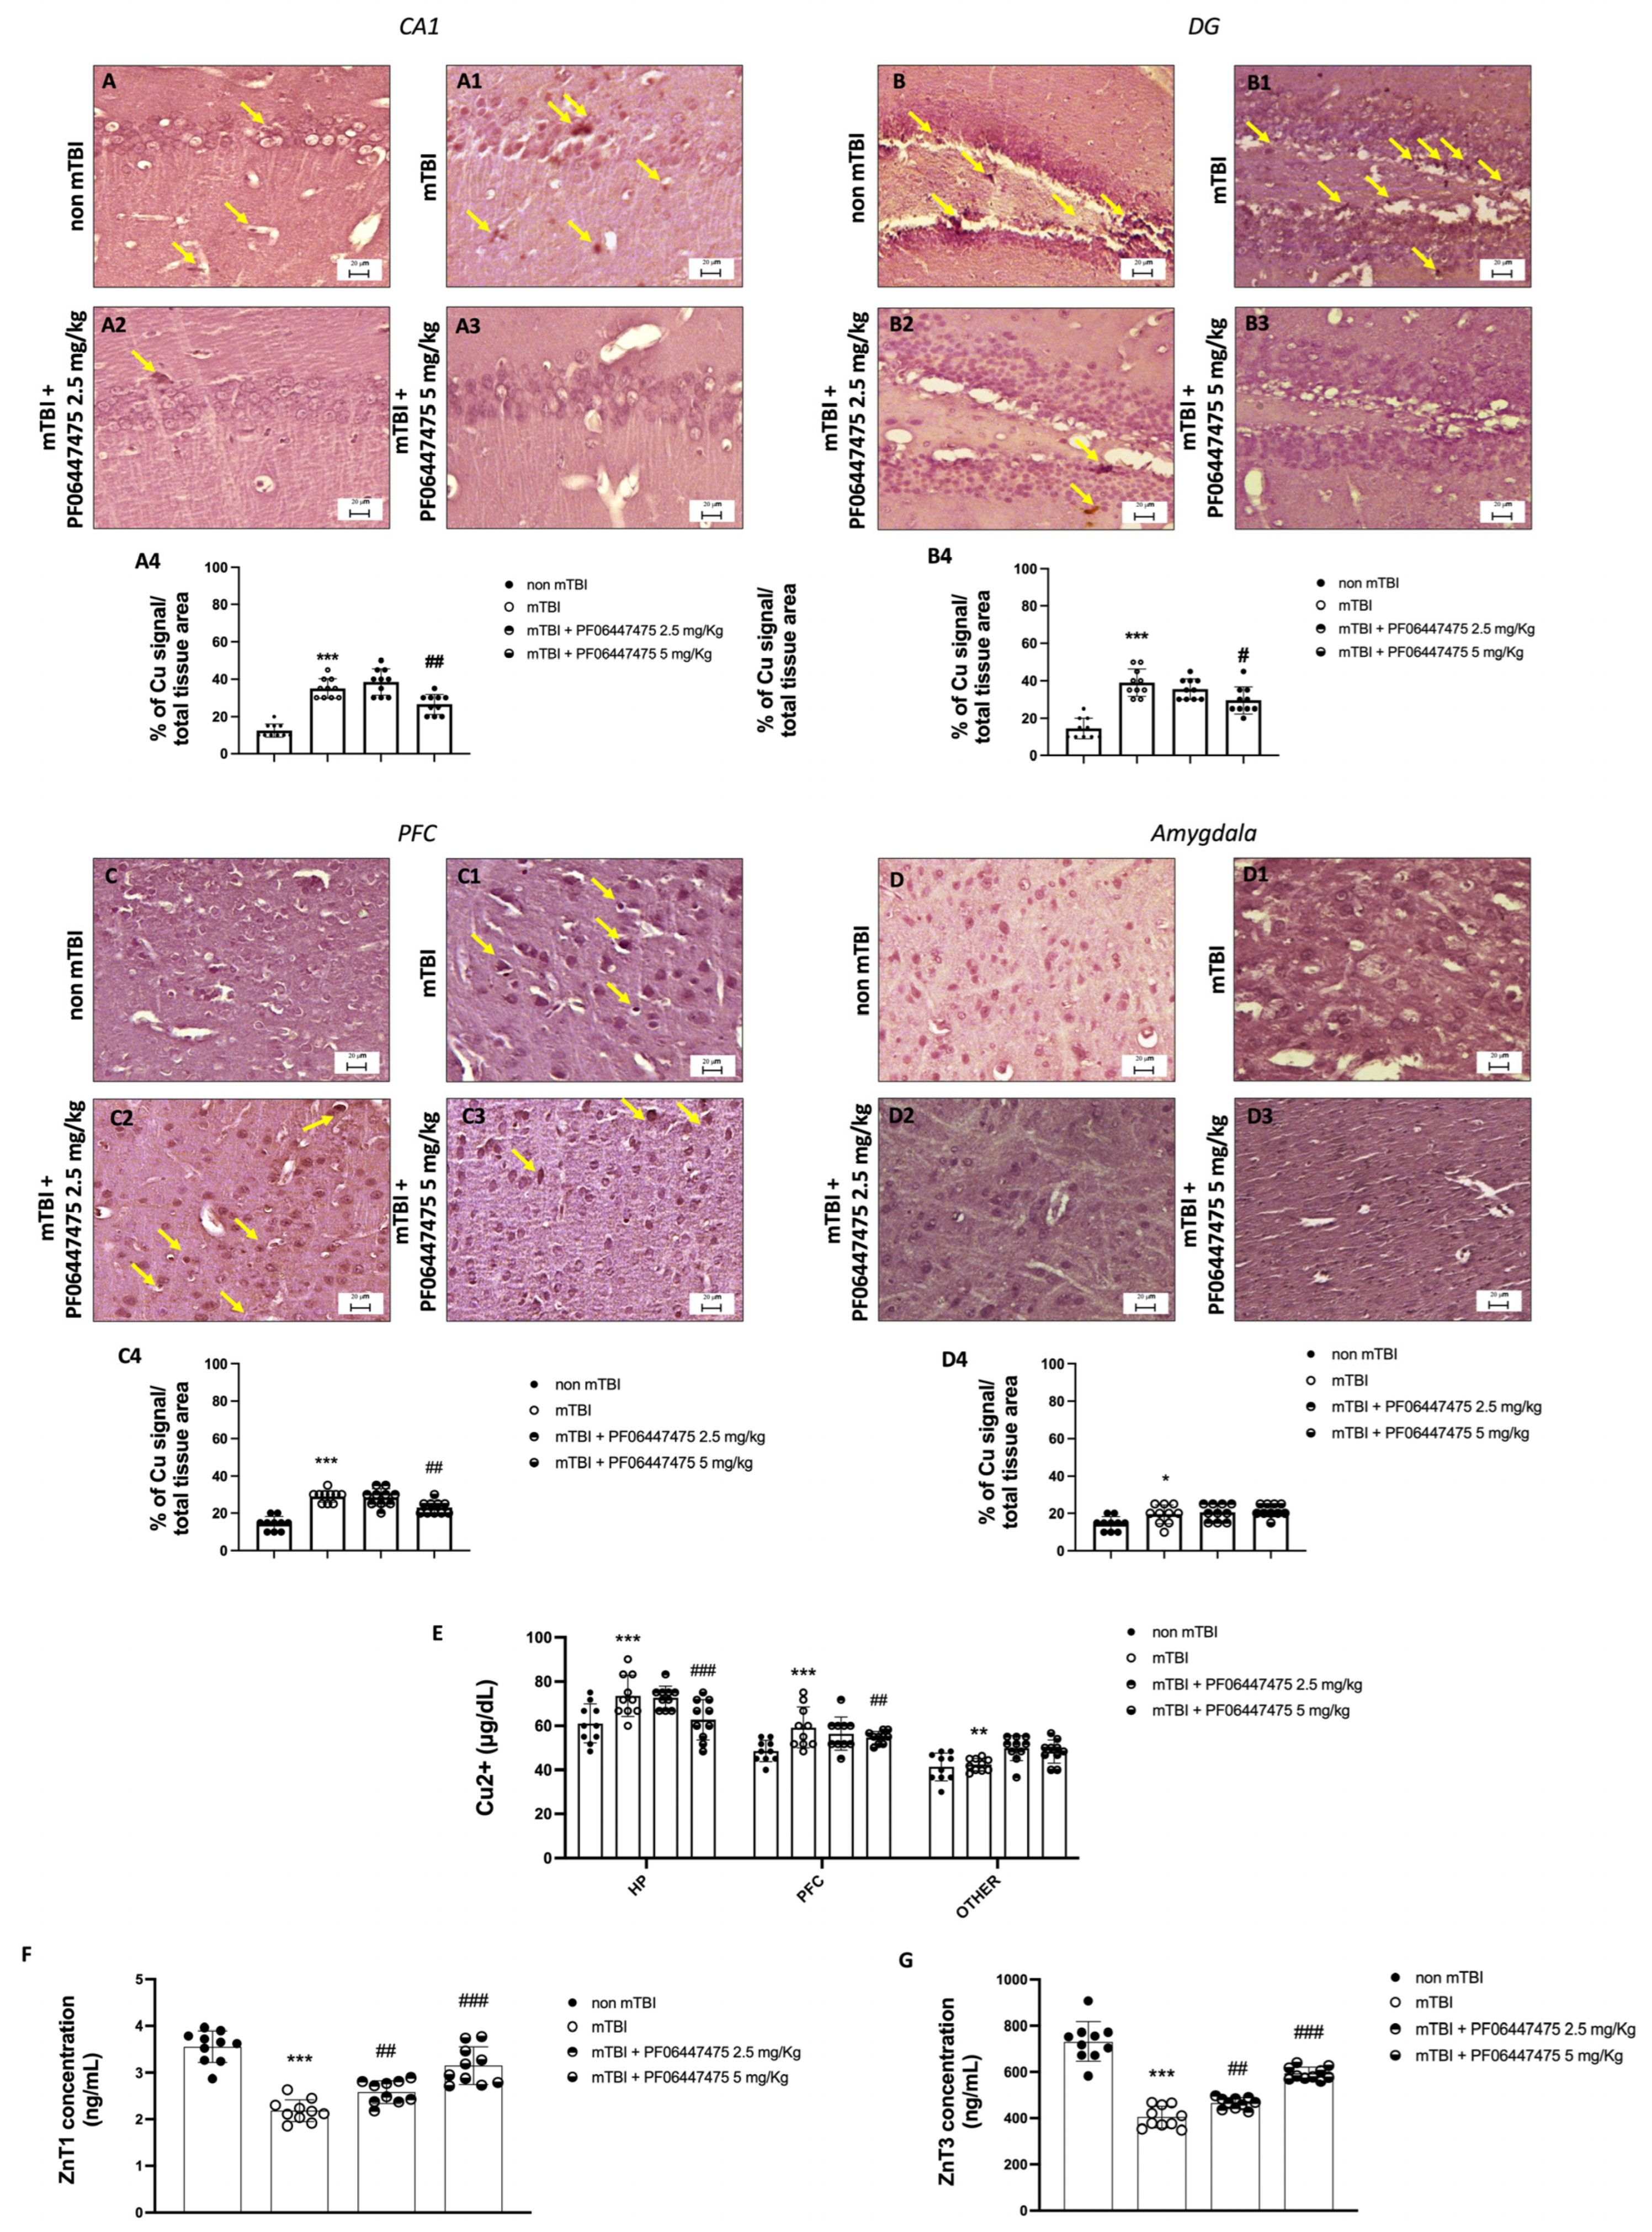
3.2. Treatments with PF-06447475 Restored Copper and Zinc Homeostasis following mTBI
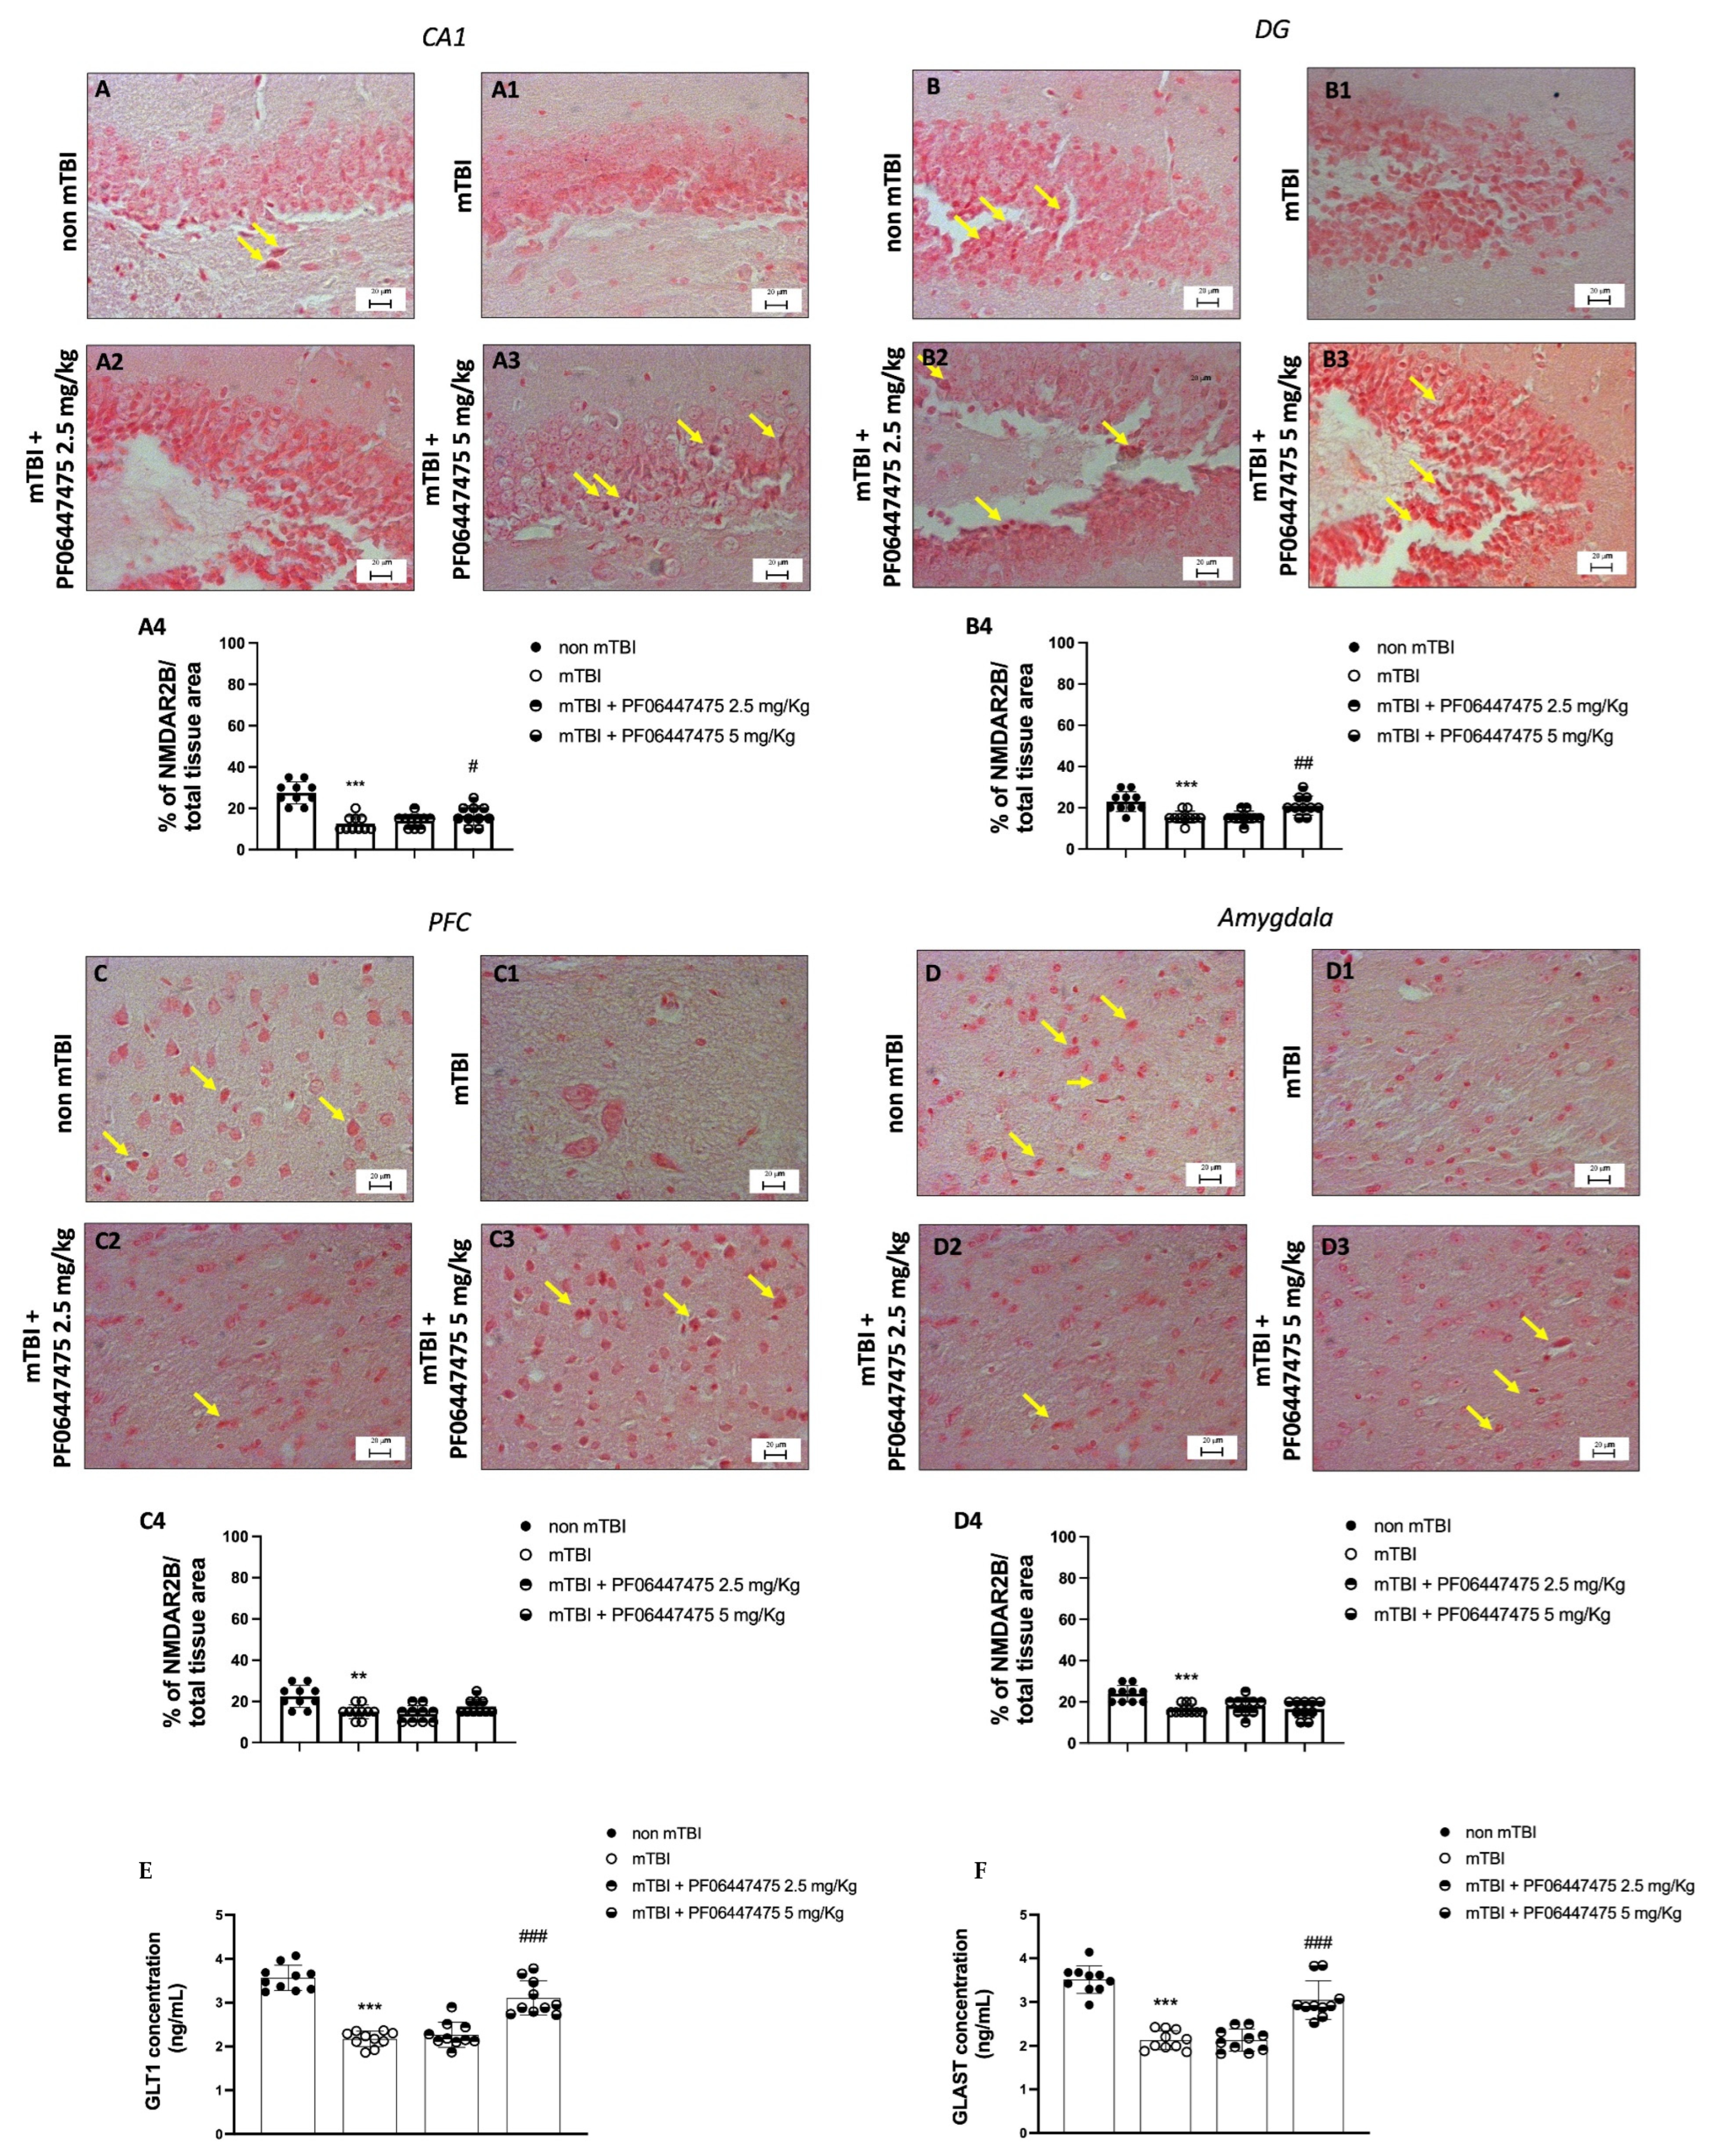
3.3. PF-06447475 Treatments Antagonized NMDA Receptor Depletion after mTBI Induction
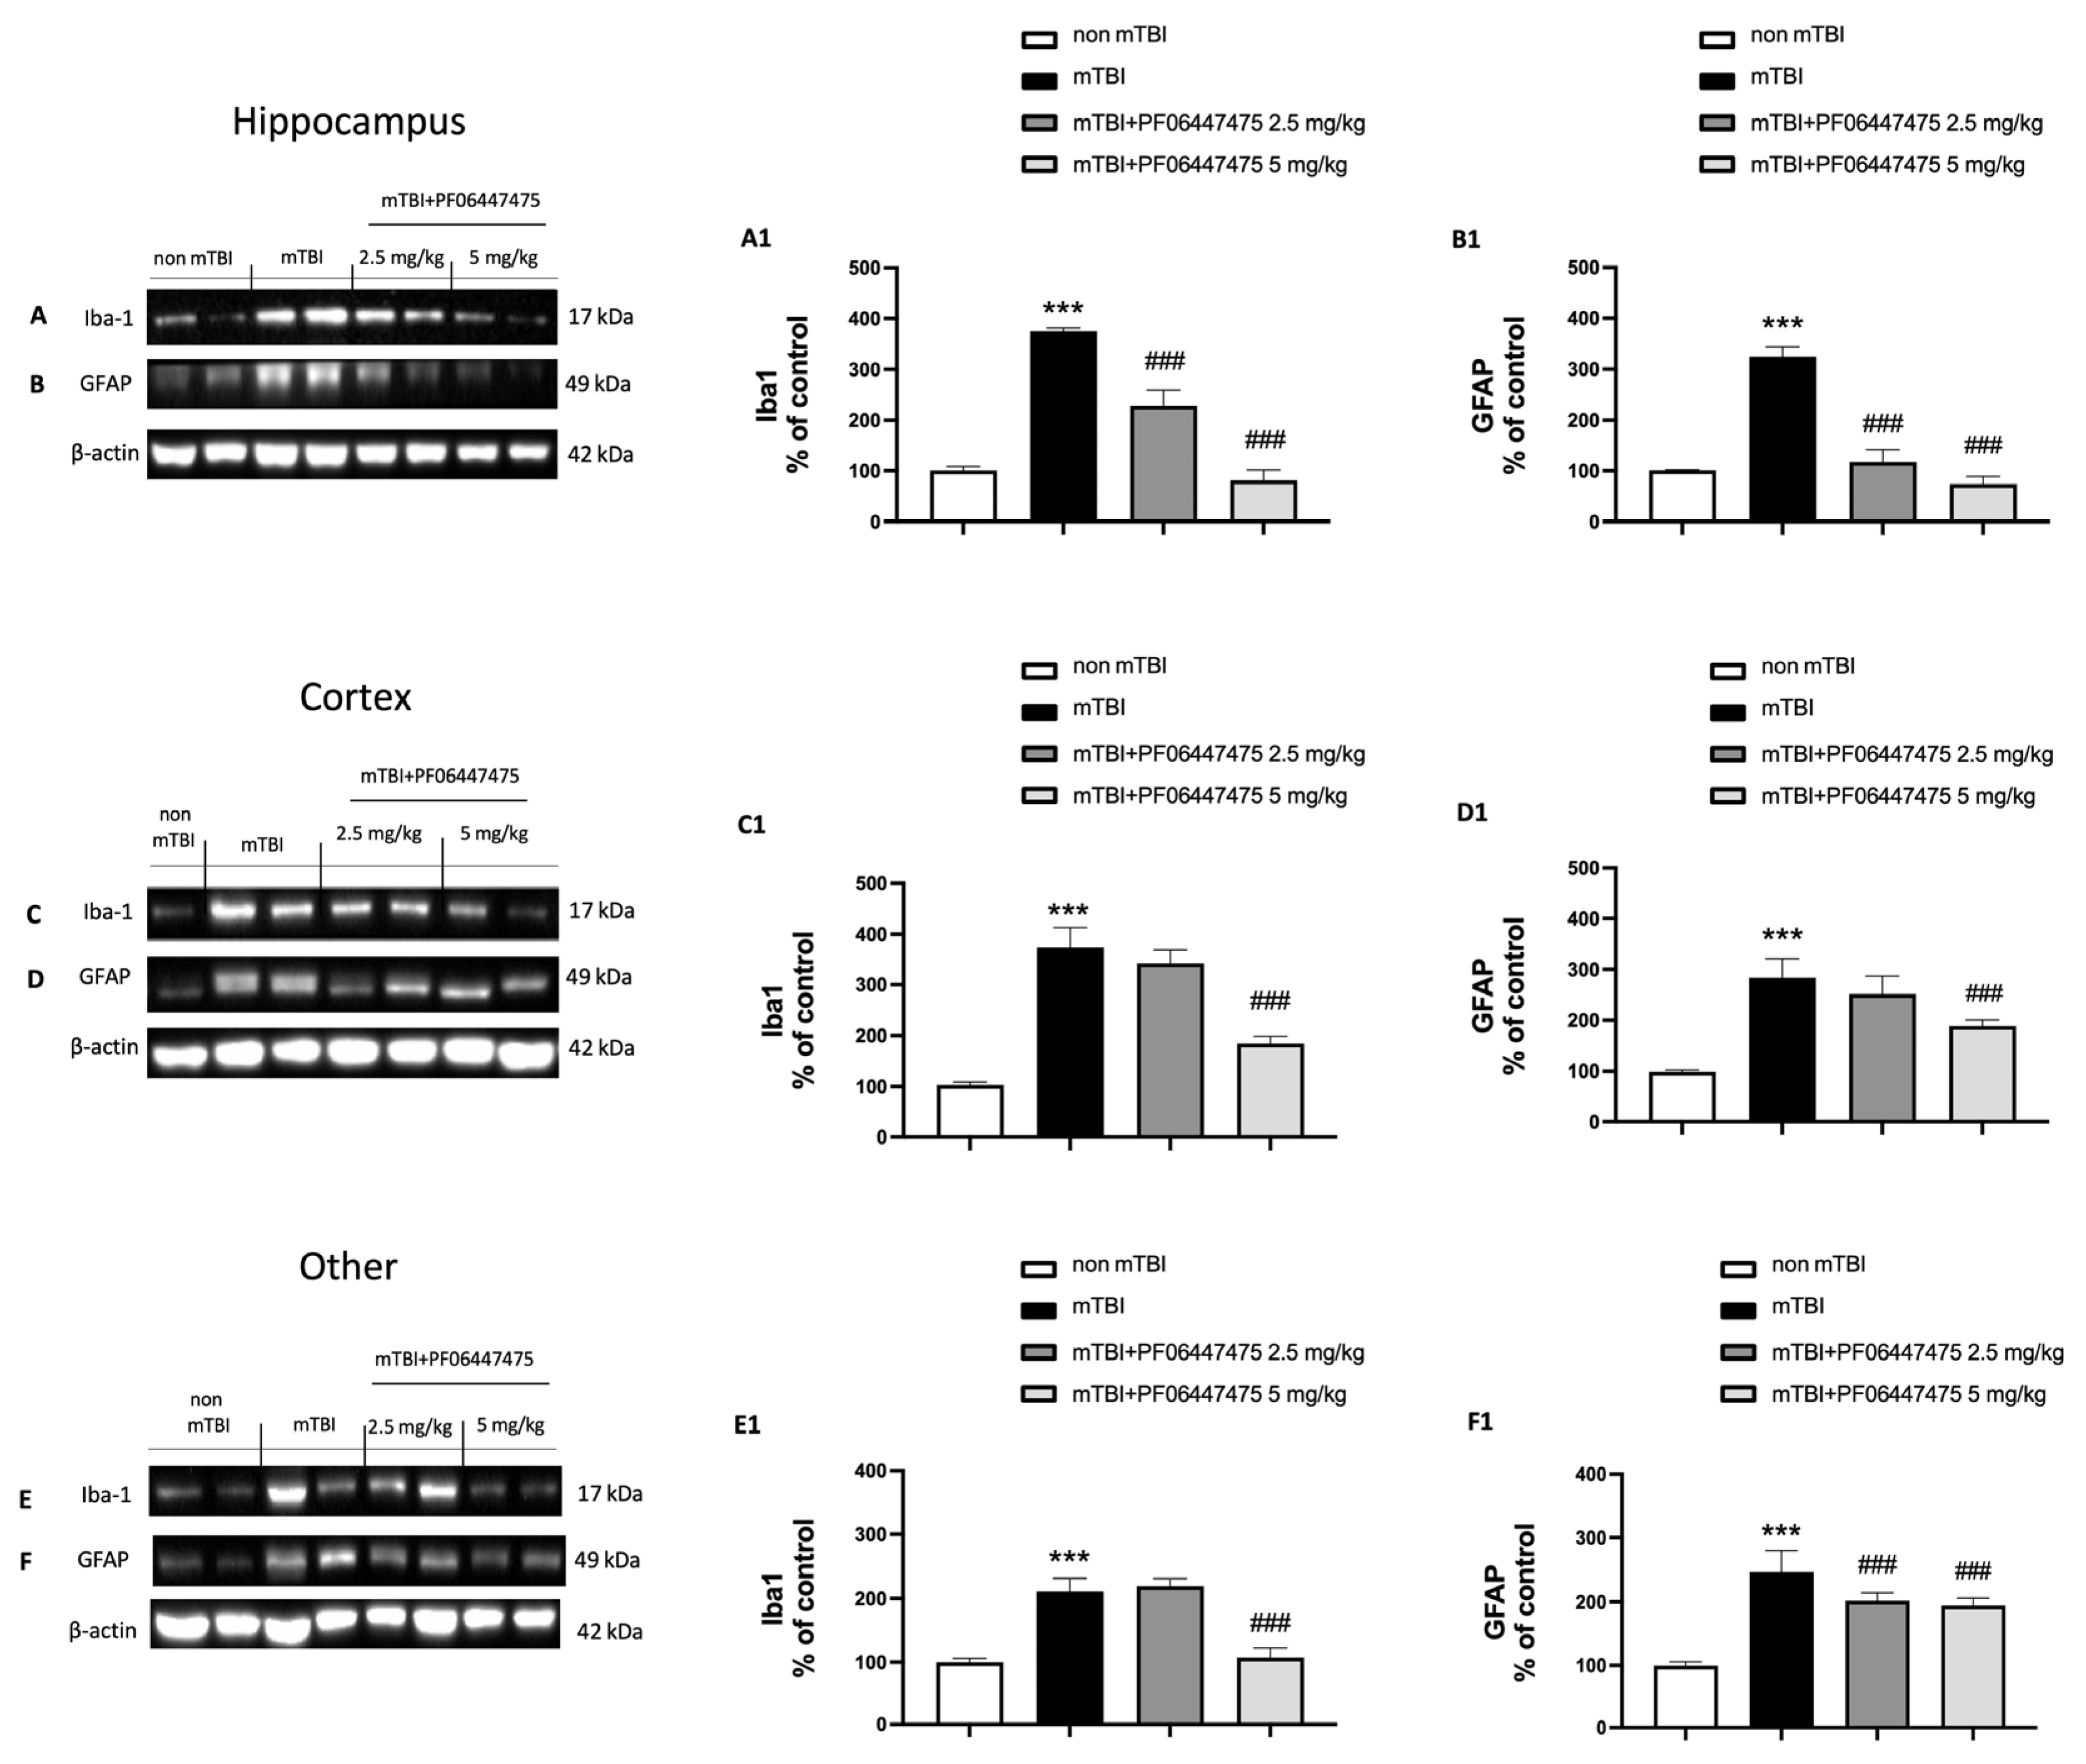
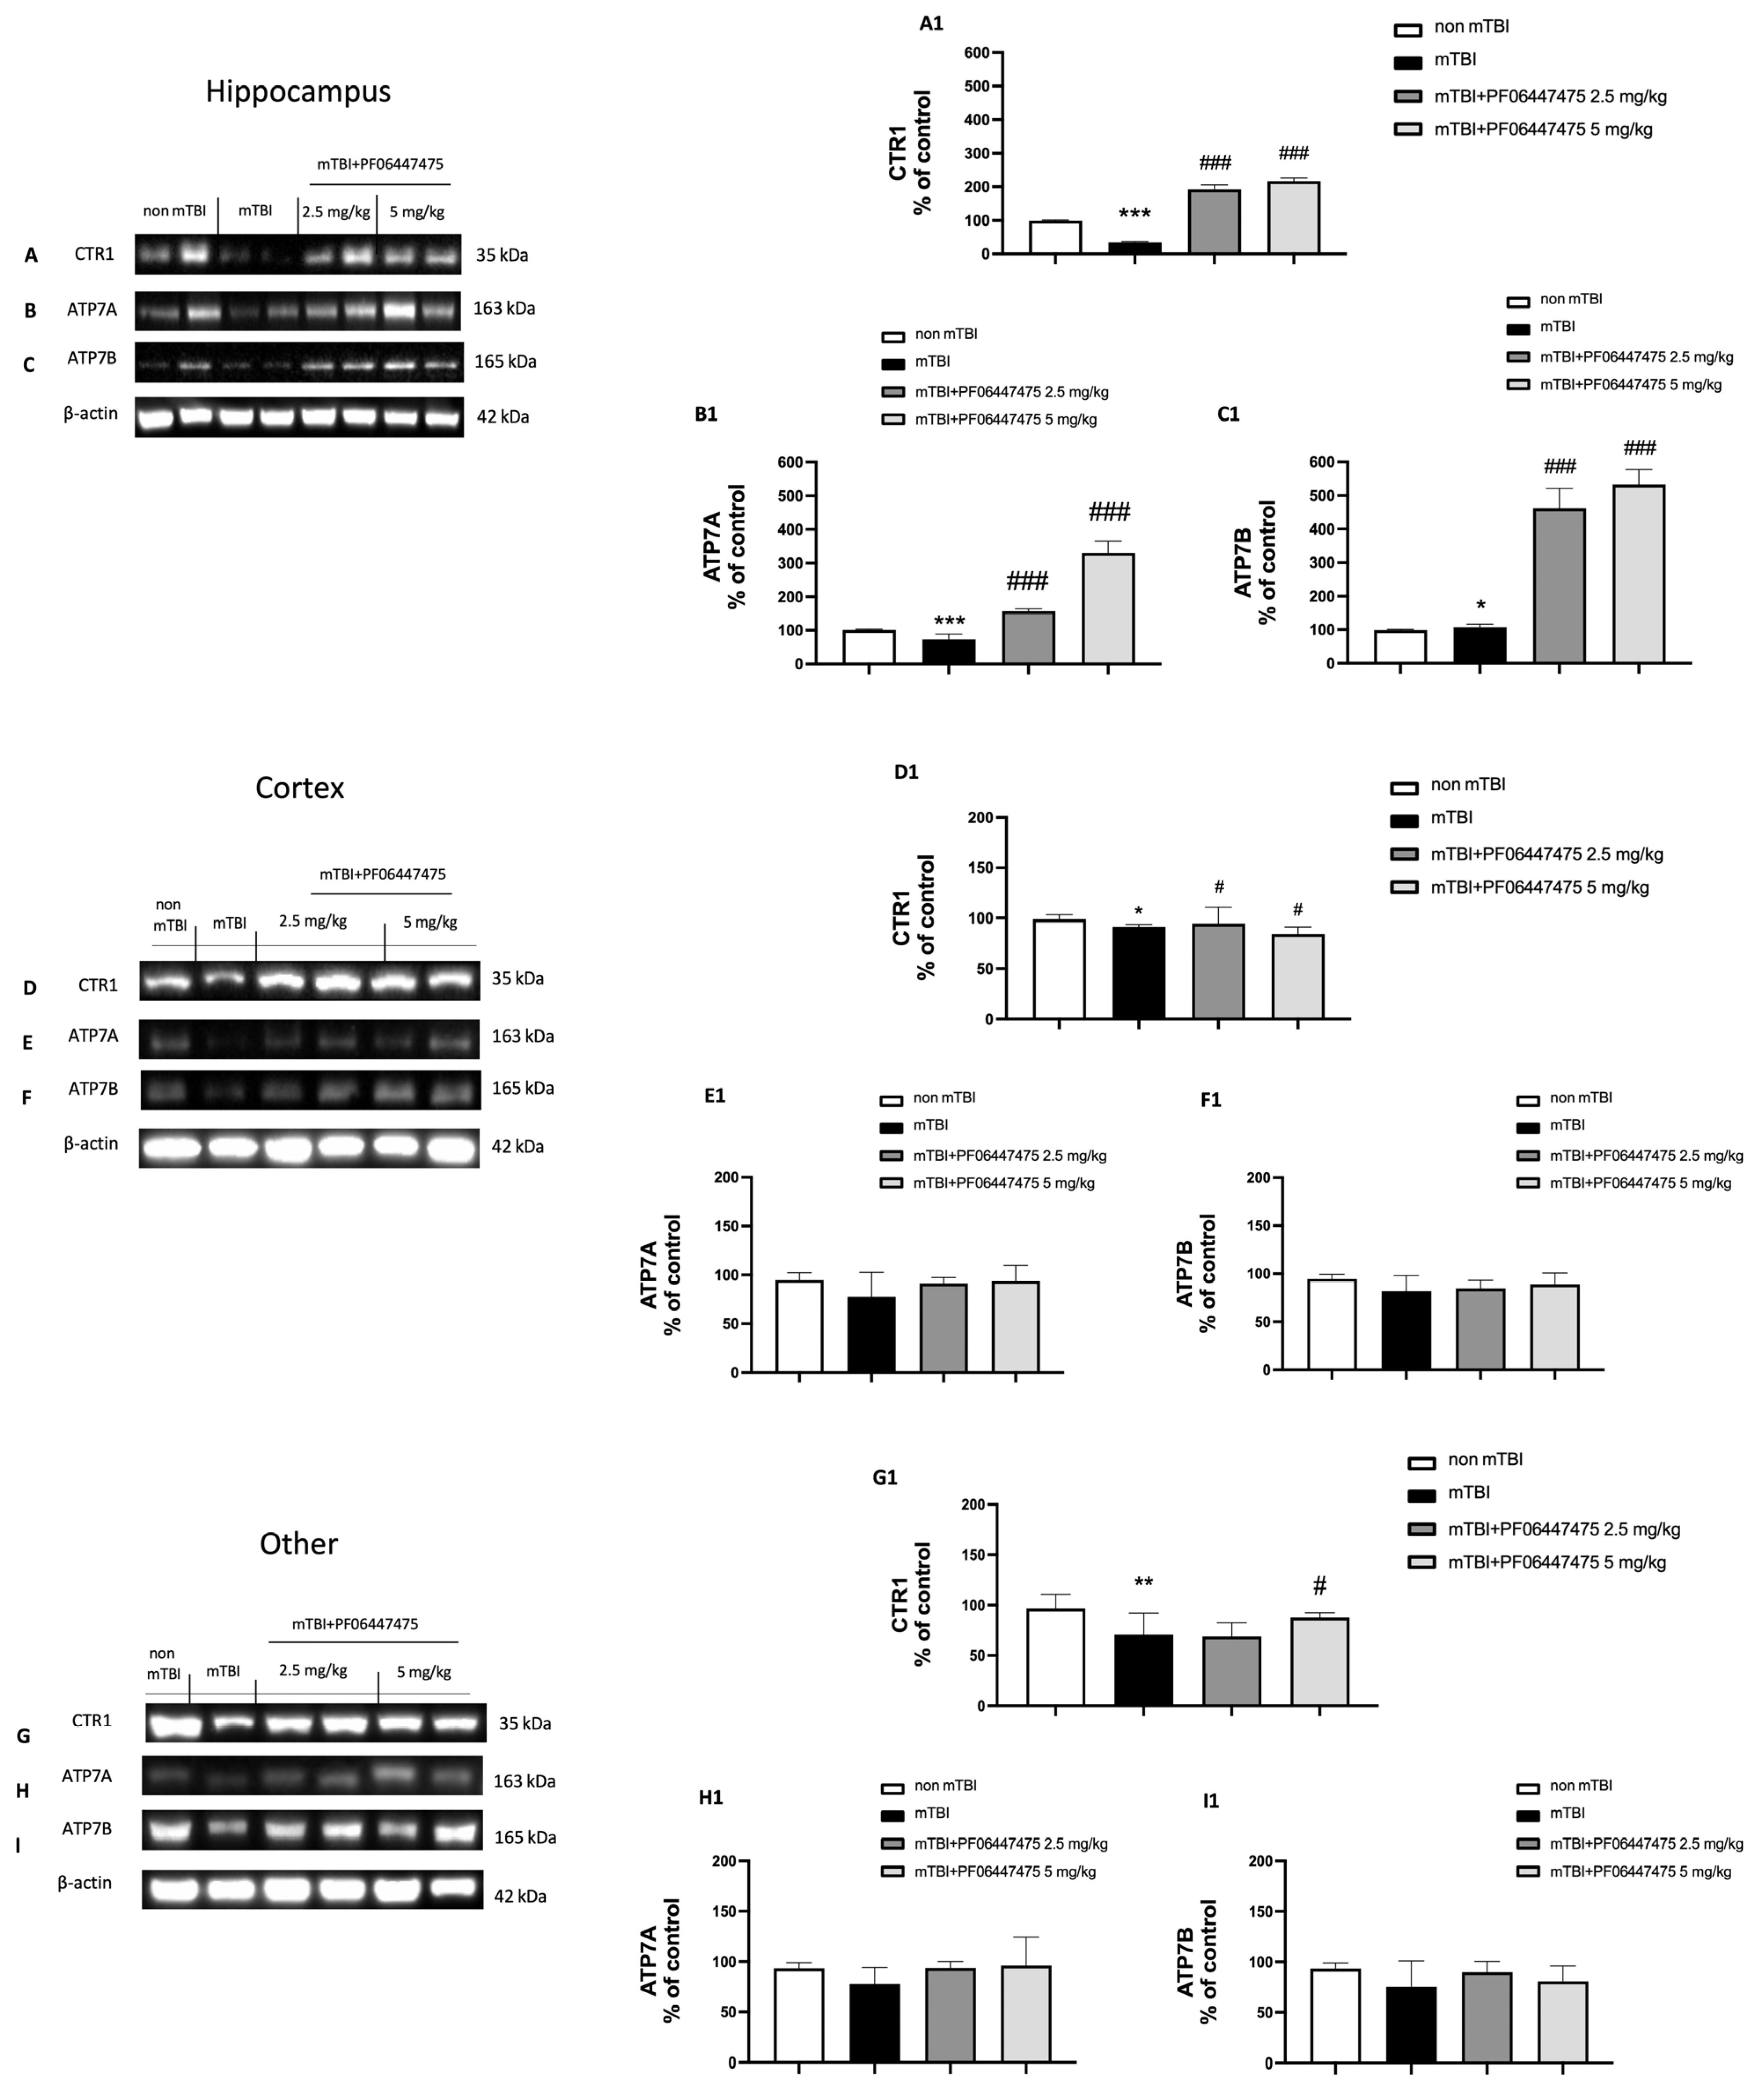
3.4. PF-06447475 Treatments Attenuated Astrocytes and Microglia Activation and Restored Copper Transporters Expressions (CTR1, ATP7A, and ATP7B)
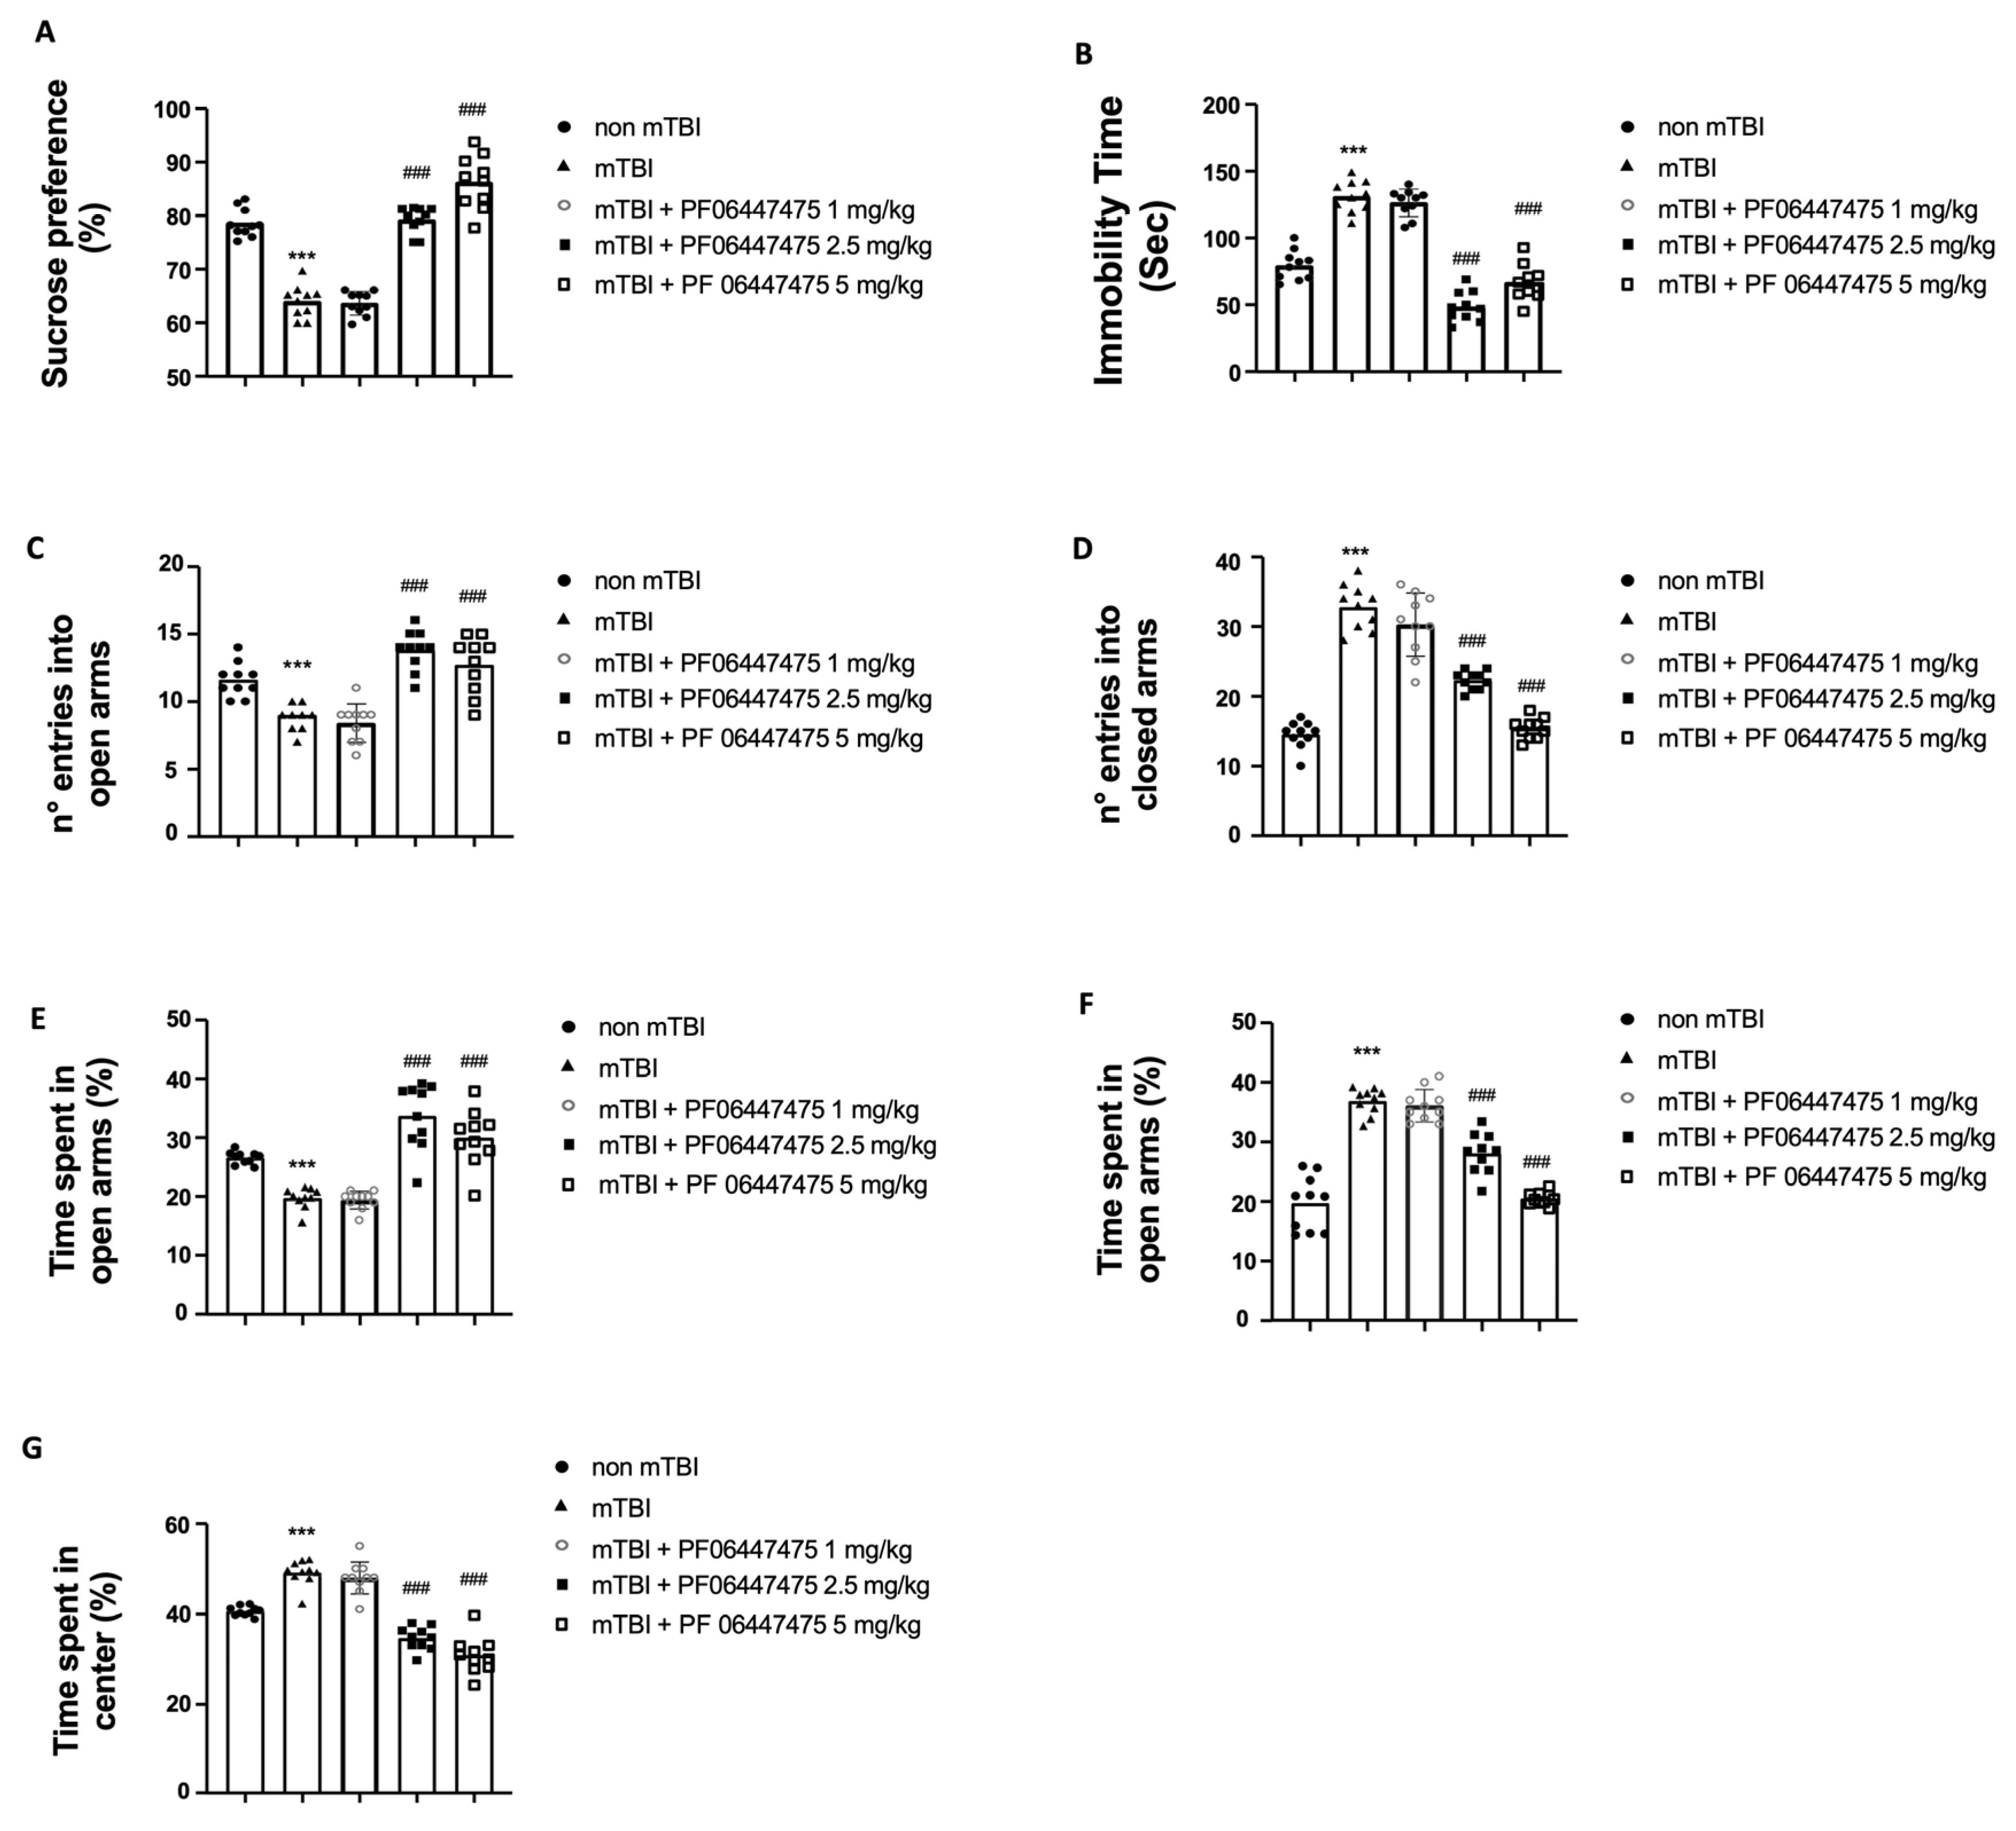
3.5. Beneficial Effects of PF-06447475 Treatments on Behavioral Consequences of mTBI
4. Discussion
5. Conclusions
Author Contributions
Funding
Institutional Review Board Statement
Informed Consent Statement
Data Availability Statement
Conflicts of Interest
References
- Carroll, L.; Cassidy, J.D.; Peloso, P.; Borg, J.; von Holst, H.; Holm, L.; Paniak, C.; Pépin, M. Prognosis for mild traumatic brain injury: Results of the who collaborating centre task force on mild traumatic brain injury. J. Rehabilit. Med. 2004, 36, 84–105. [Google Scholar] [CrossRef] [Green Version]
- Hellewell, S.C.; Beaton, C.S.; Welton, T.; Grieve, S.M. Characterizing the Risk of Depression Following Mild Traumatic Brain Injury: A Meta-Analysis of the Literature Comparing Chronic mTBI to Non-mTBI Populations. Front. Neurol. 2020, 11, 350. [Google Scholar] [CrossRef] [PubMed]
- Laker, S.R. Epidemiology of Concussion and Mild Traumatic Brain Injury. PM&R 2011, 3, S354–S358. [Google Scholar] [CrossRef]
- Scholten, A.C.; Haagsma, J.A.; Cnossen, M.C.; Olff, M.; Van Beeck, E.F.; Polinder, S. Prevalence of and Risk Factors for Anxiety and Depressive Disorders after Traumatic Brain Injury: A Systematic Review. J. Neurotrauma 2016, 33, 1969–1994. [Google Scholar] [CrossRef] [PubMed]
- McAllister, T.W. Neurobiological consequences of traumatic brain injury. Dialog Clin. Neurosci. 2011, 13, 287–300. [Google Scholar] [CrossRef]
- Momčilović, B.; Prejac, J.; Brundić, S.; Morović, S.; Skalny, A.V.; Mimica, N.; Drmić, S. An essay on human and elements, multielement profiles, and depression. Transl. Neurosci. 2010, 1, 322–334. [Google Scholar] [CrossRef] [Green Version]
- Babiloni, C.; Squitti, R.; Del Percio, C.; Cassetta, E.; Ventriglia, M.C.; Ferreri, F.; Tombini, M.; Frisoni, G.; Binetti, G.; Gurzì, M.; et al. Free copper and resting temporal EEG rhythms correlate across healthy, mild cognitive impairment, and Alzheimer’s disease subjects. Clin. Neurophysiol. 2007, 118, 1244–1260. [Google Scholar] [CrossRef] [PubMed]
- Kaut, O.; Schmitt, I.; Hofmann, A.; Hoffmann, P.; Schlaepfer, T.; Wüllner, U.; Hurlemann, R. Aberrant NMDA receptor DNA methylation detected by epigenome-wide analysis of hippocampus and prefrontal cortex in major depression. Eur. Arch. Psychiatry Clin. Neurosci. 2015, 265, 331–341. [Google Scholar] [CrossRef] [PubMed]
- Adell, A. Brain NMDA Receptors in Schizophrenia and Depression. Biomolecules 2020, 10, 947. [Google Scholar] [CrossRef]
- Kang, U.-B.; Marto, J.A. Leucine-rich repeat kinase 2 and Parkinson’s disease. Proteomics 2016, 17, 1600092. [Google Scholar] [CrossRef] [PubMed]
- Islam, S.; Moore, D.J. Mechanisms of LRRK2-dependent neurodegeneration: Role of enzymatic activity and protein aggregation. Biochem. Soc. Trans. 2017, 45, 163–172. [Google Scholar] [CrossRef]
- Filippone, A.; Mannino, D.; Cucinotta, L.; Paterniti, I.; Esposito, E.; Campolo, M. LRRK2 Inhibition by PF06447475 Antagonist Modulates Early Neuronal Damage after Spinal Cord Trauma. Antioxidants 2022, 11, 1634. [Google Scholar] [CrossRef]
- Bae, Y.-H.; Joo, H.; Bae, J.; Hyeon, S.J.; Her, S.; Ko, E.; Choi, H.G.; Ryu, H.; Hur, E.-M.; Bu, Y.; et al. Brain injury induces HIF-1α-dependent transcriptional activation of LRRK2 that exacerbates brain damage. Cell Death Dis. 2018, 9, 1125. [Google Scholar] [CrossRef] [PubMed] [Green Version]
- Rui, Q.; Ni, H.; Gao, F.; Dang, B.; Li, D.; Gao, R.; Chen, G. LRRK2 Contributes to Secondary Brain Injury Through a p38/Drosha Signaling Pathway After Traumatic Brain Injury in Rats. Front. Cell. Neurosci. 2018, 12, 51. [Google Scholar] [CrossRef] [PubMed] [Green Version]
- Casili, G.; Campolo, M.; Paterniti, I.; Lanza, M.; Filippone, A.; Cuzzocrea, S.; Esposito, E. Dimethyl Fumarate Attenuates Neuroinflammation and Neurobehavioral Deficits Induced by Experimental Traumatic Brain Injury. J. Neurotrauma 2018, 35, 1437–1451. [Google Scholar] [CrossRef] [PubMed]
- Bespalov, A.; Wicke, K.; Castagné, V. Blinding and Randomization. In Good Research Practice in Non-Clinical Pharmacology and Biomedicine; Springer: Berlin/Heidelberg, Germany, 2019; Volume 257, pp. 81–100. [Google Scholar] [CrossRef] [Green Version]
- Kosari-Nasab, M.; Shokouhi, G.; Ghorbanihaghjo, A.; Abbasi, M.M.; Salari, A.-A. Hesperidin attenuates depression-related symptoms in mice with mild traumatic brain injury. Life Sci. 2018, 213, 198–205. [Google Scholar] [CrossRef]
- Ardizzone, A.; Bova, V.; Casili, G.; Filippone, A.; Campolo, M.; Lanza, M.; Esposito, E.; Paterniti, I. SUN11602, a bFGF mimetic, modulated neuroinflammation, apoptosis and calcium-binding proteins in an in vivo model of MPTP-induced nigrostriatal degeneration. J. Neuroinflamm. 2022, 19, 107. [Google Scholar] [CrossRef]
- Casili, G.; Ardizzone, A.; Basilotta, R.; Lanza, M.; Filippone, A.; Paterniti, I.; Esposito, E.; Campolo, M. The Protective Role of Prolyl Oligopeptidase (POP) Inhibition in Kidney Injury Induced by Renal Ischemia–Reperfusion. Int. J. Mol. Sci. 2021, 22, 11886. [Google Scholar] [CrossRef] [PubMed]
- Filippone, A.; Lanza, M.; Campolo, M.; Casili, G.; Paterniti, I.; Cuzzocrea, S.; Esposito, E. Protective effect of sodium propionate in Aβ1-42 -induced neurotoxicity and spinal cord trauma. Neuropharmacology 2020, 166, 107977. [Google Scholar] [CrossRef]
- Shultz, S.R.; McDonald, S.; Corrigan, F.; Semple, B.D.; Salberg, S.; Zamani, A.; Jones, N.C.; Mychasiuk, R. Clinical Relevance of Behavior Testing in Animal Models of Traumatic Brain Injury. J. Neurotrauma 2020, 37, 2381–2400. [Google Scholar] [CrossRef] [PubMed]
- Isaev, N.K.; Stelmashook, E.V.; Genrikhs, E.E. Role of zinc and copper ions in the pathogenetic mechanisms of traumatic brain injury and Alzheimer’s disease. Rev. Neurosci. 2019, 31, 233–243. [Google Scholar] [CrossRef] [PubMed]
- Peng, F.; Muzik, O.; Gatson, J.; Kernie, S.G.; Diaz-Arrastia, R. Assessment of Traumatic Brain Injury by Increased 64Cu Uptake on 64CuCl2 PET/CT. J. Nucl. Med. 2015, 56, 1252–1257. [Google Scholar] [CrossRef] [PubMed] [Green Version]
- Paterniti, I.; Filippone, A.; Naletova, I.; Greco, V.; Sciuto, S.; Esposito, E.; Cuzzocrea, S.; Rizzarelli, E. Trehalose–Carnosine Prevents the Effects of Spinal Cord Injury Through Regulating Acute Inflammation and Zinc(II) Ion Homeostasis. Cell. Mol. Neurobiol. 2022, 8, 1–23. [Google Scholar] [CrossRef]
- Selvaraj, P.; Tanaka, M.; Wen, J.; Zhang, Y. The Novel Monoacylglycerol Lipase Inhibitor MJN110 Suppresses Neuroinflammation, Normalizes Synaptic Composition and Improves Behavioral Performance in the Repetitive Traumatic Brain Injury Mouse Model. Cells 2021, 10, 3454. [Google Scholar] [CrossRef] [PubMed]
- Campolo, M.; Casili, G.; Lanza, M.; Filippone, A.; Cordaro, M.; Ardizzone, A.; Scuderi, S.A.; Cuzzocrea, S.; Esposito, E.; Paterniti, I. The inhibition of mammalian target of rapamycin (mTOR) in improving inflammatory response after traumatic brain injury. J. Cell. Mol. Med. 2021, 25, 7855–7866. [Google Scholar] [CrossRef]
- Manto, M. Abnormal Copper Homeostasis: Mechanisms and Roles in Neurodegeneration. Toxics 2014, 2, 327–345. [Google Scholar] [CrossRef] [Green Version]
- Miller, K.M.; Okun, M.S.; Fernandez, H.F.; Jacobson IV, C.E.; Rodriguez, R.L.; Bowers, D. Depression symptoms in movement disorders: Comparing Parkinson’s disease, dystonia, and essential tremor. Mov. Disord. 2007, 22, 666–672. [Google Scholar] [CrossRef]
- Fakhoury, M.; Shakkour, Z.; Kobeissy, F.; Lawand, N. Depression following traumatic brain injury: A comprehensive overview. Rev. Neurosci. 2020, 32, 289–303. [Google Scholar] [CrossRef]
- Piao, C.-S.; Holloway, A.; Hong-Routson, S.; Wainwright, M.S. Depression following traumatic brain injury in mice is associated with down-regulation of hippocampal astrocyte glutamate transporters by thrombin. J. Cereb. Blood Flow Metab. 2017, 39, 58–73. [Google Scholar] [CrossRef]
- Wallings, R.L.; Herrick, M.K.; Tansey, M.G. LRRK2 at the Interface Between Peripheral and Central Immune Function in Parkinson’s. Front. Neurosci. 2020, 14, 443. [Google Scholar] [CrossRef]
- Madiha, S.; Haider, S. Curcumin restores rotenone induced depressive-like symptoms in animal model of neurotoxicity: Assessment by social interaction test and sucrose preference test. Metab. Brain Dis. 2018, 34, 297–308. [Google Scholar] [CrossRef] [PubMed]
- Strekalova, T.; Spanagel, R.; Bartsch, D.A.; Henn, F.A.; Gass, P. Stress-Induced Anhedonia in Mice is Associated with Deficits in Forced Swimming and Exploration. Neuropsychopharmacology 2004, 29, 2007–2017. [Google Scholar] [CrossRef]
- Tanyeri, M.H.; Buyukokuroglu, M.E.; Tanyeri, P.; Mutlu, O.; Ulak, G.; Akar, F.Y.; Erden, B.F. PS124. Effects of desipramine, venlafaxine and bupropion on depression and anxiety in the forced swimming test and elevated plus maze test in mice. Int. J. Neuropsychopharmacol. 2016, 19, 42. [Google Scholar] [CrossRef] [Green Version]
- Keifer , O.P., Jr.; Hurt, R.C.; Ressler, K.J.; Marvar, P.J. The Physiology of Fear: Reconceptualizing the Role of the Central Amygdala in Fear Learning. Physiology 2015, 30, 389–401. [Google Scholar] [CrossRef] [Green Version]
- Morris, D.R.; Levenson, C.W. Zinc in traumatic brain injury: From neuroprotection to neurotoxicity. Curr. Opin. Clin. Nutr. Metab. Care 2013, 16, 708–711. [Google Scholar] [CrossRef] [PubMed]
- Li, Z.; Liu, Y.; Wei, R.; Yong, V.W.; Xue, M. The Important Role of Zinc in Neurological Diseases. Biomolecules 2022, 13, 28. [Google Scholar] [CrossRef]
- Gromadzka, G.; Tarnacka, B.; Flaga, A.; Adamczyk, A. Copper Dyshomeostasis in Neurodegenerative Diseases—Therapeutic Implications. Int. J. Mol. Sci. 2020, 21, 9259. [Google Scholar] [CrossRef]
- Etelianidis, J.; Ehung, Y.H.; Emateria, S.; Fontaine, S.E. Role of the P-Type ATPases, ATP7A and ATP7B in brain copper homeostasis. Front. Aging Neurosci. 2013, 5, 44. [Google Scholar] [CrossRef] [Green Version]
- Schlief, M.L.; Craig, A.M.; Gitlin, J.D. NMDA Receptor Activation Mediates Copper Homeostasis in Hippocampal Neurons. J. Neurosci. 2005, 25, 239–246. [Google Scholar] [CrossRef] [Green Version]
- Thompson, S.M.; Kallarackal, A.J.; Kvarta, M.D.; Van Dyke, A.M.; LeGates, T.A.; Cai, X. An excitatory synapse hypothesis of depression. Trends Neurosci. 2015, 38, 279–294. [Google Scholar] [CrossRef] [Green Version]
- O’Neil, D.A.; Nicholas, M.A.; Lajud, N.; Kline, A.E.; Bondi, C.O. Preclinical Models of Traumatic Brain Injury: Emerging Role of Glutamate in the Pathophysiology of Depression. Front. Pharmacol. 2018, 9, 579. [Google Scholar] [CrossRef] [PubMed] [Green Version]


Disclaimer/Publisher’s Note: The statements, opinions and data contained in all publications are solely those of the individual author(s) and contributor(s) and not of MDPI and/or the editor(s). MDPI and/or the editor(s) disclaim responsibility for any injury to people or property resulting from any ideas, methods, instructions or products referred to in the content. |
© 2023 by the authors. Licensee MDPI, Basel, Switzerland. This article is an open access article distributed under the terms and conditions of the Creative Commons Attribution (CC BY) license (https://creativecommons.org/licenses/by/4.0/).
Share and Cite
Filippone, A.; Cucinotta, L.; Bova, V.; Lanza, M.; Casili, G.; Paterniti, I.; Campolo, M.; Cuzzocrea, S.; Esposito, E. Inhibition of LRRK2 Attenuates Depression-Related Symptoms in Mice with Moderate Traumatic Brain Injury. Cells 2023, 12, 1040. https://doi.org/10.3390/cells12071040
Filippone A, Cucinotta L, Bova V, Lanza M, Casili G, Paterniti I, Campolo M, Cuzzocrea S, Esposito E. Inhibition of LRRK2 Attenuates Depression-Related Symptoms in Mice with Moderate Traumatic Brain Injury. Cells. 2023; 12(7):1040. https://doi.org/10.3390/cells12071040
Chicago/Turabian StyleFilippone, Alessia, Laura Cucinotta, Valentina Bova, Marika Lanza, Giovanna Casili, Irene Paterniti, Michela Campolo, Salvatore Cuzzocrea, and Emanuela Esposito. 2023. "Inhibition of LRRK2 Attenuates Depression-Related Symptoms in Mice with Moderate Traumatic Brain Injury" Cells 12, no. 7: 1040. https://doi.org/10.3390/cells12071040