
Hypergravity Increases Blood–Brain Barrier Permeability to Fluorescent Dextran and Antisense Oligonucleotide in Mice

1
CNRS, INCC, UMR 8002, Université Paris Cité, F-75006 Paris, France
2
INSERM, SAINBIOSE U1059, Mines Saint-Etienne, Université Jean Monnet Saint-Étienne, F-42023 Saint-Étienne, France
3
University Bordeaux, CNRS, INCIA, UMR 5287, F-33000 Bordeaux, France
4
University Bordeaux, CNRS, IMN, UMR 5293, F-33000 Bordeaux, France
*
Authors to whom correspondence should be addressed.
Cells 2023, 12(5), 734; https://doi.org/10.3390/cells12050734
Submission received: 26 January 2023
/
Revised: 13 February 2023
/
Accepted: 16 February 2023
/
Published: 24 February 2023
(This article belongs to the Special Issue New Insights into Microgravity and Space Biology)
Abstract
:The earliest effect of spaceflight is an alteration in vestibular function due to microgravity. Hypergravity exposure induced by centrifugation is also able to provoke motion sickness. The blood–brain barrier (BBB) is the crucial interface between the vascular system and the brain to ensure efficient neuronal activity. We developed experimental protocols of hypergravity on C57Bl/6JRJ mice to induce motion sickness and reveal its effects on the BBB. Mice were centrifuged at 2× g for 24 h. Fluorescent dextrans with different sizes (40, 70 and 150 kDa) and fluorescent antisense oligonucleotides (AS) were injected into mice retro-orbitally. The presence of fluorescent molecules was revealed by epifluorescence and confocal microscopies in brain slices. Gene expression was evaluated by RT-qPCR from brain extracts. Only the 70 kDa dextran and AS were detected in the parenchyma of several brain regions, suggesting an alteration in the BBB. Moreover, Ctnnd1, Gja4 and Actn1 were upregulated, whereas Jup, Tjp2, Gja1, Actn2, Actn4, Cdh2 and Ocln genes were downregulated, specifically suggesting a dysregulation in the tight junctions of endothelial cells forming the BBB. Our results confirm the alteration in the BBB after a short period of hypergravity exposure.
1. Introduction
Astronauts are exposed to successive phases of hypergravity phases during the takeoff and landing of spaceflights and due to microgravity in space. The most important and earliest reported symptom, related to days 1–3 of the spaceflight, is space motion sickness due to vestibular dysfunction [1,2,3,4,5,6,7]. The fluid shift is the shift in the distribution of human body fluids due to microgravity exposure. It was proposed to be responsible for space motion sickness. Several ground devices and protocols were rapidly developed to reproduce this phenomenon, such as centrifugation and parabolic flights [8,9]. Moreover, the decreases in plasma volume and cardiac performance, and the increase in intracranial blood pressure participate in vascular deterioration, as recently reviewed [10,11,12]. Furthermore, the alterations in gravity induce cardiovascular adaptations via the modifications in endothelial and smooth muscle vascular cell functions [13,14,15,16,17]. It is noticeable that the effects of centrifugation are only partially described in humans [18,19,20,21,22]. Like during microgravity exposure, hypergravity exposure, from 1.5 to 5 g, affects the vestibular functions [23,24,25,26] and modifies gene expression in the brain [27,28,29] and cognitive performances [30,31,32]. The use of hypergravity by centrifugation is required to qualify the biological effects of space motion sickness.
Likewise, centrifugation, close to 2× g, is also proposed as a countermeasure against the deleterious effects of microgravity seen in humans [33,34]. Therefore, before the exposure of humans to centrifugation, it is important to study its biological impacts.
The cerebral blood vessels are crucial in brain functions regarding oxygen supply and exchanges of nutrients and wastes. The endothelial cells of brain capillaries are organized to form the blood–brain barrier (BBB), assuming the fine-tuning of these exchanges to maintain brain homeostasis [35,36]. The efficacy of the BBB is regulated by the nychthemeral rhythms [37,38,39,40]. BBB alterations are clearly implicated in stroke and neurodegenerative disorders [41,42,43,44].
Gravity changes are able to modify endothelial cell functions [45]. Many in vitro models have been developed to reproduce the BBB [46], and experiments that exposed endothelial cells to gravity modifications revealed miscellaneous results, as reviewed [47]. Depending on hypergravity levels from 3 g to 20 g, endothelial cells modify their gene expression, angiogenesis, cytoskeleton architecture and tube formation [48,49,50,51]. Moreover, in devices that reproduce the barrier function, the effects of short-term exposure to hypergravity remain unclear. In fact, exposure (2 g and 4 g) increases the barrier efficacy, shown by resistance measurements of the endothelial cell culture [52], whereas a higher level (10 g) decreases it, as shown by the increase in fluorescent molecules passing through the culture monolayer [53].
The effects of hypergravity on the capacity of endothelial cells to form a barrier in vitro are insufficient to interpret the modifications in the BBB observed in vivo. More information should be collected in vivo.
In mice exposed to hypergravity at 2 g for 24 h, we measured the transit through the BBB of different fluorescent molecules with different sizes, such as dextrans and antisense oligonucleotides (AS). We also investigated the regulation of expression of genes involved in junctions between endothelial cells.
2. Materials and Methods
2.1. Animals and Centrifugation
In accordance with the principles of the European community, the experimental protocols were validated by the local ethics committee (CEEA-Loire, APAFIS #38819), the animal welfare committee of PLEXAN (PLateforme d’EXpérimentations et d’ANalyses, Faculty of Medicine, Université Jean Monnet, Saint Etienne, France, agreement n°42-18-0801) and the French Ministry of Research. In this study, 86 male C57BL/6JRJ mice (8 weeks old, 22.5 ± 0.1 g, Janvier Labs, France) were used. The animals were housed (3 mice per cage) in standard conditions (22 °C, humidity 55%; 12 h/12 h day/night cycle; unlimited access to food and water). They were familiarized with the centrifugation room the week before the experiments and monitored by video in the centrifuge. In order to expose all the animals to the same environmental conditions, the mice were centrifuged at 2× g for 24 h, and the control mice in normogravity at 1 g for 24 h were placed simultaneously in the experimental room. The centrifugation protocol was detailed in our previous publication.
2.2. In Vivo Injection of Antisense Oligonucleotide and Dextrans
All the fluorescent molecules were diluted in saline solution (sodium chloride 9 g/L) and retro-orbitally injected in the blood, under isoflurane anesthesia (5%). In our hands, this route of administration is safer (more rapid, efficient and reproducible) than other routes of i.v. administration. Sham mice were injected with vehicle solution. Mice received only one injection with one fluorescent tracer. Phosphorothioate antisense oligonucleotide directed against angiopoietin-2 (Angpt2, named AS, GCG-TTA-GAC-ATG-TAG-GG, 6084.9 g/mol, Eurogentec) was coupled to 5-carboxyfluorescein (excitation: 492 nm, blue light; emission: 518 nm, green light) and injected (18 mg/Kg). Fluorescein isothiocyanate-dextrans D40, D70 and D150 (FD40-100MG, FD70S-100MG, FD150S-1G, respectively, Sigma-Aldrich, St. Louis, MI, USA) were solubilized in vehicle (2× g/100 mL to be injected retro-orbitally at 150 mg/Kg, near 200 µL/mouse). Fluorescein isothiocyanate-dextrans were maximally excited at 490 nm (blue) and maximally emitted at 525 nm (green).
2.3. Collection of Biological Samples
Mice were randomly killed by lethal intraperitoneal injection of sodium pentobarbital (Euthasol, 175 mg/Kg, i.p.), within 2 h after stopping the centrifuge. Before intracardiac perfusion, a catheter was introduced in the right atrium, and blood samples were collected and placed in microtubes. Finally, mice were perfused intracardiacally (5 mL/min) with 30 mL of phosphate-buffered saline (0.01 M PBS, pH: 7.4) to discard blood cells and residual fluorescence of the injected tracers into vessel lumen. This step was followed by 30 mL formalin solution (10%, Merck, HT501128) to fix the tissues. Brains and the left lobe of livers were dissected and post-fixed for 24 h in a formalin solution at room temperature, placed for 48 h in a 30% sucrose–PBS solution at 4 °C and cryopreserved before being sliced.
2.4. Corticosterone Assay
The microtubes containing blood samples were centrifuged (10 min at 2000× g) and 20 µL of serum was collected. Some serum samples were excluded due to hemolysis. The others (n = 60) were used for corticosterone assay (ELISA kit, K014, Arbor Assays, Ann Arbor, MI, USA), following the protocol of the supplier.
2.5. Histology
Using a freezing microtome (frigomobil, Reichert-Jung), coronal sections of the brain (40 μm thick) were made. Olfactory bulbs were removed, and 3.2 mm after beginning the rostro-caudal slicing, the new slices were collected and placed individually in 48-well plates. To ensure reproducibility, we anatomically selected three similar brain slices for each mouse. Using a binocular device, the slices corresponding to interaural 1.98 mm; Begma −1.82 mm of the Atlas of the mouse brain in stereotaxic coordinates [54] were retained. Indeed, the medial habenular nuclei and mammillothalamic tract were anatomical landmarks, as well as the form and volume of the hippocampus. In the same manner, the left lobes of the liver were sliced (40 µm), and three slices per mouse were mounted. All the floating sections were incubated for 10 min in DAPI (4′,6-diamidino-2-phenylindole, 1:250,000, Interchim, Mannheim, Germany) and rinsed twice in PBS (10 and 20 min, respectively). Finally, they were mounted on glass slides (Superfrost) with a handmade medium based on Mowiol. All slices were DAPI-labeled and mounted on the same day. Slices presenting red blood cells in capillaries in ROI were excluded to reduce experimental bias [55].
2.6. Image Acquisition
The fluorescence of labeled brain slices was observed by confocal microscopy (SP5, Leica Microsystems, Wetzlar, Germany) and the slide scanner Nanozoomer (2.0 HT, Hamamatsu Photonics, Shizuoka Prefecture, Japan). The Nanozoomer contains a fluorescence imaging module using objective UPS APO 20X NA 0.75 combined with an additional lens 1.75X. Virtual slides were acquired with a TDI-3 CCD camera. The fluorescent acquisitions were conducted with a mercury lamp (LX2000 200W—Hamamatsu Photonics, Massy, France), and the set of filters adapted for DAPI and FITC/FAM fluorescence were usable for both fluorescein isothiocyanate-dextrans and 5-carboxyfluorescein antisense oligonucleotide. The DAPI labeling, revealing the double strain of DNA in the cell nuclei, was used for the automated focus required for Nanozoomer imaging. To reduce bias, all images (slices from control and centrifuged mice) were performed randomly in one batch. To localize antisense oligonucleotides in the brain and liver tissues, some images were acquired with SP5 confocal microscope. In this case, fluorescent molecules were excited with the 488 nm line of Argon laser and all acquisition parameters were kept constant.
2.7. Fluorescence Analyses
Several types of fluorescence analyses were double-blindly performed on Nanozoomer images. To evaluate the intensity level of fluorescence, the ndpi files generated by Nanozoomer were converted into tiff images with NDPI software (version 2). The tiff files were opened with Fiji software 2.9.0, and the intensity levels were measured in regions of interest (ROI defined as red circle of 960 µm2 in Figures and placed on the hippocampus (HPC), dorsal thalamic nuclei (THAL) and the retrosplenial and ectorhinal cortices (DCx and LCx, respectively) on both hemispheres of the three slices. No filter settings were applied to the images and we checked that the images did not have any saturated dots. The mean of fluorescence was calculated for each mouse and reported in the statistical analysis. A similar analysis was performed in three liver slices. Five ROI were randomly placed on each slice. Moreover, the image analysis of fluorescent spots was performed with QuPath directly on the ndpi files. The software is able to identify and localize fluorescent spots. We empirically determined parameters to segregate fluorescent spots in brain slices from 5 mice (control and centrifuged mice) and we applied these parameters to the project containing the entire sample. The parameters were: pixel size 0.5 µm, background radius 30 µm, median filter radius 0, sigma 1, minimum area 5 µm2, maximal area 1000 µm2 and threshold 7. The collected data were attributed to experimental groups (2 g vs. 1 g) and compared statistically. The analyses, reported, were performed on the ROI anatomically defined as HPC (hippocampus), THAL (grouping all medio-dorsal and lateral thalamic nuclei), DCx (containing retrosplenial cortices), SoCx (containing somatosensorial cortices) and PirCx (containing piriform cortices). A similar analysis was performed on the left lobe liver slices.
2.8. Gene Expression by RT-qPCR
For this experiment, 16 mice were used (8 were exposed to 2 g and 8 to 1 g, as described before). They were anesthetized with isoflurane 5% and decapitated, and the brains were directly frozen and stored at −80 °C. Hippocampus were dissected on ice and placed in 2 mL tubes containing 500 µL of Tri-reagent (MRCgene) and 10 ceramic beads (diameter 1.5 mm). Samples were mashed in a Beadbug6 shaker (Benchmark, 3 cycles, level of speed 4350 and 60 s time). RNA was isolated, following the instruction of the protocol elaborated by MRCgene. The concentration of RNA was measured with Nanodrop (Thermoscientific, Waltham, MA, USA) and adjusted close to 100 ng/µL. The cDNA was produced with the RT-i-script gDNA clear cDNA synthesis kit (Bio-Rad’s reference 1725035), using 100 ng of RNA and following the protocol from the supplier. The qPCR was performed using the endothelial cell contacts by junction M96 (predesigned for use with SYBR green; Bio-Rad’s plate reference 10029202) and the Sso-advanced universal SYBR green PCR kit (Bio-Rad’s reference 1725275). The qPCR was performed with CFX96 thermocycler (Bio-Rad). Samples were allocated randomly in plates, and some of them were tested twice to verify the quality of the experiment. The validation of Hprt and Gapdh as reference genes was evaluated with CFX Maestro software (Bio-Rad). The analysis of gene expression was performed on Actb, Actg1, Actn1, Actn2, Actn4, Cdh2, Cdh5, Cldn1, Cldn3, Cldn5, Ctnna1, Ctnnb1, Ctnnd1, Dsp, F11r, Gja1, Gja4, Gja5, Jam2, Jup, Ocln, Tjp1, Tjp2 and Vim. The threshold of the regulation by hypergravity on gene expression was chosen at 1.5. To discuss the RT-qPCR results, we checked the brain localization, cell types expressing genes and function of proteins encoded by these genes in endothelial cells using databases: https://www.proteinatlas.org; http://mousebrain.org; http://betsholtzlab.org and https://www.informatics.jax.org (accessed on 26 January 2023).
2.9. Statistical Analysis
The data were statistically compared using paired t-tests, non-parametric Mann–Whitney test, or one- and two-way ANOVA with post hoc comparisons when applicable. The normogravity (1 g) is the control condition. The software used was GraphPad Prism V9, which calculated the p value as the probability of observing two identical conditions. If p < 0.05, the two compared conditions were considered statistically different.
3. Results
3.1. Effects of Centrifugation on Mice
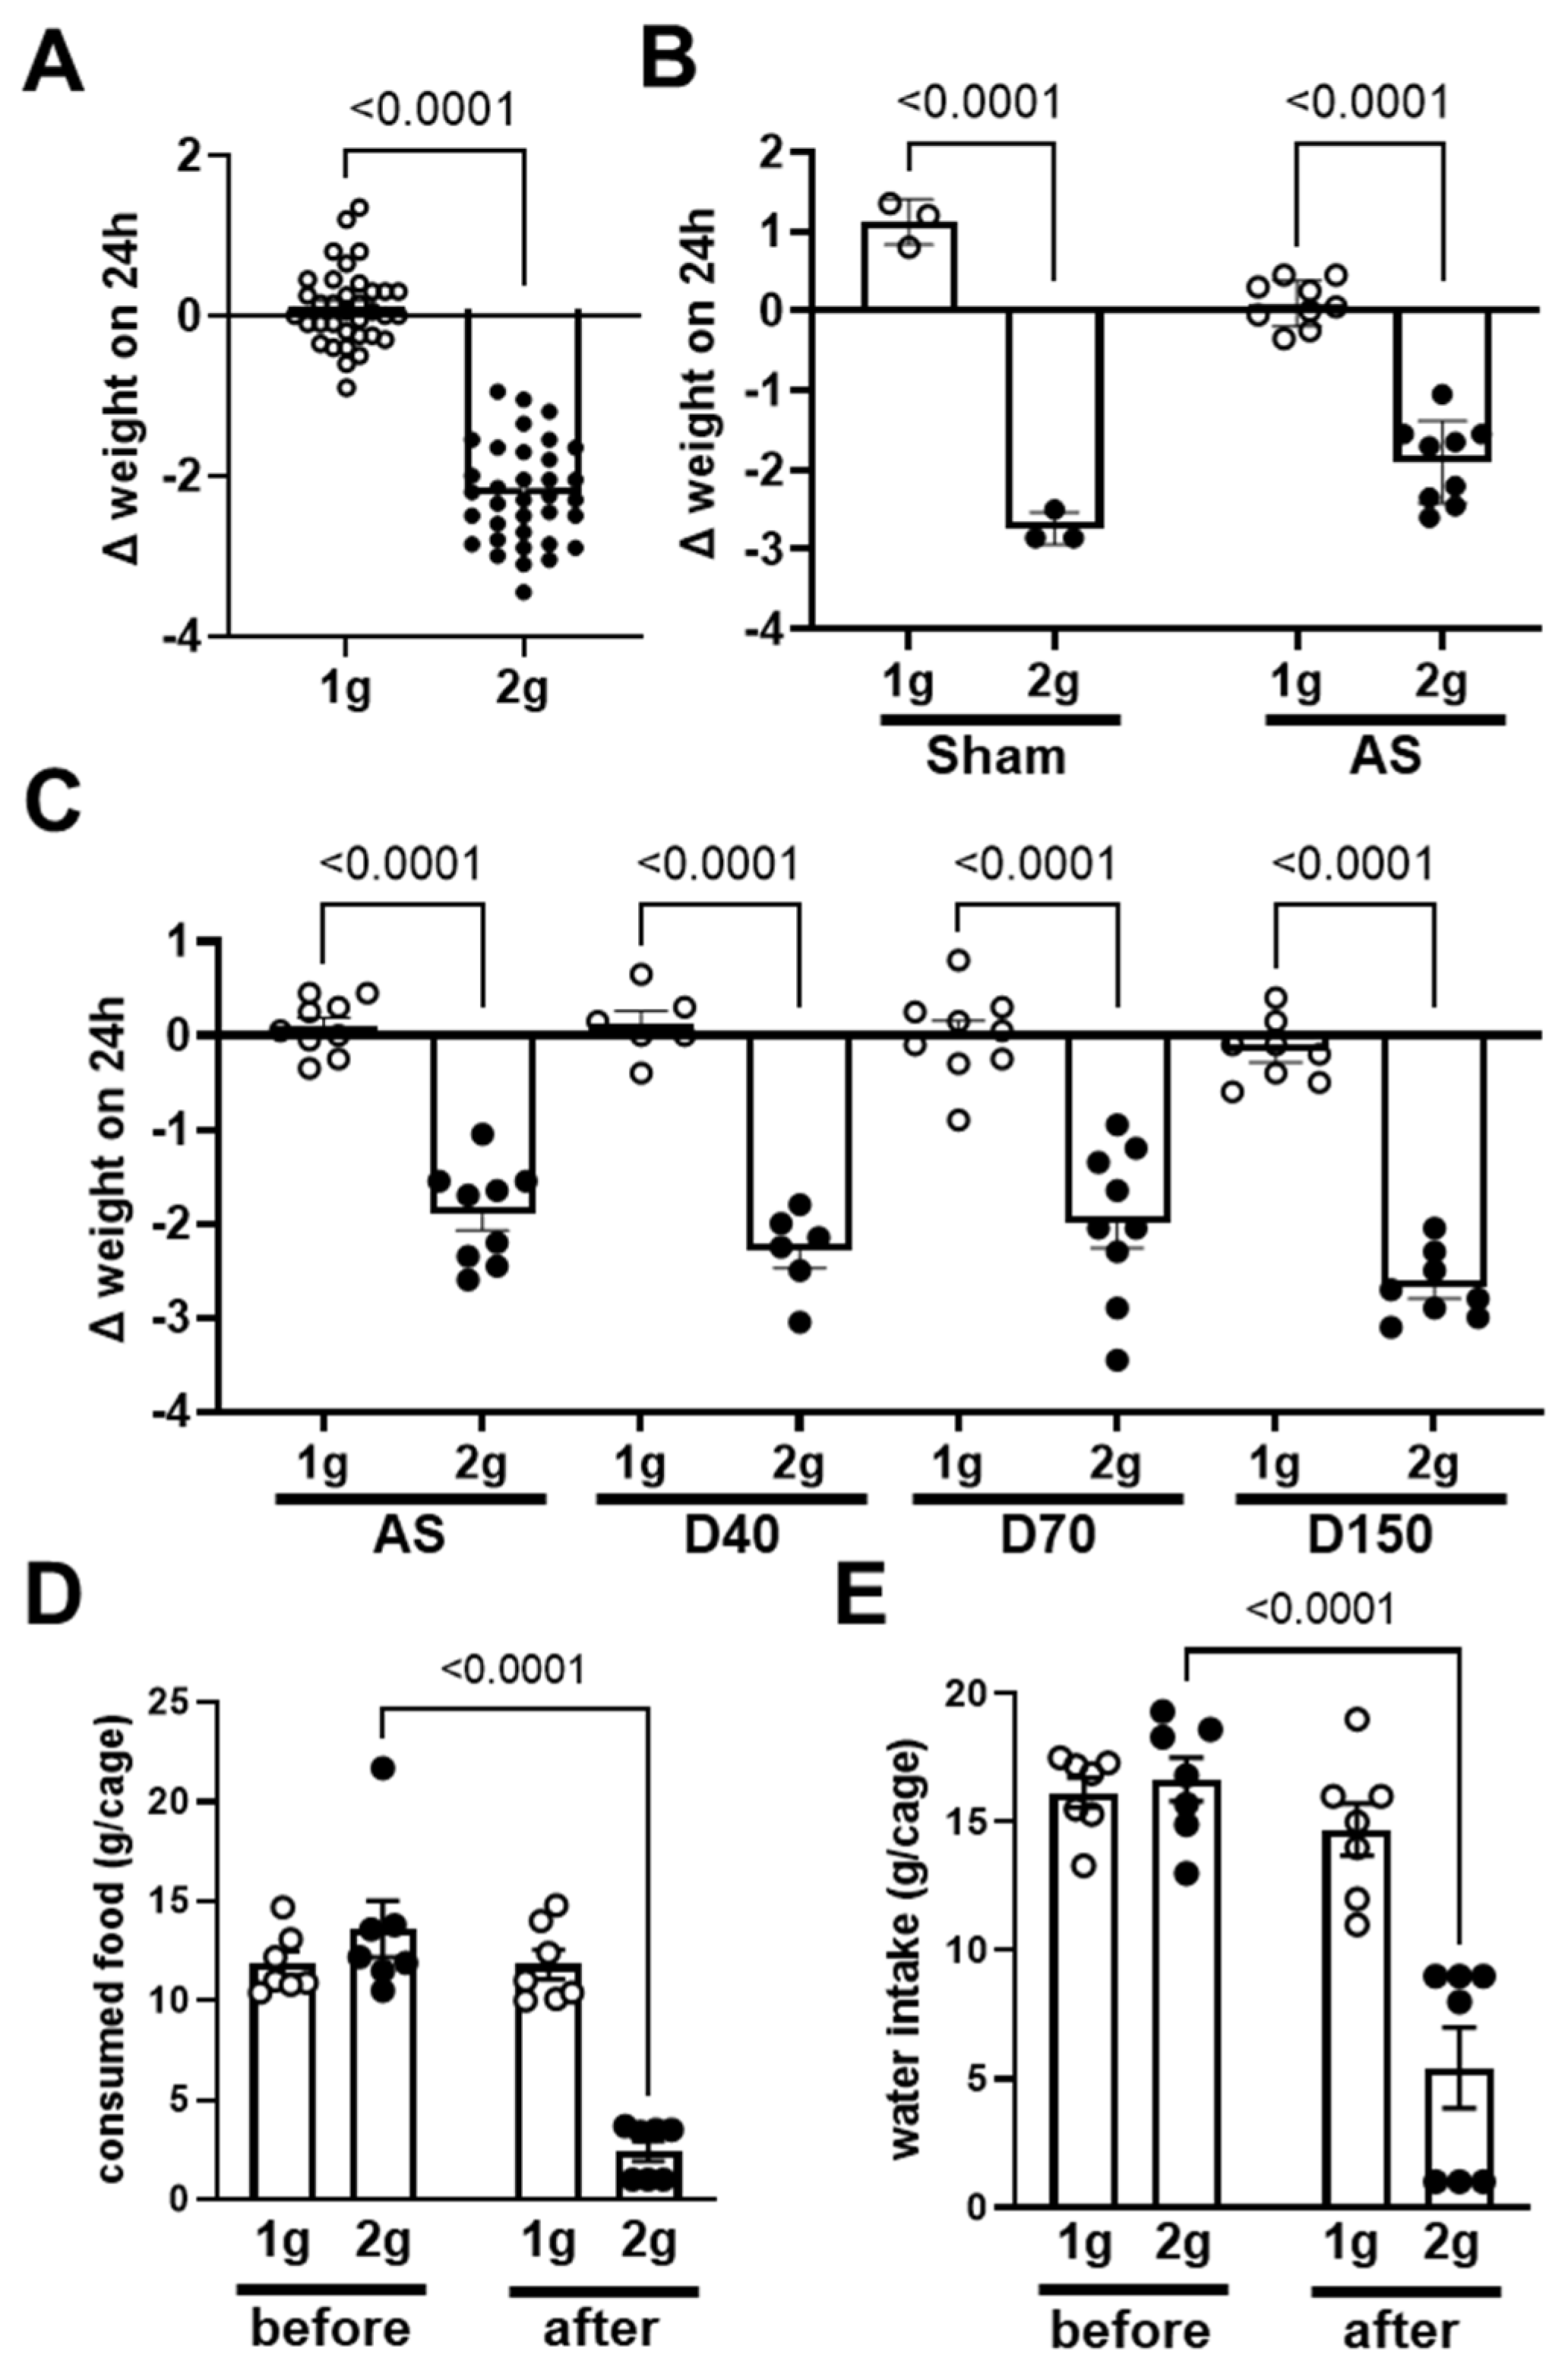
The body weight gain, expressed as the difference in weight in a 24 h period (Figure 1), is the difference in body weight measured before and after exposure to centrifugation (2× g) or control conditions (1 g). As expected, the exposure to centrifugation induced a decrease in body weight (Figure 1A, p < 0.0001).
More precisely, the decrease in body weight was similar in mice injected with saline solution (Sham) and solution containing fluorescent antisense oligonucleotide directed against angiopoietin-2 (AS) (two-way ANOVA coupled with Sidak post hoc test, interaction p = 0.0009; 1 g vs. 2 g: p < 0.0001; sham vs. AS p = 0.589; Figure 1B). The decrease in body weight gain due to centrifugation was similarly observed in mice injected with dextrans (D40, D70 and D150, one-way ANOVA coupled with Sidak post hoc test, 1 g vs. 2 g: p < 0.0001; p > 0.05 for comparison of 1 g groups as well as for 2 g groups, Figure 1C). The effects observed in mice injected with AS or dextrans (D40, D70 and D150) were similar (statistical analysis shown in Figure 1C). In conclusion, the injection of fluorescent tracers did not influence the effect of centrifugation on body weight gain. To explain the decrease in body weight, we also measured the food and water consumption. As shown in Figure 1D and 1E, the comparison of food and water consumption, respectively, during the day before the centrifugation with the consumption during the 24 h of centrifugation exposure showed that both food and water consumption specifically decreased in the group exposed to the centrifugation (two-way ANOVA, time x gravity p = 0.0001 for both parameters).
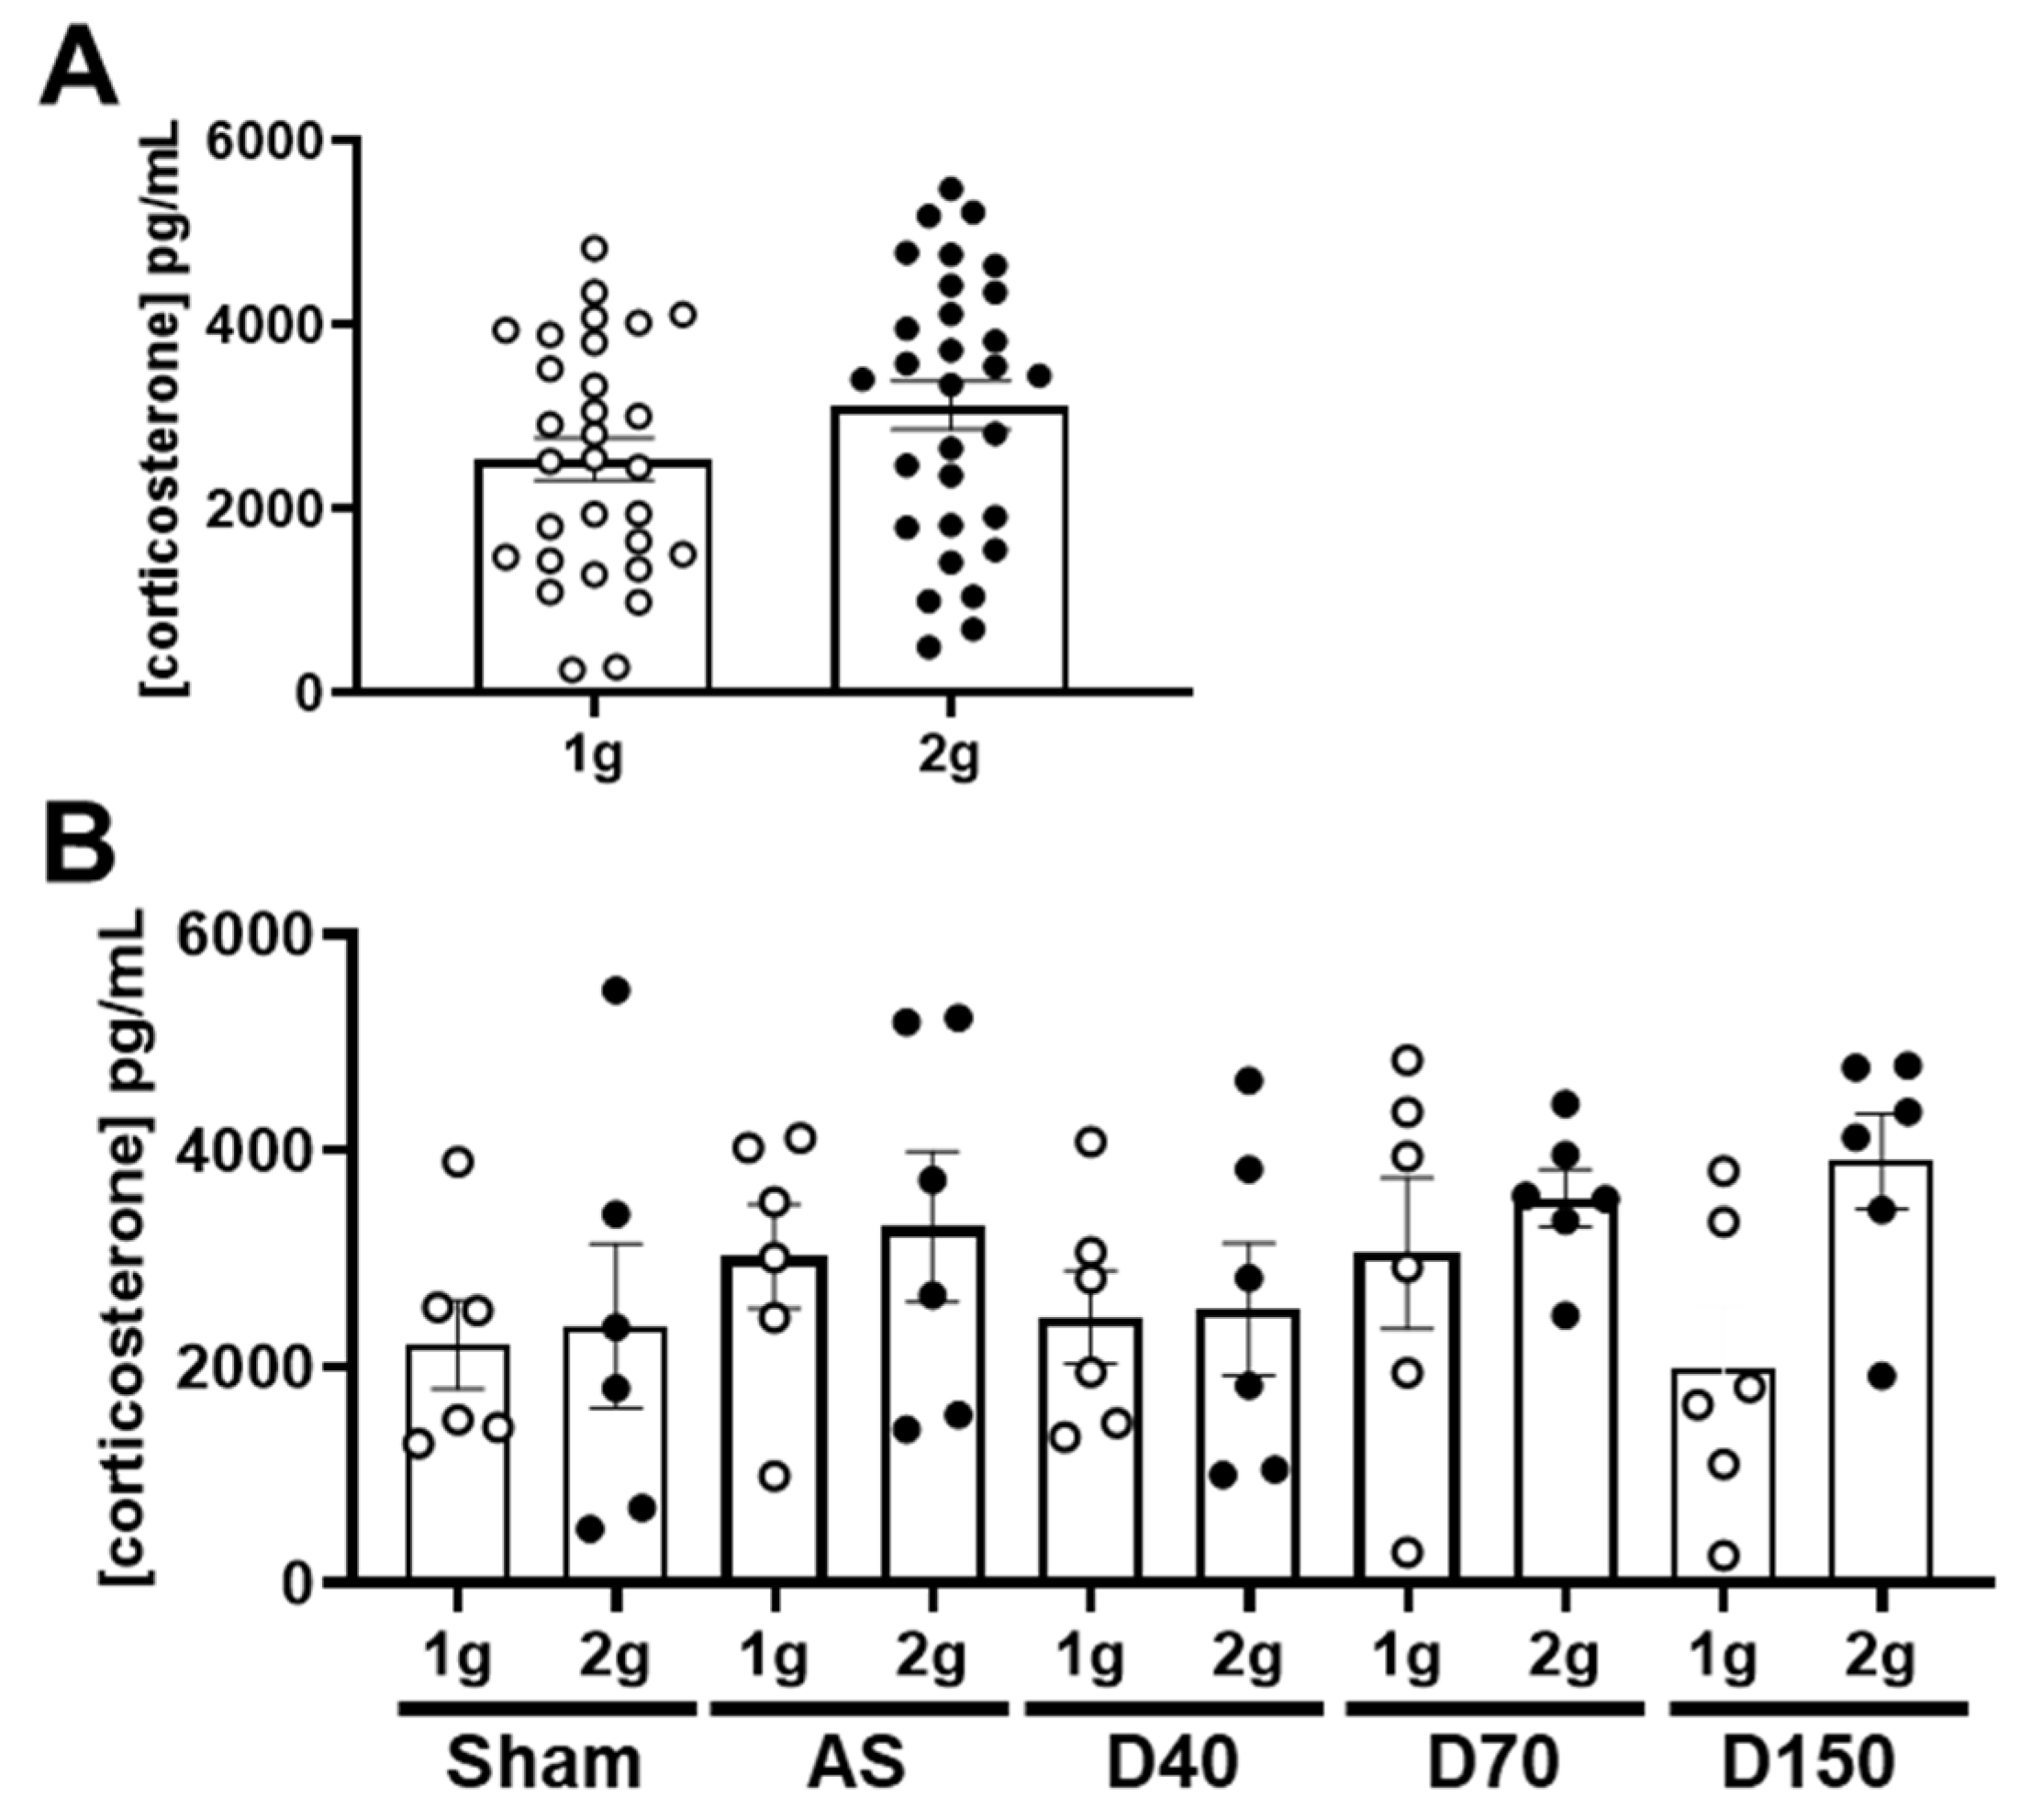
The stress was evaluated by the concentration of corticosterone in plasma. The comparison between 1 g and 2 g conditions, including all the samples, did not reveal a variation in corticosterone concentration (Figure 2A, Mann–Whitney test, p = 0.255). We also separately analyzed the corticosterone concentration in each experimental group. In mice injected with saline solution (Sham), AS, D40, D70 and D150, the centrifugation had no significant effect on the corticosterone concentration (Figure 2B, one-way ANOVA, p = 0.278). In conclusion, centrifugation at 2× g did not modify the plasma concentration of corticosterone in mice injected with fluorescent tracers.
3.2. Effects of Centrifugation on Extravasation of Fluorescent Dextrans in Brain
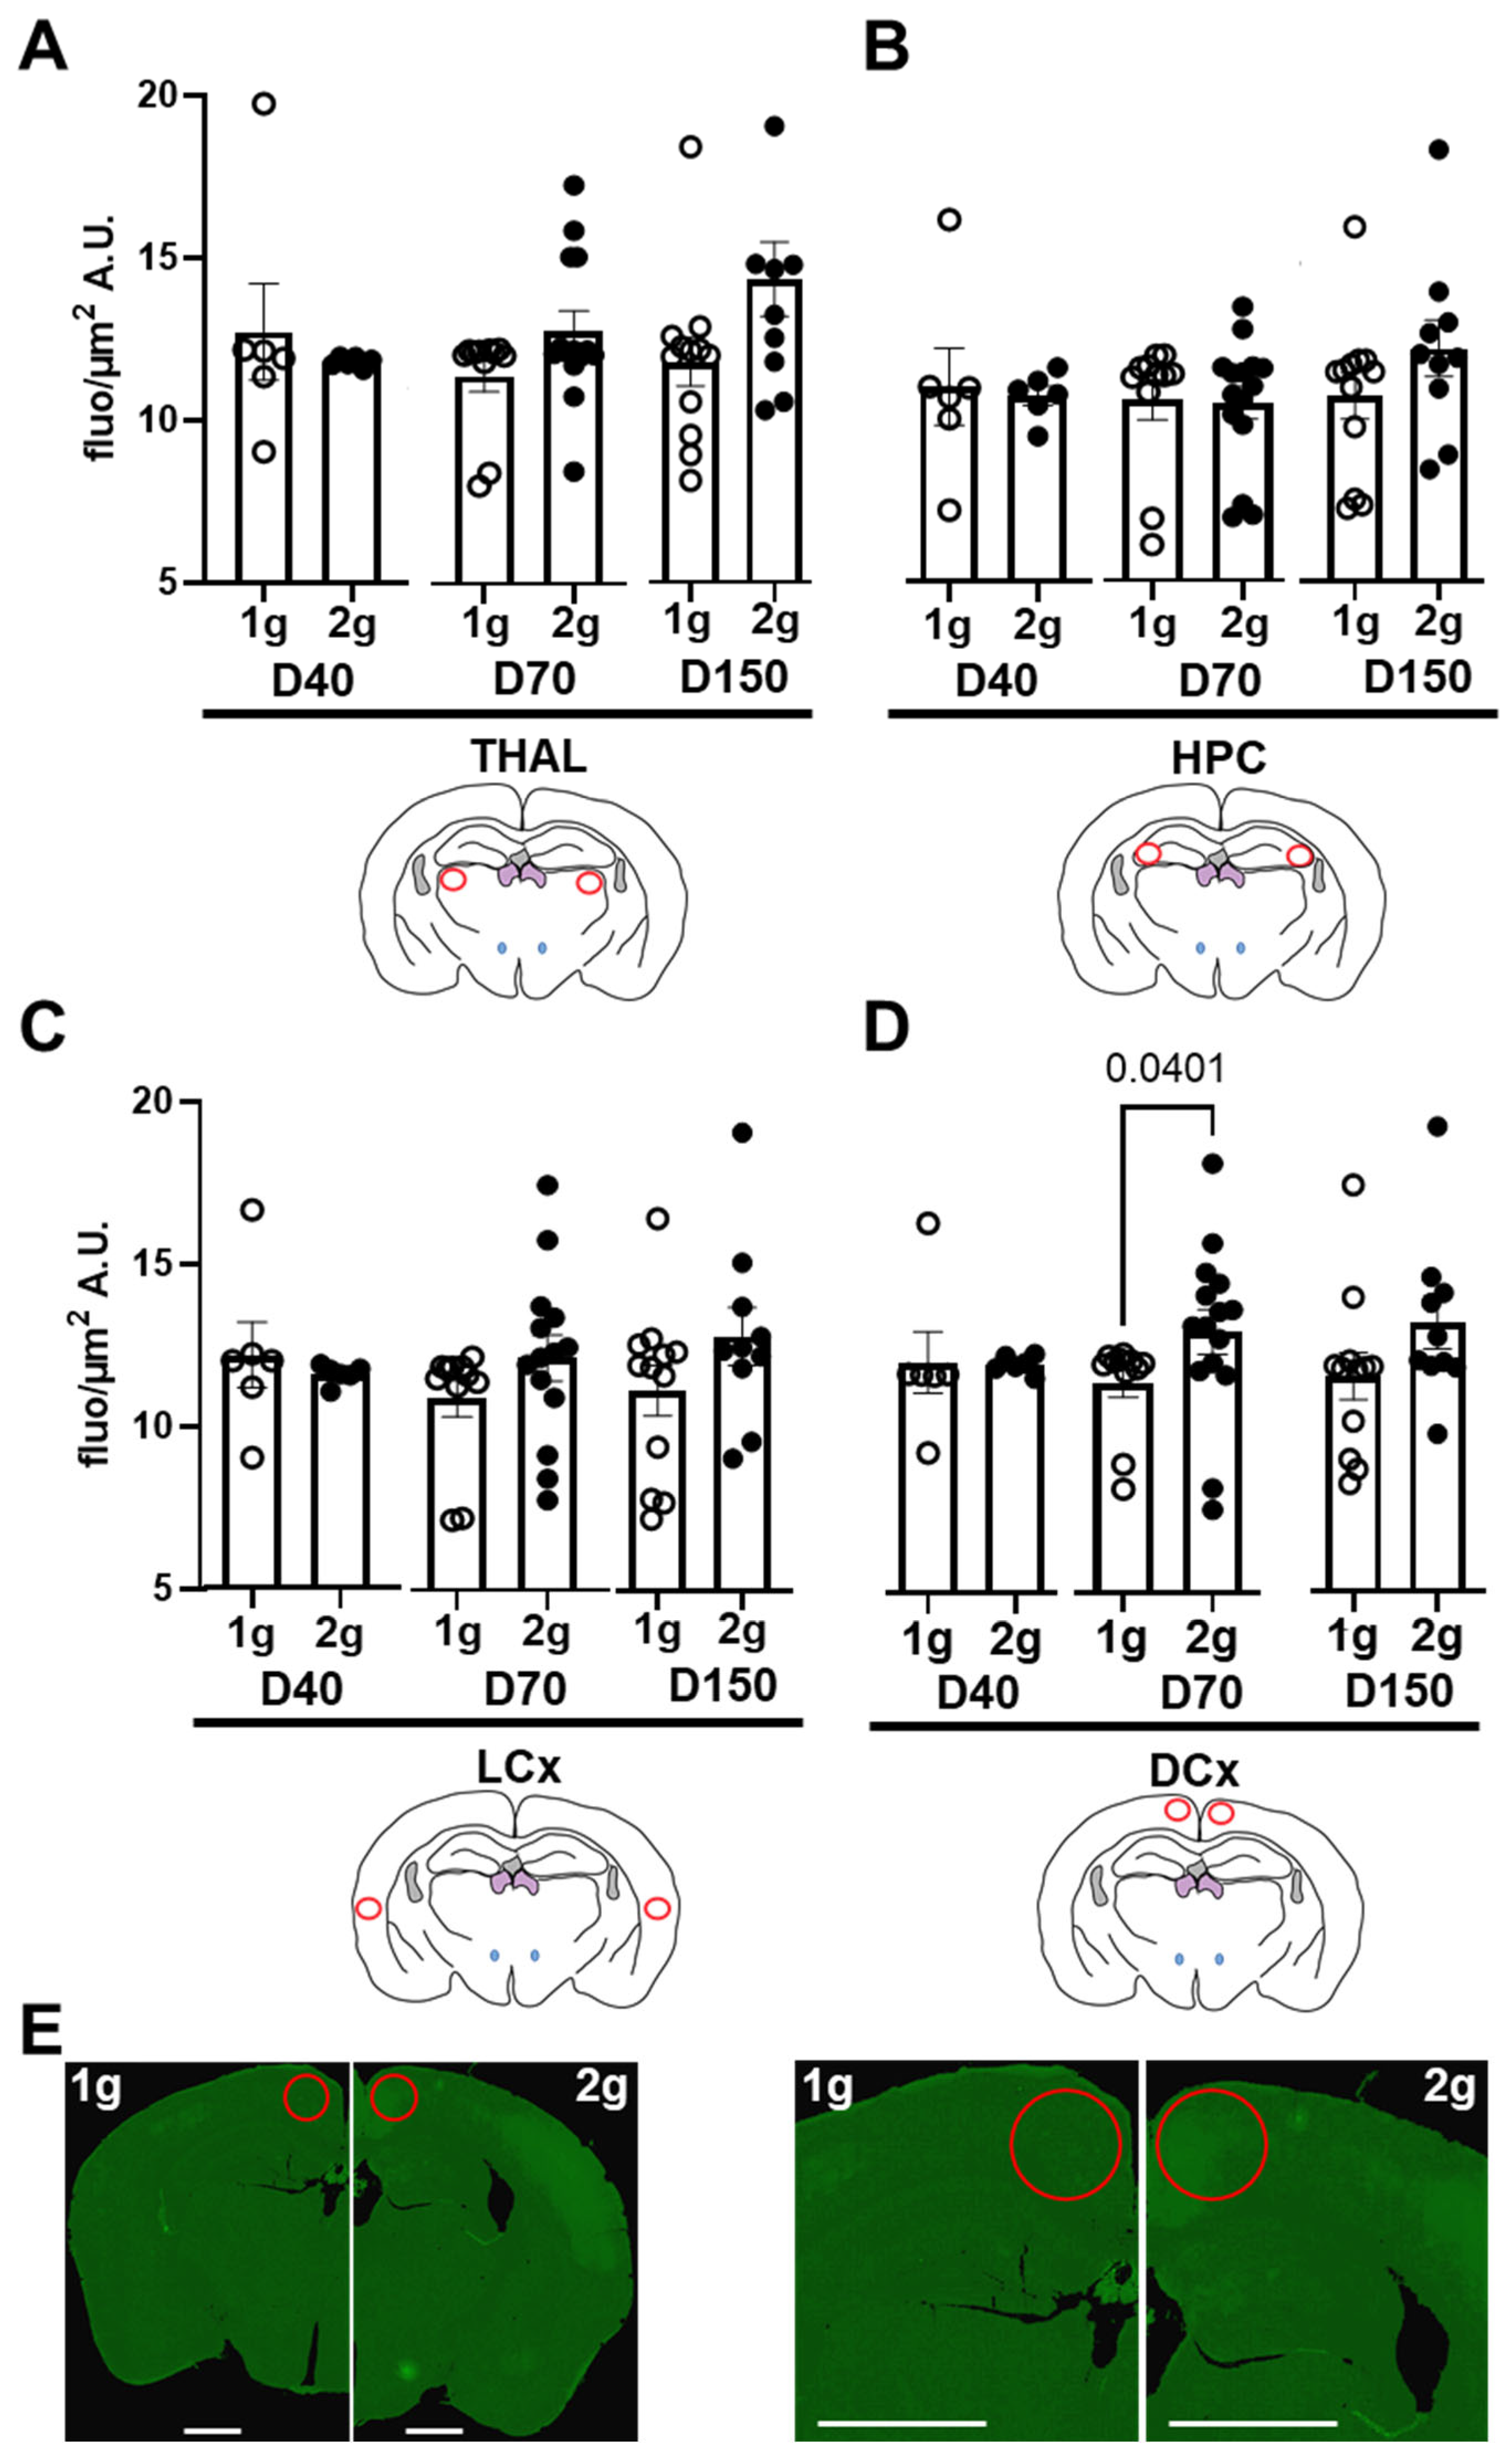
The extravasation of dextrans through the BBB were firstly evaluated by the analysis of fluorescence intensities of several brain areas. To minimize local variations, we performed all analyses on slices containing similar anatomical landmarks. The regions of interest were distributed in different cerebral areas (red ROI in thalamus, hippocampus and dorsal and lateral cortices, Figure 3).
The centrifugation was not able to modify the fluorescent levels in THAL (Figure 3A, Mann–Whitney tests comparing 1 g vs. 2 g conditions for D40, p = 0.93; for D70 p = 0.29 and for D150 p = 0.069), HPC (Figure 3B, Mann–Whitney tests comparing 1 g vs. 2 g conditions for D40 p = 0.53; for D70 p = 0.76 and for D150 p = 0.089) and LCx (Figure 3C, Mann–Whitney tests comparing 1 g vs. 2 g conditions for D40 p = 0.50; for D70 p = 0.08 and for D150 p = 0.16). In DCx, the hypergravity can increase the level of fluorescence only in D70 (Mann–Whitney tests comparing 1 g vs. 2 g conditions for D40 p = 0.051; for D70 p = 0.040 and for D150 p = 0.050; Figure 3D). The differences in D70 fluorescence across brain sections are illustrated in Figure 3E. More marked fluorescence diffusion is observed in the DCx of 2 g-exposed mice. In conclusion, these sets of data analysis suggested that centrifugation significantly increased the presence of D70 in DCx.
3.3. Effects of Centrifugation on Extravasation of Fluorescent AS in Liver
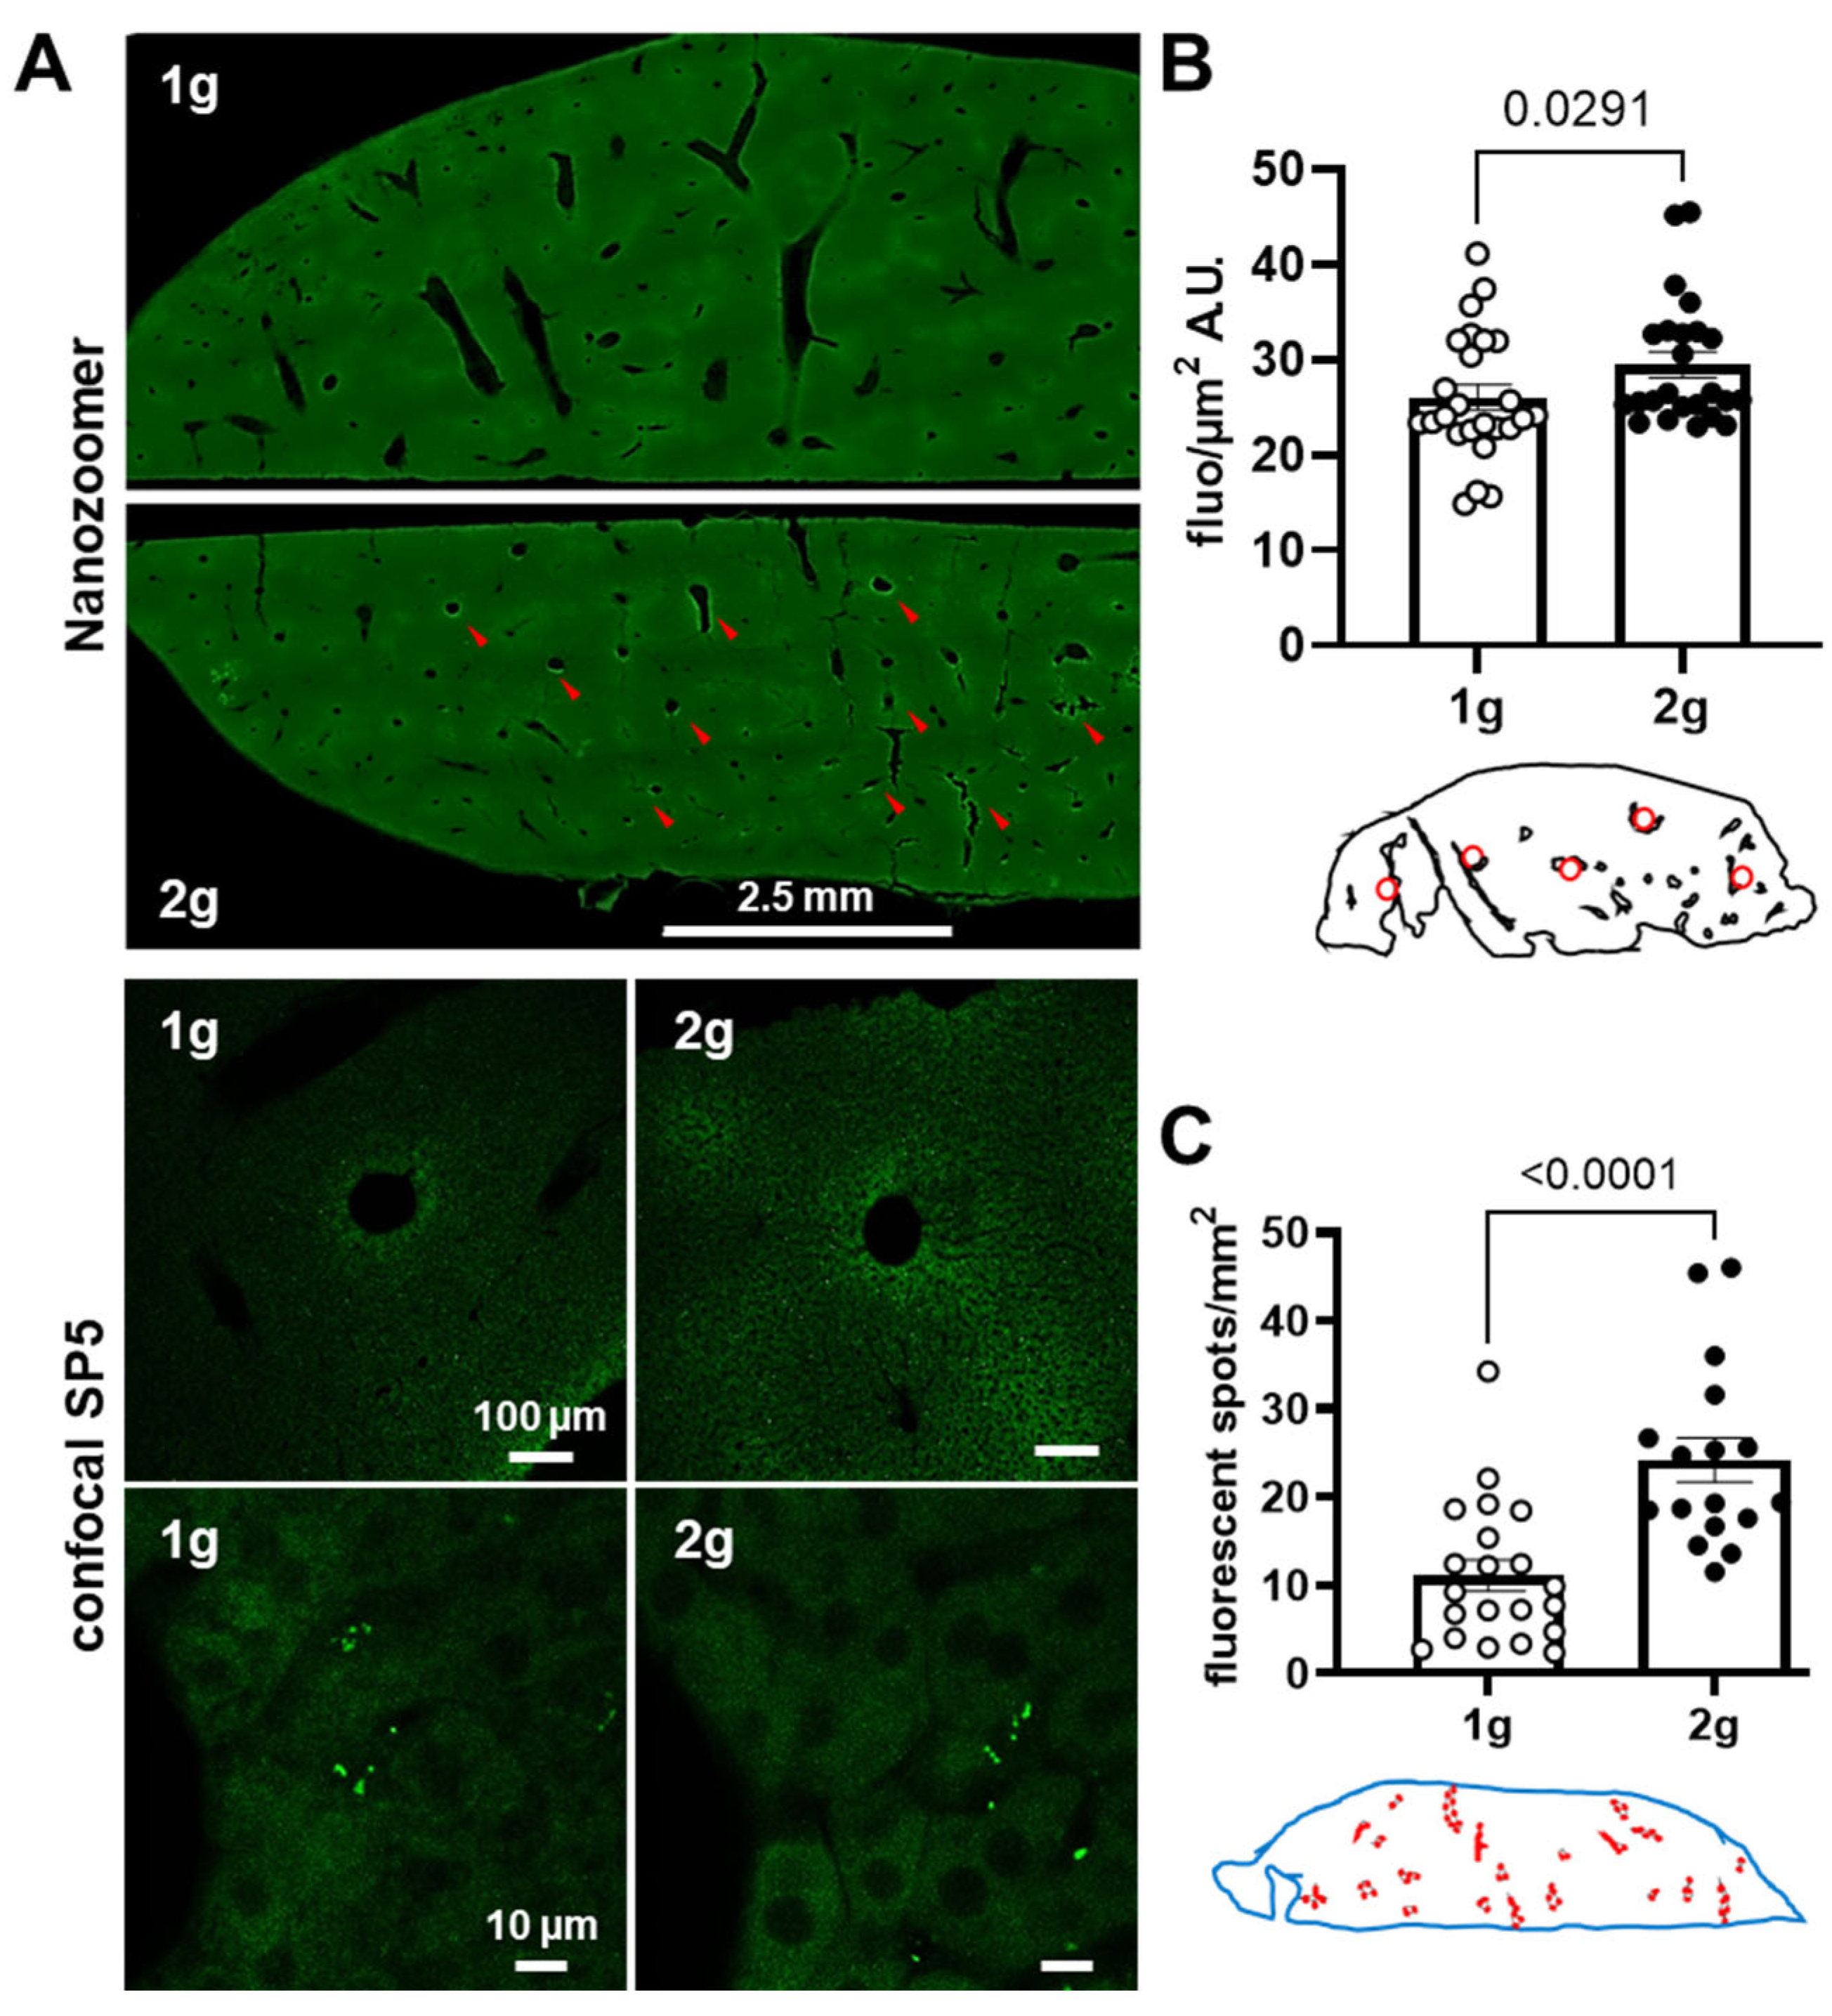
We tested the ability of hypergravity to promote the passage of a molecule that can be captured by liver parenchyma cells. To test this hypothesis, we injected mice with fluorescent antisense oligonucleotides and compared the 1 g and 2 g conditions. The same quantification methods used for dextrans were applied on images obtained with Nanozoomer (Figure 4A).
A significant increase in fluorescence in liver parenchyma was revealed in mice exposed to hypergravity (Figure 4B, Mann–Whitney tests, 1 g vs. 2 g p = 0.0291). Moreover, the number of areas containing fluorescence evaluated with QuPath was higher in 2 g in comparison with 1 g (Figure 4C, Mann–Whitney tests, 1 g vs. 2 g p < 0.0001). With confocal microscopy, the presence of AS was qualitatively revealed as spots of fluorescence close to vessel walls in the liver parenchyma. Taken together, these results strongly suggest that hypergravity increased the AS extravasation in the liver parenchyma.
3.4. Effects of Centrifugation on Extravasation of Fluorescent AS in Brain
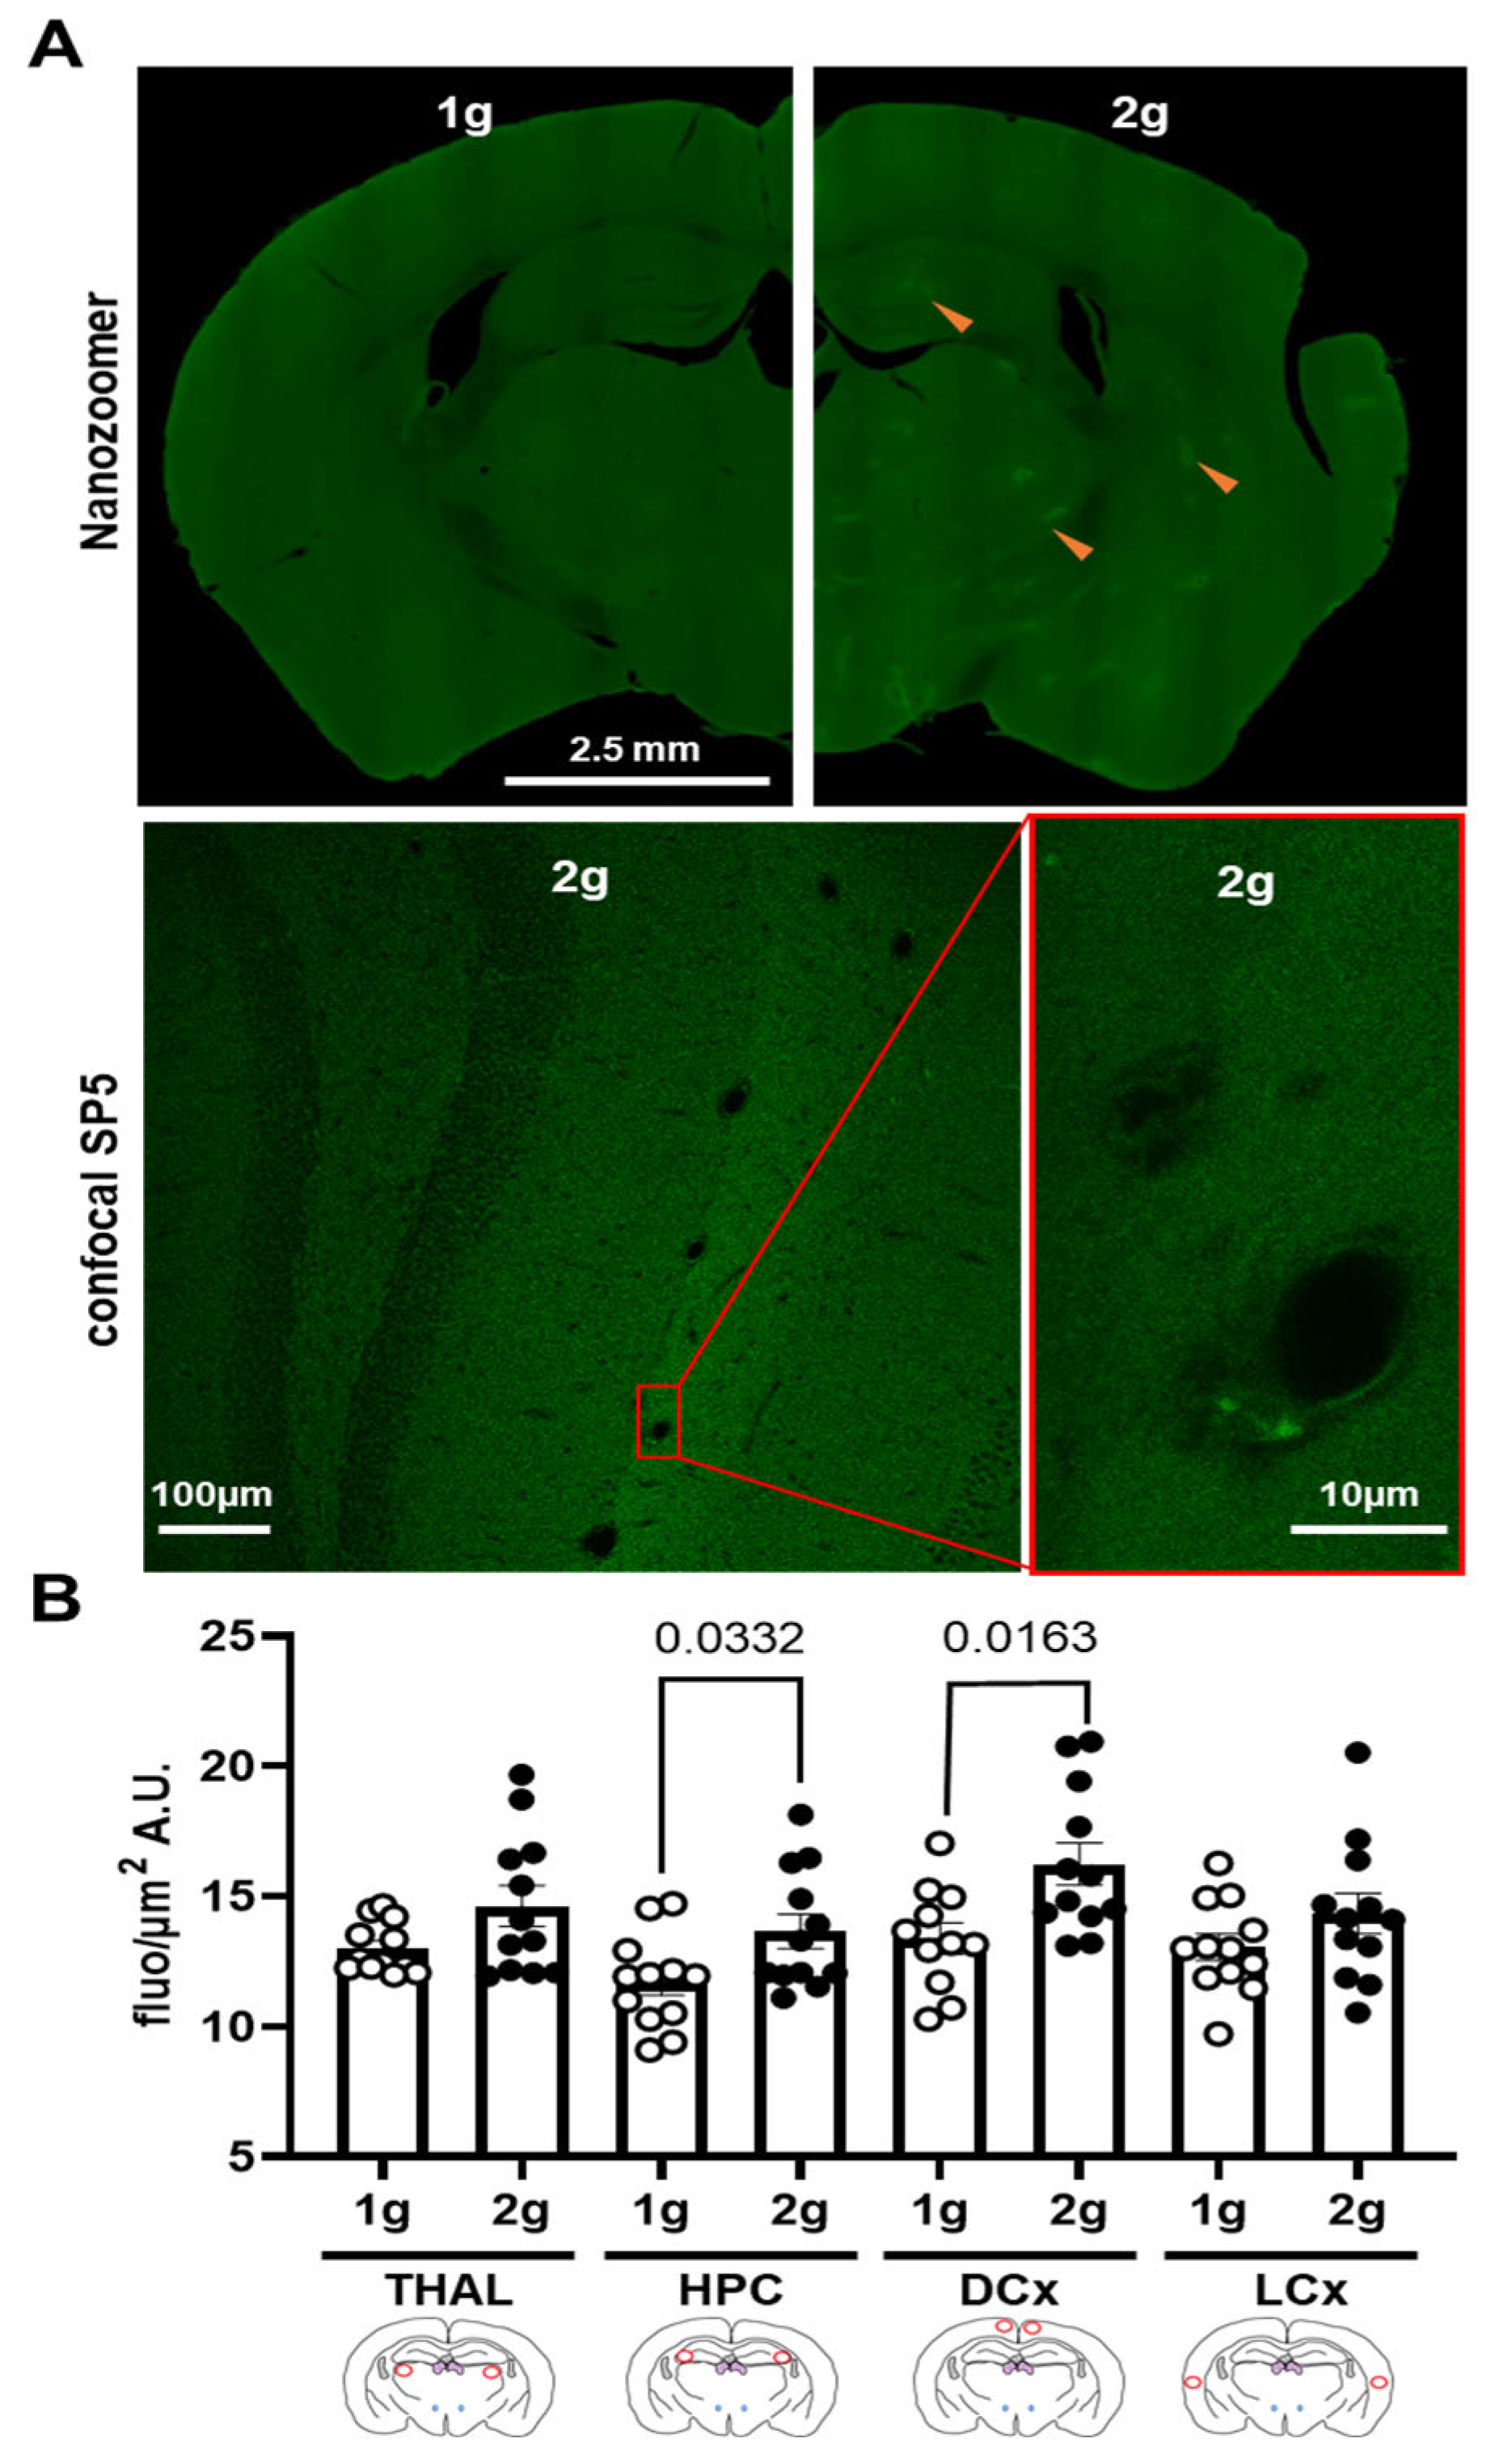
The qualitative analysis of images obtained with Nanozoomer and confocal SP5 showed fluorescent spots in the brain parenchyma only in slices from 2 g-exposed mice (Figure 5A and Figure 6A). The confocal images also revealed that these fluorescent spots were more localized in the brain parenchyma close to the vessel walls (Figure 5A, right panel).
The quantitative analyses of images from Nanozoomer showed an increase in fluorescence level in HPC and DCx due to hypergravity exposure (Mann–Whitney tests, 1 g vs. 2 g in THAL p = 0.369, in HPC p = 0.033, in DCx p = 0.016 and in LCx p = 0.265; Figure 5B).
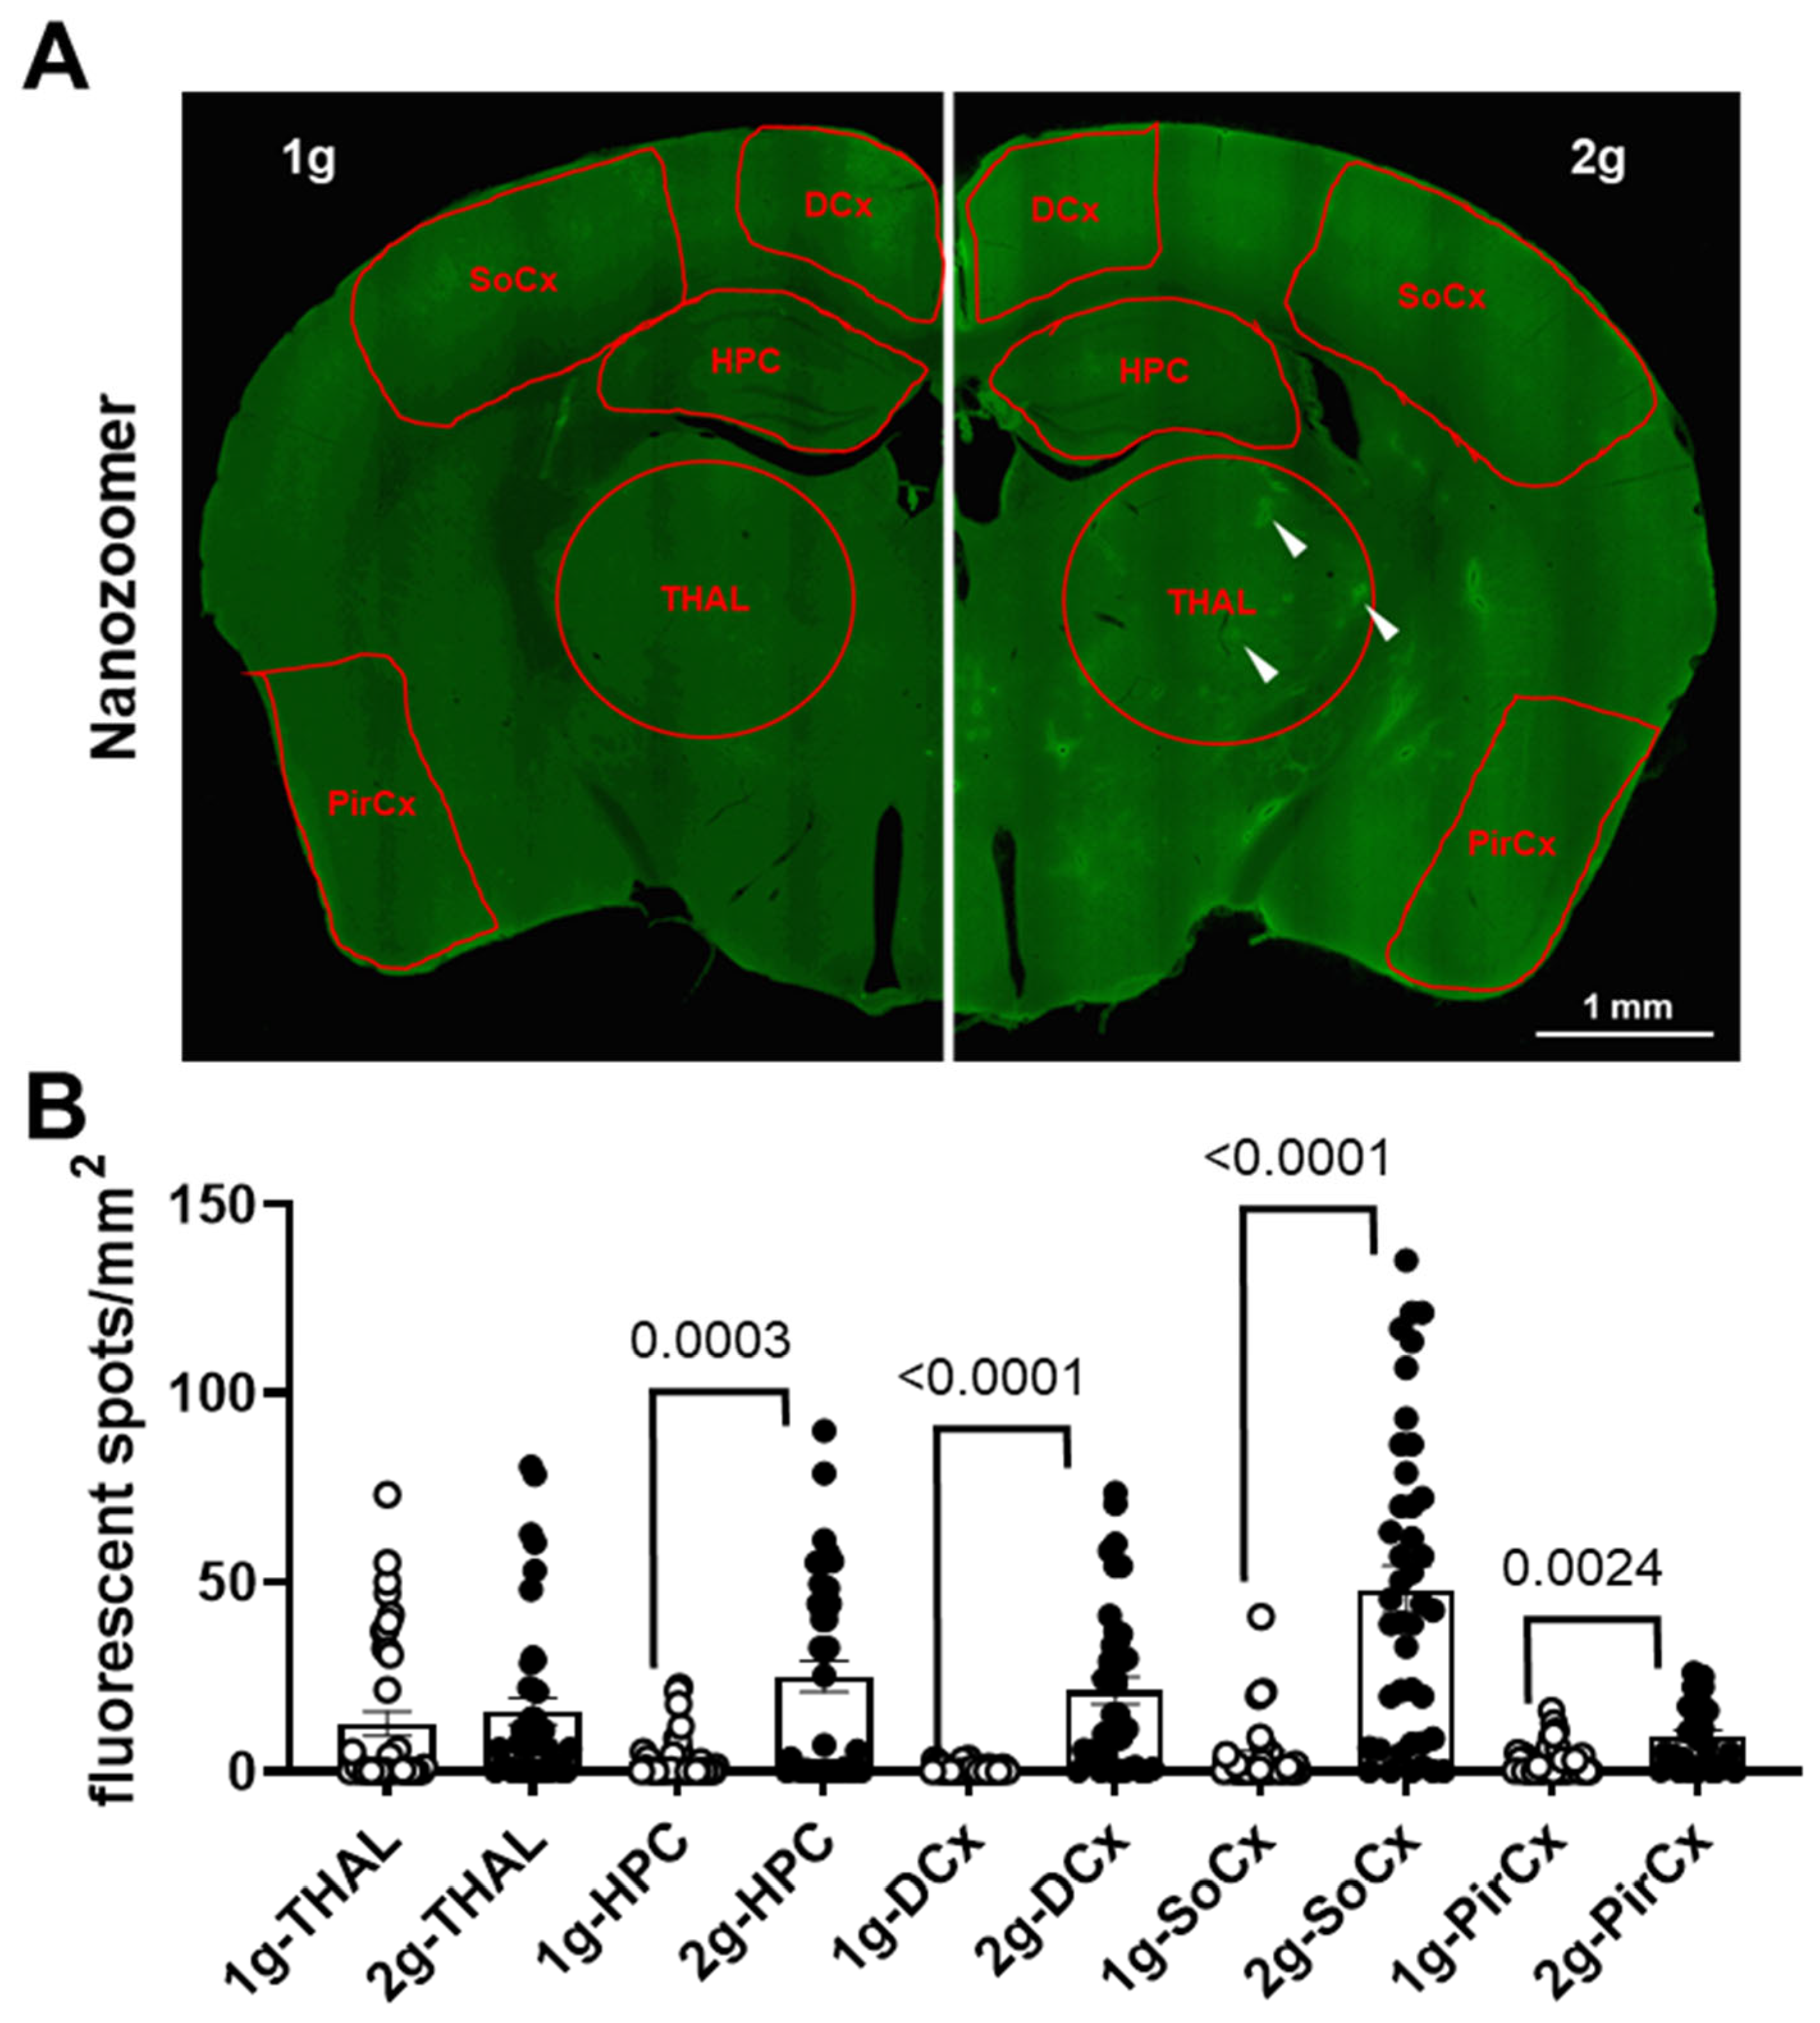
The analysis with QuPath software was used to segregate fluorescent areas from the background in several brain regions (Figure 6A) using the same filtering parameters in both 1 g and 2 g conditions. The analyses confirmed that the exposure to hypergravity increased the number of fluorescent spots in HPC and DCx, but not in THAL (Mann–Whitney tests, 1 g vs. 2 g in THAL p = 0.0536, in HPC p = 0.0003 and in DCx p < 0.0001; Figure 6B). Moreover, it also revealed an increase in the number of fluorescent spots in SoCx and PirCx (Mann–Whitney tests, 1 g vs. 2 g p <0.0001 and p = 0.0024, respectively; Figure 6B).
In conclusion, our data suggest that hypergravity induced a BBB leakage able to increase the presence of AS in brain parenchyma.
3.5. Effects of Centrifugation on Expression of Genes Involved in Endothelial Cells Interactions
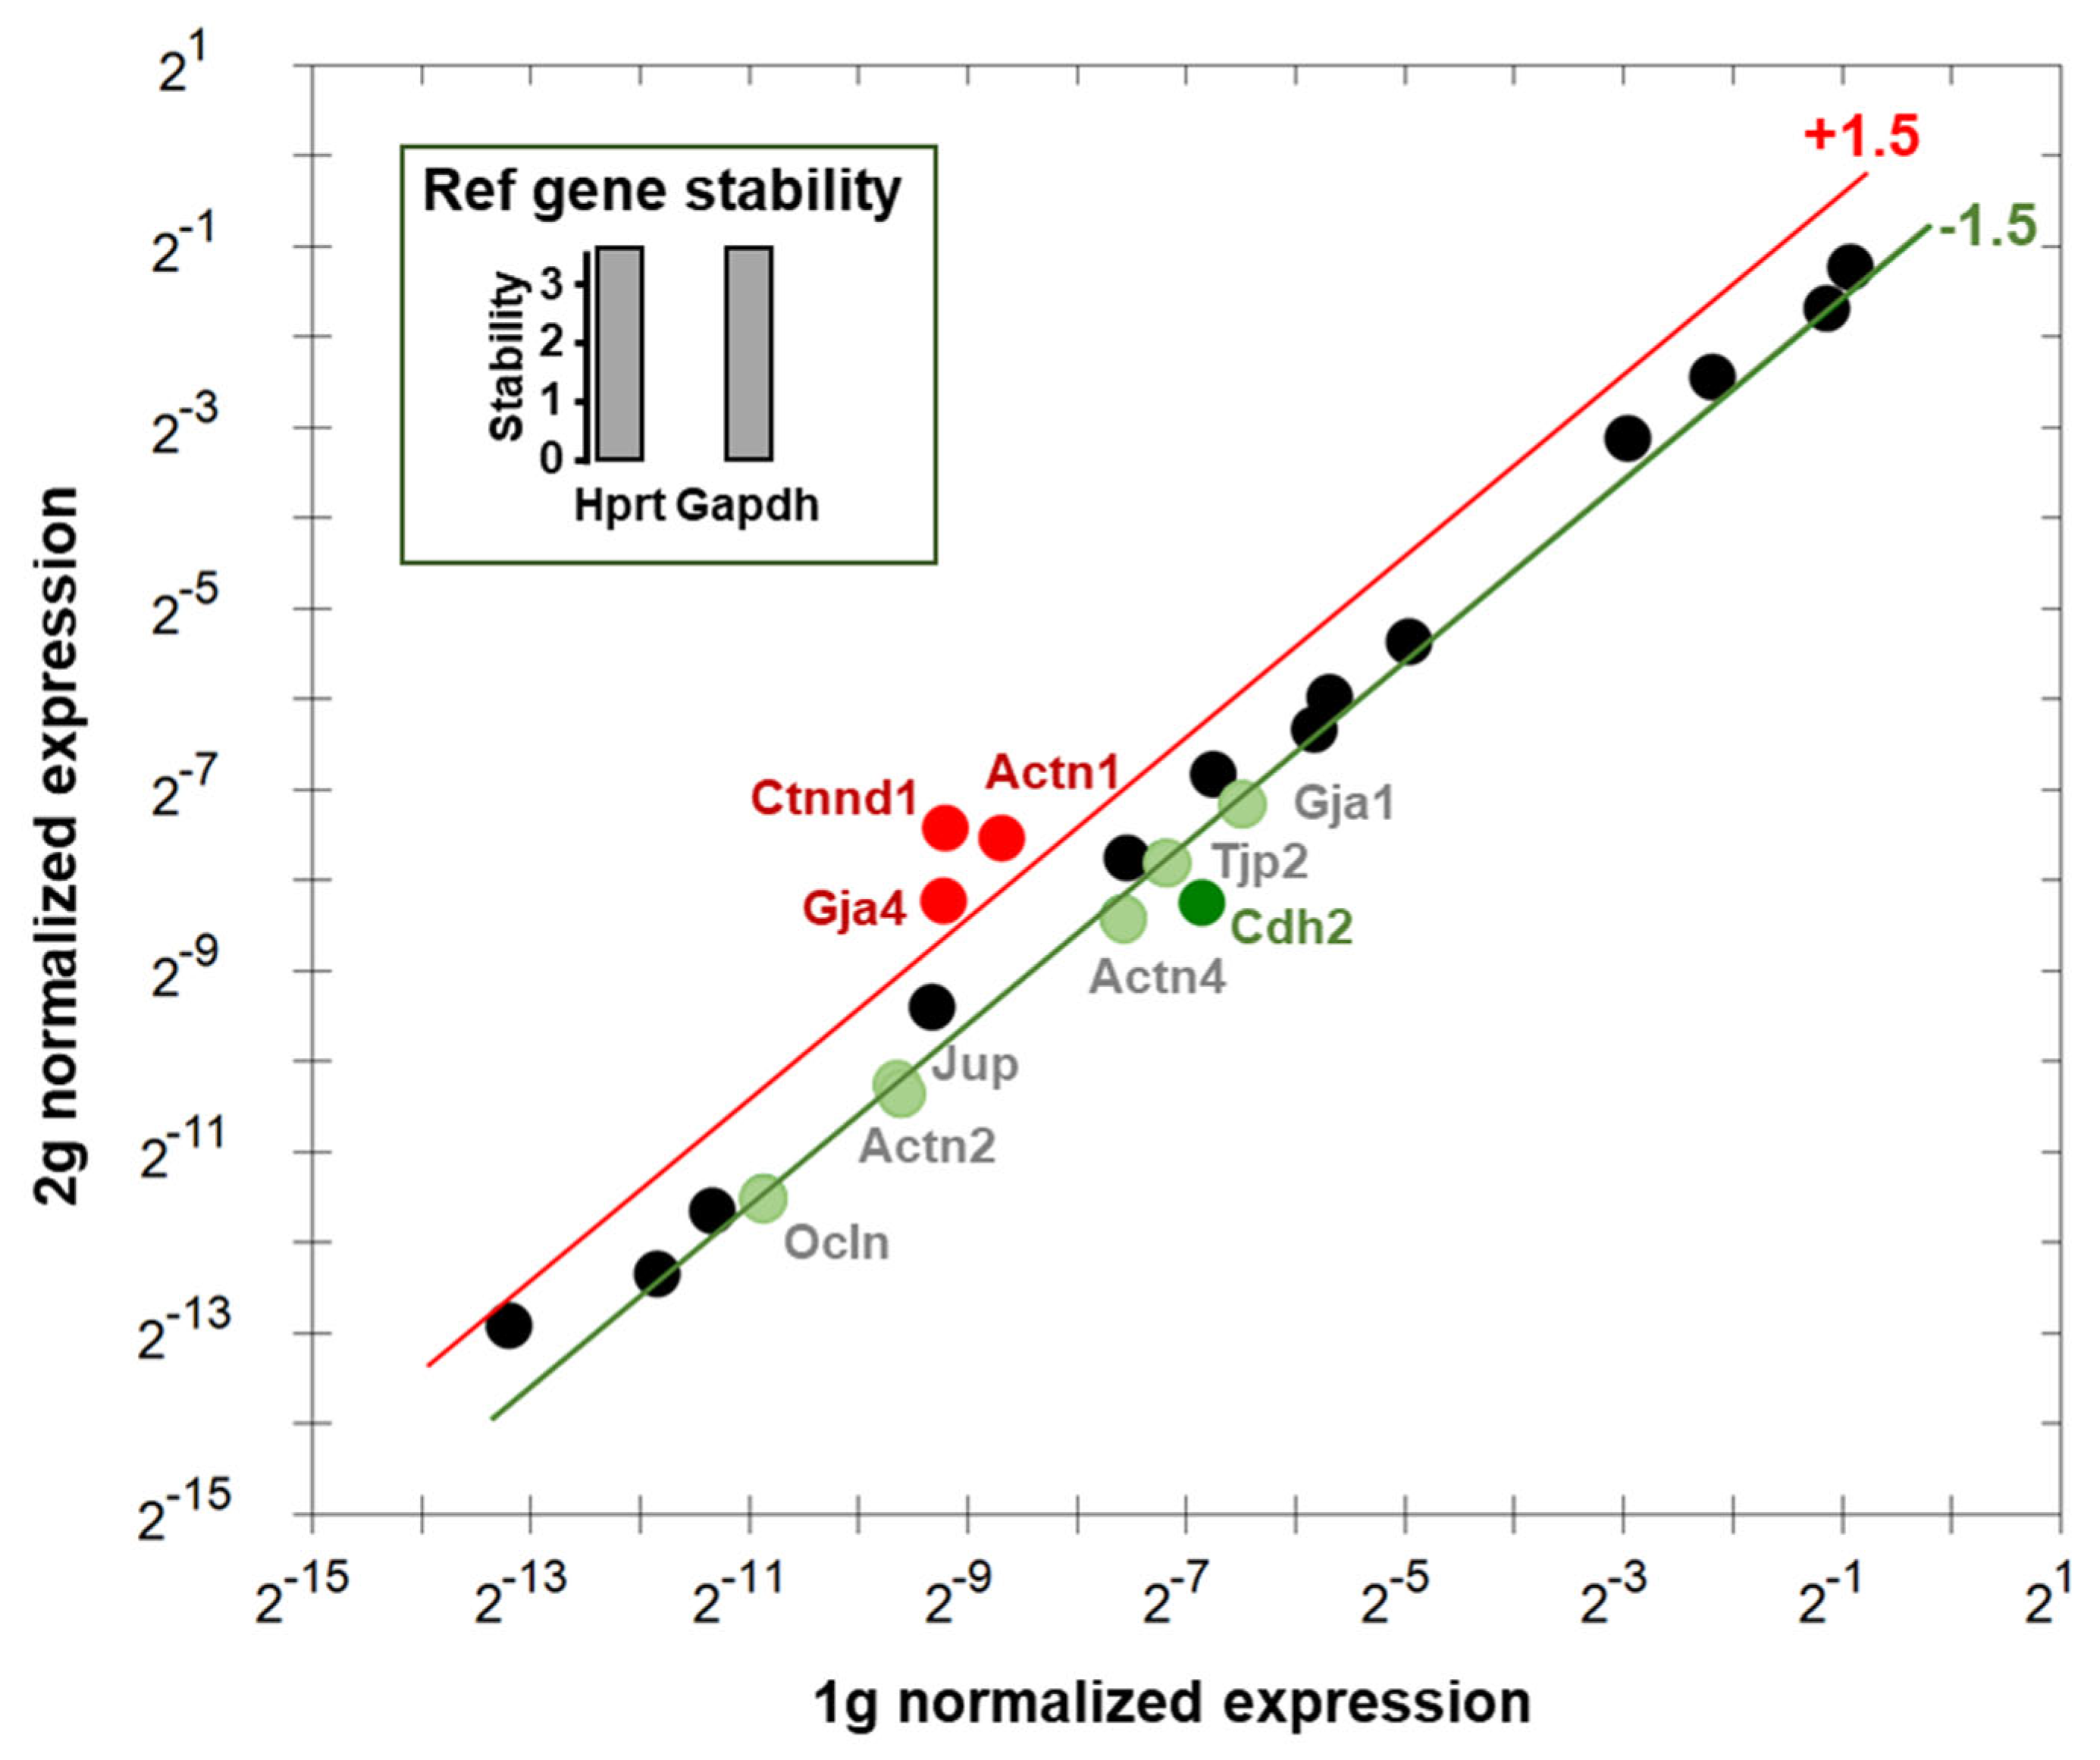
Using Hprt and Gapdh as reference genes, the RT-qPCR analysis of the expression of genes involved in the regulation of endothelial cells interactions revealed that Gja4, Ctnnd1 and Actn1 were upregulated. Cdh2 was downregulated more than 2-fold and Ocln, Actn2, Jup, Actn4, Tjp2 and Gja1 were downregulated between 1.5- and 2-fold (Figure 7). The expressions of Actb, Actg1, Cdh5, Cldn1, Cldn5, Ctnna1, Ctnnd1, Dsp, F11r, Gja5, Jam2, Tjp1 and Vim were considered not altered (less than 1.5-fold modification), and Cldn3 appeared not expressed. The names, functions and cell types expressing these genes are summarized in Table 1 and supplementary Table S1.
4. Discussion
In the present study, our results suggest that hypergravity induces an increase in BBB permeability, allowing the passage of antisense oligonucleotides as well as dextran from blood to brain parenchyma. Moreover, the RT-qPCR experiments suggested an alteration in the expression of genes involved in endothelial cell junctions.
In a ground model of hindlimb unloaded animals without [56] or in combination with radiation [57], as well as during spaceflight [58], the BBB was altered, suggesting that vestibular regulations were involved. As reviewed recently, the increase in gravity by centrifugation modifies vestibular function and induces motion sickness [59]. Our experiments confirm the decrease in body weight generated by centrifugation [18,60]. It is linked with the decrease in food intake [61], and probably linked to vestibular impairments [18,62].
Hypergravity exposure at 2 g increases the corticosterone concentration when it is measured during the first hour of exposure [63]. The increase in the hypergravity level can transiently increase the plasma corticosterone level [64]. Nevertheless, as our data showed, after 24 h of weak exposure at 2 g, the corticosterone levels were not altered in the first hour following the stop of the centrifuge [65]. The stress induced by the centrifugation is controversial and probably depends on the design of the centrifuge and experimental procedure with animals [18,27,63]. Moreover, our data showed a large spread of individual values of corticosterone concentration, confirming other studies [18,23,65].
In motion sickness, the relationship between brain and intestinal functions were known and clearly demonstrated, including microgravity and hypergravity models [66,67,68]. The most probable link is hypophagia. In mice and rats, the decrease in food intake was observed at the beginning of the 2 g exposure (first two days) and depended on the vestibular organ [18,69].
The hypophagia could have several causes, including: 1. modifications in microbiota [70] that can decrease the gastric acid synthesis [71], 2. metabolism dysregulation, such as decreases in leptin and insulin plasma concentrations [60] and 3. modifications in the expression of the starvation-induced genes [72]. Moreover, the serotonin pathways are involved in this phenomenon [69,73]. In conclusion, our results also confirm that the hypophagia induced a decrease in body weight. This is more related to the hypergravity and not related to an increase in corticosterone levels [30,60,62,65].
Fluorescent polysaccharides such as dextrans are safe at low concentrations, available in sizes from 3 to 2000 kDa. They can be used to study BBB permeability [74,75,76] and to determine the size of a BBB leak [77,78,79]. After 24 h exposure to 2 g hypergravity, our results demonstrated that 70 kDa dextran can be exported in cortex parenchyma, but not 40 or 150 kDa dextran. The lower molecular weight dextrans, the faster they are excreted. In fact, in less than one hour, dextrans between 30 and 40 kDa were excreted in urine, whereas the 62 kDa dextran was always present in the blood circulation and not highly present in urine [80]. This suggests that after 24 h, the 40 kDa dextran would be excreted. Thereby, the BBB leak required more than one hour of hypergravity exposure, confirming our previous data showing that short exposure (1–9 min at 5 g) was not efficient in destabilizing the BBB [65]. Because we cannot exclude an alteration in urine excretion of dextran in the hypergravity context, our data should be completed by the evaluation of the kinetics of dextran excretion in centrifuged mice.
Because of the molecule shape, 150 kDa dextran was unable to flow from the circulation to the tissues in physiological conditions [80]. Our results showed that the BBB leak is not sufficient for 150 kDa dextran extravasation, suggesting that this leak was not comparable to the BBB disruption induced by stroke or acute hypertension [81]. In our previous study [65], the extravasation of IgG (around 150 kDa) was measured, suggesting that the nature of the molecule is also a crucial parameter. Moreover, our data showing the extravasation of antisense oligonucleotide in the cortex and hippocampus confirm that the BBB properties depend on the brain areas and the chemical nature of the markers [82,83,84]. In conclusion, our results showed an increase in the transfer of fluorescent molecules from blood to tissues, suggesting a global modification in effluxes due to hypergravity.
To assess the alterations in the BBB in centrifuged mice, we focused the molecular investigation on gene expression using a set of primers targeting consensual genes involved in BBB efficacy. As reviewed recently [85,86], all of the proteins encoded by the genes studied here are involved in the scaffoldings required to maintain endothelial cell interactions to create the BBB, as well as in the initiation of angiogenesis and/or vascular repair. The database queries concerning the expression level in non-neuronal cells of the brain indicated that the proteins encoded by studied genes are also expressed in endothelial cells, but not exclusively (Supplementary Table S2). As expected, the modifications in gene expression are related to the durations of centrifugation and the levels of hypergravity, as suggested by the comparison between this current study and the RNAseq performed previously on the same device and the same mouse strains [29]. Moreover, the regulation of gene expression is not comparable to acute and chronic stress (Supplementary Table S3). Globally, the observed modifications could be interpreted as a specific dysregulation of gene expression that can alter the turnover and replacement of proteins involved in BBB efficacy as observed in BBB disruption models such as stroke, middle cerebral artery occlusion or hypoxia.
5. Conclusions
This work suggests that the modification in gravity, which is accompanied by a modification in the vestibular functions, leads to an alteration in the BBB via a modification in the expression of genes which code the proteins in the junctions between the endothelial cells. As now studied, an alteration in the BBB, and not its destruction, allows the passage of molecules defined by their sizes and their chemical natures. Our work insists on this point; an alteration in the BBB is characterized according to the means of study, i.e., markers and measurement methods. This can be considered in two antagonistic ways, either as a minimally invasive physical means of crossing the BBB by molecules of therapeutic interest or, on the contrary, as something deleterious that can be found in the pathology of alterations in vestibular functions during spaceflight. The most important limit of this study is that the RT-qPCR was performed on RNA extracted from whole brain, and the query of hipposeq.janelia.org indicated that we cannot exclude the alteration in molecular scaffolding of synapses also implicating these genes. Finally, our study can be considered an extension of studies relating to the effectiveness of molecules to modulate the passage across the BBB. In a hypergravity context, but also in other models of alteration in vestibular functions, the transduction pathways involved in alterations in the BBB should also be investigated. For example, the angiopoietin-2 pathway is crucial for endothelial cell disassembly [87], and GPCR internalization in endothelial cells [88] should be considered in the context of centrifugation. The last topic that we can investigate is the effects of gravity modulation on angiogenesis, which is required to renovate the endothelium and form new brain capillaries. In fact, experiments on cultured endothelial cells have suggested that hypergravity reduces their capacity to form tubes and alters their responses to angiogenic factors [48,49,50,51]. In centrifugation as well as during parabolic flights, the in vivo responses to angiogenic factors have not yet been investigated. Moreover, it has been shown that during the takeoff and landing of a space module (BION-M 1), hypergravity induces cardiovascular changes [89]. More experiments should be conducted to precise how these cardiovascular changes can modify the structure of the BBB and neurovascular unit functions. To restore physiological functions after spaceflight or bed-rest in humans, a daily sequence of short exposure to centrifugation close to 2× g has been proposed. It is crucial to verify if this protocol has any effect on the BBB. Recently, biomarkers of BBB alteration have been listed [90], and their investigation in the spaceflight context should be performed. Finally, centrifugation can be considered to potentiate vectorization and should be used to investigate cell functions with antisense oligonucleotides in pathophysiological contexts.
Supplementary Materials
The following supporting information can be downloaded at: https://www.mdpi.com/article/10.3390/cells12050734/s1. Comparisons between the RTqPCR data and queries of databases are organized in Supplementary Tables S1, S2 and S3. Table S1: List of genes modulated by 2 g, Table S2: Cell types expressing genes modified by 2 g exposure and Table S3: Comparison of gene expressions with database from [29].
Author Contributions
Conceptualization, J.-L.M. and D.D.; methodology, J.-L.M., A.V.-B. and D.D.; validation, J.-L.M., D.D. and T.P.; formal analysis, J.-L.M., D.D. and T.P.; investigation, J.-L.M., D.D. and T.P.; resources, J.-L.M. and D.D.; data curation, J.-L.M., D.D. and T.P.; writing—original draft preparation, J.-L.M. and D.D.; writing—review and editing, J.-L.M. and D.D.; supervision, and project administration J.-L.M. and D.D.; funding acquisition, J.-L.M. and D.D. All authors have read and agreed to the published version of the manuscript.
Funding
Fundings came from CNES (Centre national d’études spatiales, grants #4800001060, 4800001082, 4800001144 and 4800001182); CNRS (Centre national de la recherche scientifique); Université Paris Cité; Université de Bordeaux.
Institutional Review Board Statement
In accordance with the principles of the European community. The animal study protocol was approved by the Ethics Committee (CEEA-Loire) and the animal welfare committee of the University Jean Monnet, Saint Etienne, France, and the French Ministry of Research (protocol #11385, 10/10/2017). Protocols applied to mice were performed in PLEXAN, samples were treated and analyzed in INCC, UMR 8002 and INCIA, UMR 5287.
Informed Consent Statement
Not applicable.
Data Availability Statement
Data are available upon request from the corresponding authors.
Acknowledgments
We thank Laurence Vico for the access to SAINBIOSE U1059 facilities during centrifugation campaigns; Laurence Vico and Mathieu Beraneck for helpful discussions; Anne Prévot for reading the MS. The Nanozoomer imaging was conducted in the Bordeaux Imaging Center, a service unit of the CNRS-INSERM-Bordeaux University, member of the national infrastructure France BioImaging supported by the French National Research Agency (ANR-10-INBS-04). We thank Ghislaine Roux (PLEXAN) for technical assistance and breeding management. The results here have been presented in the Federation of European Neuroscience Societies congress, Paris 2022, and the German Neuroscience Society Meeting, Göttingen 2023.
Conflicts of Interest
The authors declare no conflict of interest. The funders had no role in the design of the study; in the collection, analyses, or interpretation of data; in the writing of the manuscript or in the decision to publish the results.
References
- Graybiel, A. Significance of vestibular organs in problems of weightlessness. Life Sci. Space Res. 1963, 1, 19–32. [Google Scholar] [PubMed]
- Lackner, J.R.; Dizio, P. Space motion sickness. Exp. Brain Res. 2006, 175, 377–399. [Google Scholar] [CrossRef] [PubMed]
- Gurovskiy, N.N.; Bryanov, I.I.; Yegorov, A.D. Changes in the vestibular function during space flight. Acta Astronaut. 1975, 2, 207–216. [Google Scholar] [CrossRef] [PubMed]
- Matsnev, E.I.; Yakovleva, I.Y.; Tarasov, I.K.; Alekseev, V.N.; Kornilova, L.N.; Mateev, A.D.; Gorgiladze, G.I. Space motion sickness: Phenomenology, countermeasures, and mechanisms. Aviat. Space Environ. Med. 1983, 54, 312–317. [Google Scholar]
- Gazenko, O.G.; Schulzhenko, E.B.; Grigoriev, A.I.; Atkov, O.Y.; Egorov, A.D. Review of basic medical results of the Salyut-7--Soyuz-T 8-month manned flight. Acta Astronaut. 1988, 17, 155–160. [Google Scholar] [CrossRef]
- Reschke, M.F.; Good, E.F.; Clément, G.R. Neurovestibular Symptoms in Astronauts Immediately after Space Shuttle and International Space Station Missions. OTO Open 2017, 1, 2473974X17738767. [Google Scholar] [CrossRef] [Green Version]
- Davis, J.R.; Vanderploeg, J.M.; Santy, P.A.; Jennings, R.T.; Stewart, D.F. Space motion sickness during 24 flights of the space shuttle. Aviat. Space Environ. Med. 1988, 59, 1185–1189. [Google Scholar]
- von Baumgarten, R.J.; Thumler, R. A model for vestibular function in altered gravitational states. Life Sci. Space Res. 1979, 17, 161–170. [Google Scholar]
- Golding, J.F.; Paillard, A.C.; Normand, H.; Besnard, S.; Denise, P. Prevalence, Predictors, and Prevention of Motion Sickness in Zero-G Parabolic Flights. Aerosp. Med. Hum. Perform. 2017, 88, 3–9. [Google Scholar] [CrossRef] [Green Version]
- Jirak, P.; Mirna, M.; Rezar, R.; Motloch, L.J.; Lichtenauer, M.; Jordan, J.; Binneboessel, S.; Tank, J.; Limper, U.; Jung, C. How spaceflight challenges human cardiovascular health. Eur. J. Prev. Cardiol. 2022, 29, 1399–1411. [Google Scholar] [CrossRef]
- Kermorgant, M.; Nasr, N.; Czosnyka, M.; Arvanitis, D.N.; Hélissen, O.; Senard, J.-M.; Traon, A.P.-L. Impacts of Microgravity Analogs to Spaceflight on Cerebral Autoregulation. Front. Physiol. 2020, 11, 778. [Google Scholar] [CrossRef] [PubMed]
- Baran, R.; Marchal, S.; Campos, S.G.; Rehnberg, E.; Tabury, K.; Baselet, B.; Wehland, M.; Grimm, D.; Baatout, S. The Cardiovascular System in Space: Focus on In Vivo and In Vitro Studies. Biomedicines 2022, 10, 59. [Google Scholar] [CrossRef] [PubMed]
- Dabertrand, F.; Porte, Y.; Macrez, N.; Morel, J.-L. Spaceflight regulates ryanodine receptor subtype 1 in portal vein myocytes in the opposite way of hypertension. J. Appl. Physiol. 2012, 112, 471–480. [Google Scholar] [CrossRef] [PubMed] [Green Version]
- Delp, M.D.; Charvat, J.M.; Limoli, C.L.; Globus, R.K.; Ghosh, P. Apollo Lunar Astronauts Show Higher Cardiovascular Disease Mortality: Possible Deep Space Radiation Effects on the Vascular Endothelium. Sci. Rep. 2016, 6, 29901. Available online: http://www.nature.com/articles/srep29901 (accessed on 20 June 2019). [CrossRef] [Green Version]
- Morel, J.-L.; Boittin, F.-X.; Halet, G.; Arnaudeau, S.; Mironneau, C.; Mironneau, J. Effect of a 14-day hindlimb suspension on cytosolic Ca2+ concentration in rat portal vein myocytes. Am. J. Physiol. Circ. Physiol. 1997, 273, H2867–H2875. [Google Scholar] [CrossRef]
- Navasiolava, N.M.; Dignat-George, F.; Sabatier, F.; Larina, I.M.; Demiot, C.; Fortrat, J.-O.; Gauquelin-Koch, G.; Kozlovskaya, I.B.; Custaud, M.-A. Enforced physical inactivity increases endothelial microparticle levels in healthy volunteers. Am. J. Physiol. Circ. Physiol. 2010, 299, H248–H256. [Google Scholar] [CrossRef]
- Sofronova, S.I.; Tarasova, O.S.; Gaynullina, D.; Borzykh, A.A.; Behnke, B.J.; Stabley, J.N.; McCullough, D.J.; Maraj, J.J.; Hanna, M.; Muller-Delp, J.M.; et al. Spaceflight on the Bion-M1 biosatellite alters cerebral artery vasomotor and mechanical properties in mice. J. Appl. Physiol. 2015, 118, 830–838. [Google Scholar] [CrossRef] [Green Version]
- Abe, C.; Katayama, C.; Horii, K.; Ogawa, B.; Ohbayashi, K.; Iwasaki, Y.; Nin, F.; Morita, H. Hypergravity load-induced hyperglycemia occurs due to hypothermia and increased plasma corticosterone level in mice. J. Physiol. Sci. 2022, 72, 18. [Google Scholar] [CrossRef]
- Iwasaki, K.-I.; Shiozawa, T.; Kamiya, A.; Michikami, D.; Hirayanagi, K.; Yajima, K.; Iwase, S.; Mano, T. Hypergravity exercise against bed rest induced changes in cardiac autonomic control. Eur. J. Appl. Physiol. 2005, 94, 285–291. [Google Scholar] [CrossRef]
- Iwasaki, K.I.; Sasaki, T.; Hirayanagi, K.; Yajima, K. Usefulness of daily +2Gz load as a countermeasure against physiological problems during weightlessness. Acta Astronaut. 2001, 49, 227–235. [Google Scholar] [CrossRef]
- Sasaki, T.; Iwasaki, K.I.; Hirayanagi, K.; Yamaguchi, N.; Miyamoto, A.; Yajima, K. Effects of daily 2-Gz load on human cardiovascular function during weightlessness simulation using 4-day head-down bed rest. Uchu Koku Kankyo Igaku 1999, 36, 113–123. [Google Scholar] [PubMed]
- Young, L.R.; Paloski, W.H. Short radius intermittent centrifugation as a countermeasure to bed-rest and 0-G deconditioning: IMAG pilot study summary and recommendations for research. J. Gravit. Physiol. 2007, 14, P31–P33. [Google Scholar]
- Beraneck, M.; Bojados, M.; Le Séac’H, A.; Jamon, M.; Vidal, P.-P. Ontogeny of Mouse Vestibulo-Ocular Reflex Following Genetic or Environmental Alteration of Gravity Sensing. PLoS ONE 2012, 7, e40414. [Google Scholar] [CrossRef] [PubMed] [Green Version]
- Idoux, E.; Tagliabue, M.; Beraneck, M. No Gain No Pain: Relations Between Vestibulo-Ocular Reflexes and Motion Sickness in Mice. Front. Neurol. 2018, 9, 918. Available online: https://www.frontiersin.org/article/10.3389/fneur.2018.00918/full (accessed on 9 November 2019). [CrossRef] [PubMed] [Green Version]
- Sebastian, C.; Horn, E.; Eβeling, K.; Neubert, J. Readaptation of the vestibuloocular reflex to 1g-Condition in immature lower vertebrates (Xenopus laevis) after micro- or hypergravity exposure. Acta Astronaut. 1995, 36, 487–503. [Google Scholar] [CrossRef] [PubMed]
- Sebastian, C.E.; Pfau, K.; Horn, E.R. An age-dependent sensitivity of the roll-induced vestibuloocular reflex to hypergravity exposure of several days in an amphibian (Xenopus laevis). Acta Astronaut. 1998, 42, 419–430. [Google Scholar] [CrossRef]
- Horii, A.; Mitani, K.; Masumura, C.; Uno, A.; Imai, T.; Morita, Y.; Takahashi, K.; Kitahara, T.; Inohara, H. Hippocampal gene expression, serum cortisol level, and spatial memory in rats exposed to hypergravity. J. Vestib. Res. 2017, 27, 209–215. [Google Scholar] [CrossRef]
- Kawakami, S.; Kashiwagi, K.; Furuno, N.; Yamashita, M.; Kashiwagi, A. Effects of hypergravity environments on amphibian development, gene expression and apoptosis. Comp. Biochem. Physiol. A Mol. Integr. Physiol. 2006, 145, 65–72. [Google Scholar] [CrossRef] [Green Version]
- Pulga, A.; Porte, Y.; Morel, J.-L. Changes in C57BL6 Mouse Hippocampal Transcriptome Induced by Hypergravity Mimic Acute Corticosterone-Induced Stress. Front. Mol. Neurosci. 2016, 9, 153. [Google Scholar] [CrossRef] [Green Version]
- Guéguinou, N.; Bojados, M.; Jamon, M.; Derradji, H.; Baatout, S.; Tschirhart, E.; Frippiat, J.-P.; Legrand-Frossi, C. Stress response and humoral immune system alterations related to chronic hypergravity in mice. Psychoneuroendocrinology 2012, 37, 137–147. [Google Scholar] [CrossRef]
- Lee, J.; Jang, D.; Jeong, H.; Kim, K.S.; Yang, S. Impairment of synaptic plasticity and novel object recognition in the hypergravity-exposed rats. Sci. Rep. 2020, 10, 15813. [Google Scholar] [CrossRef]
- Porte, Y.; Morel, J.L. Learning on Jupiter, learning on the Moon: The dark side of the G-force. Effects of gravity changes on neurovascular unit and modulation of learning and memory. Front Behav. Neurosci. 2012, 6, 64. [Google Scholar] [CrossRef] [PubMed] [Green Version]
- Buytaert, K.I.; MacDougall, H.G.; Moore, S.T.; Clement, G.; Pattyn, N.; Migeotte, P.F.; Wuyts, F.L. Validation of centrifugation as a countermeasure for otolith deconditioning during spaceflight: Preliminary data of the ESA SPIN study. J. Vestib. Res. 2013, 23, 23–31. [Google Scholar] [CrossRef] [PubMed]
- Evans, J.M.; Knapp, C.F.; Goswami, N. Artificial Gravity as a Countermeasure to the Cardiovascular Deconditioning of Spaceflight: Gender Perspectives. Front. Physiol. 2018, 9, 716. Available online: https://www.frontiersin.org/article/10.3389/fphys.2018.00716/full (accessed on 6 June 2019). [CrossRef] [PubMed]
- Sweeney, M.D.; Zhao, Z.; Montagne, A.; Nelson, A.R.; Zlokovic, B.V. Blood-Brain Barrier: From Physiology to Disease and Back. Physiol. Rev. 2019, 99, 21–78. [Google Scholar] [CrossRef]
- Wardlaw, J.M.; Benveniste, H.; Nedergaard, M.; Zlokovic, B.V.; Mestre, H.; Lee, H.; Doubal, F.N.; Brown, R.; Ramirez, J.; MacIntosh, B.J.; et al. Perivascular spaces in the brain: Anatomy, physiology and pathology. Nat. Rev. Neurol. 2020, 16, 137–153. [Google Scholar] [CrossRef]
- Cuddapah, V.A.; Zhang, S.L.; Sehgal, A. Regulation of the Blood–Brain Barrier by Circadian Rhythms and Sleep. Trends Neurosci. 2019, 42, 500–510. [Google Scholar] [CrossRef] [Green Version]
- Pan, W.; Kastin, A.J. The Blood-Brain Barrier: Regulatory Roles in Wakefulness and Sleep. Neuroscientist 2017, 23, 124–136. [Google Scholar] [CrossRef]
- Zhang, S.L.; Lahens, N.F.; Yue, Z.; Arnold, D.M.; Pakstis, P.P.; Schwarz, J.E.; Sehgal, A. A circadian clock regulates efflux by the blood-brain barrier in mice and human cells. Nat. Commun. 2021, 12, 617. [Google Scholar] [CrossRef]
- Zhang, S.L.; Yue, Z.; Arnold, D.M.; Artiushin, G.; Sehgal, A. A Circadian Clock in the Blood-Brain Barrier Regulates Xenobiotic Efflux. Cell 2018, 173, 130–139.e10. [Google Scholar] [CrossRef] [Green Version]
- Montagne, A.; Nikolakopoulou, A.M.; Zhao, Z.; Sagare, A.P.; Si, G.; Lazic, D.; Barnes, S.R.; Daianu, M.; Ramanathan, A.; Go, A.; et al. Pericyte degeneration causes white matter dysfunction in the mouse central nervous system. Nat. Med. 2018, 24, 326–337. [Google Scholar] [CrossRef] [PubMed]
- Nation, D.A.; Sweeney, M.D.; Montagne, A.; Sagare, A.P.; D’Orazio, L.M.; Pachicano, M.; Sepehrband, F.; Nelson, A.R.; Buennagel, D.P.; Harrington, M.G.; et al. Blood–brain barrier breakdown is an early biomarker of human cognitive dysfunction. Nat. Med. 2019, 25, 270–276. [Google Scholar] [CrossRef] [PubMed]
- Nikolakopoulou, A.M.; Wang, Y.; Ma, Q.; Sagare, A.P.; Montagne, A.; Huuskonen, M.T.; Rege, S.V.; Kisler, K.; Dai, Z.; Körbelin, J.; et al. Endothelial LRP1 protects against neurodegeneration by blocking cyclophilin A. J. Exp. Med. 2021, 218. [Google Scholar] [CrossRef] [PubMed]
- Sweeney, M.D.; Montagne, A.; Sagare, A.P.; Nation, D.A.; Schneider, L.S.; Chui, H.C.; Harrington, M.G.; Pa, J.; Law, M.; Wang, D.J.J.; et al. Vascular dysfunction—The disregarded partner of Alzheimer’s disease. Alzheimer’s Dement. 2019, 15, 158–167. [Google Scholar] [CrossRef] [PubMed] [Green Version]
- Maier, J.A.M.; Cialdai, F.; Monici, M.; Morbidelli, L. The Impact of Microgravity and Hypergravity on Endothelial Cells. BioMed Res. Int. 2015, 2015, 434803. [Google Scholar] [CrossRef] [PubMed] [Green Version]
- Bors, L.A.; Erdő, F. Overcoming the Blood–Brain Barrier. Challenges and Tricks for CNS Drug Delivery. Sci. Pharm. 2019, 87, 6. [Google Scholar] [CrossRef] [Green Version]
- Bauer, J.; Bussen, M.; Wise, P.; Wehland, M.; Schneider, S.; Grimm, D. Searching the literature for proteins facilitates the identification of biological processes, if advanced methods of analysis are linked: A case study on microgravity-caused changes in cells. Expert Rev. Proteom. 2016, 13, 697–705. [Google Scholar] [CrossRef]
- Costa-Almeida, R.; Carvalho, D.T.O.; Ferreira, M.J.S.; Aresta, G.; Gomes, M.E.; van Loon, J.J.W.A.; Van der Heiden, K.; Granja, P.L. Effects of hypergravity on the angiogenic potential of endothelial cells. J. R. Soc. Interface 2016, 13, 20160688. [Google Scholar] [CrossRef] [Green Version]
- De Cesari, C.; Barravecchia, I.; Pyankova, O.V.; Vezza, M.; Germani, M.M.; Scebba, F.; van Loon, J.J.; Angeloni, D. Hypergravity Activates a Pro-Angiogenic Homeostatic Response by Human Capillary Endothelial Cells. Int. J. Mol. Sci. 2020, 21, 2354. [Google Scholar] [CrossRef] [Green Version]
- Spisni, E.; Bianco, M.C.; Blasi, F.; Santi, S.; Riccio, M.; Toni, M.; Griffoni, C.; Tomasi, V. Hypergravity impairs angiogenic response of in vitro cultured human primary endothelial cells. J. Gravit. Physiol. 2002, 9, P285–P286. [Google Scholar]
- Wehland, M.; Ma, X.; Braun, M.; Hauslage, J.; Hemmersbach, R.; Bauer, J.; Grosse, J.; Infanger, M.; Grimm, D. The Impact of Altered Gravity and Vibration on Endothelial Cells During a Parabolic Flight. Cell. Physiol. Biochem. 2013, 31, 432–451. [Google Scholar] [CrossRef]
- Szulcek, R.; Van Bezu, J.; Boonstra, J.; Van Loon, J.J.W.A.; van Nieuw Amerongen, G.P. Transient Intervals of Hyper-Gravity Enhance Endothelial Barrier Integrity: Impact of Mechanical and Gravitational Forces Measured Electrically. PLoS ONE 2015, 10, e0144269. [Google Scholar] [CrossRef] [PubMed]
- Kim, D.; Kwon, S. Mechanical load increase–induced changes in cytoskeletal structure and cellular barrier function in human cerebral endothelial cells. Biotechnol. Bioeng. 2018, 115, 2624–2631. [Google Scholar] [CrossRef]
- Paxinos and Franklin’s the Mouse Brain in Stereotaxic Coordinates, Compact—5th Edition. Available online: https://www.elsevier.com/books/paxinos-and-franklins-the-mouse-brain-in-stereotaxic-coordinates-compact/franklin/978-0-12-816159-3 (accessed on 7 July 2022).
- Ovadia, H.; Abramsky, O.; Feldman, S.; Weidenfeld, J. Evaluation of the effect of stress on the blood–brain barrier: Critical role of the brain perfusion time. Brain Res. 2001, 905, 21–25. [Google Scholar] [CrossRef]
- Yan, R.; Liu, H.; Lv, F.; Deng, Y.; Li, Y. Rac1/Wave2/Arp3 Pathway Mediates Rat Blood-Brain Barrier Dysfunction under Simulated Microgravity Based on Proteomics Strategy. Int. J. Mol. Sci. 2021, 22, 5165. [Google Scholar] [CrossRef] [PubMed]
- Bellone, J.A.; Gifford, P.S.; Nishiyama, N.C.; Hartman, R.E.; Mao, X.W. Long-term effects of simulated microgravity and/or chronic exposure to low-dose gamma radiation on behavior and blood-brain barrier integrity. NPJ Microgravity 2016, 2, 16019. [Google Scholar] [CrossRef] [PubMed] [Green Version]
- Mao, X.W.; Nishiyama, N.C.; Byrum, S.D.; Stanbouly, S.; Jones, T.; Holley, J.; Sridharan, V.; Boerma, M.; Tackett, A.J.; Willey, J.S.; et al. Spaceflight induces oxidative damage to blood-brain barrier integrity in a mouse model. FASEB J. 2020, 34, 15516–15530. [Google Scholar] [CrossRef]
- Carriot, J.; Mackrous, I.; Cullen, K.E. Challenges to the Vestibular System in Space: How the Brain Responds and Adapts to Microgravity. Front. Neural Circuits 2021, 15, 127. [Google Scholar] [CrossRef]
- Moran, M.M.; Stein, T.P.; Wade, C.E. Hormonal modulation of food intake in response to low leptin levels induced by hypergravity. Exp. Biol. Med. 2001, 226, 740–745. [Google Scholar] [CrossRef]
- Yuwaki, K.; Okuno, M. Changes in food intake and growth rate in mice under hypergravity. Biol. Sci. Space 2003, 17, 219–220. [Google Scholar]
- Kawao, N.; Morita, H.; Obata, K.; Tamura, Y.; Okumoto, K.; Kaji, H. The vestibular system is critical for the changes in muscle and bone induced by hypergravity in mice. Physiol. Rep. 2016, 4, e12979. [Google Scholar] [CrossRef]
- Petrak, J.; Mravec, B.; Jurani, M.; Baranovska, M.; Tillinger, A.; Hapala, I.; Frollo, I.; Kvetňanský, R. Hypergravity-induced Increase in Plasma Catecholamine and Corticosterone Levels in Telemetrically Collected Blood of Rats during Centrifugation. Ann. N. Y. Acad. Sci. 2008, 1148, 201–208. [Google Scholar] [CrossRef] [PubMed]
- Morita, H.; Yamaguchi, A.; Shiba, D.; Shirakawa, M.; Takahashi, S. Impact of a simulated gravity load for atmospheric reentry, 10 g for 2 min, on conscious mice. J. Physiol. Sci. 2017, 67, 531–537. [Google Scholar] [CrossRef] [PubMed]
- Dubayle, D.; Vanden-Bossche, A.; Beraneck, M.; Vico, L.; Morel, J.-L. Effects of centrifugation and whole-body vibrations on blood–brain barrier permeability in mice. npj Microgravity 2020, 6, 1. [Google Scholar] [CrossRef] [PubMed] [Green Version]
- Matsumoto, A.; Storch, K.J.; Stolfi, A.; Mohler, S.R.; Frey, M.A.; Stein, T.P. Weight Loss in Humans in Space. Aviat. Space Environ. Med. 2011, 82, 615–621. [Google Scholar] [CrossRef] [PubMed]
- Thornton, W.E.; Bonato, F. Space Motion Sickness and Motion Sickness: Symptoms and Etiology. Aviat. Space Environ. Med. 2013, 84, 716–721. [Google Scholar] [CrossRef] [PubMed]
- Zhang, L.-L.; Wang, J.-Q.; Qi, R.-R.; Pan, L.-L.; Li, M.; Cai, Y.-L. Motion Sickness: Current Knowledge and Recent Advance. CNS Neurosci. Ther. 2015, 22, 15–24. [Google Scholar] [CrossRef] [PubMed]
- Abe, C.; Tanaka, K.; Iwata, C.; Morita, H. Vestibular-mediated increase in central serotonin plays an important role in hypergravity-induced hypophagia in rats. J. Appl. Physiol. 2010, 109, 1635–1643. [Google Scholar] [CrossRef] [PubMed] [Green Version]
- Alauzet, C.; Cunat, L.; Wack, M.; Lozniewski, A.; Busby, H.; Agrinier, N.; Cailliez-Grimal, C.; Frippiat, J.-P. Hypergravity disrupts murine intestinal microbiota. Sci. Rep. 2019, 9, 9410. [Google Scholar] [CrossRef] [Green Version]
- Yoon, G.; Kim, H.-S. Gastric acid response to acute exposure to hypergravity. Oncotarget 2017, 8, 64–69. [Google Scholar] [CrossRef] [Green Version]
- Ishizawa, M.; Iwasaki, K.-I.; Kato, S.; Makishima, M. Hypergravity modulates vitamin D receptor target gene mRNA expression in mice. Am. J. Physiol. Metab. 2009, 297, E728–E734. [Google Scholar] [CrossRef] [PubMed] [Green Version]
- Ishikawa, C.; Li, H.; Ogura, R.; Yoshimura, Y.; Kudo, T.; Shirakawa, M.; Shiba, D.; Takahashi, S.; Morita, H.; Shiga, T. Effects of gravity changes on gene expression of BDNF and serotonin receptors in the mouse brain. PLoS ONE 2017, 12, e0177833. [Google Scholar] [CrossRef] [PubMed] [Green Version]
- Choi, J.; Wang, S.; Tung, Y.-S.; Morrison, B.; Konofagou, E.E. Molecules of Various Pharmacologically-Relevant Sizes Can Cross the Ultrasound-Induced Blood-Brain Barrier Opening in vivo. Ultrasound Med. Biol. 2010, 36, 58–67. [Google Scholar] [CrossRef] [PubMed] [Green Version]
- Hultström, D.; Malmgren, L.; Gilstring, D.; Olsson, Y. FITC-Dextrans as tracers for macromolecular movements in the nervous system. Acta Neuropathol. 1983, 59, 53–62. [Google Scholar] [CrossRef] [PubMed]
- Olsson, Y.; Svensjö, E.; Arfors, K.E.; Hultström, D. Fluorescein labelled dextrans as tracers for vascular permeability studies in the nervous system. Acta Neuropathol. 1975, 33, 45–50. [Google Scholar] [CrossRef] [PubMed]
- Kadry, H.; Noorani, B.; Cucullo, L. A blood-brain barrier overview on structure, function, impairment, and biomarkers of integrity. Fluids Barriers CNS 2020, 17, 69. [Google Scholar] [CrossRef]
- Lochhead, J.J.; Yang, J.; Ronaldson, P.T.; Davis, T.P. Structure, Function, and Regulation of the Blood-Brain Barrier Tight Junction in Central Nervous System Disorders. Front. Physiol. 2020, 11, 914. [Google Scholar] [CrossRef]
- Saunders, N.R.; Dziegielewska, K.M.; Møllgård, K.; Habgood, M.D. Markers for blood-brain barrier integrity: How appropriate is Evans blue in the twenty-first century and what are the alternatives? Front Neurosci. 2015, 9, 385. [Google Scholar] [CrossRef] [Green Version]
- Caulfield, J.P.; Farquhar, M.G. The permeability of glomerular capillaries to graded dextrans. Identification of the basement membrane as the primary filtration barrier. J. Cell Biol. 1974, 63, 883–903. [Google Scholar] [CrossRef] [Green Version]
- Öztaş, B.; Akgül, S.; Arslan, F. Influence of surgical pain stress on the blood-brain barrier permeability in rats. Life Sci. 2004, 74, 1973–1979. [Google Scholar] [CrossRef]
- Harris, W.J.; Asselin, M.-C.; Hinz, R.; Parkes, L.M.; Allan, S.; Schiessl, I.; Boutin, H.; Dickie, B.R. In vivo methods for imaging blood–brain barrier function and dysfunction. Eur. J. Nucl. Med. 2022. Available online: https://doi.org/10.1007/s00259-022-05997-1 (accessed on 9 November 2019). [CrossRef] [PubMed]
- Montagne, A.; Barnes, S.R.; Sweeney, M.D.; Halliday, M.R.; Sagare, A.P.; Zhao, Z.; Toga, A.W.; Jacobs, R.E.; Liu, C.Y.; Amezcua, L.; et al. Blood-Brain Barrier Breakdown in the Aging Human Hippocampus. Neuron 2015, 85, 296–302. [Google Scholar] [CrossRef] [PubMed] [Green Version]
- Ueno, M.; Sakamoto, H.; Tomimoto, H.; Akiguchi, I.; Onodera, M.; Huang, C.L.; Kanenishi, K. Blood-brain barrier is impaired in the hippocampus of young adult spontaneously hypertensive rats. Acta Neuropathol. 2004, 107, 532–538. [Google Scholar] [CrossRef] [PubMed]
- Qi, Z.; Yuan, S.; Liu, K. Occludin regulation of blood–brain barrier and potential therapeutic target in ischemic stroke. Brain Circ. 2020, 6, 152–162. [Google Scholar]
- Zihni, C.; Mills, C.; Matter, K.; Balda, M.S. Tight junctions: From simple barriers to multifunctional molecular gates. Nat. Rev. Mol. Cell Biol. 2016, 17, 564–580. [Google Scholar] [CrossRef]
- Akwii, R.G.; Sajib, M.S.; Zahra, F.T.; Mikelis, C.M. Role of Angiopoietin-2 in Vascular Physiology and Pathophysiology. Cells 2019, 8, 471. [Google Scholar] [CrossRef] [Green Version]
- Csaba, Z.; Vitalis, T.; Charriaut-Marlangue, C.; Margaill, I.; Coqueran, B.; Leger, P.; Parente, I.; Jacquens, A.; Titomanlio, L.; Constans, C.; et al. A simple novel approach for detecting blood–brain barrier permeability using GPCR internalization. Neuropathol. Appl. Neurobiol. 2021, 47, 297–315. [Google Scholar] [CrossRef]
- Andreev-Andrievskiy, A.; Popova, A.; Lloret, J.-C.; Aubry, P.; Borovik, A.; Tsvirkun, D.; Vinogradova, O.; Ilyin, E.; Gauquelin-Koch, G.; Gharib, C.; et al. BION-M 1: First continuous blood pressure monitoring in mice during a 30-day spaceflight. Life Sci. Space Res. 2017, 13, 19–26. [Google Scholar] [CrossRef]
- Janigro, D.; Bailey, D.M.; Lehmann, S.; Badaut, J.; O’Flynn, R.; Hirtz, C.; Marchi, N. Peripheral Blood and Salivary Biomarkers of Blood–Brain Barrier Permeability and Neuronal Damage: Clinical and Applied Concepts. Front. Neurol. 2021, 11, 577312. Available online: https://www.frontiersin.org/articles/10.3389/fneur.2020.577312 (accessed on 6 December 2019). [CrossRef]
Figure 1.
Variation in body weight and food and water consumption in normogravity and hypergravity. (A) Variation in body weight (Δ weight on 24 h expressed in grams) in 24 h in all mice exposed to both normogravity (1 g, circle) and hypergravity (2 g, point) conditions (n = 35 per condition). (B) Variation in body weight of mice injected with saline solution (Sham, n = 3 per condition, circle) and antisense oligonucleotide (AS, n = 9 per condition, point). (C) Variation in body weight of mice injected with antisense oligonucleotide (AS, n = 9 per condition), dextrans D40 (n = 6 per condition), D70 (n = 9 per condition) and D150 (n = 8 per condition). p values < 0.05 are precise. (D) Food and (E) water consumption during the 24 h; before the centrifugation (before) and after the period of centrifugation (after) in both 2× g and in 1 g groups. The consumption of food and water are expressed in g per cage, each cage containing three mice (n = 7 cages per group).

Figure 2.
Effects of centrifugation on corticosterone concentration. (A) Corticosterone concentration (in pg/mL) in both normogravity (1 g, circle) and hypergravity (2 g, point) conditions (n = 30 per conditions). (B) Corticosterone concentration (in pg/mL) in both normogravity (1 g) and hypergravity (2 g) conditions in Sham-, AS-, D40-, D70- and D150-injected mice (n = 6 per conditions).

Figure 3.
Effects of centrifugation on extravasation of fluorescent dextrans in brain. Measures were performed on Nanozoomer images from (A) thalamus (THAL), (B) hippocampus (HPC), (C) dorsal (DCx) and (D) lateral (LCx) cortices. Fluorescence levels were used as an index of extravasation. They were expressed as grey level (arbitrary unit, A.U.) per surface (µm2) of the D40 (n = 11), D70 (n = 25) and D150 (n = 22), measured in both normogravity (1 g, circle) and hypergravity (2 g, point) conditions. Red circles on schema of the brain slices represented the ROI used for the analyses, and the p values < 0.05 are indicated. (E) Typical images obtained with Nanozoomer of brain slice from D70-injected mice exposed to normogravity (1 g, left) and hypergravity (2 g, right). The right panel is a magnification of the left one. Red circles indicate the ROI used for fluorescence measurements. Scale bar represents 1 mm.

Figure 4.
Effects of centrifugation on extravasation of fluorescent AS in liver. (A) Typical images of liver slices from mice exposed to normogravity (1 g) and hypergravity (2 g) obtained with Nanozoomer (upper panel) and confocal SP5 (lower panels, with two different magnifications). Red arrows indicate AS fluorescent spots. (B) The fluorescent level, expressed as grey level (A.U.) per surface (µm2) of the AS in liver (n = 24), was used as an index of extravasation. Red circles on schema of the liver slices represented the ROI used for the analysis. (C) Density of fluorescent spots (number of spots per mm2) used as an index of AS inclusion into the liver tissue. The analysis was performed in the whole slice (blue shape) and red circles on the schema indicated the localization of spots. The 1 g and 2 g conditions are associated with white and black points, respectively, and the p values < 0.05 are indicated.

Figure 5.
Effects of centrifugation on extravasation of fluorescent AS in brain. (A) Typical images of brain slices from mice exposed to normogravity (1 g, upper panel, left) and hypergravity (2 g, upper panel, right) obtained with Nanozoomer. Red arrow indicates fluorescent spots. A focus on the hippocampus area of the brain slice from mice exposed to hypergravity (2 g, lower panel) is illustrated by confocal SP5 images obtained at two different magnifications (right panel was an enlargement of the image on the left; corresponding to the red rectangle). (B) Fluorescence level expressed in grey level (A.U.) per surface (µm2) of the AS (1 g, n = 12 vs. 2 g, n = 12) in thalamus (THAL), hippocampus (HPC), dorsal (DCx) and lateral (LCx) cortices used as an index of extravasation. Red circles on schema of the brain slices represent the ROI used for the analyses; the 1 g and 2 g conditions are associated with white circle and black points, respectively, and the p values < 0.05 are indicated.

Figure 6.
Density of fluorescent spots in brain. (A) The brain regions used for the analysis were delimited by red shapes on Nanozoomer image (1 g on the left and 2 g on the right). These red ROI were placed on the thalamus (THAL), hippocampus (HPC), dorsal cortex (DCx), somatosensorial cortex (SoCx) and piriform cortex (PirCx). The white arrows indicate some spots with high levels of fluorescence. (B) Density of fluorescent spots (number of spots per mm2) was used as an index of AS diffusion in the brain parenchyma. The 1 g and 2 g conditions are associated with white circles and black points, respectively, and the p values < 0.05 are indicated.

Figure 7.
Relative expression of genes involved in endothelial cell contacts. The gene expressions in 1 g and 2 g were compared using Hprt and Gapdh as reference genes (in inset). The upregulated and downregulated genes are indicated in red and green, respectively. Genes indicated in black are considered not affected.


Table 1.
Relative expression and functions of genes modulated by 2 g.
| Gene | Name | Relative exp. # | Function of the Genes |
|---|---|---|---|
| Actn1 | Actinin α1 | 2.24 |
|
| Actn2 * | Actinin α2 | −1.67 |
|
| Actn4 | Actinin α4 | −1.78 |
|
| Cdh2 | Cadherin 2 | −2.61 |
|
| Ctnnd1 | Catenin δ1 | 3.46 |
|
| Gja1 | Gap junction protein α1 | −1.58 |
|
| Gja4 | Gap junction protein α4 | 2.00 |
|
| Jup | Junction plakoglobulin | −1.52 |
|
| Ocln | Occludin | −1.54 |
|
| Tjp2 | Tight junction protein 2 | −1.52 |
|
* Very low expression in non-neuronal cell types (database: MGI.org and genecards.org). # Relative exp., expressing relative expression as 2 g-fold change against 1 g.
Disclaimer/Publisher’s Note: The statements, opinions and data contained in all publications are solely those of the individual author(s) and contributor(s) and not of MDPI and/or the editor(s). MDPI and/or the editor(s) disclaim responsibility for any injury to people or property resulting from any ideas, methods, instructions or products referred to in the content. |
© 2023 by the authors. Licensee MDPI, Basel, Switzerland. This article is an open access article distributed under the terms and conditions of the Creative Commons Attribution (CC BY) license (https://creativecommons.org/licenses/by/4.0/).
Share and Cite
MDPI and ACS Style
Dubayle, D.; Vanden-Bossche, A.; Peixoto, T.; Morel, J.-L. Hypergravity Increases Blood–Brain Barrier Permeability to Fluorescent Dextran and Antisense Oligonucleotide in Mice. Cells 2023, 12, 734. https://doi.org/10.3390/cells12050734
AMA Style
Dubayle D, Vanden-Bossche A, Peixoto T, Morel J-L. Hypergravity Increases Blood–Brain Barrier Permeability to Fluorescent Dextran and Antisense Oligonucleotide in Mice. Cells. 2023; 12(5):734. https://doi.org/10.3390/cells12050734
Chicago/Turabian StyleDubayle, David, Arnaud Vanden-Bossche, Tom Peixoto, and Jean-Luc Morel. 2023. "Hypergravity Increases Blood–Brain Barrier Permeability to Fluorescent Dextran and Antisense Oligonucleotide in Mice" Cells 12, no. 5: 734. https://doi.org/10.3390/cells12050734
Note that from the first issue of 2016, this journal uses article numbers instead of page numbers. See further details here.