

Increased Nuclear FOXP2 Is Related to Reduced Neural Stem Cell Number and Increased Neurogenesis in the Dorsal Telencephalon of Embryos of Diabetic Rats through Histamine H1 Receptors
 , , and
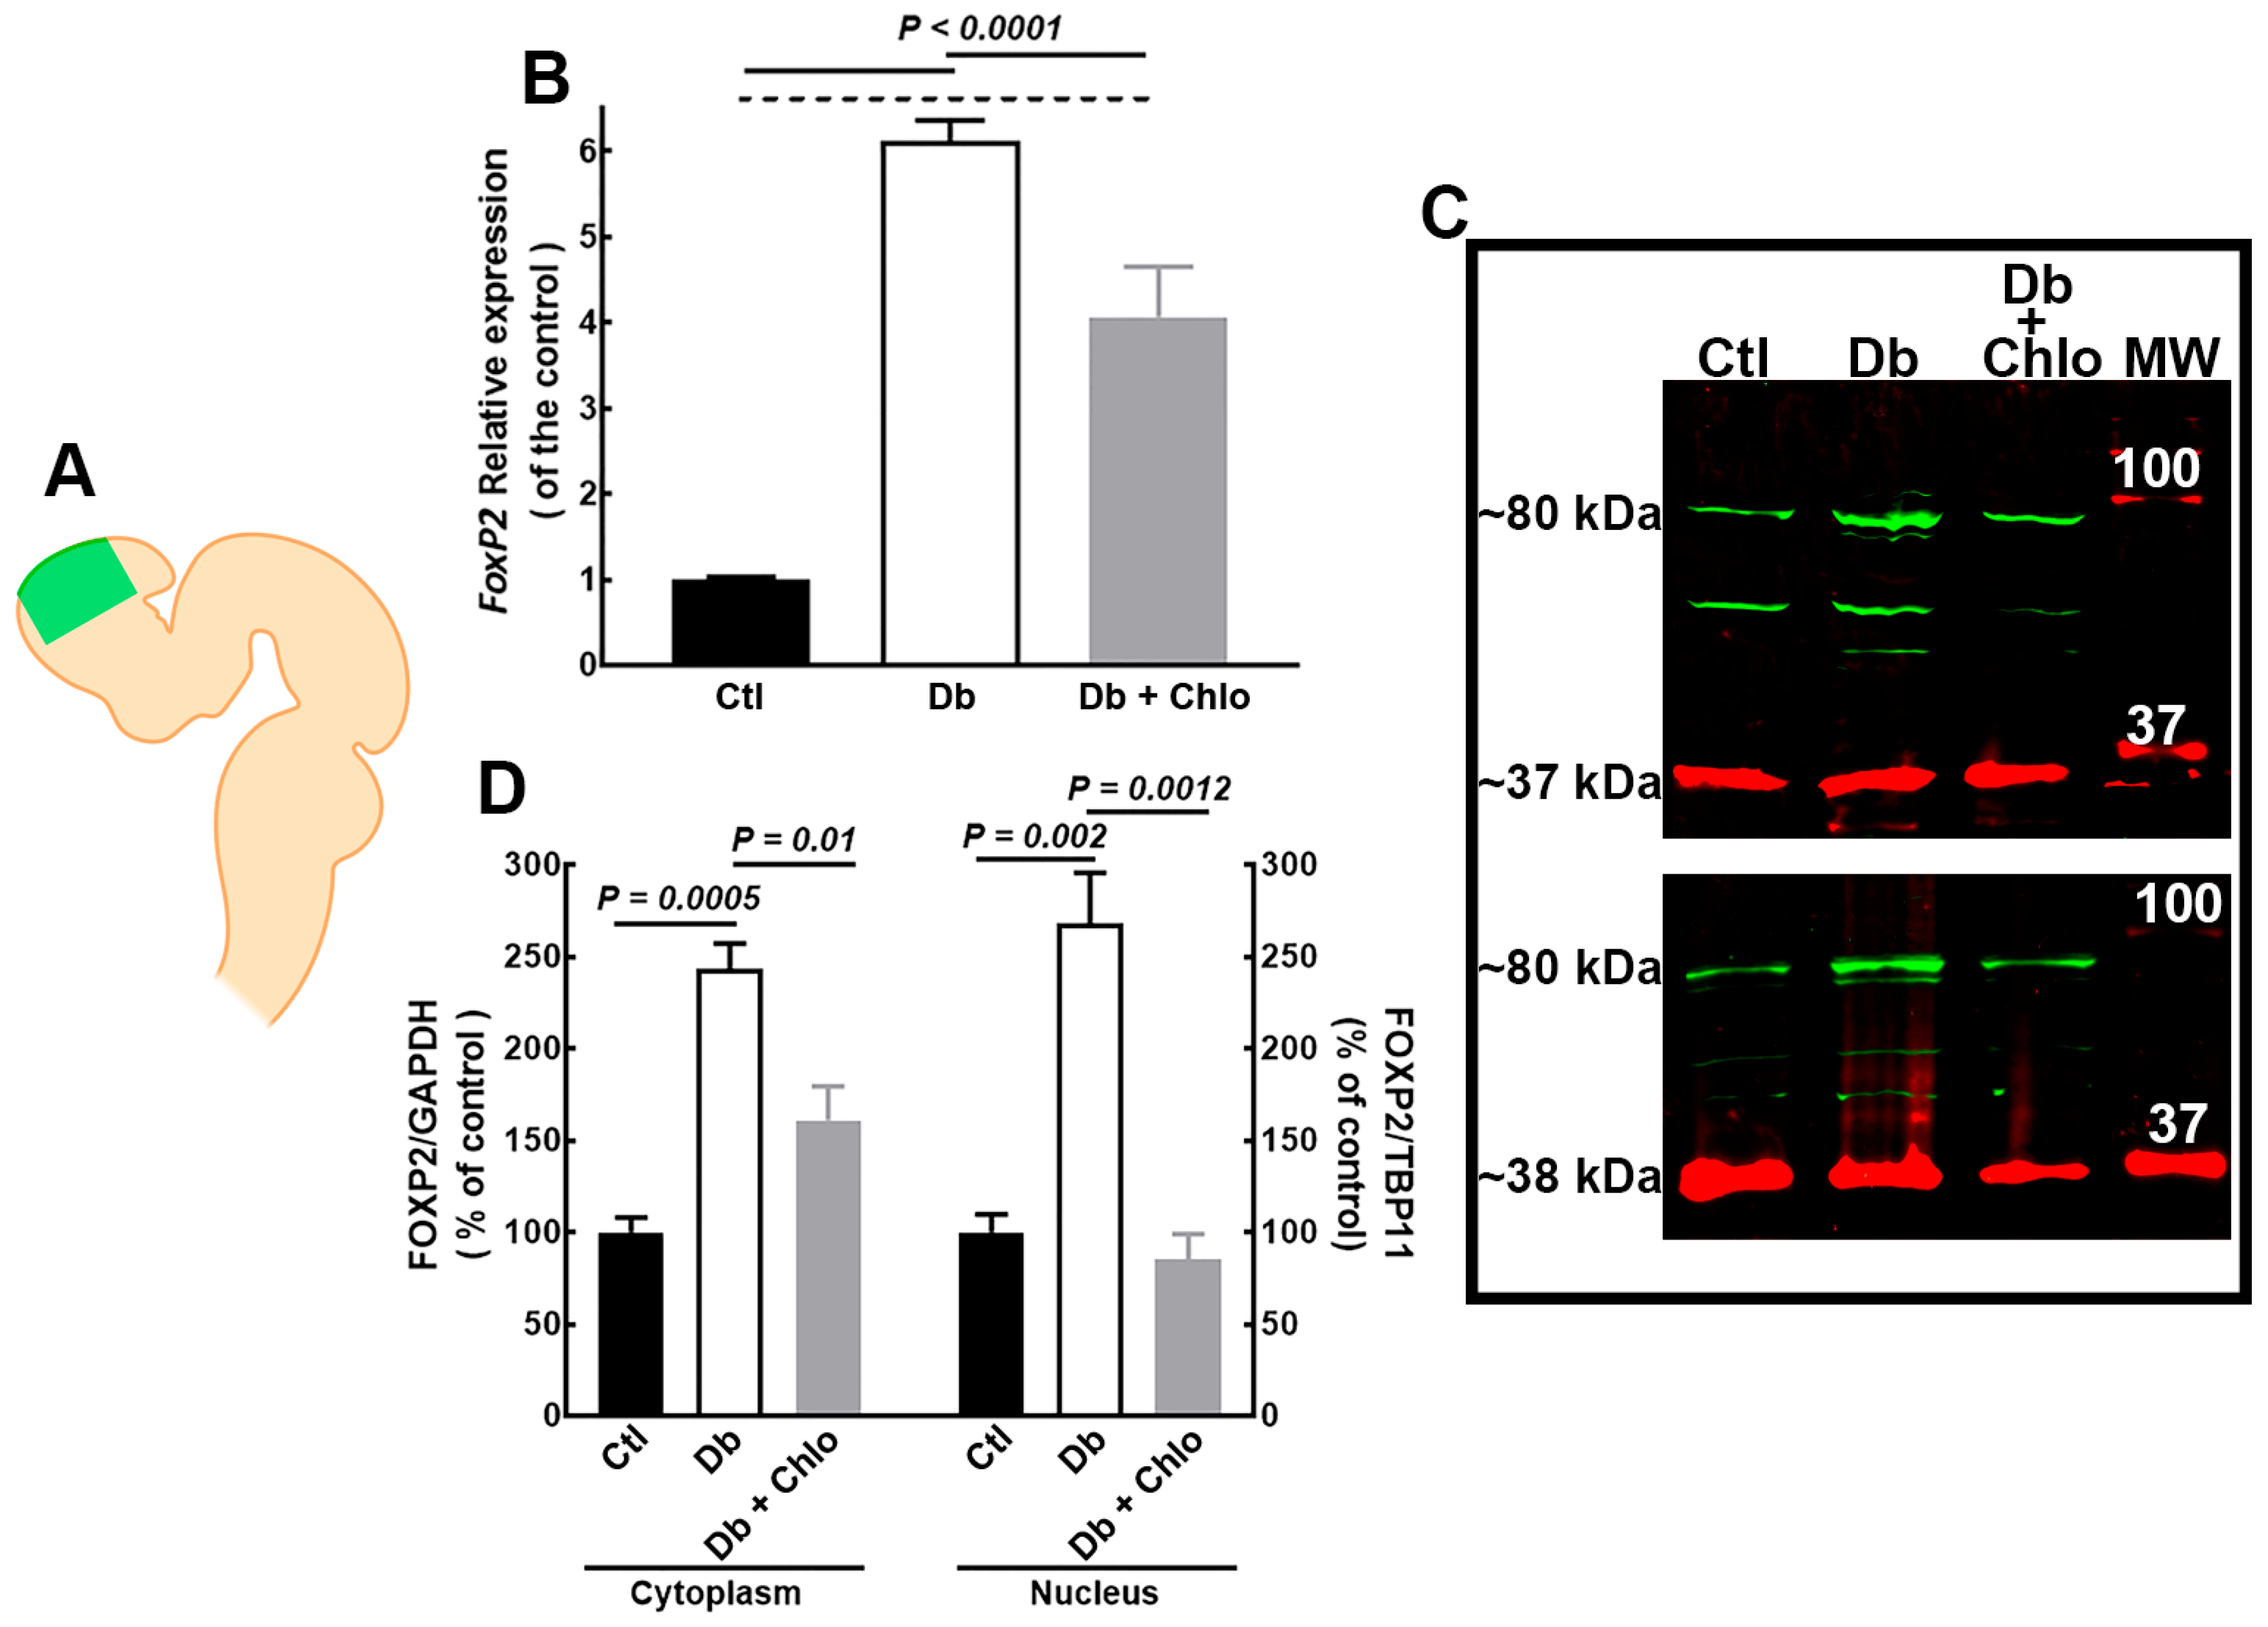
Abstract
:1. Introduction
2. Materials and Methods
2.1. Animals
2.2. Quantitative Reverse-Transcription Polymerase Chain Reaction (qRT-PCR)
2.3. Immunohistofluorescence
2.4. Western Blot
2.5. Flow Cytometry
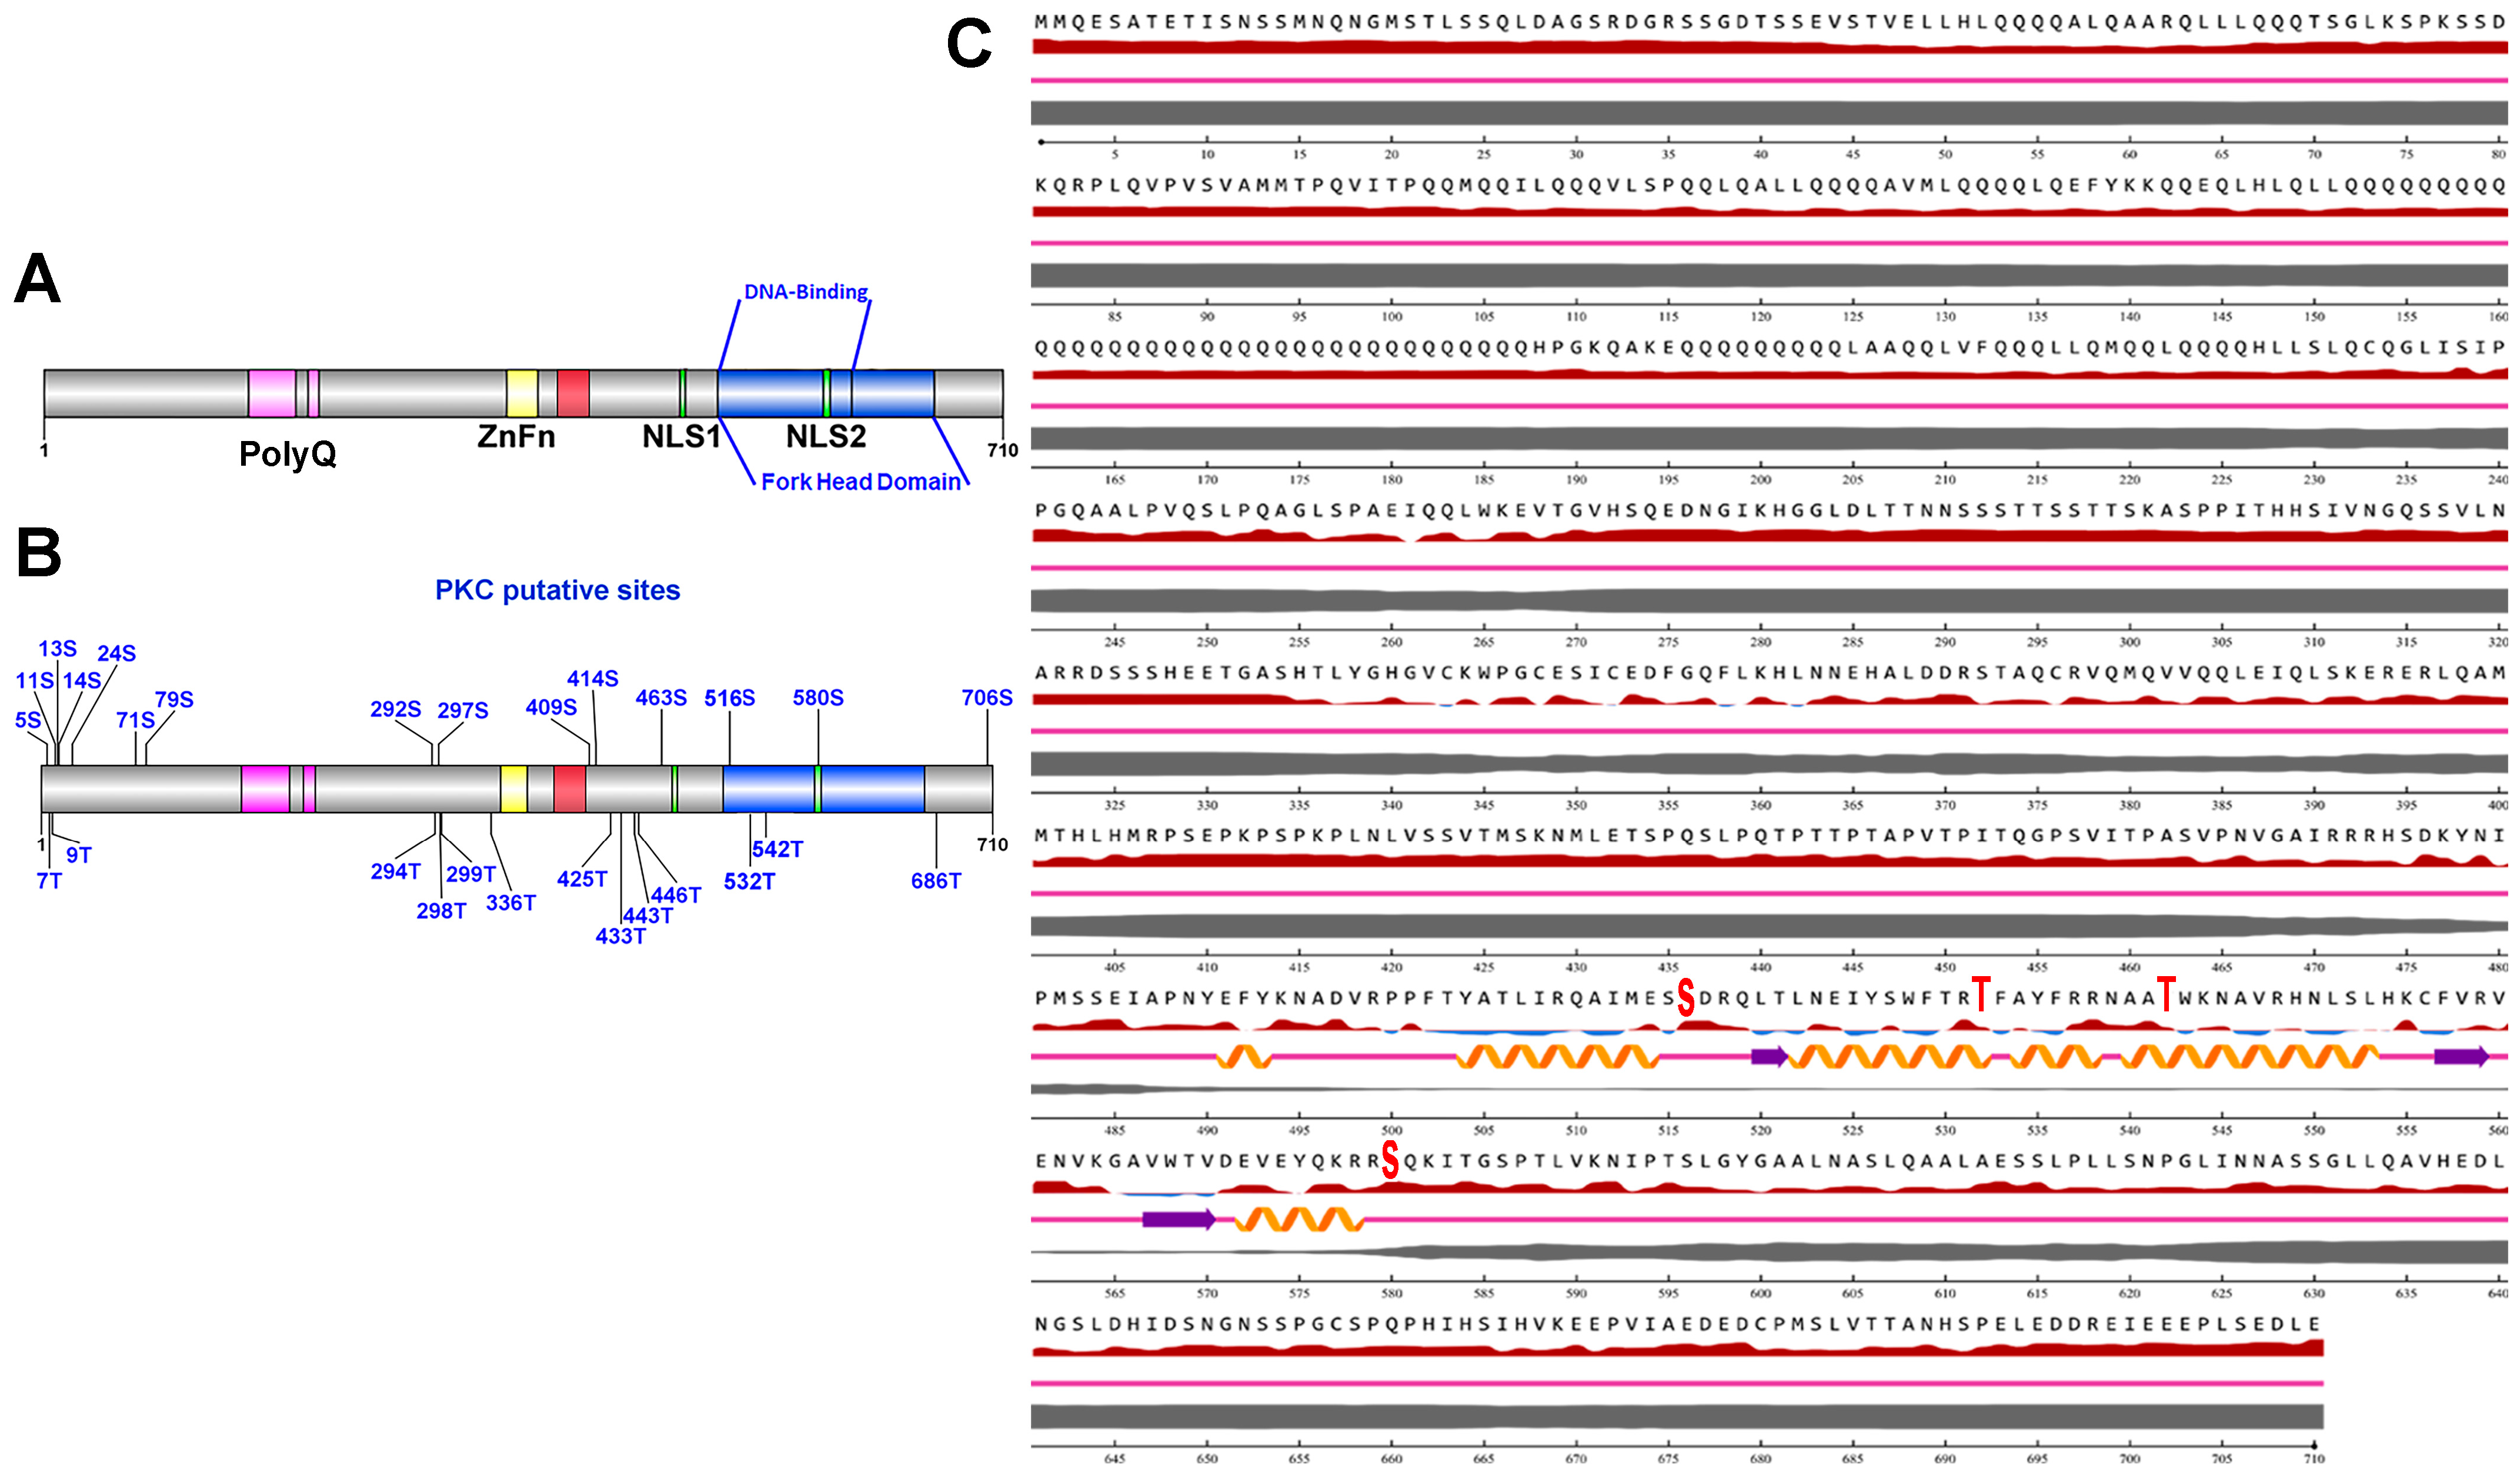
2.6. Bioinformatic
2.7. Statistics Analysis and Graphs
3. Results
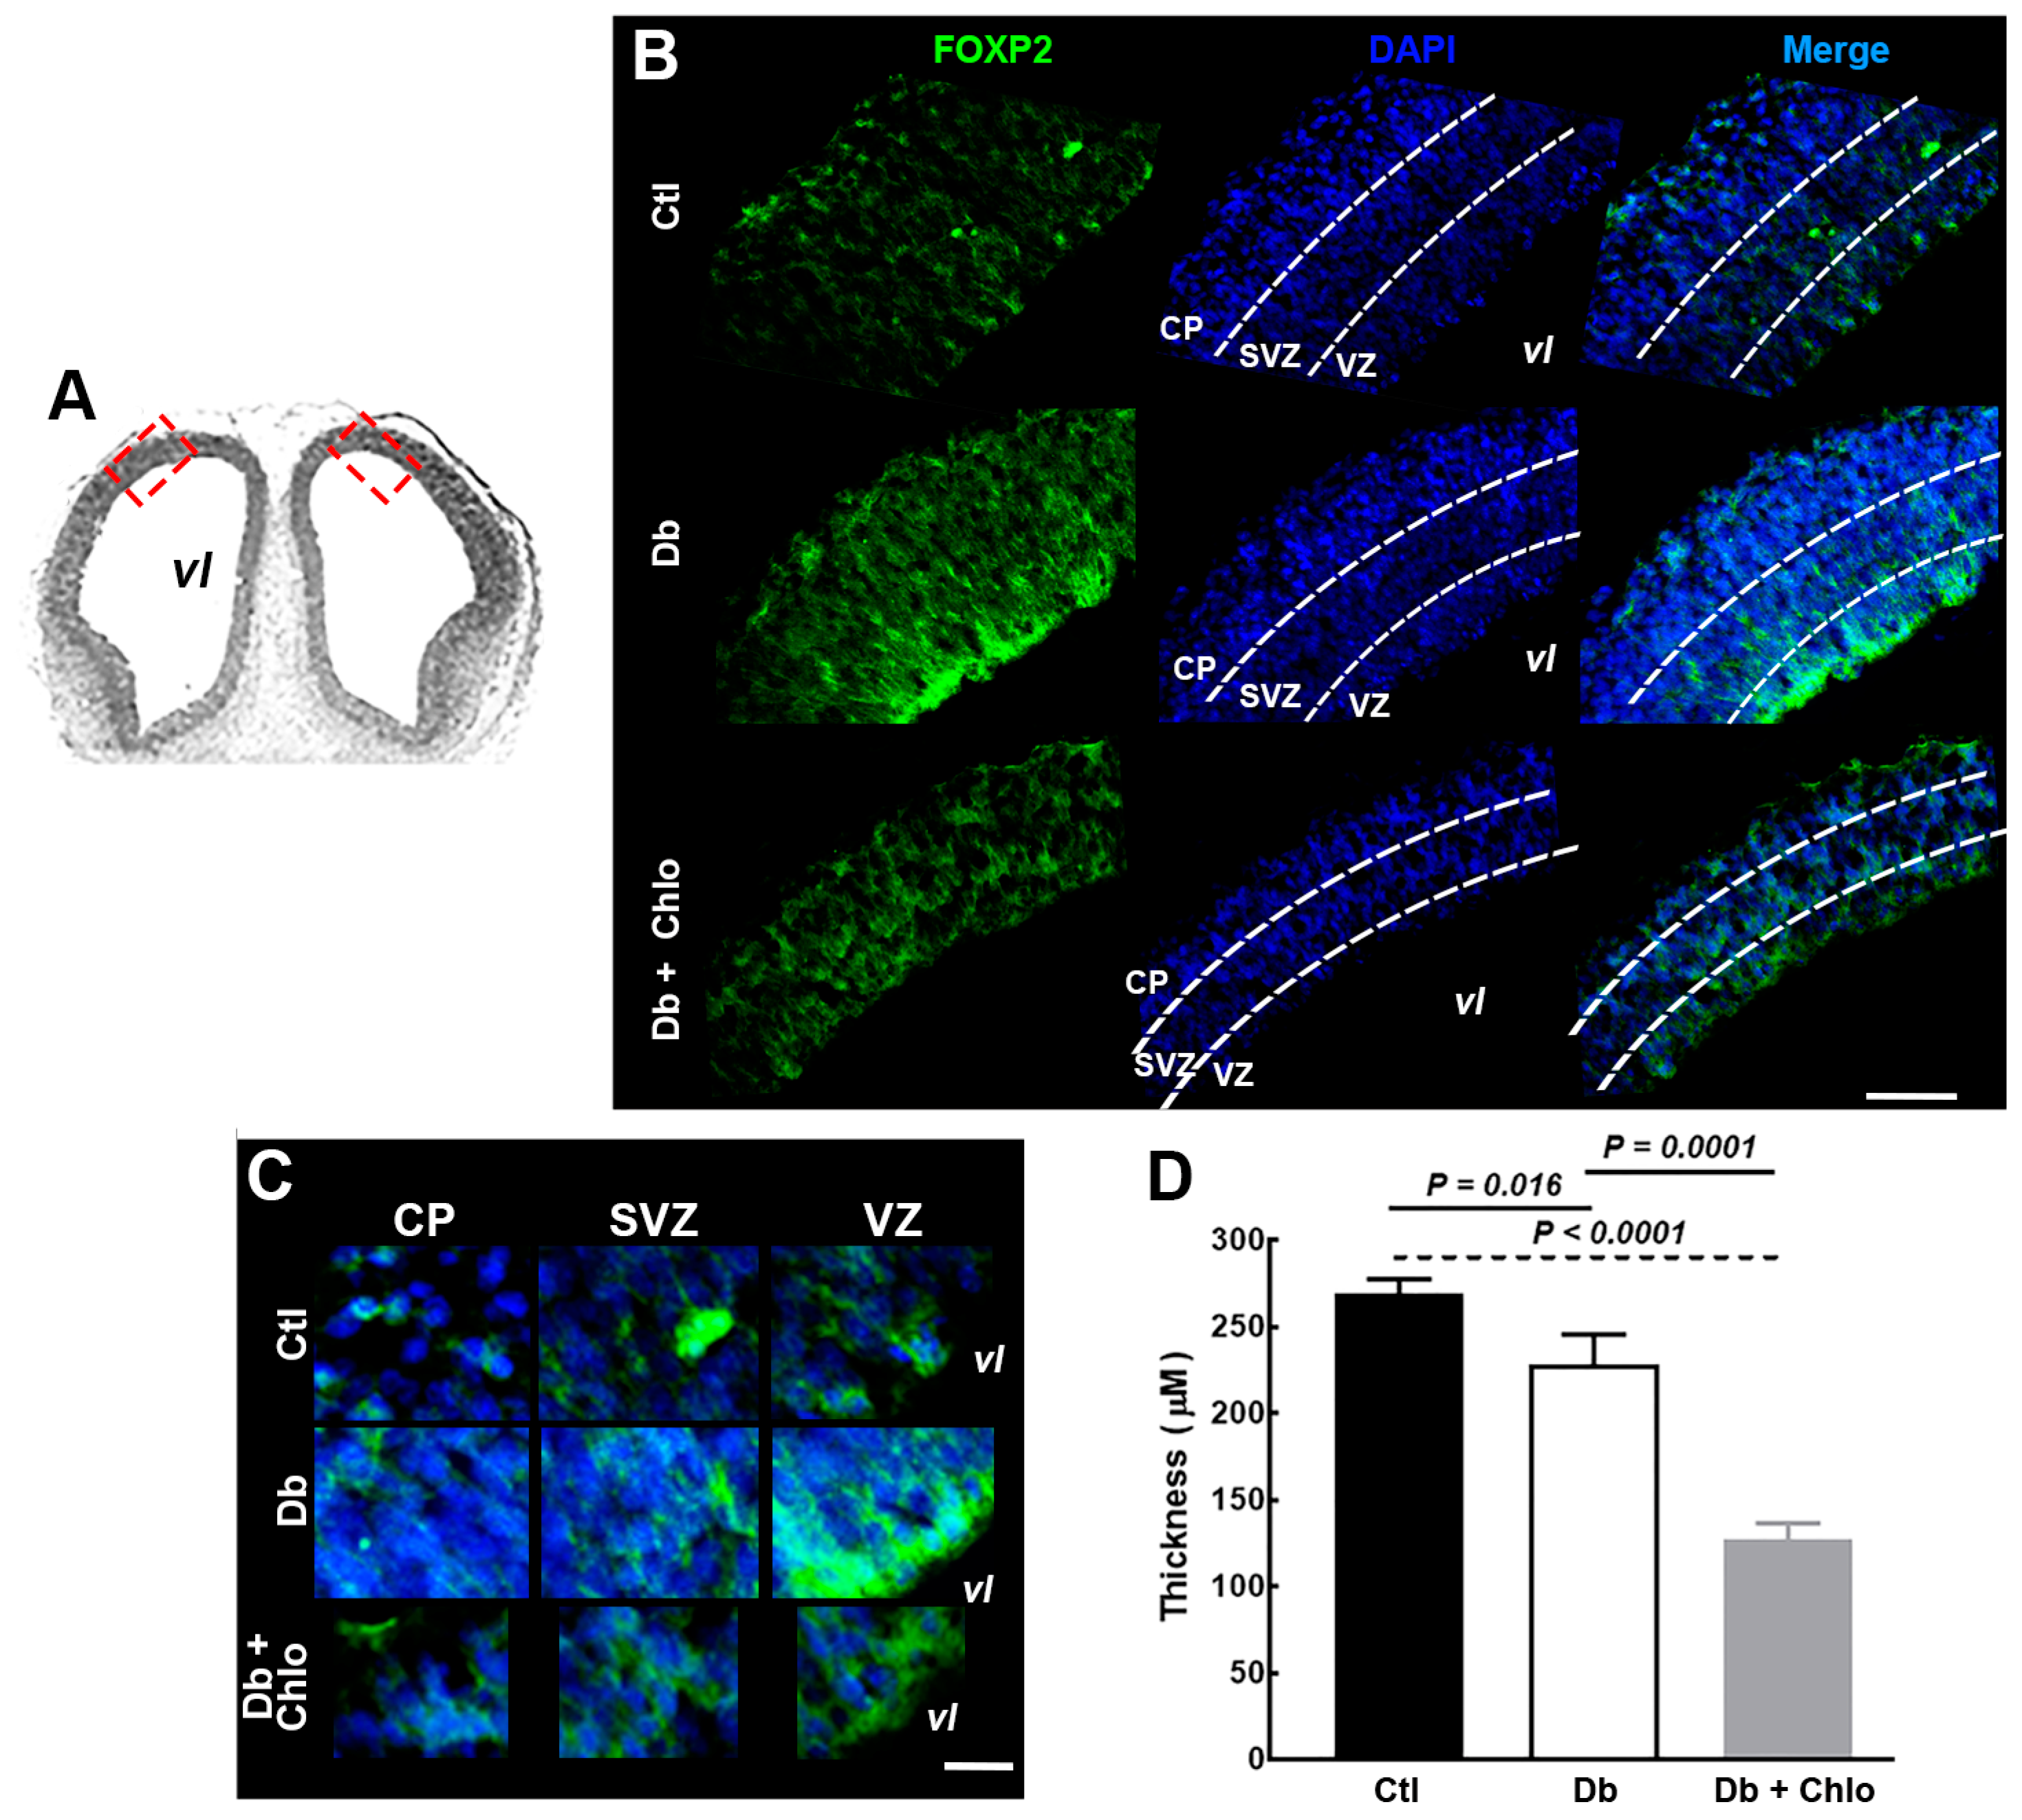
3.1. Effect of High Glucose and Chlorpheniramine on FOXP2 Expression and Subcellular Localization


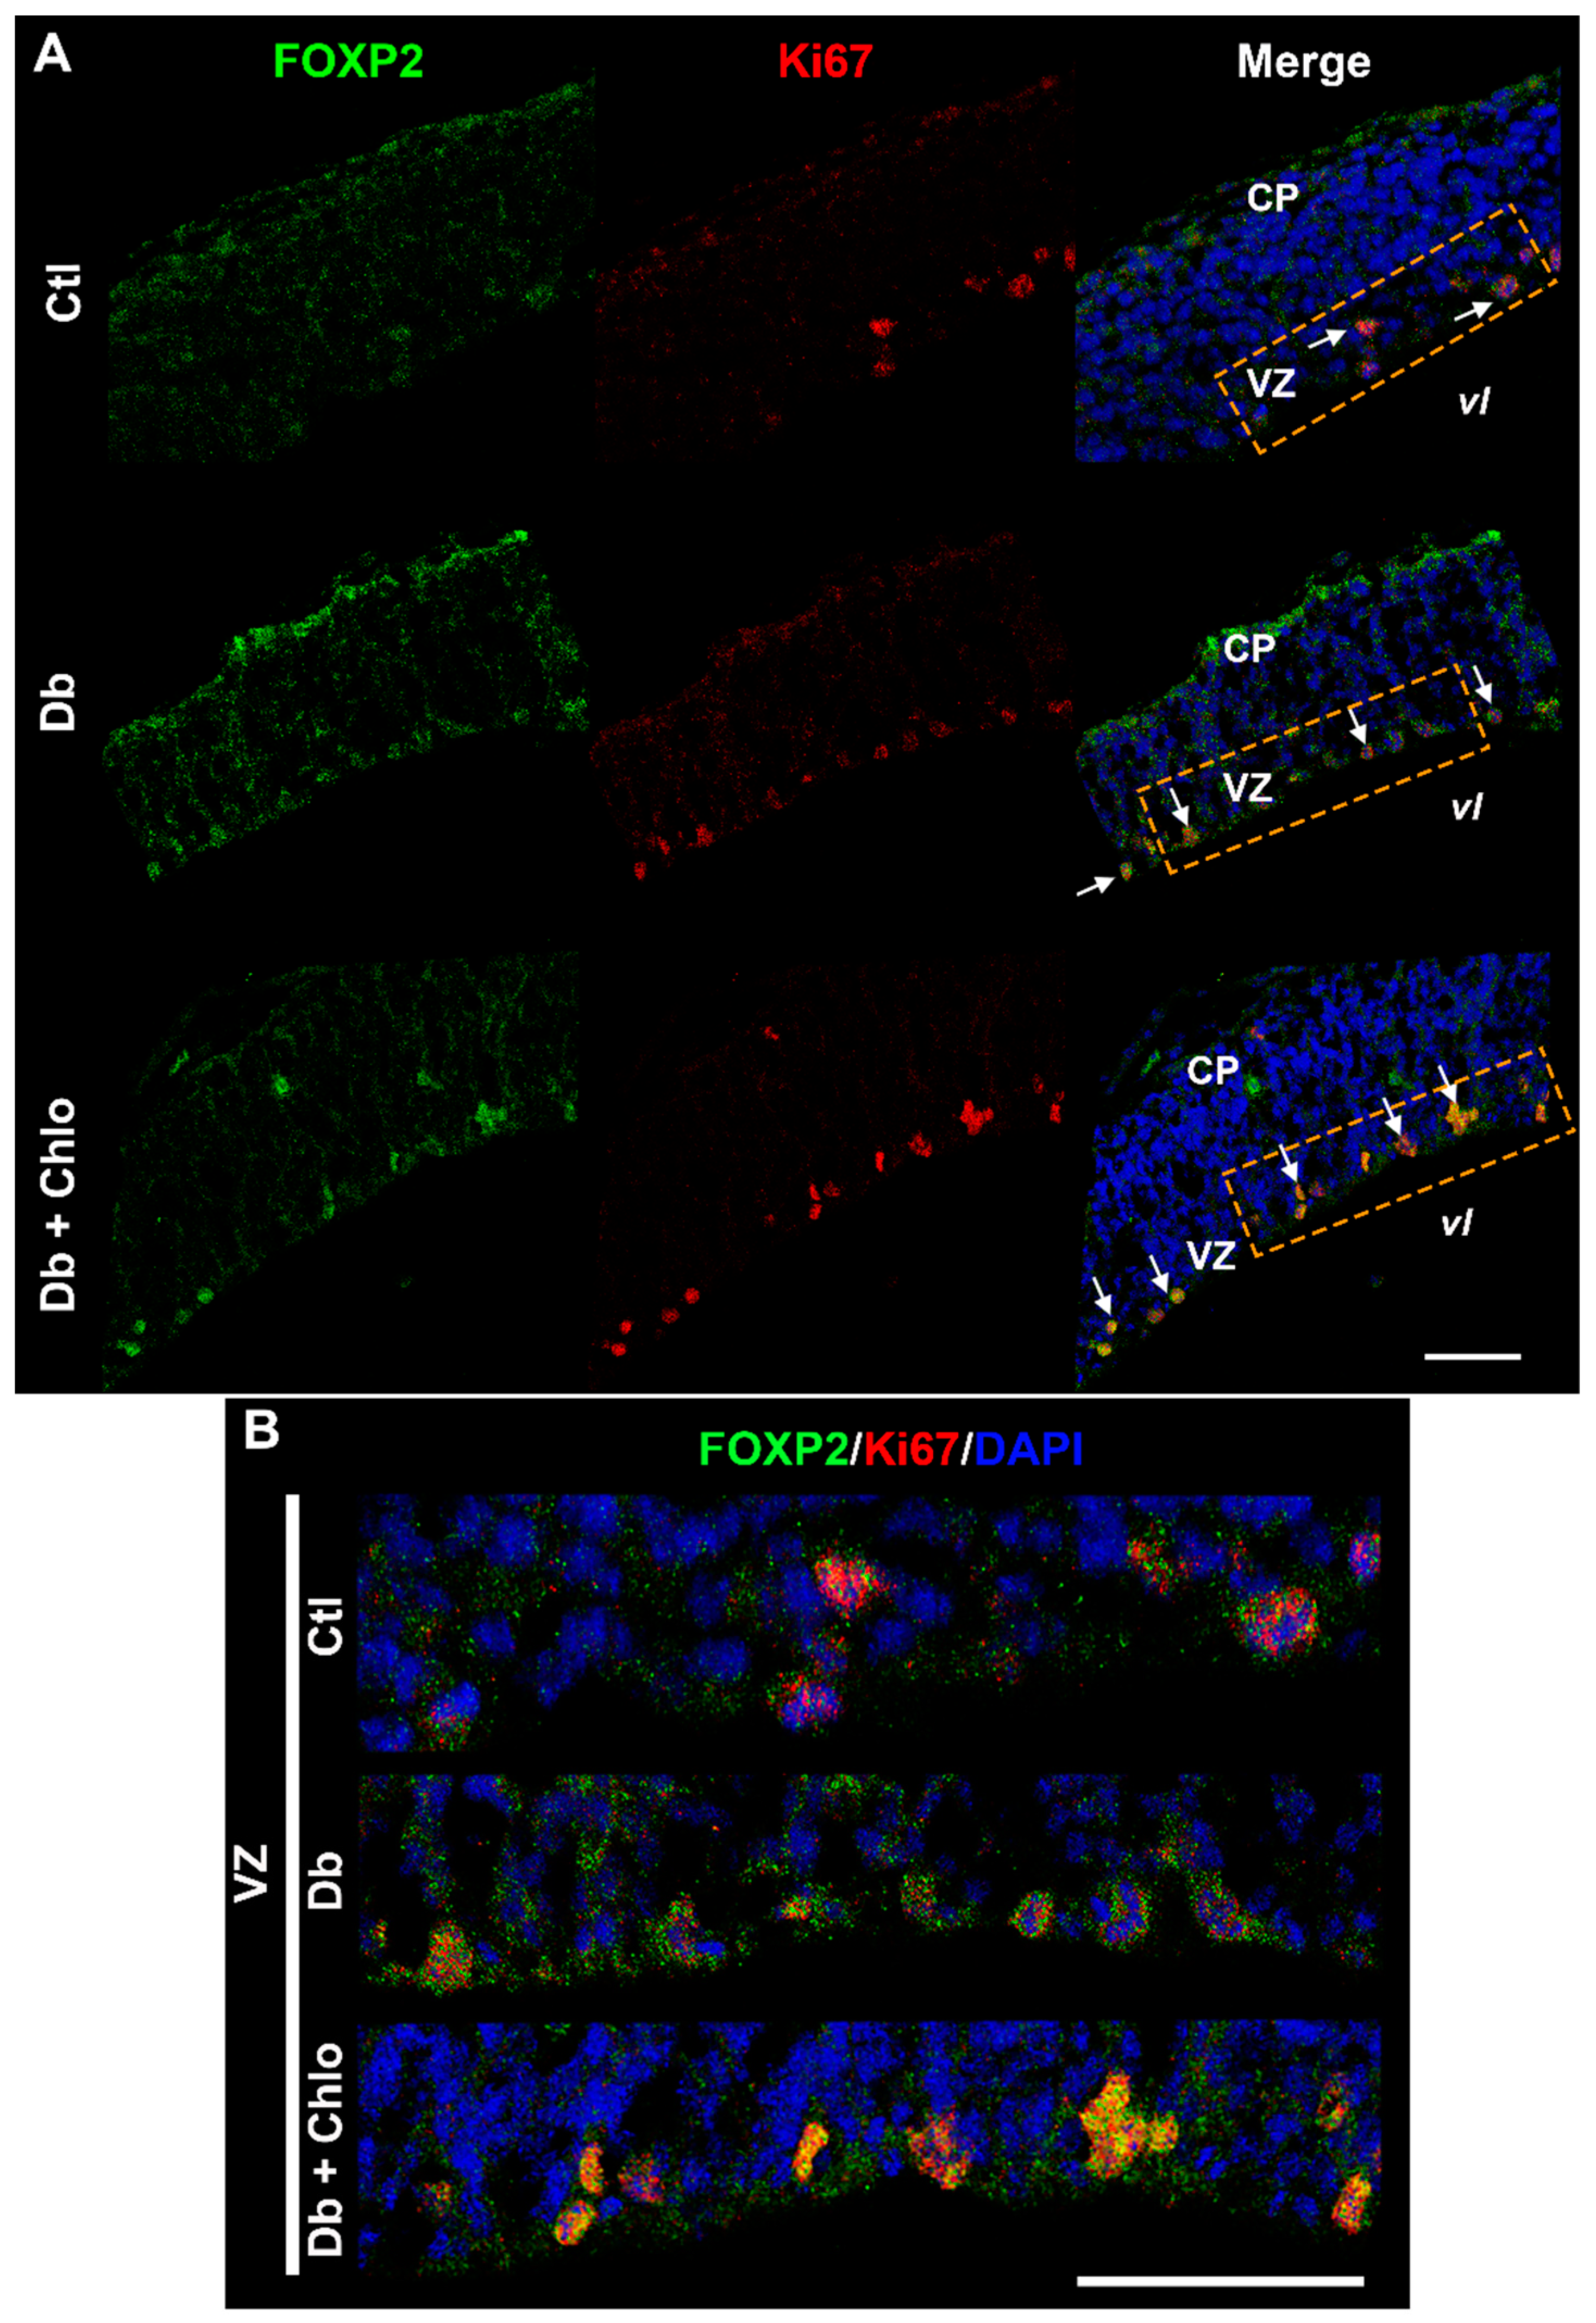
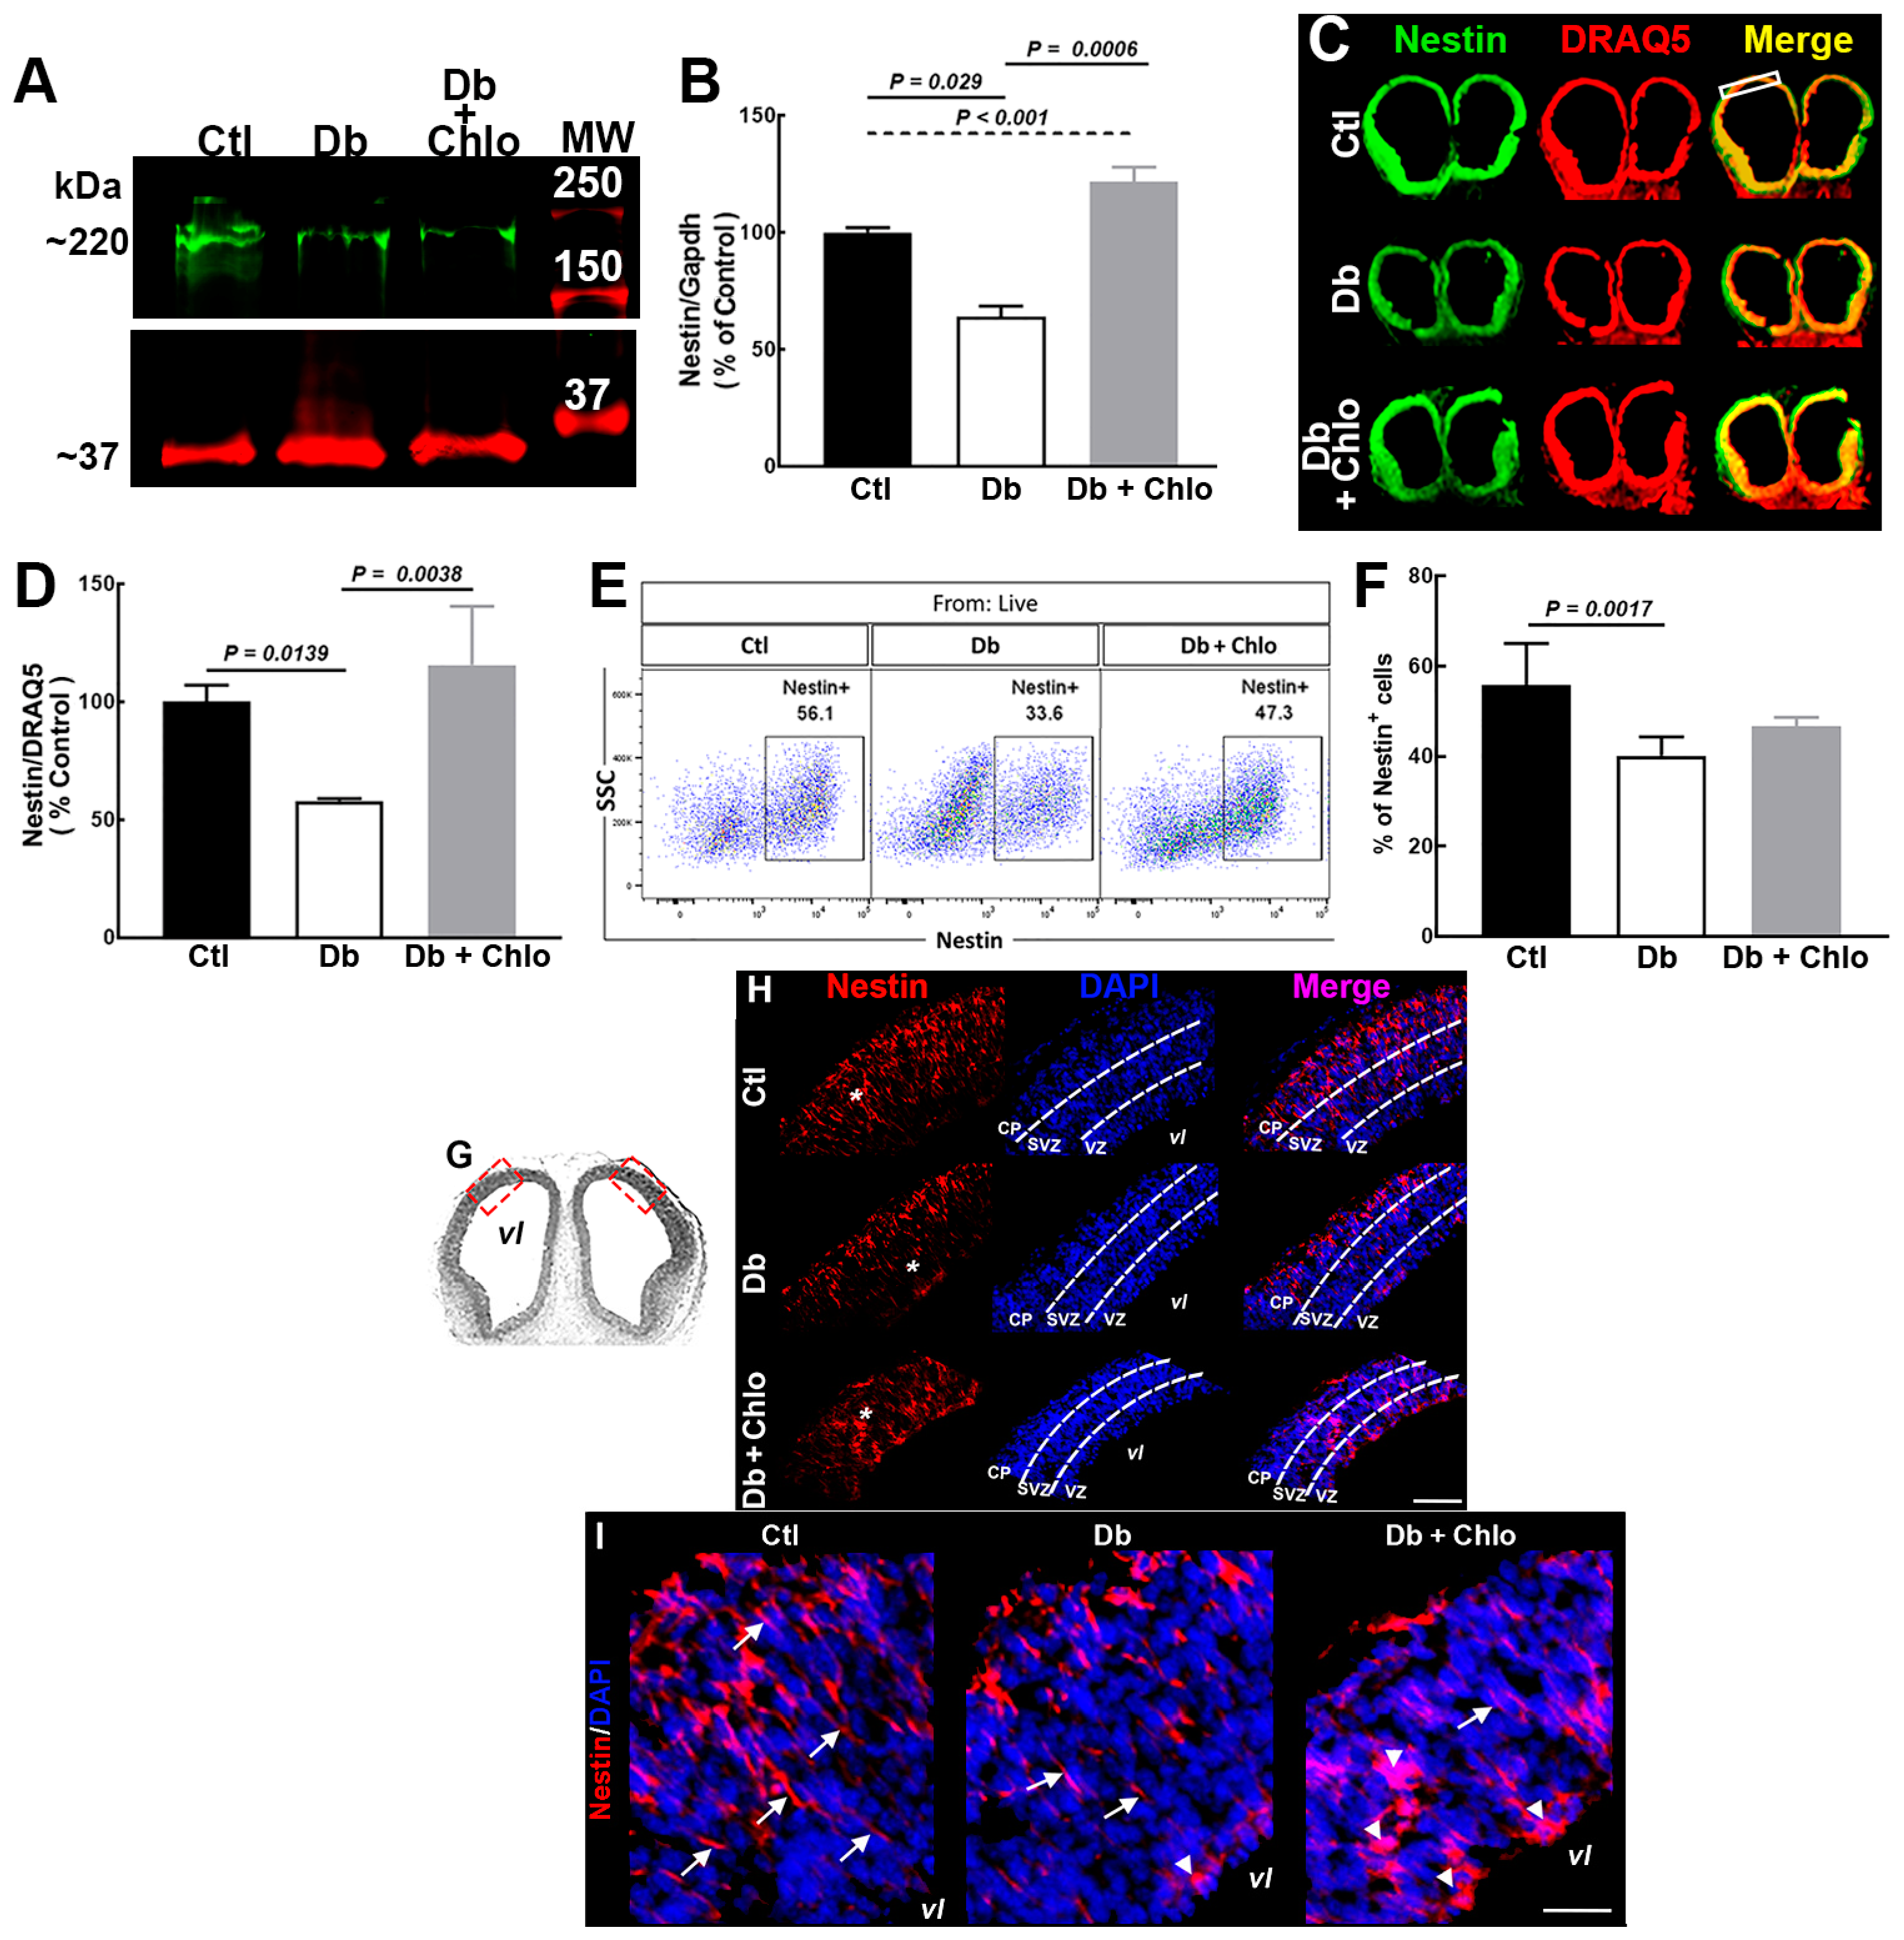
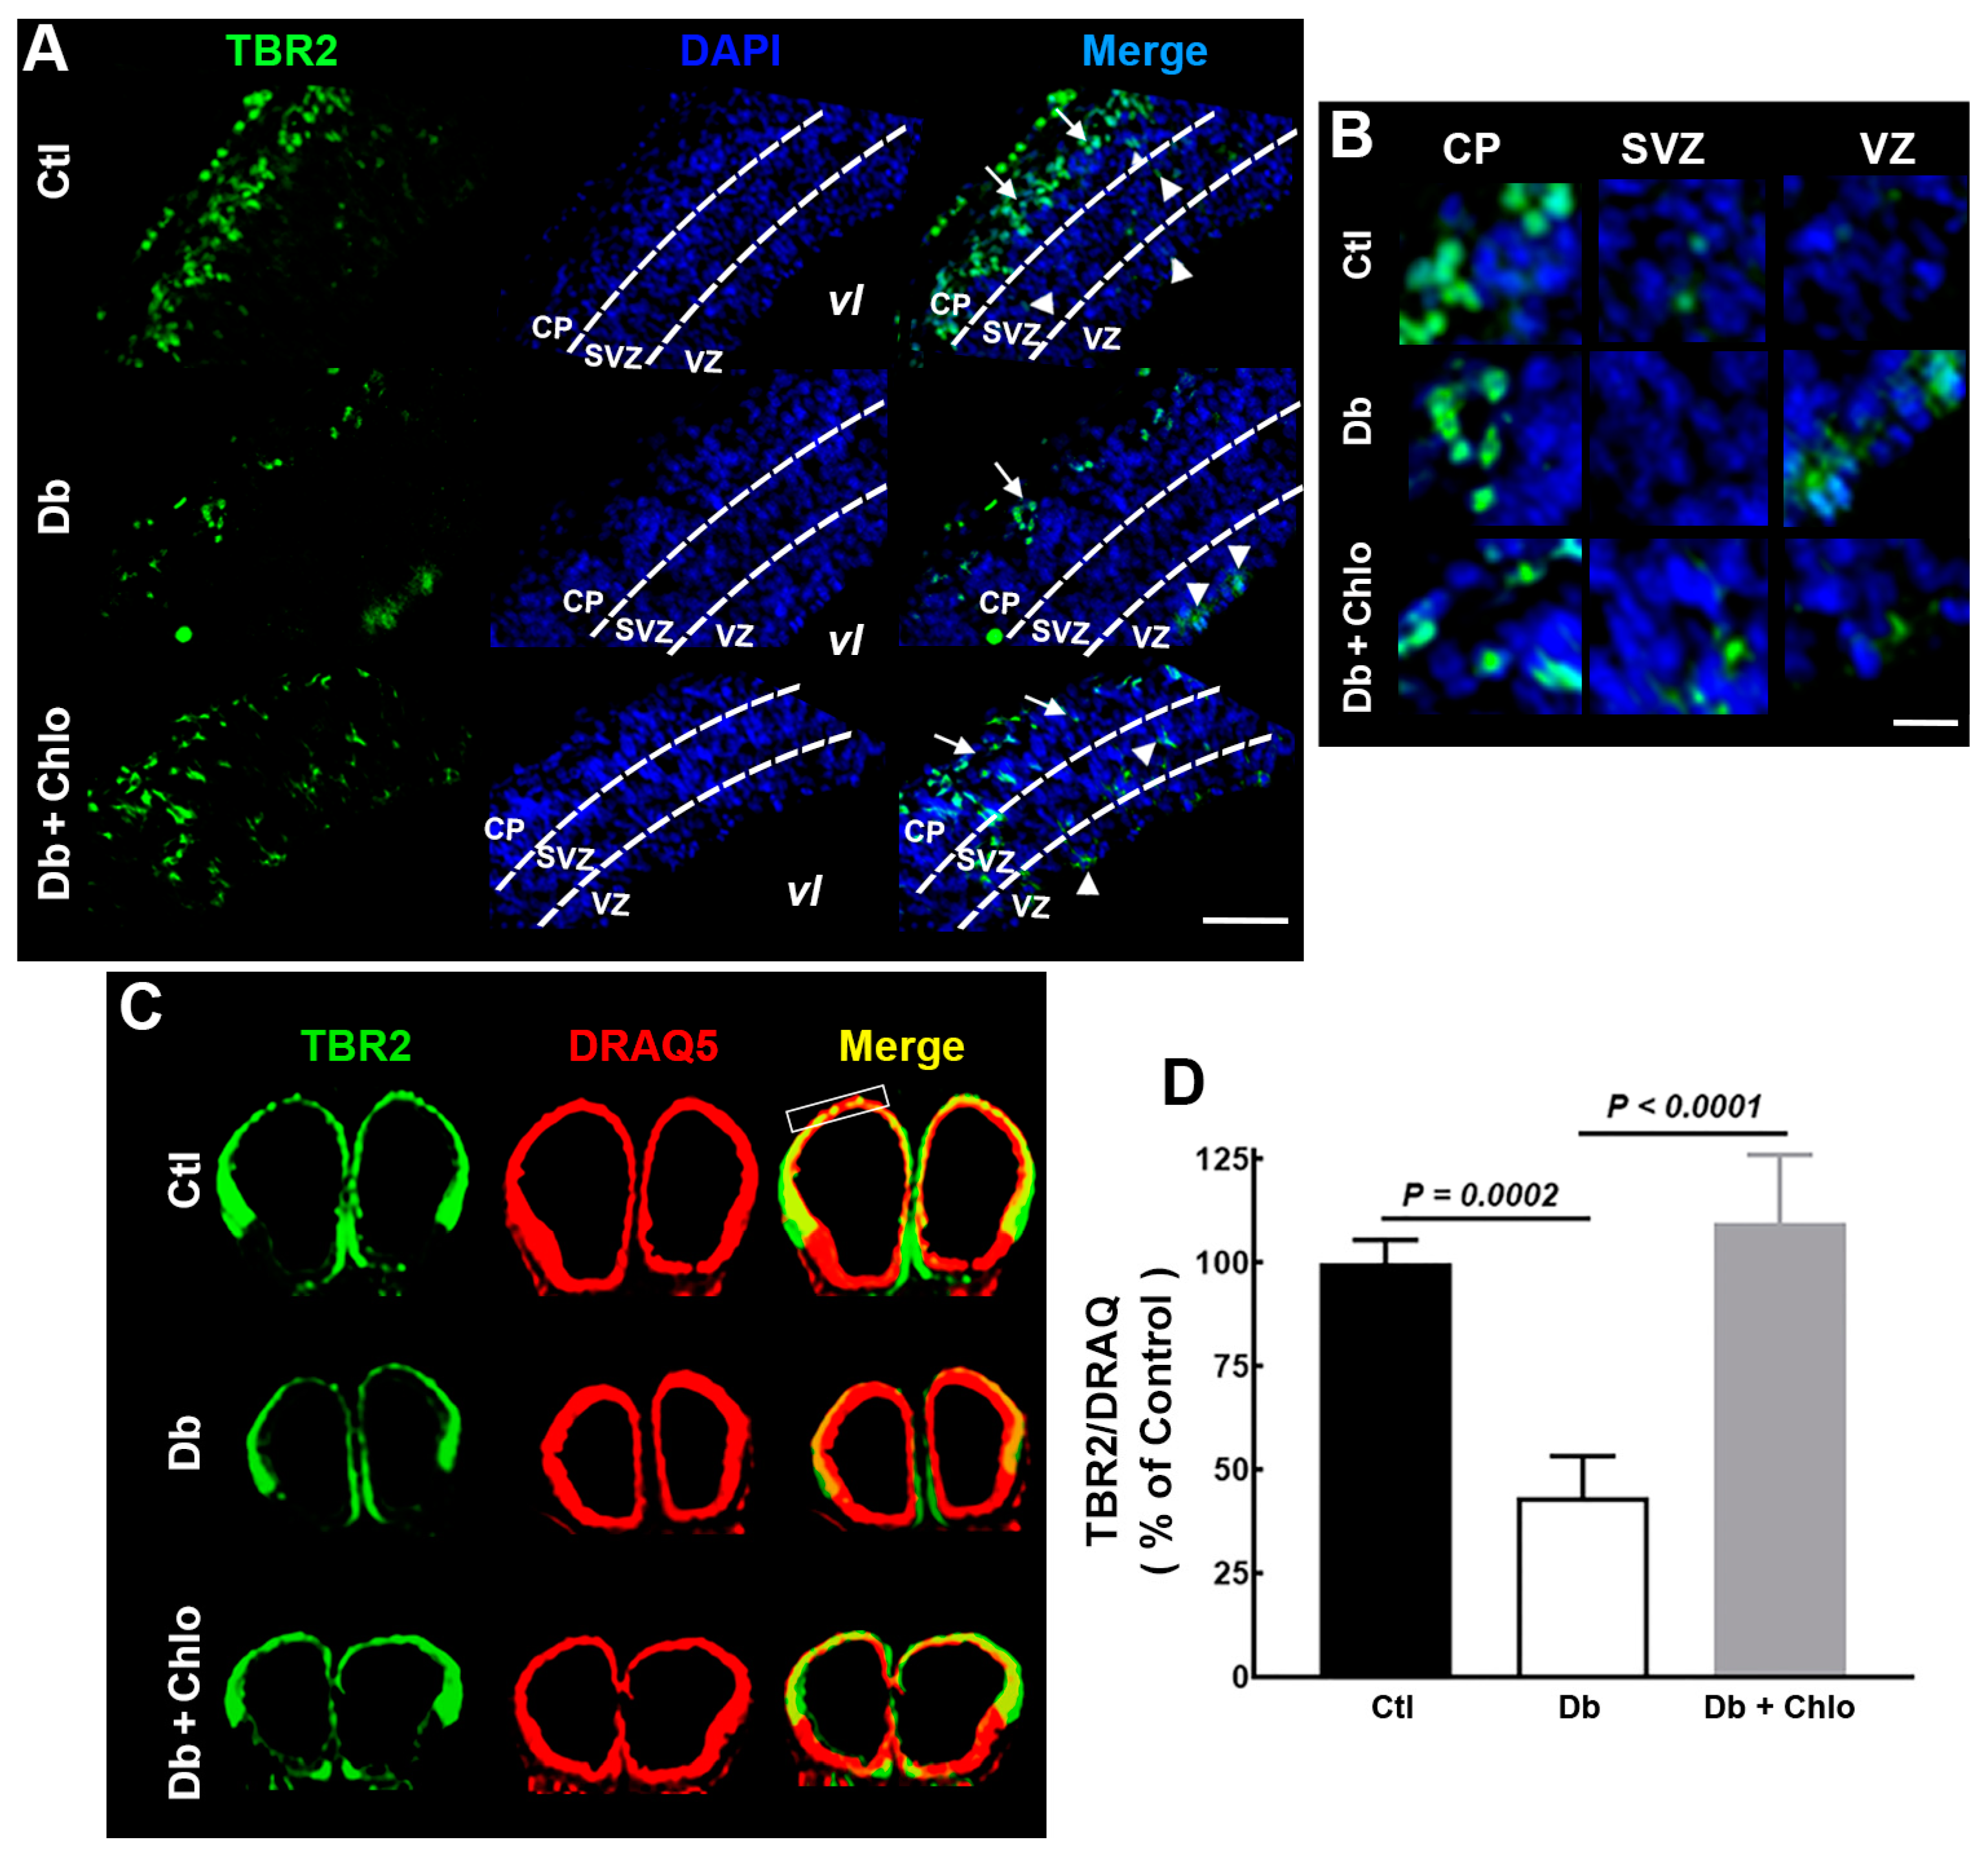
3.2. Effect of High Glucose and Chlorpheniramine on Neural Stem and Intermediate Progenitor Cells
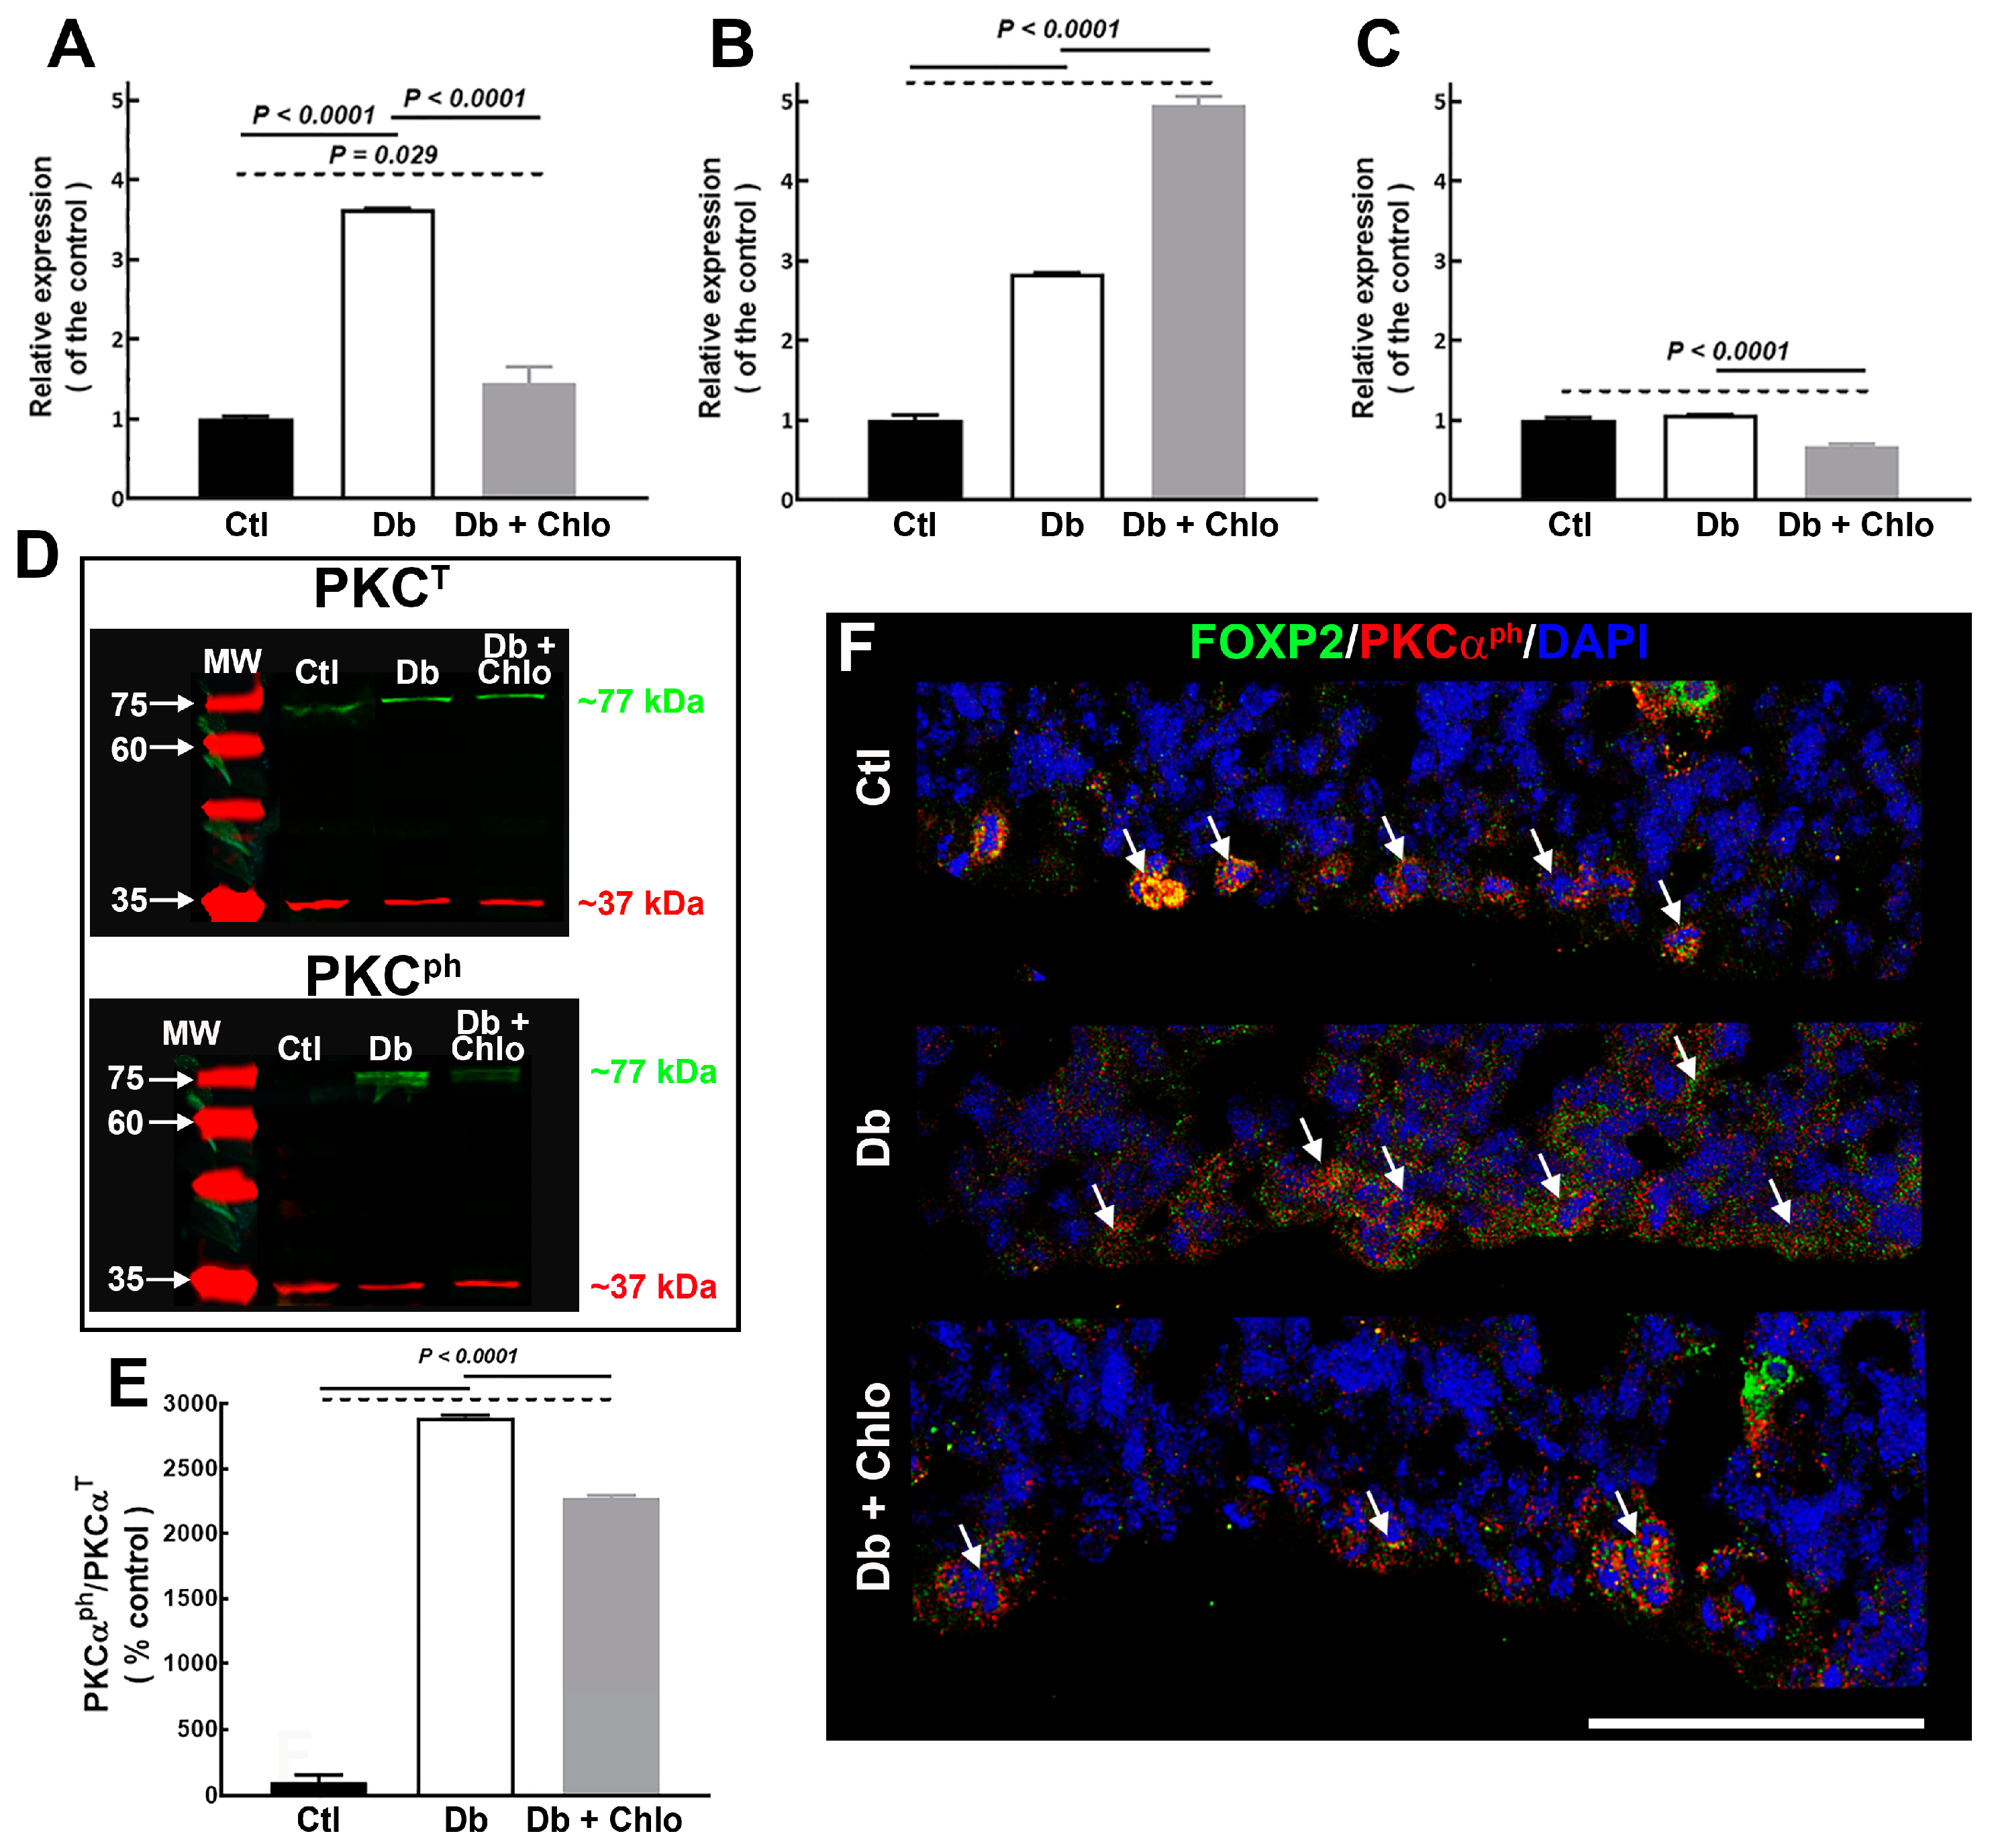
3.3. H1R Signaling Pathway Could Be Responsible for the Increased FOXP2 Nuclear Translocation
4. Discussion
Supplementary Materials
Author Contributions
Funding
Institutional Review Board Statement
Data Availability Statement
Acknowledgments
Conflicts of Interest
References
- Gaspard, N.; Gaillard, A.; Vanderhaeghen, P. Making cortex in a dish: In vitro corticopoiesis from embryonic stem cells. Cell Cycle 2009, 8, 2491–2496. [Google Scholar] [CrossRef] [PubMed]
- Gaspard, N.; Vanderhaeghen, P. Laminar fate specification in the cerebral cortex. F1000 Biol. Rep. 2011, 3, 6. [Google Scholar] [CrossRef]
- Molyneaux, B.J.; Arlotta, P.; Menezes, J.R.; Macklis, J.D. Neuronal subtype specification in the cerebral cortex. Nat. Rev. Neurosci. 2007, 8, 427–437. [Google Scholar] [CrossRef]
- Tsui, D.; Vessey, J.P.; Tomita, H.; Kaplan, D.R.; Miller, F.D. FoxP2 regulates neurogenesis during embryonic cortical development. J. Neurosci. 2013, 33, 244–258. [Google Scholar] [CrossRef]
- Castellucci, G.A.; McGinley, M.J.; McCormick, D.A. Knockout of Foxp2 disrupts vocal development in mice. Sci. Rep. 2016, 6, 23305. [Google Scholar] [CrossRef] [PubMed]
- Castellucci, G.A.; McGinley, M.J.; McCormick, D.A. Corrigendum: Knockout of Foxp2 disrupts vocal development in mice. Sci. Rep. 2017, 7, 39722. [Google Scholar] [CrossRef]
- Teramitsu, I.; White, S.A. FoxP2 regulation during undirected singing in adult songbirds. J. Neurosci. 2006, 26, 7390–7394. [Google Scholar] [CrossRef] [PubMed]
- Teramitsu, I.; White, S.A. Motor learning: The FoxP2 puzzle piece. Curr. Biol. 2008, 18, R335–R337. [Google Scholar] [CrossRef]
- Vargha-Khadem, F.; Gadian, D.G.; Copp, A.; Mishkin, M. FOXP2 and the neuroanatomy of speech and language. Nat. Rev. Neurosci. 2005, 6, 131–138. [Google Scholar] [CrossRef]
- Clovis, Y.M.; Enard, W.; Marinaro, F.; Huttner, W.B.; De Pietri Tonelli, D. Convergent repression of Foxp2 3’UTR by miR-9 and miR-132 in embryonic mouse neocortex: Implications for radial migration of neurons. Development 2012, 139, 3332–3342. [Google Scholar] [CrossRef] [Green Version]
- Garcia-Calero, E.; Botella-Lopez, A.; Bahamonde, O.; Perez-Balaguer, A.; Martinez, S. FoxP2 protein levels regulate cell morphology changes and migration patterns in the vertebrate developing telencephalon. Brain Struct. Funct. 2016, 221, 2905–2917. [Google Scholar] [CrossRef] [PubMed]
- Vernes, S.C.; Spiteri, E.; Nicod, J.; Groszer, M.; Taylor, J.M.; Davies, K.E.; Geschwind, D.H.; Fisher, S.E. High-throughput analysis of promoter occupancy reveals direct neural targets of FOXP2, a gene mutated in speech and language disorders. Am. J. Hum. Genet. 2007, 81, 1232–1250. [Google Scholar] [CrossRef] [PubMed]
- Chiu, Y.C.; Li, M.Y.; Liu, Y.H.; Ding, J.Y.; Yu, J.Y.; Wang, T.W. Foxp2 regulates neuronal differentiation and neuronal subtype specification. Dev. Neurobiol. 2014, 74, 723–738. [Google Scholar] [CrossRef]
- Shu, W.; Cho, J.Y.; Jiang, Y.; Zhang, M.; Weisz, D.; Elder, G.A.; Schmeidler, J.; De Gasperi, R.; Sosa, M.A.; Rabidou, D.; et al. Altered ultrasonic vocalization in mice with a disruption in the Foxp2 gene. Proc. Natl. Acad. Sci. USA 2005, 102, 9643–9648. [Google Scholar] [CrossRef] [PubMed]
- Kast, R.J.; Lanjewar, A.L.; Smith, C.D.; Levitt, P. FOXP2 exhibits projection neuron class specific expression, but is not required for multiple aspects of cortical histogenesis. eLife 2019, 8, e42012. [Google Scholar] [CrossRef]
- Fu, J.; Tay, S.S.; Ling, E.A.; Dheen, S.T. High glucose alters the expression of genes involved in proliferation and cell-fate specification of embryonic neural stem cells. Diabetologia 2006, 49, 1027–1038. [Google Scholar] [CrossRef]
- Ji, S.; Zhou, W.; Li, X.; Liu, S.; Wang, F.; Li, X.; Zhao, T.; Ji, G.; Du, J.; Hao, A. Maternal hyperglycemia disturbs neocortical neurogenesis via epigenetic regulation in C57BL/6J mice. Cell Death Dis. 2019, 10, 211. [Google Scholar] [CrossRef]
- Solis, K.H.; Mendez, L.I.; Garcia-Lopez, G.; Diaz, N.F.; Portillo, W.; De Nova-Ocampo, M.; Molina-Hernandez, A. The Histamine H1 Receptor Participates in the Increased Dorsal Telencephalic Neurogenesis in Embryos from Diabetic Rats. Front. Neurosci. 2017, 11, 676. [Google Scholar] [CrossRef]
- Molina-Hernandez, A.; Rodriguez-Martinez, G.; Escobedo-Avila, I.; Velasco, I. Histamine up-regulates fibroblast growth factor receptor 1 and increases FOXP2 neurons in cultured neural precursors by histamine type 1 receptor activation: Conceivable role of histamine in neurogenesis during cortical development in vivo. Neural Dev. 2013, 8, 4. [Google Scholar] [CrossRef]
- Rodriguez-Martinez, G.; Velasco, I.; Garcia-Lopez, G.; Solis, K.H.; Flores-Herrera, H.; Diaz, N.F.; Molina-Hernandez, A. Histamine is required during neural stem cell proliferation to increase neuron differentiation. Neuroscience 2012, 216, 10–17. [Google Scholar] [CrossRef]
- Mizuguchi, H.; Miyamoto, Y.; Terao, T.; Yoshida, H.; Kuroda, W.; Kitamura, Y.; Takeda, N.; Fukui, H. Signaling Pathway of Histamine H1 Receptor-Mediated Histamine H1 Receptor Gene Upregulation Induced by Histamine in U-373 MG Cells. Curr. Issues Mol. Biol. 2021, 43, 1243–1254. [Google Scholar] [CrossRef] [PubMed]
- Molina-Hernandez, A.; Velasco, I. Histamine induces neural stem cell proliferation and neuronal differentiation by activation of distinct histamine receptors. J. Neurochem. 2008, 106, 706–717. [Google Scholar] [CrossRef] [PubMed]
- Salazar Garcia, M.; Reyes Maldonado, E.; Revilla Monsalve, M.C.; Villavicencio Guzman, L.; Reyes Lopez, A.; Sanchez-Gomez, C. Importance of maternal diabetes on the chronological deregulation of the intrauterine development: An experimental study in rat. J. Diabetes Res. 2015, 2015, 354265. [Google Scholar] [CrossRef] [PubMed]
- Livak, K.J.; Schmittgen, T.D. Analysis of relative gene expression data using real-time quantitative PCR and the 2(-Delta Delta C(T)) Method. Methods 2001, 25, 402–408. [Google Scholar] [CrossRef] [PubMed]
- Bradford, M.M. A rapid and sensitive method for the quantitation of microgram quantities of protein utilizing the principle of protein-dye binding. Anal. Biochem. 1976, 72, 248–254. [Google Scholar] [CrossRef] [PubMed]
- Villanueva, M.A. Electrotransfer of proteins in an environmentally friendly methanol-free transfer buffer. Anal. Biochem. 2008, 373, 377–379. [Google Scholar] [CrossRef]
- Xue, Y.; Liu, Z.; Cao, J.; Ma, Q.; Gao, X.; Wang, Q.; Jin, C.; Zhou, Y.; Wen, L.; Ren, J. GPS 2.1: Enhanced prediction of kinase-specific phosphorylation sites with an algorithm of motif length selection. Protein Eng. Des. Sel. 2011, 24, 255–260. [Google Scholar] [CrossRef]
- Blom, N.; Gammeltoft, S.; Brunak, S. Sequence and structure-based prediction of eukaryotic protein phosphorylation sites. J. Mol. Biol. 1999, 294, 1351–1362. [Google Scholar] [CrossRef]
- Ren, J.; Wen, L.; Gao, X.; Jin, C.; Xue, Y.; Yao, X. DOG 1.0: Illustrator of protein domain structures. Cell Res. 2009, 19, 271–273. [Google Scholar] [CrossRef]
- Klausen, M.S.; Jespersen, M.C.; Nielsen, H.; Jensen, K.K.; Jurtz, V.I.; Sonderby, C.K.; Sommer, M.O.A.; Winther, O.; Nielsen, M.; Petersen, B.; et al. NetSurfP-2.0: Improved prediction of protein structural features by integrated deep learning. Proteins 2019, 87, 520–527. [Google Scholar] [CrossRef] [Green Version]
- Fujimori, K.; Takauji, R.; Tamamaki, N. Differential localization of high- and low-molecular-weight variants of microtubule-associated protein 2 in the developing rat telencephalon. J. Comp. Neurol. 2002, 449, 330–342. [Google Scholar] [CrossRef] [PubMed]
- Bauer, N.C.; Doetsch, P.W.; Corbett, A.H. Mechanisms Regulating Protein Localization. Traffic 2015, 16, 1039–1061. [Google Scholar] [CrossRef] [PubMed]
- Huang, S.M.; Chiou, W.L. Pharmacokinetics and tissue distribution of chlorpheniramine in rabbits after intravenous administration. J. Pharmacokinet. Biopharm. 1981, 9, 711–723. [Google Scholar] [CrossRef] [PubMed]
- Koch, K.M.; O’Connor-Semmes, R.L.; Davis, I.M.; Yin, Y. Stereoselective pharmacokinetics of chlorpheniramine and the effect of ranitidine. J. Pharm. Sci. 1998, 87, 1097–1100. [Google Scholar] [CrossRef] [PubMed]
- Sakurai, E.; Yamasaki, S.; Iizuka, Y.; Hikichi, N.; Niwa, H. The optical resolution of racemic chlorpheniramine and its stereoselective pharmacokinetics in rat plasma. J. Pharm. Pharmacol. 1992, 44, 44–47. [Google Scholar] [CrossRef]
- Mahar Doan, K.M.; Wring, S.A.; Shampine, L.J.; Jordan, K.H.; Bishop, J.P.; Kratz, J.; Yang, E.; Serabjit-Singh, C.J.; Adkison, K.K.; Polli, J.W. Steady-state brain concentrations of antihistamines in rats: Interplay of membrane permeability, P-glycoprotein efflux and plasma protein binding. Pharmacology 2004, 72, 92–98. [Google Scholar] [CrossRef]
- Xu, W.; Deng, J.; Qian, Y.; Hou, X.T.; Zhu, Z.; Zhao, M.; Shang, E.; Qian, D.; Zeng, H.; Pang, H.; et al. Simultaneous determination of kaempferol, quercetin, mangiferin, gallic acid, p-hydroxybenzoic acid and chlorpheniramine maleate in rat plasma after oral administration of Mang-Guo-Zhi-Ke tablets by UHPLC-MS/MS and its application to pharmacokinetics. Biomed. Chromatogr. 2018, 32, e4155. [Google Scholar] [CrossRef] [PubMed]
- Marquez-Valadez, B.; Aquino-Miranda, G.; Quintero-Romero, M.O.; Papacostas-Quintanilla, H.; Bueno-Nava, A.; Lopez-Rubalcava, C.; Diaz, N.F.; Arias-Montano, J.A.; Molina-Hernandez, A. The Systemic Administration of the Histamine H1 Receptor Antagonist/Inverse Agonist Chlorpheniramine to Pregnant Rats Impairs the Development of Nigro-Striatal Dopaminergic Neurons. Front. Neurosci. 2019, 13, 360. [Google Scholar] [CrossRef] [PubMed]
- Valle-Bautista, R.; Marquez-Valadez, B.; Herrera-Lopez, G.; Griego, E.; Galvan, E.J.; Diaz, N.F.; Arias-Montano, J.A.; Molina-Hernandez, A. Long-Term Functional and Cytoarchitectonic Effects of the Systemic Administration of the Histamine H1 Receptor Antagonist/Inverse Agonist Chlorpheniramine During Gestation in the Rat Offspring Primary Motor Cortex. Front. Neurosci. 2021, 15, 740282. [Google Scholar] [CrossRef] [PubMed]
- Dlamini, Z.; Mokoena, F.; Hull, R. Abnormalities in alternative splicing in diabetes: Therapeutic targets. J. Mol. Endocrinol. 2017, 59, R93–R107. [Google Scholar] [CrossRef] [PubMed] [Green Version]
- Huang, Z.; Bodkin, N.L.; Ortmeyer, H.K.; Zenilman, M.E.; Webster, N.J.; Hansen, B.C.; Shuldiner, A.R. Altered insulin receptor messenger ribonucleic acid splicing in liver is associated with deterioration of glucose tolerance in the spontaneously obese and diabetic rhesus monkey: Analysis of controversy between monkey and human studies. J. Clin. Endocrinol. Metab. 1996, 81, 1552–1556. [Google Scholar] [CrossRef] [PubMed]
- Pihlajamaki, J.; Lerin, C.; Itkonen, P.; Boes, T.; Floss, T.; Schroeder, J.; Dearie, F.; Crunkhorn, S.; Burak, F.; Jimenez-Chillaron, J.C.; et al. Expression of the splicing factor gene SFRS10 is reduced in human obesity and contributes to enhanced lipogenesis. Cell. Metab. 2011, 14, 208–218. [Google Scholar] [CrossRef] [PubMed]
- Villalba, A.; Gotz, M.; Borrell, V. The regulation of cortical neurogenesis. Curr. Top. Dev. Biol. 2021, 142, 1–66. [Google Scholar] [CrossRef] [PubMed]
- Lamus, F.; Martin, C.; Carnicero, E.; Moro, J.A.; Fernandez, J.M.F.; Mano, A.; Gato, A.; Alonso, M.I. FGF2/EGF contributes to brain neuroepithelial precursor proliferation and neurogenesis in rat embryos: The involvement of embryonic cerebrospinal fluid. Dev. Dyn. 2020, 249, 141–153. [Google Scholar] [CrossRef] [PubMed]
- Valle-Bautista, R.; Marquez-Valadez, B.; Fragoso-Cabrera, A.D.; Garcia-Lopez, G.; Diaz, N.F.; Herrera-Lopez, G.; Griego, E.; Galvan, E.J.; Arias-Montano, J.A.; Molina-Hernandez, A. Impaired Cortical Cytoarchitecture and Reduced Excitability of Deep-Layer Neurons in the Offspring of Diabetic Rats. Front. Cell Dev. Biol. 2020, 8, 564561. [Google Scholar] [CrossRef] [PubMed]
- Bruce, H.A.; Margolis, R.L. FOXP2: Novel exons, splice variants, and CAG repeat length stability. Hum. Genet. 2002, 111, 136–144. [Google Scholar] [CrossRef]
- Lai, C.S.; Fisher, S.E.; Hurst, J.A.; Vargha-Khadem, F.; Monaco, A.P. A forkhead-domain gene is mutated in a severe speech and language disorder. Nature 2001, 413, 519–523. [Google Scholar] [CrossRef]
- Ferland, R.J.; Cherry, T.J.; Preware, P.O.; Morrisey, E.E.; Walsh, C.A. Characterization of Foxp2 and Foxp1 mRNA and protein in the developing and mature brain. J. Comp. Neurol. 2003, 460, 266–279. [Google Scholar] [CrossRef]
- Noctor, S.C.; Martinez-Cerdeno, V.; Ivic, L.; Kriegstein, A.R. Cortical neurons arise in symmetric and asymmetric division zones and migrate through specific phases. Nat. Neurosci. 2004, 7, 136–144. [Google Scholar] [CrossRef]
- Miyata, T.; Kawaguchi, A.; Saito, K.; Kawano, M.; Muto, T.; Ogawa, M. Asymmetric production of surface-dividing and non-surface-dividing cortical progenitor cells. Development 2004, 131, 3133–3145. [Google Scholar] [CrossRef] [Green Version]
- Coomans de Brachene, A.; Demoulin, J.B. FOXO transcription factors in cancer development and therapy. Cell Mol. Life Sci. 2016, 73, 1159–1172. [Google Scholar] [CrossRef] [PubMed]
- Essaghir, A.; Dif, N.; Marbehant, C.Y.; Coffer, P.J.; Demoulin, J.B. The transcription of FOXO genes is stimulated by FOXO3 and repressed by growth factors. J. Biol. Chem. 2009, 284, 10334–10342. [Google Scholar] [CrossRef] [PubMed]
- Ma, R.Y.; Tong, T.H.; Leung, W.Y.; Yao, K.M. Raf/MEK/MAPK signaling stimulates the nuclear translocation and transactivating activity of FOXM1. Methods Mol. Biol. 2010, 7, 113–123. [Google Scholar] [CrossRef]
- Mizutani, A.; Matsuzaki, A.; Momoi, M.Y.; Fujita, E.; Tanabe, Y.; Momoi, T. Intracellular distribution of a speech/language disorder associated FOXP2 mutant. Biochem. Biophys. Res. Commun. 2007, 353, 869–874. [Google Scholar] [CrossRef]
- Black, A.R.; Black, J.D. Protein kinase C signaling and cell cycle regulation. Front. Immunol. 2012, 3, 423. [Google Scholar] [CrossRef]
- Calegari, F.; Huttner, W.B. An inhibition of cyclin-dependent kinases that lengthens, but does not arrest, neuroepithelial cell cycle induces premature neurogenesis. J. Cell Sci. 2003, 116, 4947–4955. [Google Scholar] [CrossRef] [PubMed]
- Guleria, R.S.; Pan, J.; Dipette, D.; Singh, U.S. Hyperglycemia inhibits retinoic acid-induced activation of Rac1, prevents differentiation of cortical neurons, and causes oxidative stress in a rat model of diabetic pregnancy. Diabetes 2006, 55, 3326–3334. [Google Scholar] [CrossRef] [PubMed]
- Lee, L.M.; Leung, M.B.; Kwok, R.C.; Leung, Y.C.; Wang, C.C.; McCaffery, P.J.; Copp, A.J.; Shum, A.S. Perturbation of Retinoid Homeostasis Increases Malformation Risk in Embryos Exposed to Pregestational Diabetes. Diabetes 2017, 66, 1041–1051. [Google Scholar] [CrossRef]
- Janesick, A.; Wu, S.C.; Blumberg, B. Retinoic acid signaling and neuronal differentiation. Cell Mol. Life Sci. 2015, 72, 1559–1576. [Google Scholar] [CrossRef]
- Tonge, P.D.; Andrews, P.W. Retinoic acid directs neuronal differentiation of human pluripotent stem cell lines in a non-cell-autonomous manner. Differentiation 2010, 80, 20–30. [Google Scholar] [CrossRef]
- Gotz, M.; Huttner, W.B. The cell biology of neurogenesis. Nat. Rev. Mol. Cell Biol. 2005, 6, 777–788. [Google Scholar] [CrossRef] [PubMed]
- Burstyn, I.; Sithole, F.; Zwaigenbaum, L. Autism spectrum disorders, maternal characteristics and obstetric complications among singletons born in Alberta, Canada. Chronic Dis. Can. 2010, 30, 125–134. [Google Scholar] [CrossRef] [PubMed]
- Zhang, X.; Lv, C.C.; Tian, J.; Miao, R.J.; Xi, W.; Hertz-Picciotto, I.; Qi, L. Prenatal and perinatal risk factors for autism in China. J. Autism Dev. Disord. 2010, 40, 1311–1321. [Google Scholar] [CrossRef]
- Moller, M.; Swanepoel, T.; Harvey, B.H. Neurodevelopmental Animal Models Reveal the Convergent Role of Neurotransmitter Systems, Inflammation, and Oxidative Stress as Biomarkers of Schizophrenia: Implications for Novel Drug Development. ACS Chem. Neurosci. 2015, 6, 987–1016. [Google Scholar] [CrossRef] [PubMed]
- Krakowiak, P.; Walker, C.K.; Bremer, A.A.; Baker, A.S.; Ozonoff, S.; Hansen, R.L.; Hertz-Picciotto, I. Maternal metabolic conditions and risk for autism and other neurodevelopmental disorders. Pediatrics 2012, 129, e1121–e1128. [Google Scholar] [CrossRef]
- Lyall, K.; Pauls, D.L.; Spiegelman, D.; Ascherio, A.; Santangelo, S.L. Pregnancy complications and obstetric suboptimality in association with autism spectrum disorders in children of the Nurses’ Health Study II. Autism Res. 2012, 5, 21–30. [Google Scholar] [CrossRef]


 Helix,
  Strand, and
  Coil. The relative surface accessibility is represented by the red (exposed sites) and blue (buried sites), and the percentage of the disorder is represented by the gray line, where the thickness is directly related to the level of disorder of each residue.
Helix, Strand, and Coil. The relative surface accessibility is represented by the red (exposed sites) and blue (buried sites), and the percentage of the disorder is represented by the gray line, where the thickness is directly related to the level of disorder of each residue.
Coil. The relative surface accessibility is represented by the red (exposed sites) and blue (buried sites), and the percentage of the disorder is represented by the gray line, where the thickness is directly related to the level of disorder of each residue.
Helix, Strand, and Coil. The relative surface accessibility is represented by the red (exposed sites) and blue (buried sites), and the percentage of the disorder is represented by the gray line, where the thickness is directly related to the level of disorder of each residue.


Disclaimer/Publisher’s Note: The statements, opinions and data contained in all publications are solely those of the individual author(s) and contributor(s) and not of MDPI and/or the editor(s). MDPI and/or the editor(s) disclaim responsibility for any injury to people or property resulting from any ideas, methods, instructions or products referred to in the content. |
© 2023 by the authors. Licensee MDPI, Basel, Switzerland. This article is an open access article distributed under the terms and conditions of the Creative Commons Attribution (CC BY) license (https://creativecommons.org/licenses/by/4.0/).
Share and Cite
De la Merced-García, D.S.; Sánchez-Barrera, Á.; Hernández-Yonca, J.; Mancilla, I.; García-López, G.; Díaz, N.F.; Terrazas, L.I.; Molina-Hernández, A. Increased Nuclear FOXP2 Is Related to Reduced Neural Stem Cell Number and Increased Neurogenesis in the Dorsal Telencephalon of Embryos of Diabetic Rats through Histamine H1 Receptors. Cells 2023, 12, 510. https://doi.org/10.3390/cells12030510
De la Merced-García DS, Sánchez-Barrera Á, Hernández-Yonca J, Mancilla I, García-López G, Díaz NF, Terrazas LI, Molina-Hernández A. Increased Nuclear FOXP2 Is Related to Reduced Neural Stem Cell Number and Increased Neurogenesis in the Dorsal Telencephalon of Embryos of Diabetic Rats through Histamine H1 Receptors. Cells. 2023; 12(3):510. https://doi.org/10.3390/cells12030510
Chicago/Turabian StyleDe la Merced-García, Diana Sarahi, Ángel Sánchez-Barrera, Juan Hernández-Yonca, Ismael Mancilla, Guadalupe García-López, Néstor Fabián Díaz, Luis Ignacio Terrazas, and Anayansi Molina-Hernández. 2023. "Increased Nuclear FOXP2 Is Related to Reduced Neural Stem Cell Number and Increased Neurogenesis in the Dorsal Telencephalon of Embryos of Diabetic Rats through Histamine H1 Receptors" Cells 12, no. 3: 510. https://doi.org/10.3390/cells12030510