
Reduced Cell–ECM Interactions in the EpiSC Colony Center Cause Heterogeneous Differentiation
 , and
, and 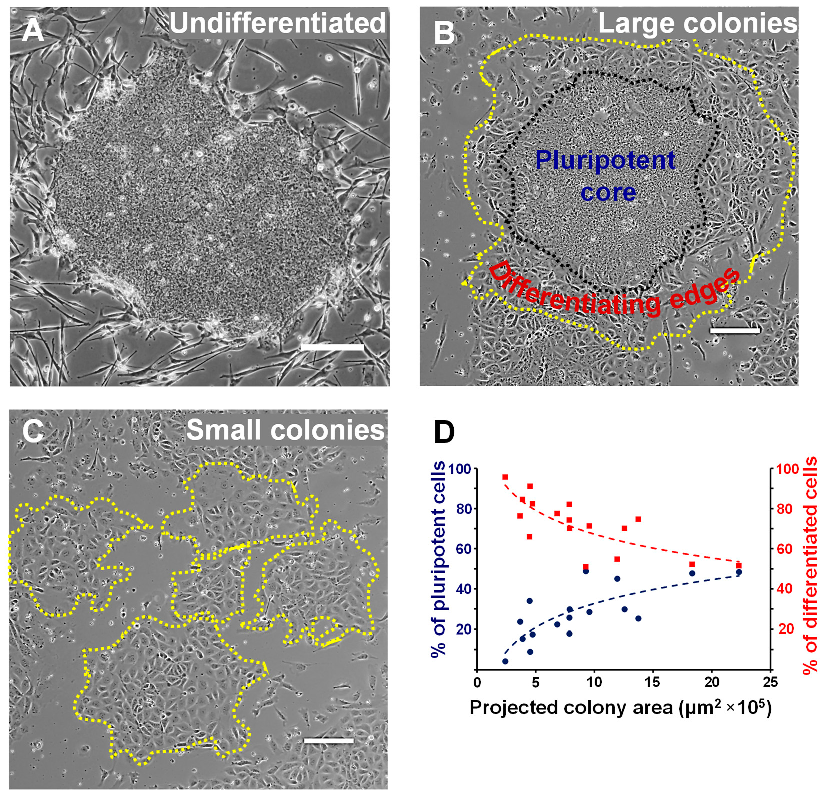
Abstract
:1. Introduction
2. Materials and Methods
2.1. EpiSC Culture and Treatments
2.2. EpiSC Differentiation on Fibronectin
2.3. Measuring Cellular Tractions on PAA Substrates
2.4. Widefield Epifluorescence Microscopy and Confocal Imaging
2.5. Quantifying Peripheral Differentiation within the Colony
2.6. Finite Element Analysis of EpiSC Colonies
2.7. Statistical Analysis
3. Results
3.1. The EpiSC Colony Size Dictates Differentiation Heterogeneity
3.2. A Colony Size Threshold Exists over which Cell Differentiation Becomes Heterogeneous
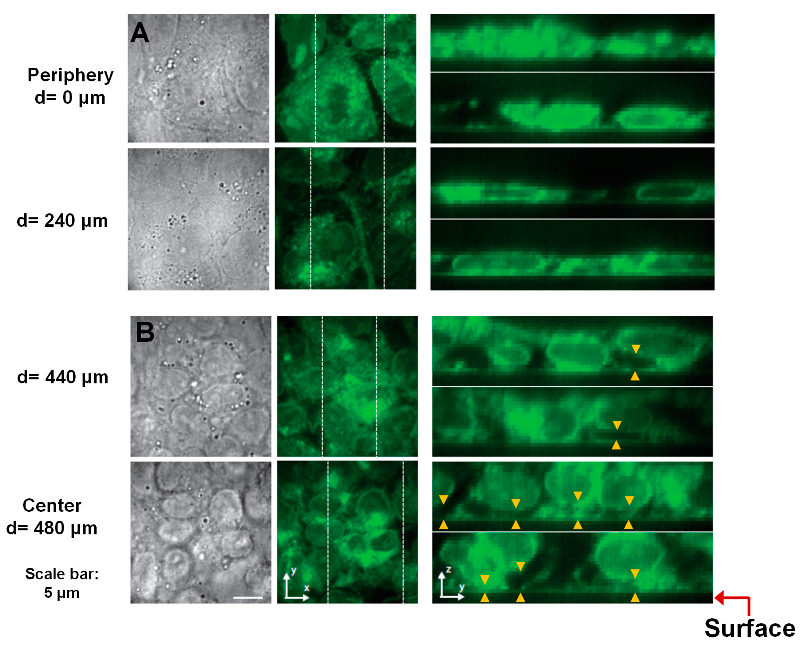
3.3. Reduced Cell–ECM Contact in the Colony Center Prevents Differentiation
3.4. Traction Stresses at the Colony Periphery Lead to Heterogeneous Differentiation
3.5. A Putative Model Explaining Cell Heterogeneity during EpiSC Colony Differentiation
4. Discussion
5. Conclusions
Supplementary Materials
Author Contributions
Funding
Institutional Review Board Statement
Informed Consent Statement
Data Availability Statement
Acknowledgments
Conflicts of Interest
References
- Thomson, J.A.; Itskovitz-Eldor, J.; Shapiro, S.S.; Waknitz, M.A.; Swiergiel, J.J.; Marshall, V.S.; Jones, J.M. Embryonic stem cell lines derived from human blastocysts. Science 1998, 282, 1145–1147. [Google Scholar] [CrossRef] [Green Version]
- Ware, C.B.; Nelson, A.M.; Mecham, B.; Hesson, J.; Zhou, W.; Jonlin, E.C.; Jimenez-Caliani, A.J.; Deng, X.; Cavanaugh, C.; Cook, S.; et al. Derivation of naive human embryonic stem cells. Proc. Natl. Acad. Sci. USA 2014, 111, 4484–4489. [Google Scholar] [CrossRef] [Green Version]
- Guo, G.; von Meyenn, F.; Santos, F.; Chen, Y.; Reik, W.; Bertone, P.; Smith, A.; Nichols, J. Naive Pluripotent Stem Cells Derived Directly from Isolated Cells of the Human Inner Cell Mass. Stem Cell Rep. 2016, 6, 437–446. [Google Scholar] [CrossRef] [Green Version]
- Ware, C.B. Concise Review: Lessons from Naïve Human Pluripotent Cells. Stem Cells 2017, 35, 35–41. [Google Scholar] [CrossRef] [Green Version]
- Evans, M.J.; Kaufman, M.H. Establishment in culture of pluripotential cells from mouse embryos. Nature 1981, 292, 154–156. [Google Scholar] [CrossRef] [PubMed]
- Martin, G.R. Isolation of a pluripotent cell line from early mouse embryos cultured in medium conditioned by teratocarcinoma stem cells. Proc. Natl. Acad. Sci. USA 1981, 78, 7634–7638. [Google Scholar] [CrossRef] [PubMed] [Green Version]
- Tesar, P.J.; Chenoweth, J.G.; Brook, F.A.; Davies, T.J.; Evans, E.P.; Mack, D.L.; Gardner, R.L.; McKay, R.D.G. New cell lines from mouse epiblast share defining features with human embryonic stem cells. Nature 2007, 448, 196–199. [Google Scholar] [CrossRef]
- Brons, I.G.M.; Smithers, L.E.; Trotter, M.W.B.; Rugg-Gunn, P.; Sun, B.; Chuva de Sousa Lopes, S.M.; Howlett, S.K.; Clarkson, A.; Ahrlund-Richter, L.; Pedersen, R.A.; et al. Derivation of pluripotent epiblast stem cells from mammalian embryos. Nature 2007, 448, 191–195. [Google Scholar] [CrossRef] [PubMed]
- Lau, K.X.; Mason, E.A.; Kie, J.; De Souza, D.P.; Kloehn, J.; Tull, D.; McConville, M.J.; Keniry, A.; Beck, T.; Blewitt, M.E.; et al. Unique properties of a subset of human pluripotent stem cells with high capacity for self-renewal. Nat. Commun. 2020, 11, 2420. [Google Scholar] [CrossRef]
- Hanna, J.; Cheng, A.W.; Saha, K.; Kim, J.; Lengner, C.J.; Soldner, F.; Cassady, J.P.; Muffat, J.; Carey, B.W.; Jaenisch, R. Human embryonic stem cells with biological and epigenetic characteristics similar to those of mouse ESCs. Proc. Natl. Acad. Sci. USA 2010, 107, 9222–9227. [Google Scholar] [CrossRef]
- Sugimoto, M.; Kondo, M.; Koga, Y.; Shiura, H.; Ikeda, R.; Hirose, M.; Ogura, A.; Murakami, A.; Yoshiki, A.; de Sousa Lopes, C.; et al. A Simple and Robust Method for Establishing Homogeneous Mouse Epiblast Stem Cell Lines by Wnt Inhibition. Stem Cell Rep. 2015, 4, 744–757. [Google Scholar] [CrossRef] [PubMed] [Green Version]
- Jouneau, A. Heterogeneity in Epiblast Stem Cells. In Stem Cells Heterogeneity—Novel Concepts; Springer: Berlin/Heidelberg, Germany, 2019; pp. 5–17. [Google Scholar]
- Nakanishi, M.; Mitchell, R.R.; Benoit, Y.D.; Orlando, L.; Reid, J.C.; Shimada, K.; Davidson, K.C.; Shapovalova, Z.; Collins, T.J.; Nagy, A.; et al. Human Pluripotency Is Initiated and Preserved by a Unique Subset of Founder Cells. Cell 2019, 177, 910–924. [Google Scholar] [CrossRef] [PubMed]
- Rosowski, K.A.; Mertz, A.F.; Norcross, S.; Dufresne, E.R.; Horsley, V. Edges of human embryonic stem cell colonies display distinct mechanical properties and differentiation potential. Sci. Rep. 2015, 5, 14218. [Google Scholar] [CrossRef] [PubMed] [Green Version]
- Yang, Y.; Ren, Z.; Xu, F.; Meng, Y.; Zhang, Y.; Ai, N.; Long, Y.; Fok, H.I.; Deng, C.; Zhao, X.; et al. Endogenous IGF Signaling Directs Heterogeneous Mesoderm Differentiation in Human Embryonic Stem Cells. Cell Rep. 2019, 29, 3374–3384.e3375. [Google Scholar] [CrossRef] [Green Version]
- Hayashi, Y.; Furue, M.K.; Okamoto, T.; Ohnuma, K.; Myoishi, Y.; Fukuhara, Y.; Abe, T.; Sato, J.D.; Hata, R.-I.; Asashima, M. Integrins Regulate Mouse Embryonic Stem Cell Self-Renewal. Stem Cells 2007, 25, 3005–3015. [Google Scholar] [CrossRef]
- Wang, N.; Tolić-Nørrelykke, I.M.; Chen, J.; Mijailovich, S.M.; Butler, J.P.; Fredberg, J.J.; Stamenović, D. Cell prestress. I. Stiffness and prestress are closely associated in adherent contractile cells. Am. J. Physiol.-Cell Physiol. 2002, 282, C606–C616. [Google Scholar] [CrossRef] [Green Version]
- Weng, C.H.; Tang, J.; Han, K.Y. Optimizing the performance of multiline-scanning confocal microscopy. J. Phys. D Appl. Phys. 2020, 54, 105401. [Google Scholar] [CrossRef]
- Nagaoka, M.; Koshimizu, U.; Yuasa, S.; Hattori, F.; Chen, H.; Tanaka, T.; Okabe, M.; Fukuda, K.; Akaike, T. E-Cadherin-Coated Plates Maintain Pluripotent ES Cells without Colony Formation. PLoS ONE 2006, 1, e15. [Google Scholar] [CrossRef] [Green Version]
- Chowdhury, F.; Li, Y.; Poh, Y.-C.; Yokohama-Tamaki, T.; Wang, N.; Tanaka, T.S. Soft Substrates Promote Homogeneous Self-Renewal of Embryonic Stem Cells via Downregulating Cell-Matrix Tractions. PLoS ONE 2010, 5, e15655. [Google Scholar] [CrossRef]
- Chowdhury, F.; Huang, B.; Wang, N. Forces in stem cells and cancer stem cells. Cells Dev. 2022, 170, 203776. [Google Scholar] [CrossRef]
- San Miguel-Ruiz, J.E.; Letourneau, P.C. The Role of Arp2/3 in Growth Cone Actin Dynamics and Guidance Is Substrate Dependent. J. Neurosci. 2014, 34, 5895–5908. [Google Scholar] [CrossRef] [PubMed] [Green Version]
- Hetrick, B.; Han, M.S.; Helgeson, L.A.; Nolen, B.J. Small Molecules CK-666 and CK-869 Inhibit Actin-Related Protein 2/3 Complex by Blocking an Activating Conformational Change. Chem. Biol. 2013, 20, 701–712. [Google Scholar] [CrossRef] [PubMed] [Green Version]
- Solon, J.; Levental, I.; Sengupta, K.; Georges, P.C.; Janmey, P.A. Fibroblast Adaptation and Stiffness Matching to Soft Elastic Substrates. Biophys. J. 2007, 93, 4453–4461. [Google Scholar] [CrossRef] [PubMed] [Green Version]
- Chowdhury, F.; Huang, B.; Wang, N. Cytoskeletal prestress: The cellular hallmark in mechanobiology and mechanomedicine. Cytoskeleton 2021, 78, 249–276. [Google Scholar] [CrossRef]
- Chowdhury, F.; Na, S.; Li, D.; Poh, Y.-C.; Tanaka, T.S.; Wang, F.; Wang, N. Material properties of the cell dictate stress-induced spreading and differentiation in embryonic stem cells. Nat. Mater. 2009, 9, 82–88. [Google Scholar] [CrossRef] [Green Version]
- Uda, Y.; Poh, Y.-C.; Chowdhury, F.; Wu, D.C.; Tanaka, T.S.; Sato, M.; Wang, N. Force via integrins but not E-cadherin decreases Oct3/4 expression in embryonic stem cells. Biochem. Biophys. Res. Commun. 2011, 415, 396–400. [Google Scholar] [CrossRef] [Green Version]
- Redmer, T.; Diecke, S.; Grigoryan, T.; Quiroga-Negreira, A.; Birchmeier, W.; Besser, D. E-cadherin is crucial for embryonic stem cell pluripotency and can replace OCT4 during somatic cell reprogramming. EMBO Rep. 2011, 12, 720–726. [Google Scholar] [CrossRef] [Green Version]
- Chen, T.; Yuan, D.; Wei, B.; Jiang, J.; Kang, J.; Ling, K.; Gu, Y.; Li, J.; Xiao, L.; Pei, G. E-Cadherin-Mediated Cell–Cell Contact Is Critical for Induced Pluripotent Stem Cell Generation. Stem Cells 2010, 28, 1315–1325. [Google Scholar] [CrossRef]
- Riethmacher, D.; Brinkmann, V.; Birchmeier, C. A targeted mutation in the mouse E-cadherin gene results in defective preimplantation development. Proc. Natl. Acad. Sci. USA 1995, 92, 855–859. [Google Scholar] [CrossRef] [Green Version]
- Hayashi, Y.; Furue, M.K. Biological Effects of Culture Substrates on Human Pluripotent Stem Cells. Stem Cells Int. 2016, 2016, 5380560. [Google Scholar] [CrossRef]
- George, E.L.; Georges-Labouesse, E.N.; Patel-King, R.S.; Rayburn, H.; Hynes, R.O. Defects in mesoderm, neural tube and vascular development in mouse embryos lacking fibronectin. Development 1993, 119, 1079–1091. [Google Scholar] [CrossRef] [PubMed]
- Yang, J.T.; Rayburn, H.; Hynes, R.O. Embryonic mesodermal defects in alpha 5 integrin-deficient mice. Development 1993, 119, 1093–1105. [Google Scholar] [CrossRef] [PubMed]
- Liang, D.; Wang, X.; Mittal, A.; Dhiman, S.; Hou, S.-Y.; Degenhardt, K.; Astrof, S. Mesodermal expression of integrin α5β1 regulates neural crest development and cardiovascular morphogenesis. Dev. Biol. 2014, 395, 232–244. [Google Scholar] [CrossRef] [PubMed] [Green Version]
- George, E.L.; Baldwin, H.S.; Hynes, R.O. Fibronectins Are Essential for Heart and Blood Vessel Morphogenesis but Are Dispensable for Initial Specification of Precursor Cells. Blood 1997, 90, 3073–3081. [Google Scholar] [CrossRef] [Green Version]
- Baxter, M.A.; Camarasa, M.V.; Bates, N.; Small, F.; Murray, P.; Edgar, D.; Kimber, S.J. Analysis of the distinct functions of growth factors and tissue culture substrates necessary for the long-term self-renewal of human embryonic stem cell lines. Stem Cell Res. 2009, 3, 28–38. [Google Scholar] [CrossRef] [PubMed]
- Watanabe, K.; Ueno, M.; Kamiya, D.; Nishiyama, A.; Matsumura, M.; Wataya, T.; Takahashi, J.B.; Nishikawa, S.; Nishikawa, S.-I.; Muguruma, K.; et al. A ROCK inhibitor permits survival of dissociated human embryonic stem cells. Nat. Biotechnol. 2007, 25, 681–686. [Google Scholar] [CrossRef]
- Yang, Q.; Zhang, X.-F.; Pollard, T.D.; Forscher, P. Arp2/3 complex–dependent actin networks constrain myosin II function in driving retrograde actin flow. J. Cell Biol. 2012, 197, 939–956. [Google Scholar] [CrossRef] [Green Version]
- Tse, J.R.; Engler, A.J. Preparation of Hydrogel Substrates with Tunable Mechanical Properties. Curr. Protoc. Cell Biol. 2010, 47, 10–16. [Google Scholar] [CrossRef]
- Engler, A.; Bacakova, L.; Newman, C.; Hategan, A.; Griffin, M.; Discher, D. Substrate Compliance versus Ligand Density in Cell on Gel Responses. Biophys. J. 2004, 86, 617–628. [Google Scholar] [CrossRef]


Disclaimer/Publisher’s Note: The statements, opinions and data contained in all publications are solely those of the individual author(s) and contributor(s) and not of MDPI and/or the editor(s). MDPI and/or the editor(s) disclaim responsibility for any injury to people or property resulting from any ideas, methods, instructions or products referred to in the content. |
© 2023 by the authors. Licensee MDPI, Basel, Switzerland. This article is an open access article distributed under the terms and conditions of the Creative Commons Attribution (CC BY) license (https://creativecommons.org/licenses/by/4.0/).
Share and Cite
Amar, K.; Saha, S.; Debnath, A.; Weng, C.H.; Roy, A.; Han, K.Y.; Chowdhury, F. Reduced Cell–ECM Interactions in the EpiSC Colony Center Cause Heterogeneous Differentiation. Cells 2023, 12, 326. https://doi.org/10.3390/cells12020326
Amar K, Saha S, Debnath A, Weng CH, Roy A, Han KY, Chowdhury F. Reduced Cell–ECM Interactions in the EpiSC Colony Center Cause Heterogeneous Differentiation. Cells. 2023; 12(2):326. https://doi.org/10.3390/cells12020326
Chicago/Turabian StyleAmar, Kshitij, Sanjoy Saha, Avishek Debnath, Chun Hung Weng, Arpan Roy, Kyu Young Han, and Farhan Chowdhury. 2023. "Reduced Cell–ECM Interactions in the EpiSC Colony Center Cause Heterogeneous Differentiation" Cells 12, no. 2: 326. https://doi.org/10.3390/cells12020326