
A Comprehensive Study on the Electrostatic Properties of Tubulin-Tubulin Complexes in Microtubules

Abstract
:1. Introduction
2. Methods
2.1. Structure Preparation
2.2. Electrostatic Potential
2.3. Electric Field Lines
2.4. Electrostatic Forces
2.5. Molecular Dynamic Simulations
3. Results and Discussions
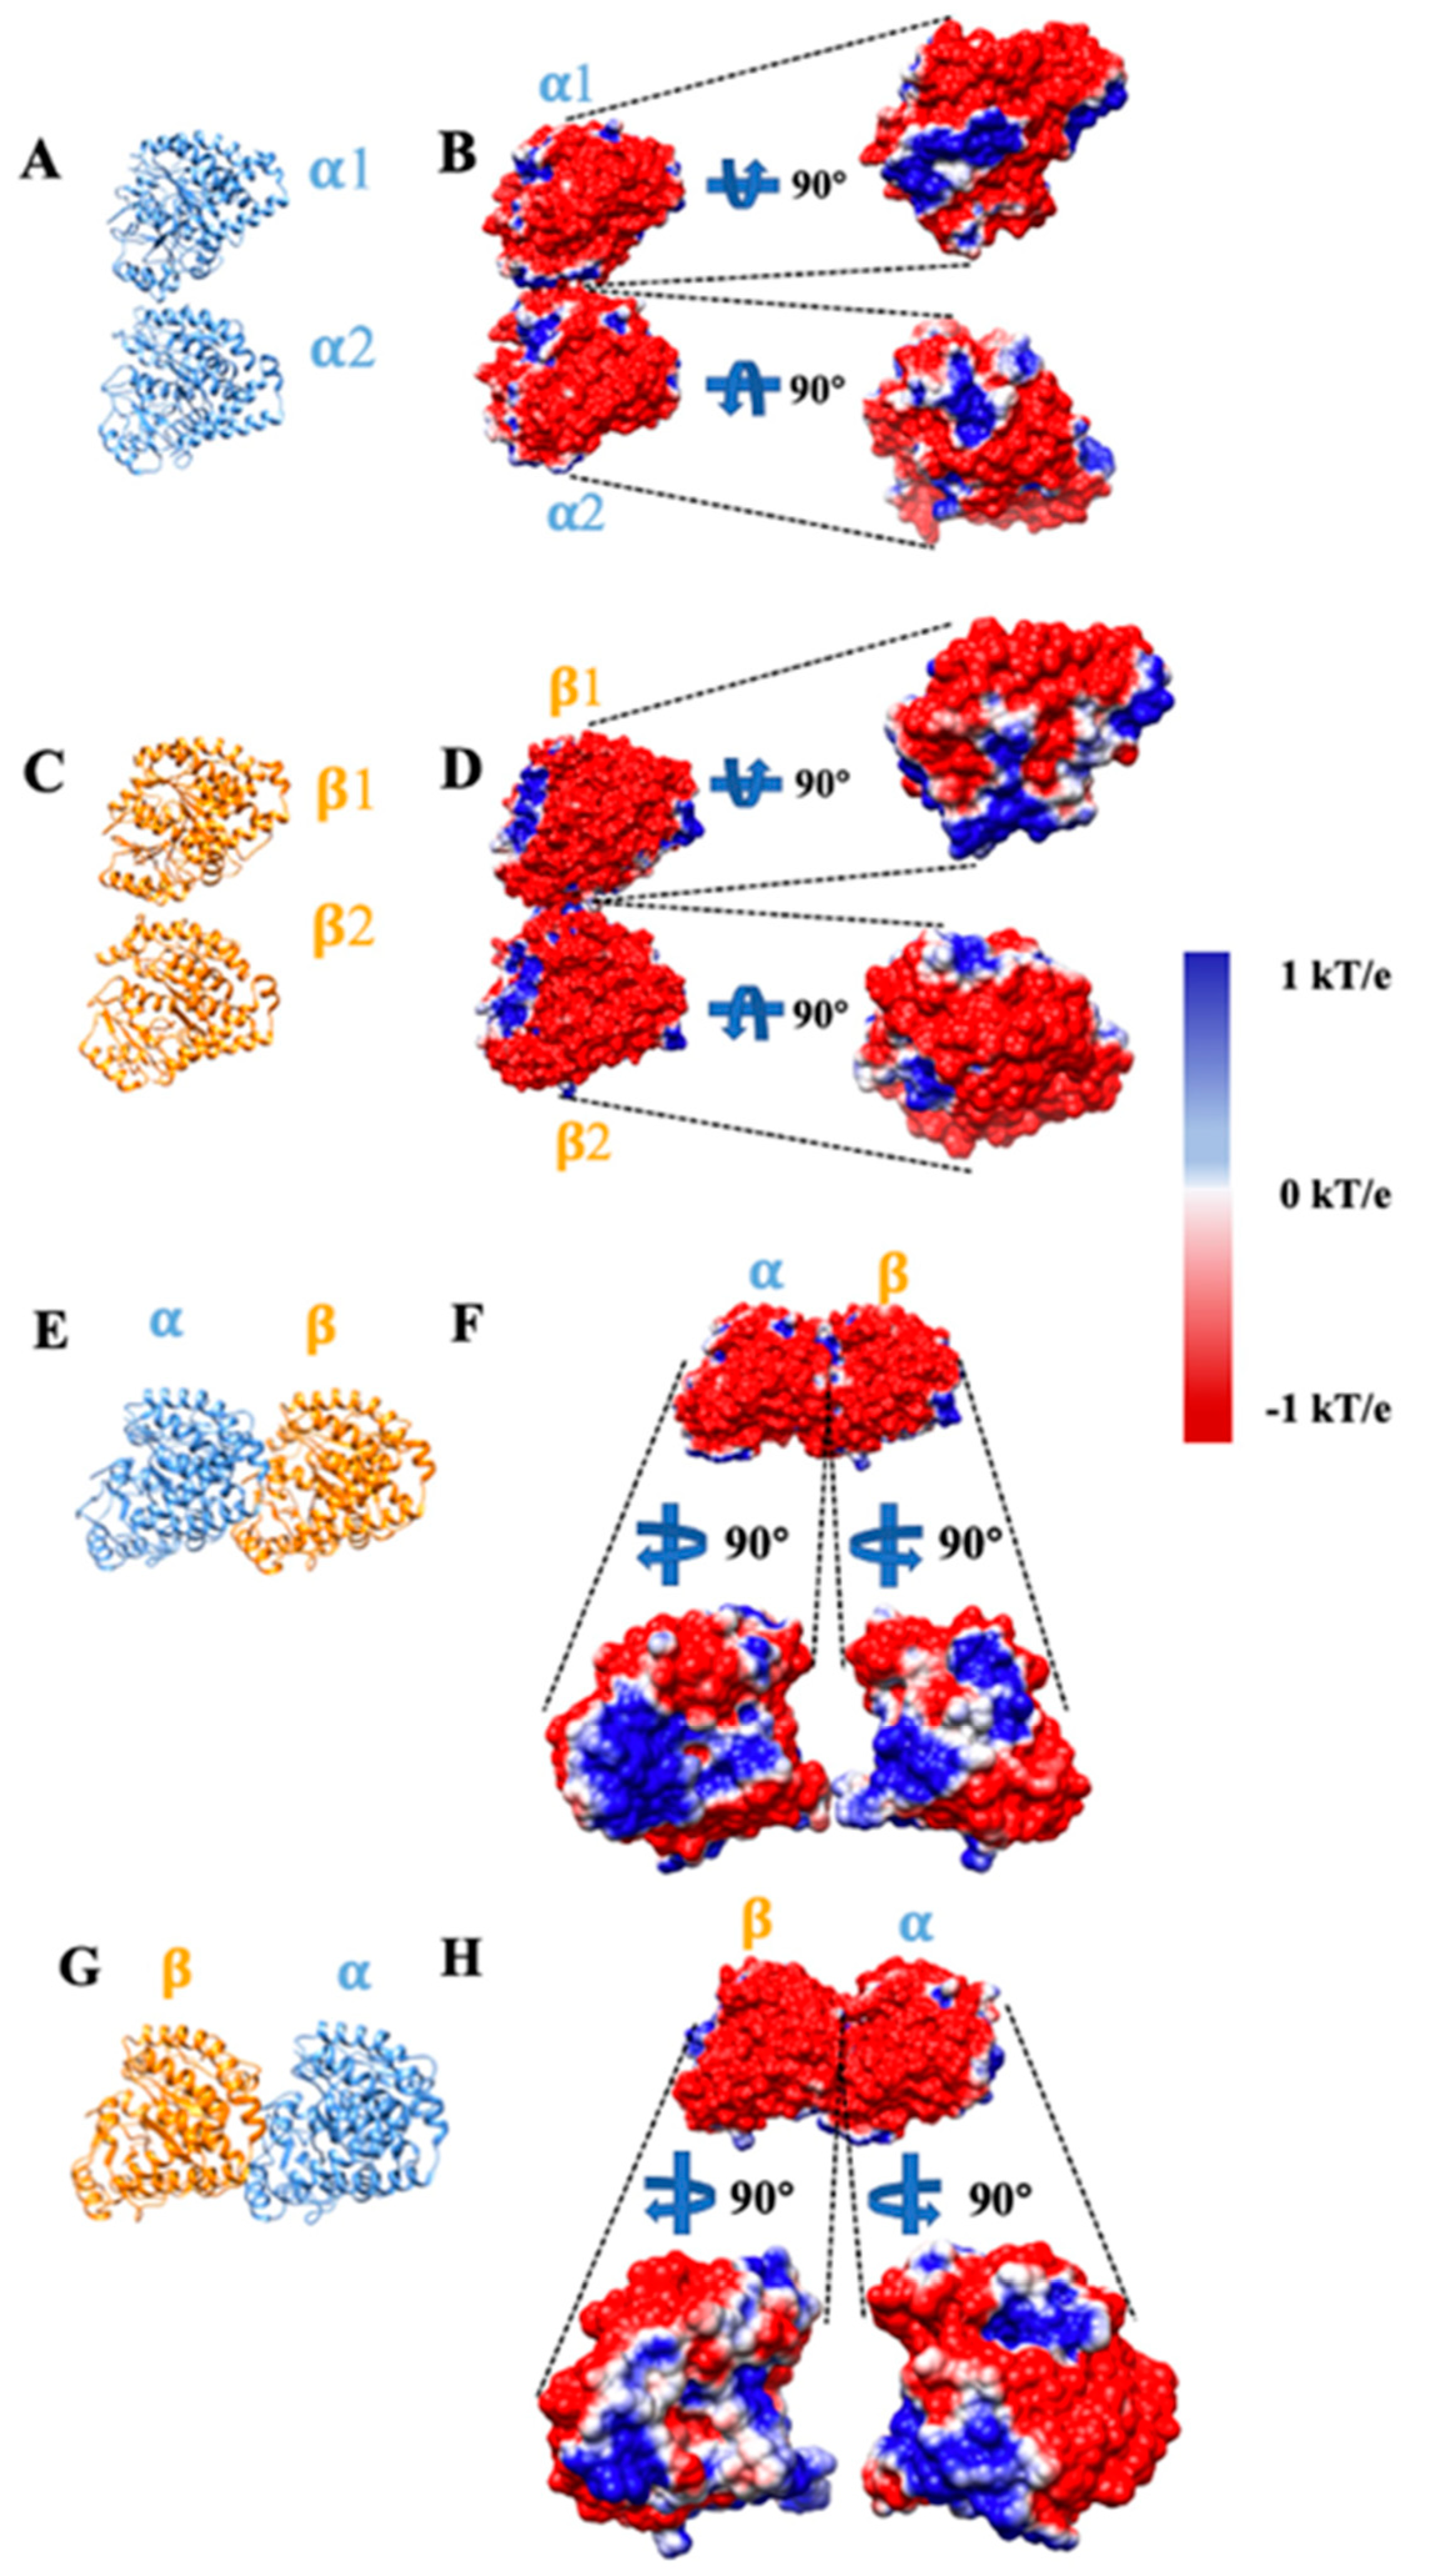
3.1. Surface Electrostatic Potentials of Tubulins
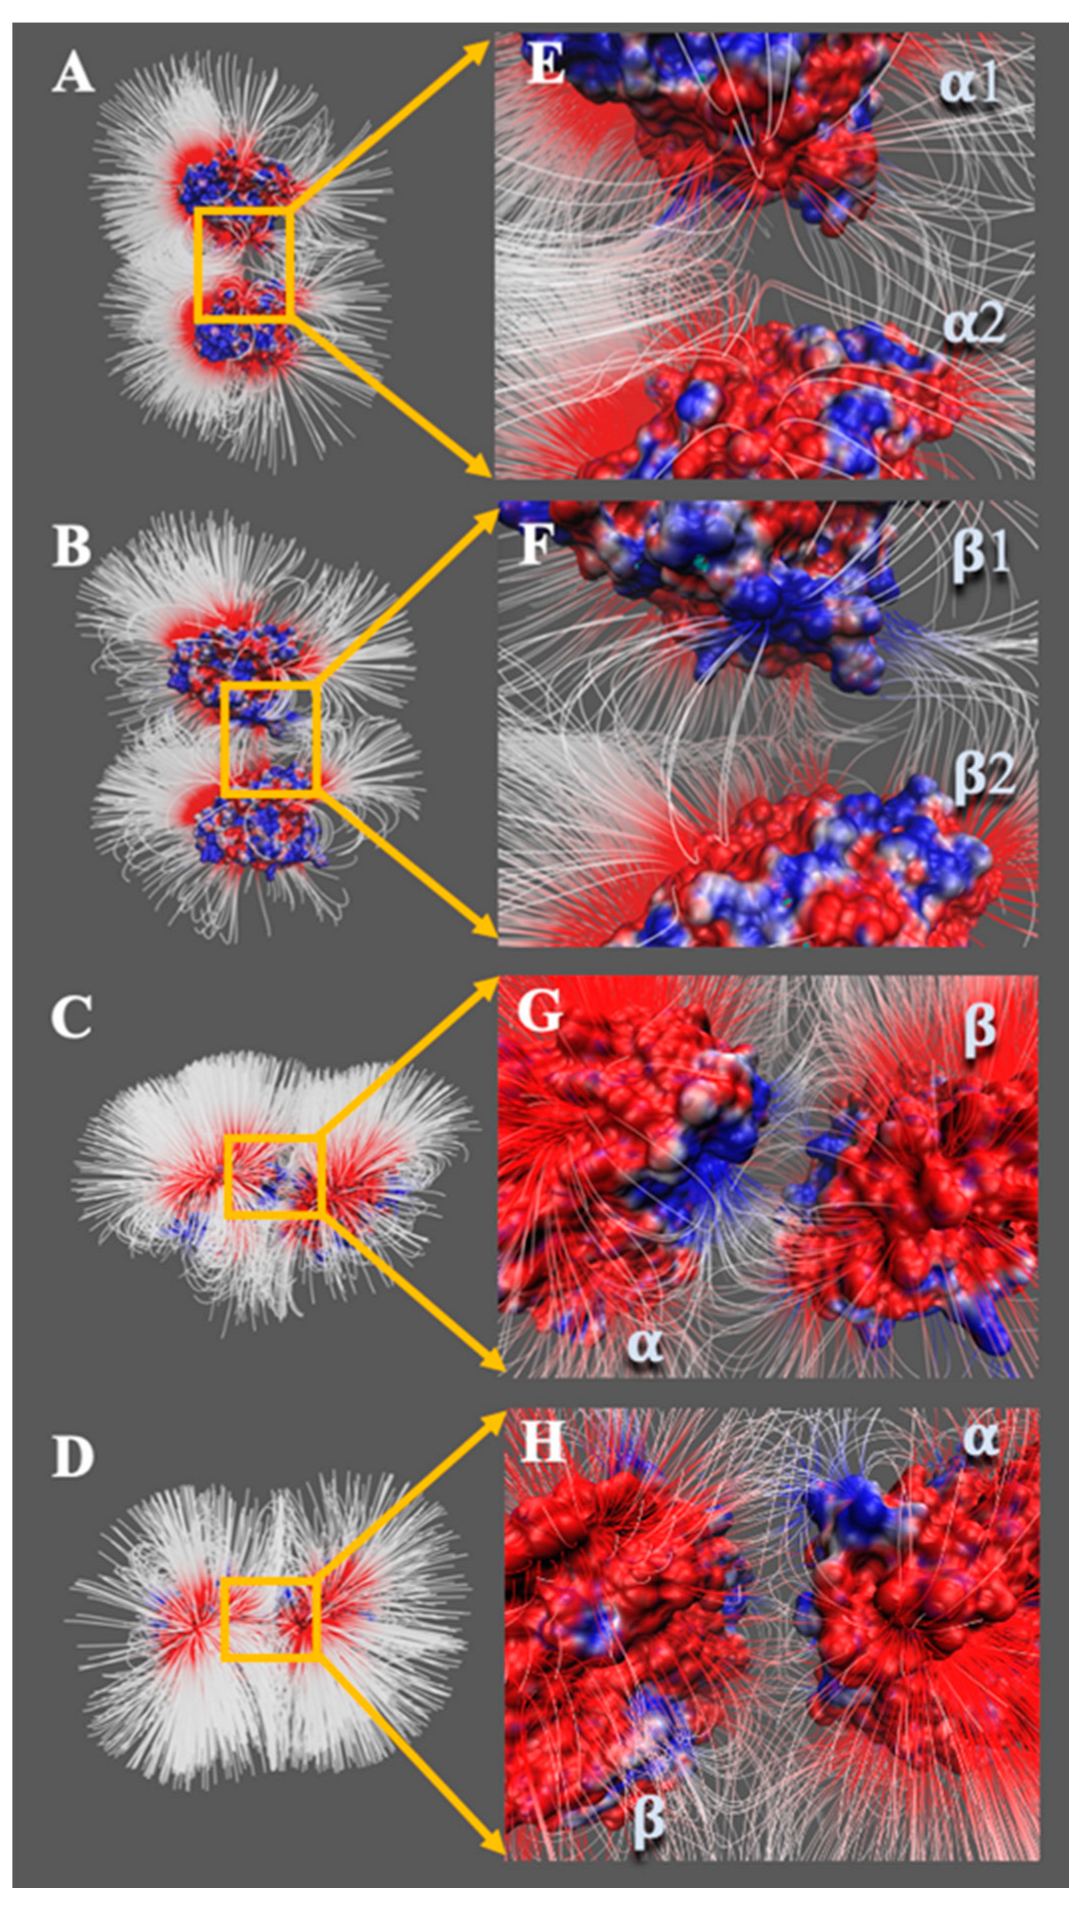
3.2. Electric Field Lines of Tubulins
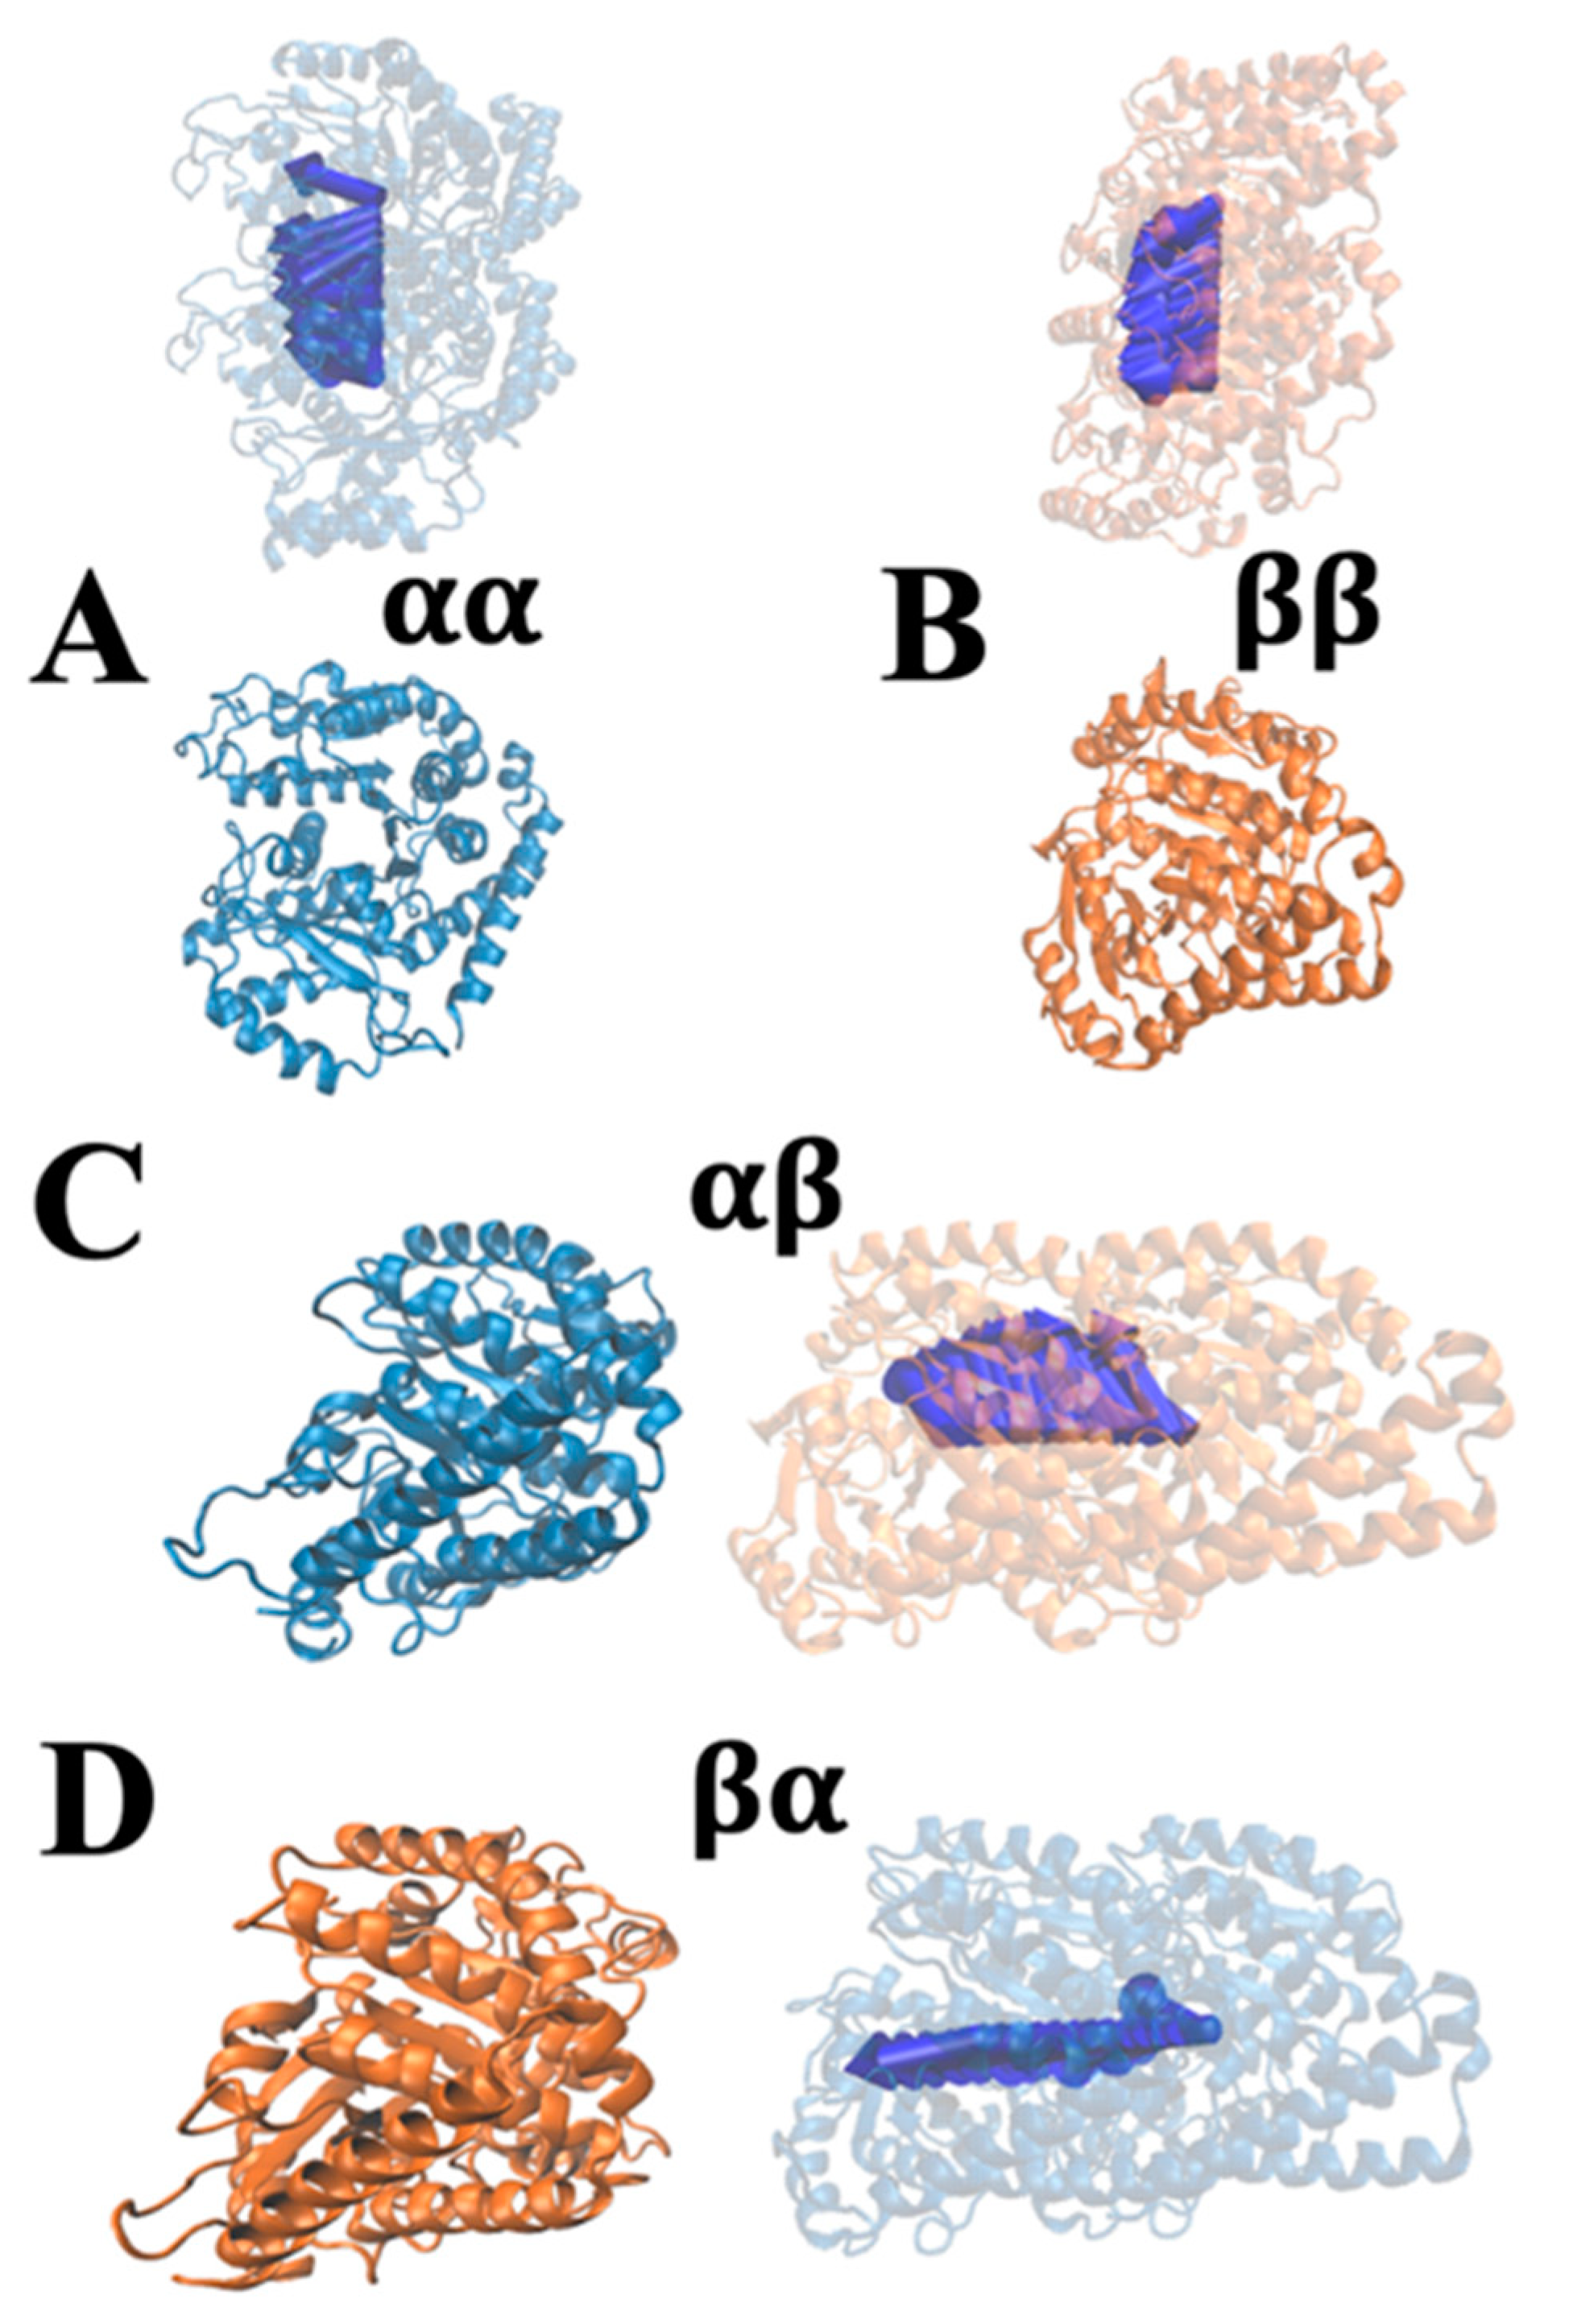
3.3. Electrostatic Forces of Tubulins
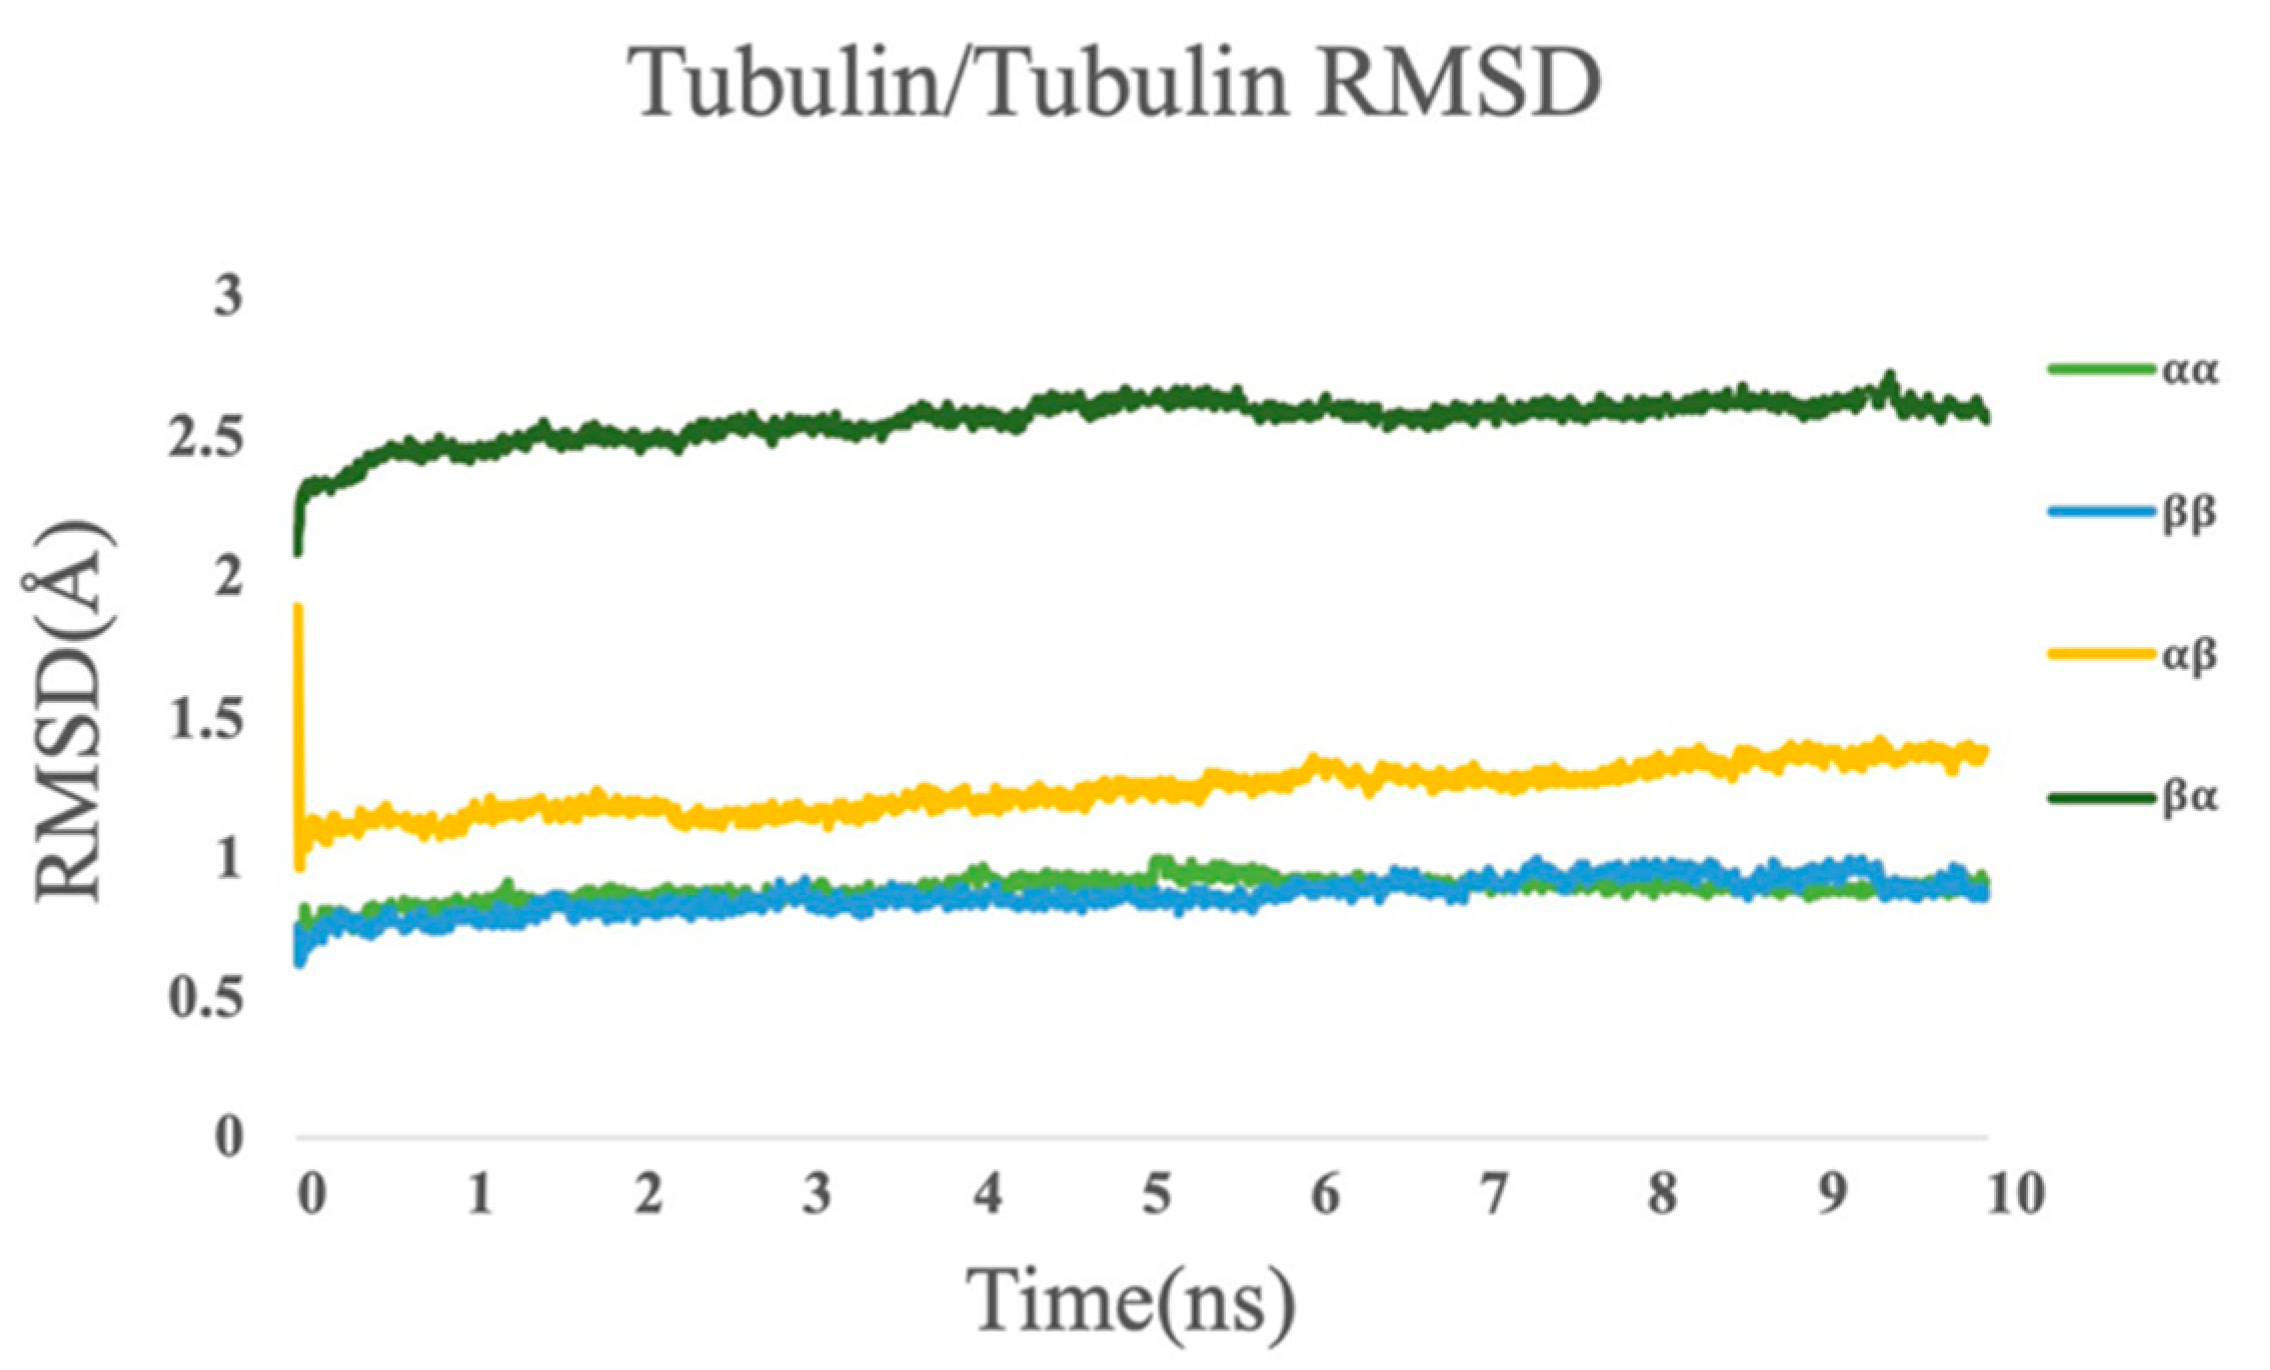
3.4. Molecular Dynamics Simulations
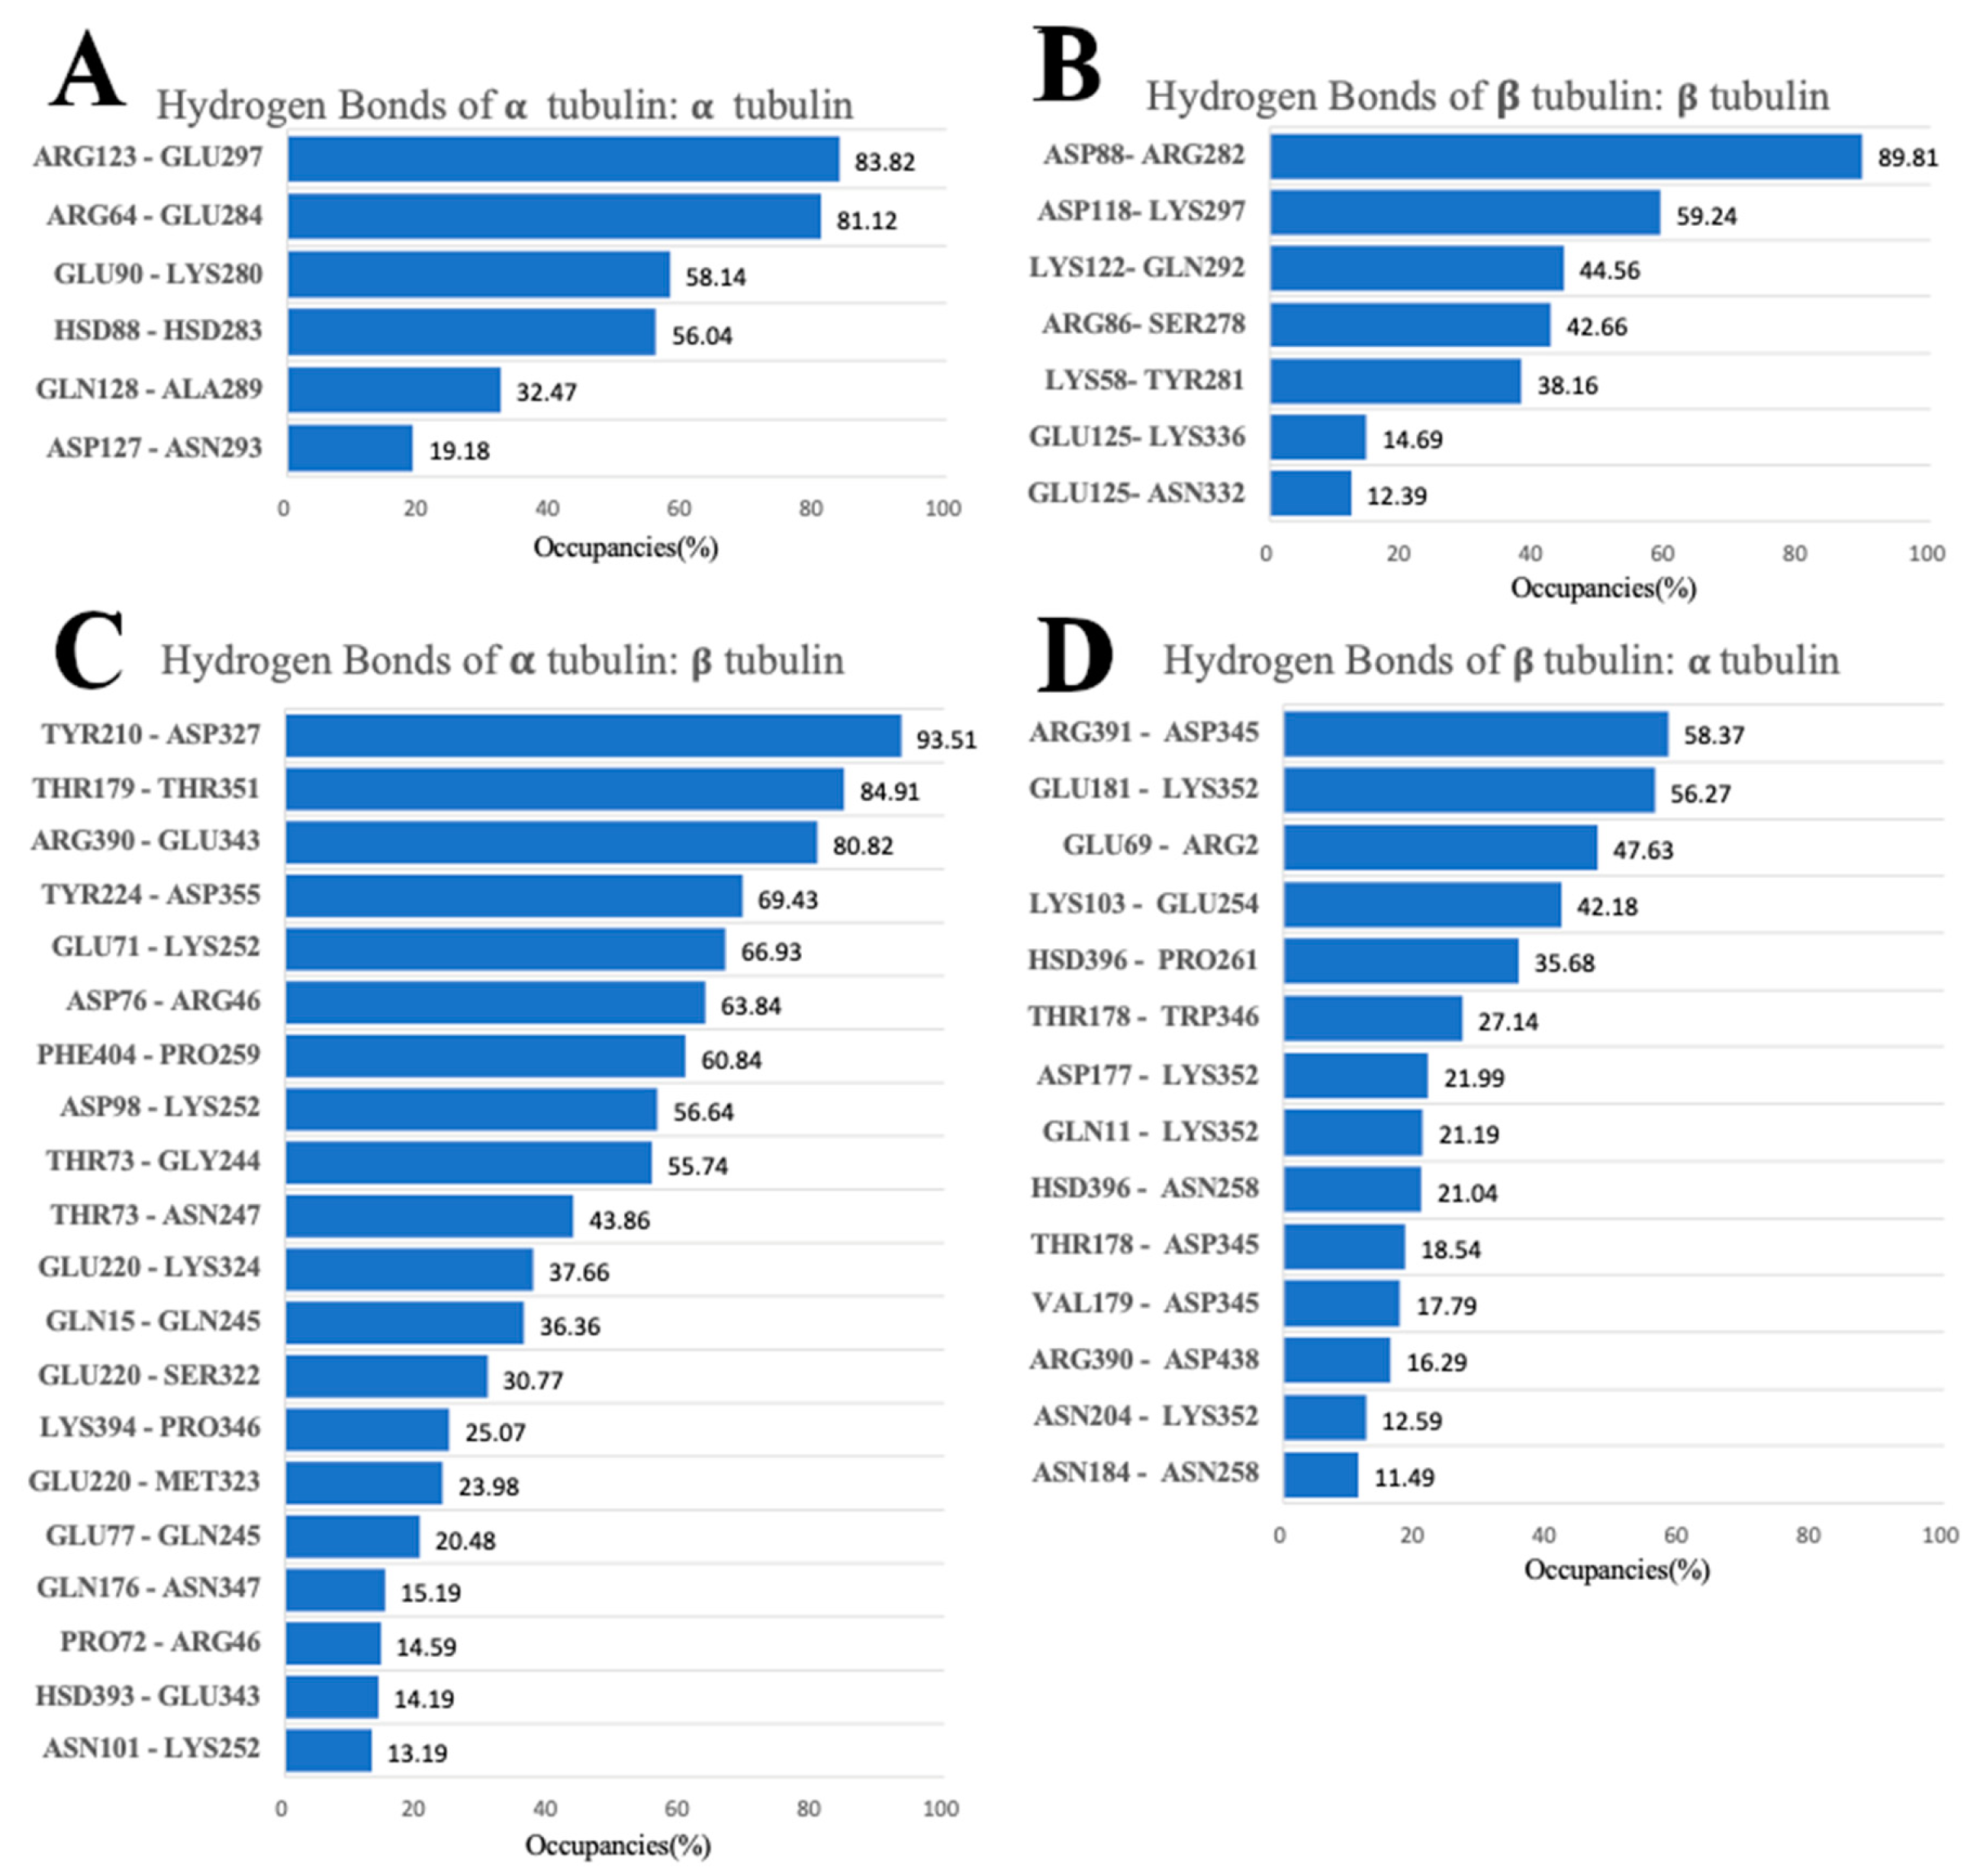
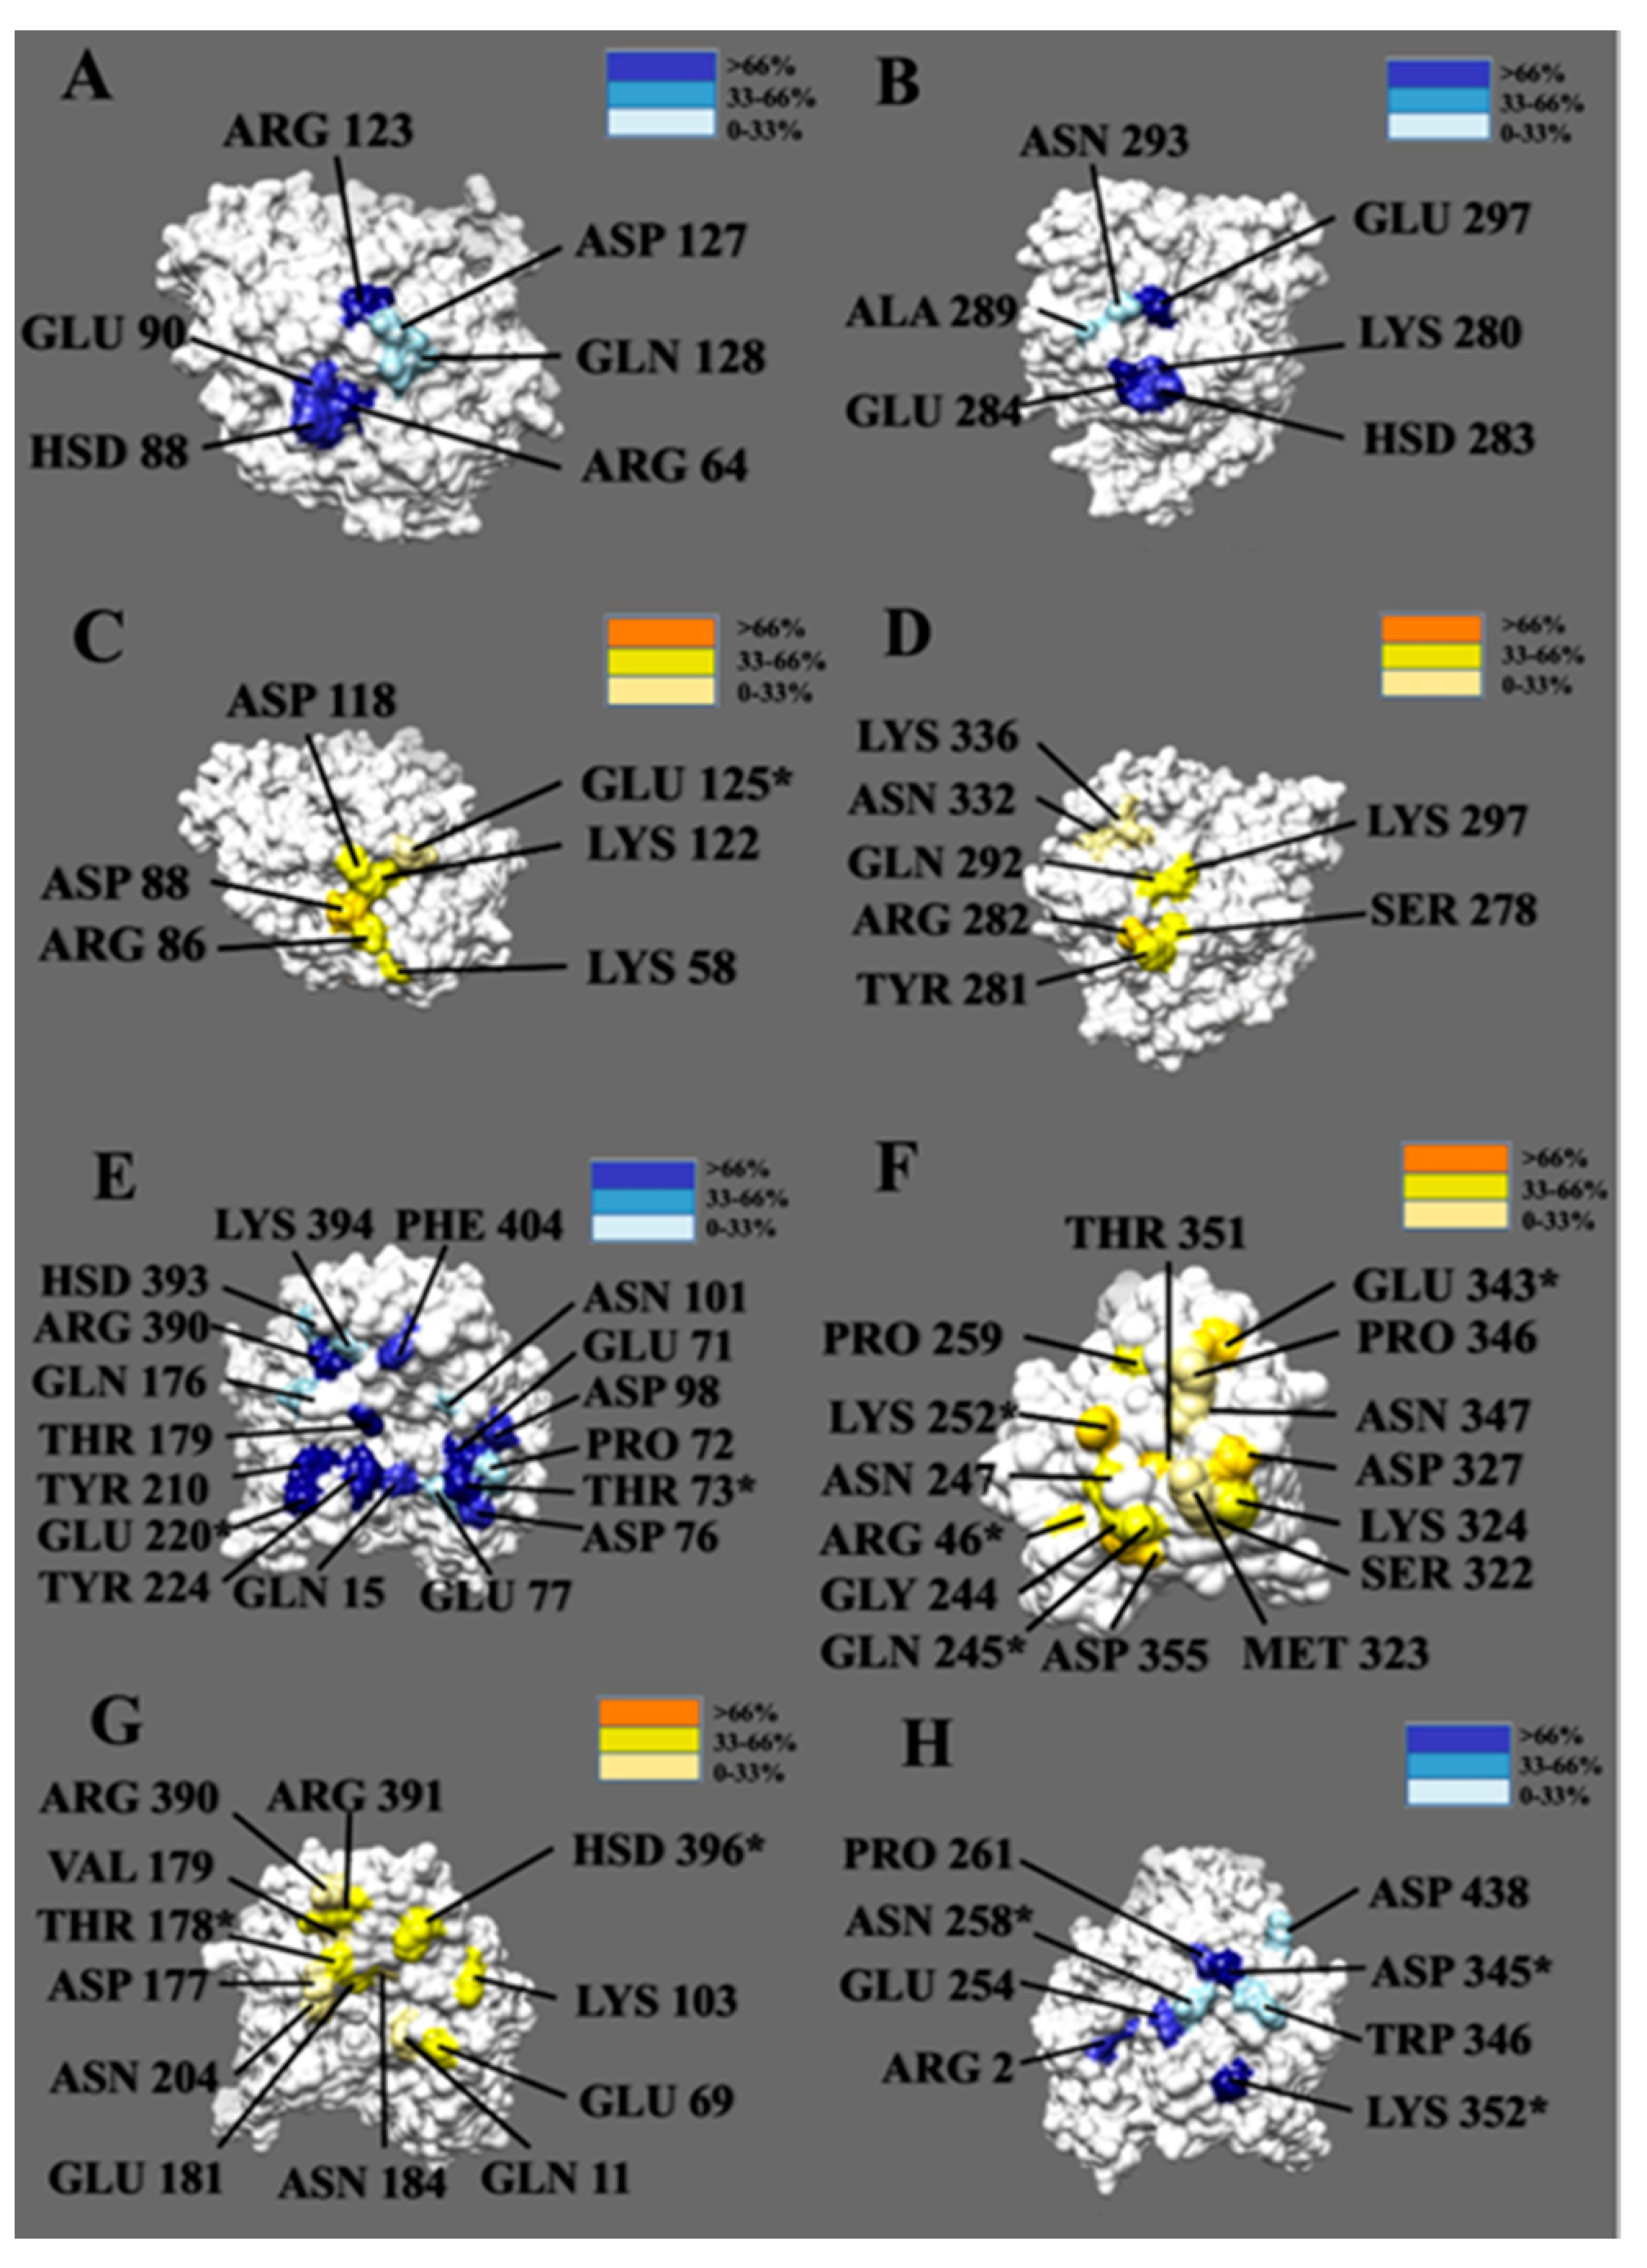
3.5. Hydrogen Bonds
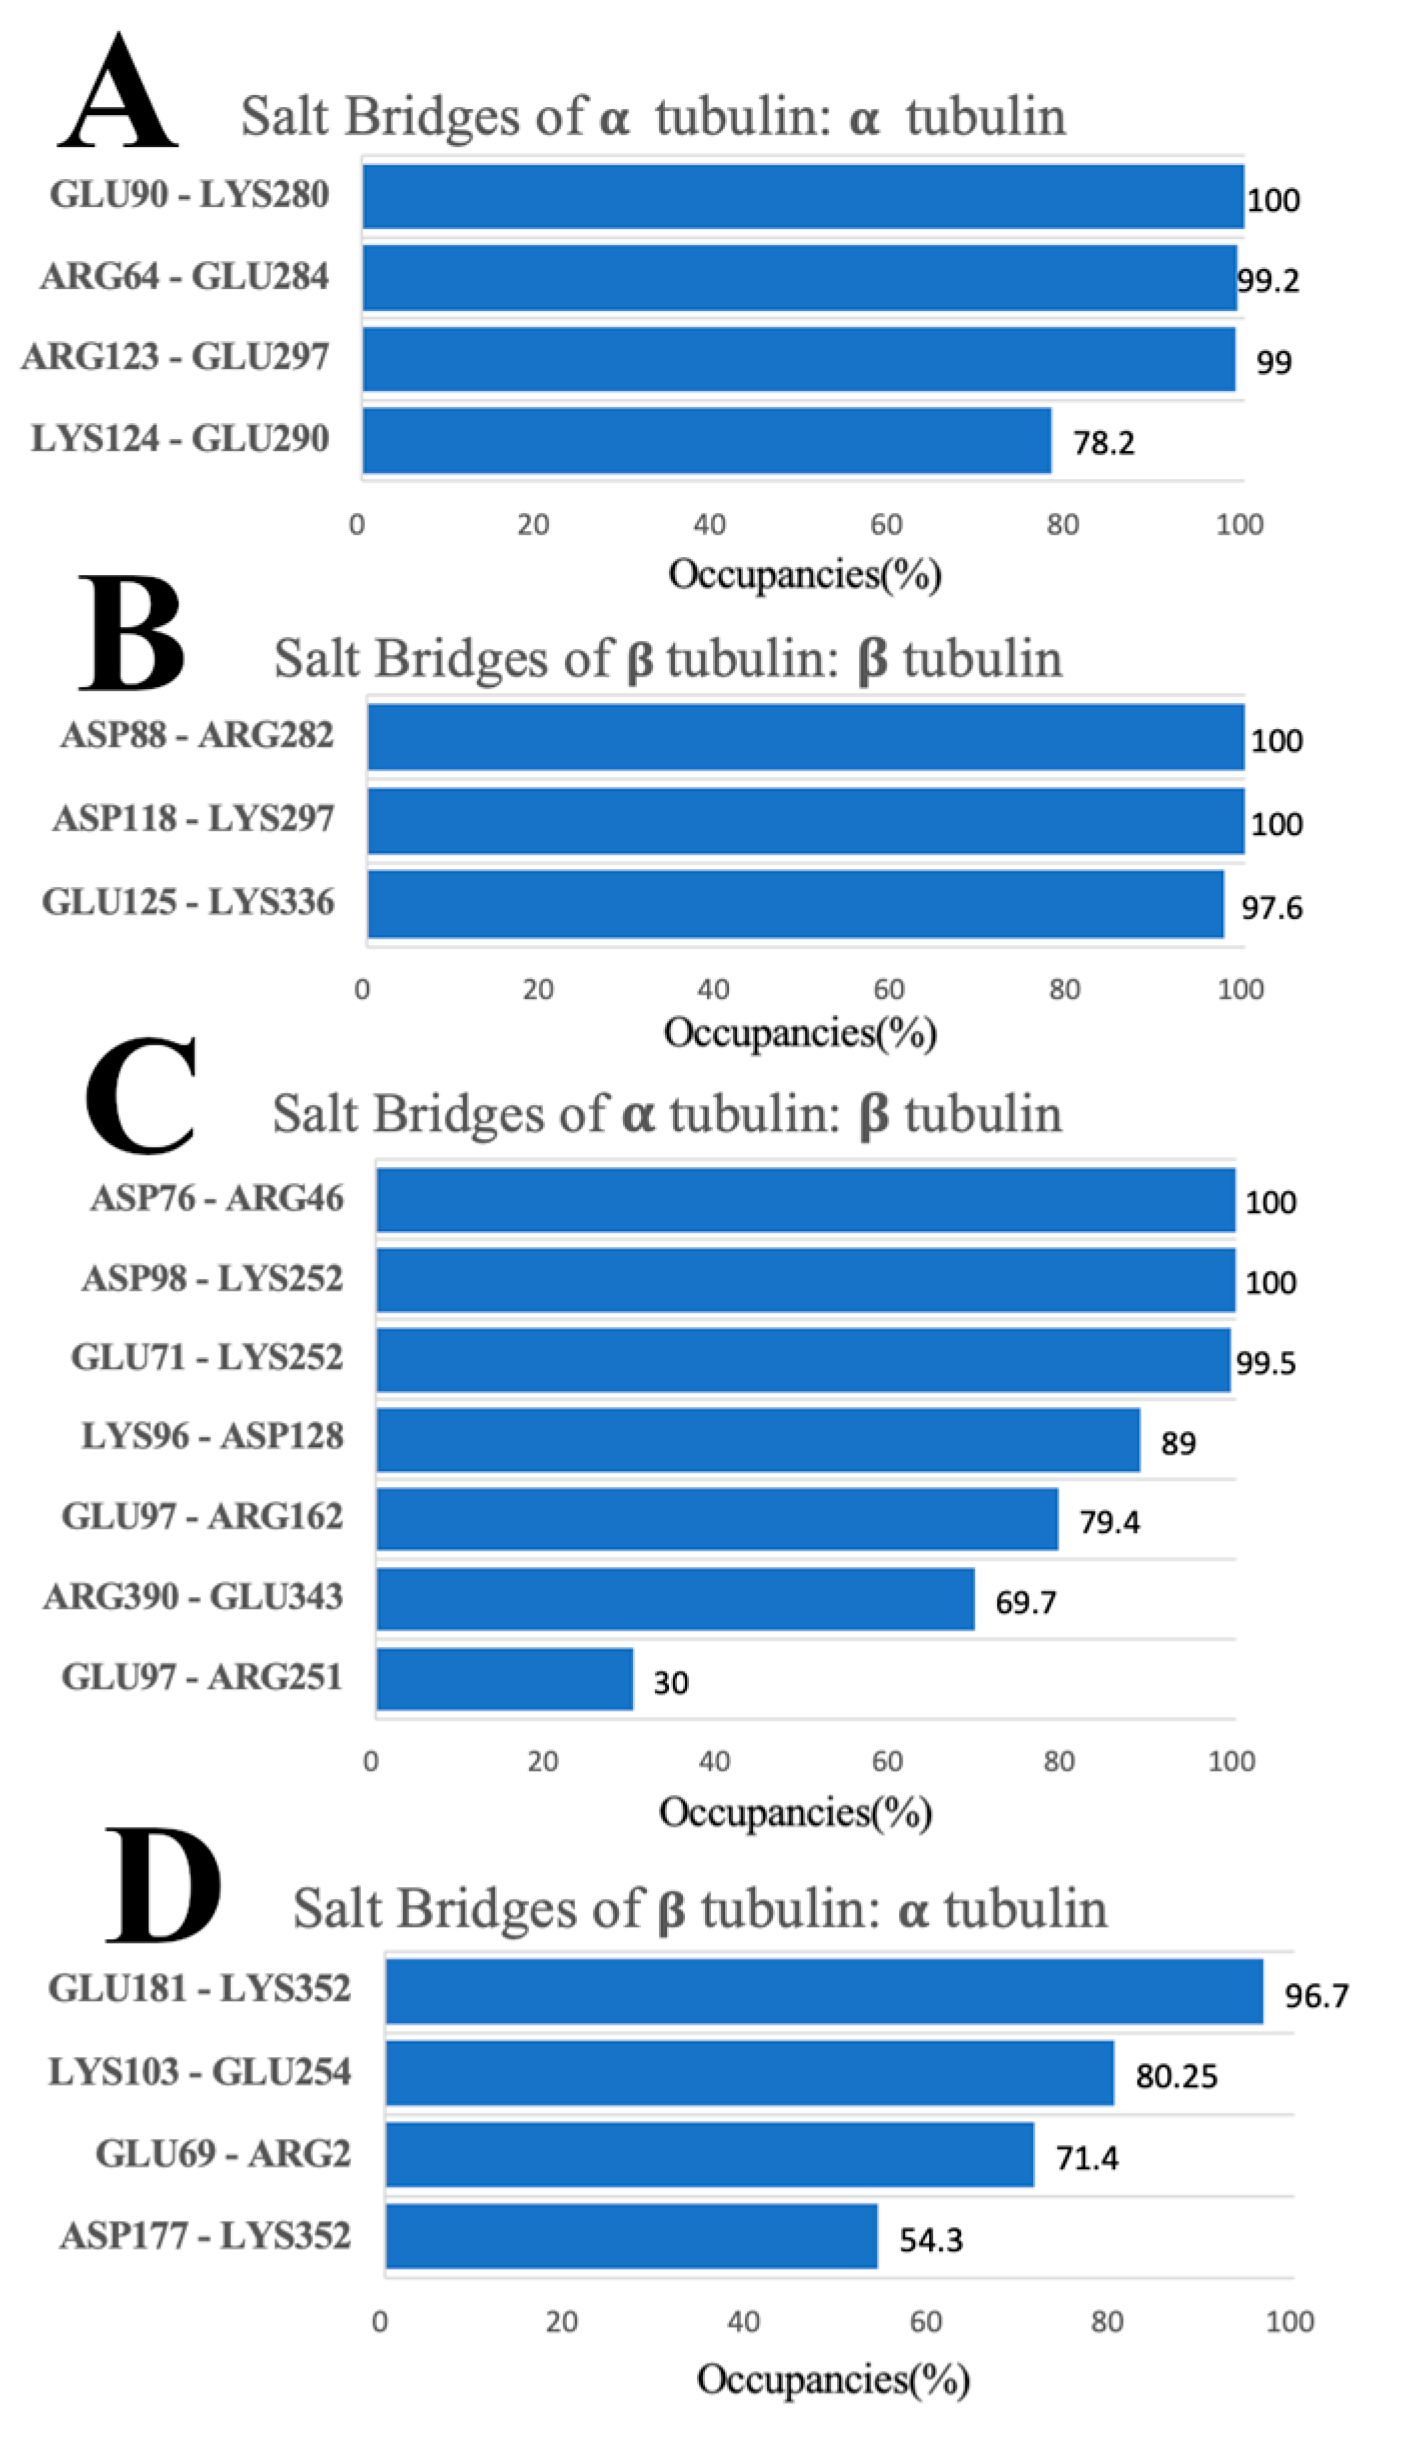
3.6. Salt Bridges
4. Conclusions
Supplementary Materials
Author Contributions
Funding
Institutional Review Board Statement
Informed Consent Statement
Data Availability Statement
Conflicts of Interest
References
- Nogales, E. Structural insights into microtubule function. Annu. Rev. Biochem. 2000, 69, 277–302. [Google Scholar] [CrossRef] [PubMed]
- Westermann, S.; Weber, K. Post-translational modifications regulate microtubule function. Nat. Rev. Mol. Cell Biol. 2003, 4, 938–948. [Google Scholar] [CrossRef] [PubMed] [Green Version]
- Sharp, D.J.; Rogers, G.C.; Scholey, J.M. Microtubule motors in mitosis. Nature 2000, 407, 41–47. [Google Scholar] [CrossRef] [PubMed]
- MacRae, T.H. Towards an understanding of microtubule function and cell organization: An overview. Biochem. Cell Biol. 1992, 70, 835–841. [Google Scholar] [CrossRef]
- Conde, C.; Cáceres, A. Microtubule assembly, organization and dynamics in axons and dendrites. Nat. Rev. Neurosci. 2009, 10, 319–332. [Google Scholar] [CrossRef]
- Li, H.; DeRosier, D.J.; Nicholson, W.V.; Nogales, E.; Downing, K.H. Microtubule structure at 8 Å resolution. Structure 2002, 10, 1317–1328. [Google Scholar] [CrossRef] [Green Version]
- Downing, K.H.; Nogales, E. Tubulin and microtubule structure. Curr. Opin. Cell Biol. 1998, 10, 16–22. [Google Scholar] [CrossRef]
- Kavallaris, M. Microtubules and resistance to tubulin-binding agents. Nat. Rev. Cancer 2010, 10, 194–204. [Google Scholar] [CrossRef]
- Erickson, H.P.; Stoffler, D. Protofilaments and rings, two conformations of the tubulin family conserved from bacterial FtsZ to alpha/beta and gamma tubulin. J. Cell Biol. 1996, 135, 5–8. [Google Scholar] [CrossRef] [Green Version]
- Schatten, G.; Simerly, C.; Schatten, H. Microtubule configurations during fertilization, mitosis, and early development in the mouse and the requirement for egg microtubule-mediated motility during mammalian fertilization. Proc. Natl. Acad. Sci. USA 1985, 82, 4152–4156. [Google Scholar] [CrossRef]
- Wade, R.H.; Kozielski, F. Structural links to kinesin directionality and movement. Nat. Struct. Biol. 2000, 7, 456–460. [Google Scholar] [CrossRef] [PubMed]
- Woehlke, G.; Schliwa, M. Directional motility of kinesin motor proteins. Biochim. Biophys. Acta (BBA)-Mol. Cell Res. 2000, 1496, 117–127. [Google Scholar] [CrossRef] [Green Version]
- Bhabha, G.; Johnson, G.T.; Schroeder, C.M.; Vale, R.D. How dynein moves along microtubules. Trends Biochem. Sci. 2016, 41, 94–105. [Google Scholar] [CrossRef] [PubMed] [Green Version]
- Friedman, D.S.; Vale, R.D. Single-molecule analysis of kinesin motility reveals regulation by the cargo-binding tail domain. Nat. Cell Biol. 1999, 1, 293–297. [Google Scholar] [CrossRef] [PubMed]
- Schief, W.R.; Clark, R.H.; Crevenna, A.H.; Howard, J. Inhibition of kinesin motility by ADP and phosphate supports a hand-over-hand mechanism. Proc. Natl. Acad. Sci. USA 2004, 101, 1183–1188. [Google Scholar] [CrossRef] [Green Version]
- Verhey, K.J.; Kaul, N.; Soppina, V. Kinesin assembly and movement in cells. Annu. Rev. Biophys. 2011, 40, 267–288. [Google Scholar] [CrossRef]
- Purcell, J.W.; Davis, J.; Reddy, M.; Martin, S.; Samayoa, K.; Vo, H.; Thomsen, K.; Bean, P.; Kuo, W.L.; Ziyad, S. Activity of the kinesin spindle protein inhibitor ispinesib (SB-715992) in models of breast cancer. Clin. Cancer Res. 2010, 16, 566–576. [Google Scholar] [CrossRef] [Green Version]
- Mandelkow, E.; Mandelkow, E.-M. Kinesin motors and disease. Trends Cell Biol. 2002, 12, 585–591. [Google Scholar] [CrossRef]
- Goedert, M.; Spillantini, M.; Jakes, R.; Rutherford, D.; Crowther, R. Multiple isoforms of human microtubule-associated protein tau: Sequences and localization in neurofibrillary tangles of Alzheimer’s disease. Neuron 1989, 3, 519–526. [Google Scholar] [CrossRef]
- Marchisella, F.; Coffey, E.T.; Hollos, P. Microtubule and microtubule associated protein anomalies in psychiatric disease. Cytoskeleton 2016, 73, 596–611. [Google Scholar] [CrossRef]
- Matov, A.; Applegate, K.; Kumar, P.; Thoma, C.; Krek, W.; Danuser, G.; Wittmann, T. Analysis of microtubule dynamic instability using a plus-end growth marker. Nat. Methods 2010, 7, 761–768. [Google Scholar] [CrossRef] [PubMed] [Green Version]
- Cassimeris, L.; Pryer, N.K.; Salmon, E. Real-time observations of microtubule dynamic instability in living cells. J. Cell Biol. 1988, 107, 2223–2231. [Google Scholar] [CrossRef] [PubMed] [Green Version]
- Natarajan, K.; Mohan, J.; Senapati, S. Relating nucleotide-dependent conformational changes in free tubulin dimers to tubulin assembly. Biopolymers 2013, 99, 282–291. [Google Scholar] [CrossRef] [PubMed]
- Bennett, M.J.; Chik, J.K.; Slysz, G.W.; Luchko, T.; Tuszynski, J.; Sackett, D.L.; Schriemer, D.C. Structural mass spectrometry of the αβ-tubulin dimer supports a revised model of microtubule assembly. Biochemistry 2009, 48, 4858–4870. [Google Scholar] [CrossRef] [PubMed] [Green Version]
- Sun, S.; Poudel, P.; Alexov, E.; Li, L. Electrostatics in Computational Biophysics and Its Implications for Disease Effects. Int. J. Mol. Sci. 2022, 23, 10347. [Google Scholar] [CrossRef]
- Guo, W.; Sun, S.; Sanchez, J.E.; Lopez-Hernandez, A.E.; Ale, T.A.; Chen, J.; Afrin, T.; Qiu, W.; Xie, Y.; Li, L. Using a comprehensive approach to investigate the interaction between Kinesin-5/Eg5 and the microtubule. Comput. Struct. Biotechnol. J. 2022, 20, 4305–4314. [Google Scholar] [CrossRef]
- Guo, W.; Xie, Y.; Lopez-Hernandez, A.E.; Sun, S.; Li, L. Electrostatic features for nucleocapsid proteins of SARS-CoV and SARS-CoV-2. Math. Biosci. Eng. MBE 2021, 18, 2372. [Google Scholar] [CrossRef]
- Xie, Y.; Du, D.; Karki, C.B.; Guo, W.; Lopez-Hernandez, A.E.; Sun, S.; Juarez, B.Y.; Li, H.; Wang, J.; Li, L. Revealing the mechanism of SARS-CoV-2 spike protein binding with ACE2. Comput. Sci. Eng. 2020, 22, 21–29. [Google Scholar] [CrossRef]
- Sun, S.; Karki, C.; Aguilera, J.; Lopez Hernandez, A.E.; Sun, J.; Li, L. Computational study on the function of palmitoylation on the envelope protein in SARS-CoV-2. J. Chem. Theory Comput. 2021, 17, 6483–6490. [Google Scholar] [CrossRef]
- Enemark, S.; Deriu, M.A.; Soncini, M.; Redaelli, A. Mechanical model of the tubulin dimer based on molecular dynamics simulations. J. Biomech. Eng. 2008, 130, 041008. [Google Scholar] [CrossRef]
- Dima, R.I.; Joshi, H. Probing the origin of tubulin rigidity with molecular simulations. Proc. Natl. Acad. Sci. USA 2008, 105, 15743–15748. [Google Scholar] [CrossRef] [PubMed] [Green Version]
- Marracino, P.; Havelka, D.; Průša, J.; Liberti, M.; Tuszynski, J.; Ayoub, A.T.; Apollonio, F.; Cifra, M. Tubulin response to intense nanosecond-scale electric field in molecular dynamics simulation. Sci. Rep. 2019, 9, 10477. [Google Scholar] [CrossRef] [PubMed] [Green Version]
- Guzman-Sepulveda, J.R.; Wu, R.; Kalra, A.P.; Aminpour, M.; Tuszynski, J.A.; Dogariu, A. Tubulin polarizability in aqueous suspensions. ACS Omega 2019, 4, 9144–9149. [Google Scholar] [CrossRef] [PubMed] [Green Version]
- Drabik, P.; Gusarov, S.; Kovalenko, A. Microtubule stability studied by three-dimensional molecular theory of solvation. Biophys. J. 2007, 92, 394–403. [Google Scholar] [CrossRef] [PubMed] [Green Version]
- Tuszyński, J.; Brown, J.; Crawford, E.; Carpenter, E.; Nip, M.; Dixon, J.; Satarić, M. Molecular dynamics simulations of tubulin structure and calculations of electrostatic properties of microtubules. Math. Comput. Model. 2005, 41, 1055–1070. [Google Scholar] [CrossRef]
- Tuszynski, J.A.; Carpenter, E.; Crawford, E.; Brown, J.; Malinski, W.; Dixon, J. Molecular dynamics calculations of the electrostatic properties of tubulin and their consequences for microtubules. In Proceedings of the International Conference on MEMS, NANO and Smart Systems, Banff, AB, Canada, 23 July 2003; pp. 56–61. [Google Scholar]
- Kalra, A.P.; Eakins, B.B.; Patel, S.D.; Ciniero, G.; Rezania, V.; Shankar, K.; Tuszynski, J.A. All wired up: An exploration of the electrical properties of microtubules and tubulin. ACS Nano 2020, 14, 16301–16320. [Google Scholar] [CrossRef]
- Ayoub, A.T.; Craddock, T.J.; Klobukowski, M.; Tuszynski, J. Analysis of the strength of interfacial hydrogen bonds between tubulin dimers using quantum theory of atoms in molecules. Biophys. J. 2014, 107, 740–750. [Google Scholar] [CrossRef] [Green Version]
- Peña, A.; Sweeney, A.; Cook, A.D.; Locke, J.; Topf, M.; Moores, C.A. Structure of microtubule-trapped human kinesin-5 and its mechanism of inhibition revealed using cryoelectron microscopy. Structure 2020, 28, 450–457.e455. [Google Scholar] [CrossRef]
- von Loeffelholz, O.; Peña, A.; Drummond, D.R.; Cross, R.; Moores, C.A. Cryo-EM structure (4.5-Å) of yeast kinesin-5–microtubule complex reveals a distinct binding footprint and mechanism of drug resistance. J. Mol. Biol. 2019, 431, 864–872. [Google Scholar] [CrossRef]
- Li, L.; Li, C.; Sarkar, S.; Zhang, J.; Witham, S.; Zhang, Z.; Wang, L.; Smith, N.; Petukh, M.; Alexov, E. DelPhi: A comprehensive suite for DelPhi software and associated resources. BMC Biophys. 2012, 5, 9. [Google Scholar] [CrossRef]
- Li, L.; Li, C.; Zhang, Z.; Alexov, E. On the dielectric “constant” of proteins: Smooth dielectric function for macromolecular modeling and its implementation in DelPhi. J. Chem. Theory Comput. 2013, 9, 2126–2136. [Google Scholar] [CrossRef] [PubMed]
- Jia, Z.; Li, L.; Chakravorty, A.; Alexov, E. Treating Ion Distribution with G Aussian-Based Smooth Dielectric Function in DelPhi. J. Comput. Chem. 2017, 38, 1974–1979. [Google Scholar] [CrossRef] [PubMed]
- Pettersen, E.F.; Goddard, T.D.; Huang, C.C.; Couch, G.S.; Greenblatt, D.M.; Meng, E.C.; Ferrin, T.E. UCSF Chimera—A visualization system for exploratory research and analysis. J. Comput. Chem. 2004, 25, 1605–1612. [Google Scholar] [CrossRef] [PubMed] [Green Version]
- Humphrey, W.; Dalke, A.; Schulten, K. VMD: Visual molecular dynamics. J. Mol. Graph. 1996, 14, 33–38. [Google Scholar] [CrossRef]
- Li, L.; Jia, Z.; Peng, Y.; Chakravorty, A.; Sun, L.; Alexov, E. DelPhiForce web server: Electrostatic forces and energy calculations and visualization. Bioinformatics 2017, 33, 3661–3663. [Google Scholar] [CrossRef] [PubMed] [Green Version]
- Li, L.; Chakravorty, A.; Alexov, E. DelPhiForce, a tool for electrostatic force calculations: Applications to macromolecular binding. J. Comput. Chem. 2017, 38, 584–593. [Google Scholar] [CrossRef] [Green Version]
- Xian, Y.; Xie, Y.; Silva, S.M.; Karki, C.B.; Qiu, W.; Li, L. StructureMan: A structure manipulation tool to study large scale biomolecular interactions. Front. Mol. Biosci. 2021, 7, 627087. [Google Scholar] [CrossRef]
- Phillips, J.C.; Braun, R.; Wang, W.; Gumbart, J.; Tajkhorshid, E.; Villa, E.; Chipot, C.; Skeel, R.D.; Kale, L.; Schulten, K. Scalable molecular dynamics with NAMD. J. Comput. Chem. 2005, 26, 1781–1802. [Google Scholar] [CrossRef] [Green Version]
- Vanommeslaeghe, K.; Hatcher, E.; Acharya, C.; Kundu, S.; Zhong, S.; Shim, J.; Darian, E.; Guvench, O.; Lopes, P.; Vorobyov, I. CHARMM general force field: A force field for drug-like molecules compatible with the CHARMM all-atom additive biological force fields. J. Comput. Chem. 2010, 31, 671–690. [Google Scholar] [CrossRef] [Green Version]
- Hadfield, J.A.; Ducki, S.; Hirst, N.; McGown, A.T. Tubulin and microtubules as targets for anticancer drugs. Prog. Cell Cycle Res. 2003, 5, 309–326. [Google Scholar]
- Jordan, M.A.; Wilson, L. Microtubules as a target for anticancer drugs. Nat. Rev. Cancer 2004, 4, 253–265. [Google Scholar] [CrossRef] [PubMed]
- Chen, H.; Lin, Z.; Arnst, K.E.; Miller, D.D.; Li, W. Tubulin inhibitor-based antibody-drug conjugates for cancer therapy. Molecules 2017, 22, 1281. [Google Scholar] [CrossRef] [PubMed]


Disclaimer/Publisher’s Note: The statements, opinions and data contained in all publications are solely those of the individual author(s) and contributor(s) and not of MDPI and/or the editor(s). MDPI and/or the editor(s) disclaim responsibility for any injury to people or property resulting from any ideas, methods, instructions or products referred to in the content. |
© 2023 by the authors. Licensee MDPI, Basel, Switzerland. This article is an open access article distributed under the terms and conditions of the Creative Commons Attribution (CC BY) license (https://creativecommons.org/licenses/by/4.0/).
Share and Cite
Guo, W.; Ale, T.A.; Sun, S.; Sanchez, J.E.; Li, L. A Comprehensive Study on the Electrostatic Properties of Tubulin-Tubulin Complexes in Microtubules. Cells 2023, 12, 238. https://doi.org/10.3390/cells12020238
Guo W, Ale TA, Sun S, Sanchez JE, Li L. A Comprehensive Study on the Electrostatic Properties of Tubulin-Tubulin Complexes in Microtubules. Cells. 2023; 12(2):238. https://doi.org/10.3390/cells12020238
Chicago/Turabian StyleGuo, Wenhan, Tolulope Ayodeji Ale, Shengjie Sun, Jason E. Sanchez, and Lin Li. 2023. "A Comprehensive Study on the Electrostatic Properties of Tubulin-Tubulin Complexes in Microtubules" Cells 12, no. 2: 238. https://doi.org/10.3390/cells12020238