
Systematic Methods for Isolating High Purity Nuclei from Ten Important Plants for Omics Interrogation


Abstract
:1. Introduction
2. Methods
2.1. Reagents
- 2-(4-Amidinophenyl)-6-indolecarbamidine dihydrochloride (DAPI) (Solarbio, Beijing, China, Cat. No. C0065);
- 2-(N-morpholino) ethanesulfonic acid (MES) (Sigma-Aldrich, St. Louis, MO, USA, Cat. No. M3671);
- BD Rhapsody™ Cartridge Reagent Kit (BD Bioscience, San Diego, CA, USA, Cat. No. 633731);
- BD Rhapsody™ cDNA Kit (BD Cat. No. 633773);
- BD Rhapsody™ WTA Amplification kit (BD Cat. No. 633801);
- BD Trucount™ absolute count tubes (BD Cat. No. 340334);
- Dextran T40 (Macklin, Shanghai, China, Cat. No. D806716);
- Dithiothreitol (DTT) (Genview, El Monte, CA, USA, Cat. No. CD116);
- DyeCycle Green (Thermo Fisher Scientific, Waltham, MA, USA, Cat. No. V35004);
- Ethylene diamine tetraacetic acid (EDTA) (Genview Cat. No. LE118);
- Ethylene glycol tetraacetic acid (EGTA) (Genview Cat. No. LE119);
- Ficoll 400 (Sigma Cat. No. F4375);
- Lysis Buffer (BD Cat. No. 650000064);
- Mannitol (BBI Cat. No. A600335);
- MgCl2 hexahydrate (BBI Cat. No. A601336);
- Murine RNase inhibitor (Vazyme, Nanjing, China Cat. No. R301-03);
- Phosphate buffer solution (1× PBS, 0.01 M, pH7.4) (Gibco BRL, Grand Island, NY, USA, Cat. No. 10010072);
- PI/RNase Staining Buffer (BD Cat. No. 550825);
- Potassium chloride (KCl) (BBI, Shanghai, China, Cat. No. A501159);
- Propidium Iodide (PI) (Thermo Fisher Scientific Cat. No. 00699050);
- Protease inhibitor cocktail (APExBIO, Houston, TX, USA);
- Proteinase K (NEB, New England Biolabs, Beverly, MA, USA, Cat. No. P81075);
- Quick RNA isolation Kit (Huayueyang biotech, Beijing, China);
- RevertAid First strand cDNA Synthesis Kit (Thermo Fisher Scientific Cat. No. 00994100);
- RiboLock RNase inhibitor (Thermo Fisher Scientific Cat. No. EO0382);
- Sampling buffer (BD Cat. No. 650000062);
- Sodium chloride (NaCl) (Genview cat. No. LS014);
- Spermidine (Sigma cat. No. S0381);
- Spermine (Sigma cat. No. S3256);
- Sucrose (Genview cat. No. CS326);
- Triton X-100 (BBI cat. No. A600198).
2.2. Equipment
- A 40 µm diameter cell strainer (Biologix, Camarillo, CA, USA, Cat. No. 15-1040);
- BD FACSMelody™ Flow Cytometer;
- BD Rhapsody™ Cartridge Kit Rhapsody Cartridge (BD Cat. No. 633733);
- BD Rhapsody™ Scanner;
- Centrifuge tubes (BBI Cat. No. F621004, F607888);
- Chromatography freezer (Panasonic, Japan, MPR-710)
- Flow tubes (BD Cat. No. 352054);
- Flow tubes with 35 µm cell strainer (BD Cat. No. 352235);
- Hemocytometer (INCYTO, Chungnam-do, Korea, Cat. No. DHC-N01-5);
- Hemocytometer Adapter (BD Cat. No. 633703);
- Homogenizer (Vortex 3, IKA, Staufen, Germany);
- Analog Tube Rotator (MX-RL-E) (DLAB, Beijing, China);
- Swinging rotor centrifuge (Eppendorf 5804R, Hamburg, Germany);
- ZEISS Axio Imager D2 microscope.
2.3. Solution Setup
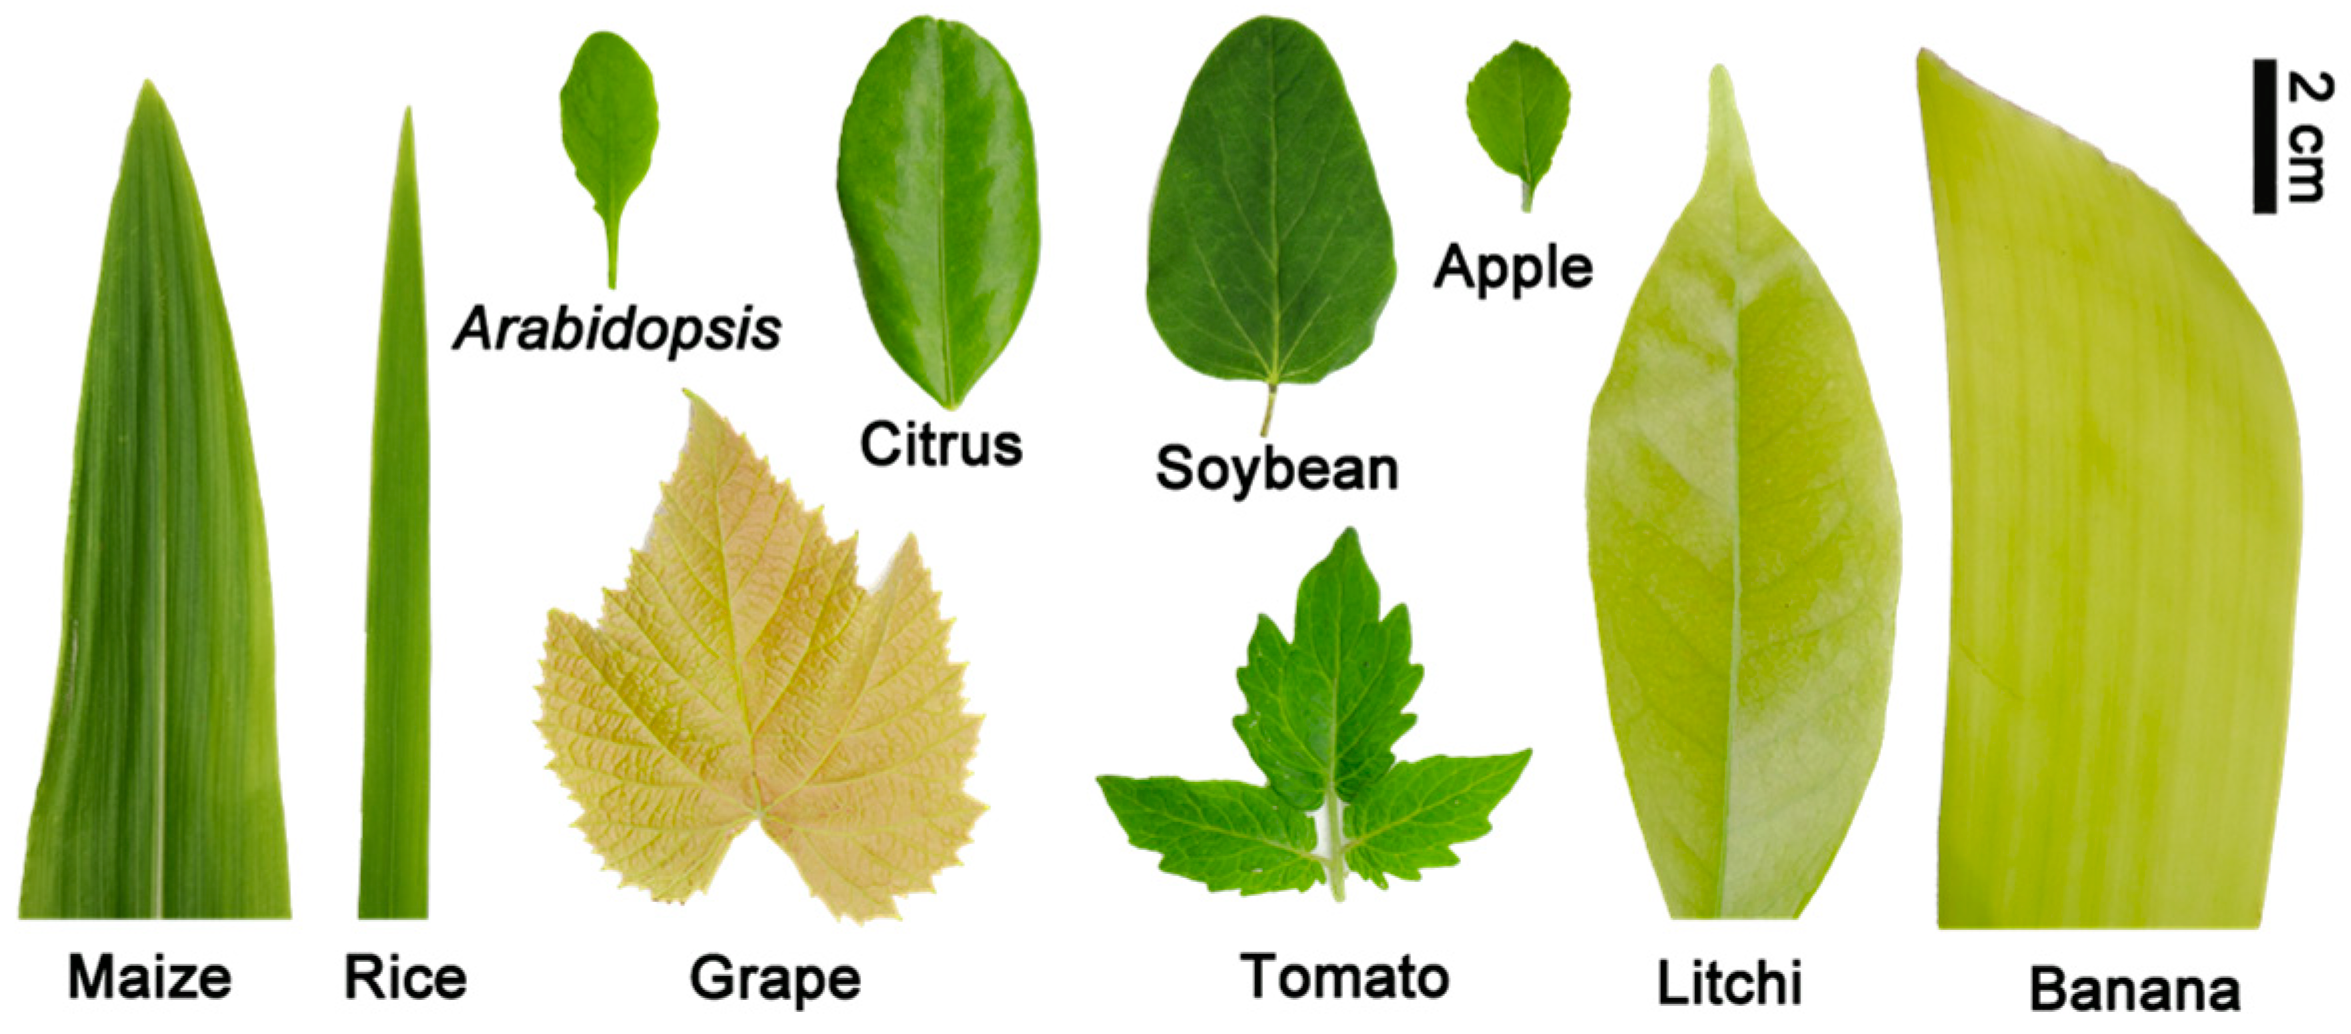
2.4. Plant Material
2.5. Nucleus Isolation Procedure
- Set the centrifuges to 4 °C.
- Precool forceps, mortar and pestle (previously sterilized at 121 °C for 20 min) using liquid nitrogen or place them on ice.
- Add 1 mL of nucleus isolation buffer in the mortar and put it on ice.
- Transfer 10 mg frozen tissue to the mortar with buffer on ice using the cooled forceps and quickly grind.
- Transfer the homogenate to a 2 mL tube and wash the mortar with 0.5 mL isolation buffer, then shake it on a rotary mixer (MX-RL-E) in the chromatography freezer for 15 min.
- Filter the homogenate into a new tube using a 40 µm diameter cell strainer and wash the strainer with 0.5 mL isolation buffer.
- Centrifuge at 1000× g for 5 min at 4 °C.
- Discard the supernatant and re-extract the residues twice with nucleus isolation buffer, and centrifuge at 1000× g for 5 min at 4 °C.
- Resuspend the white precipitate using 1 mL washing buffer.
- Transfer the nuclei to a flow tube topped with a blue 35 µm diameter cell strainer and allow the solution to pass through the gravity-driven filter.
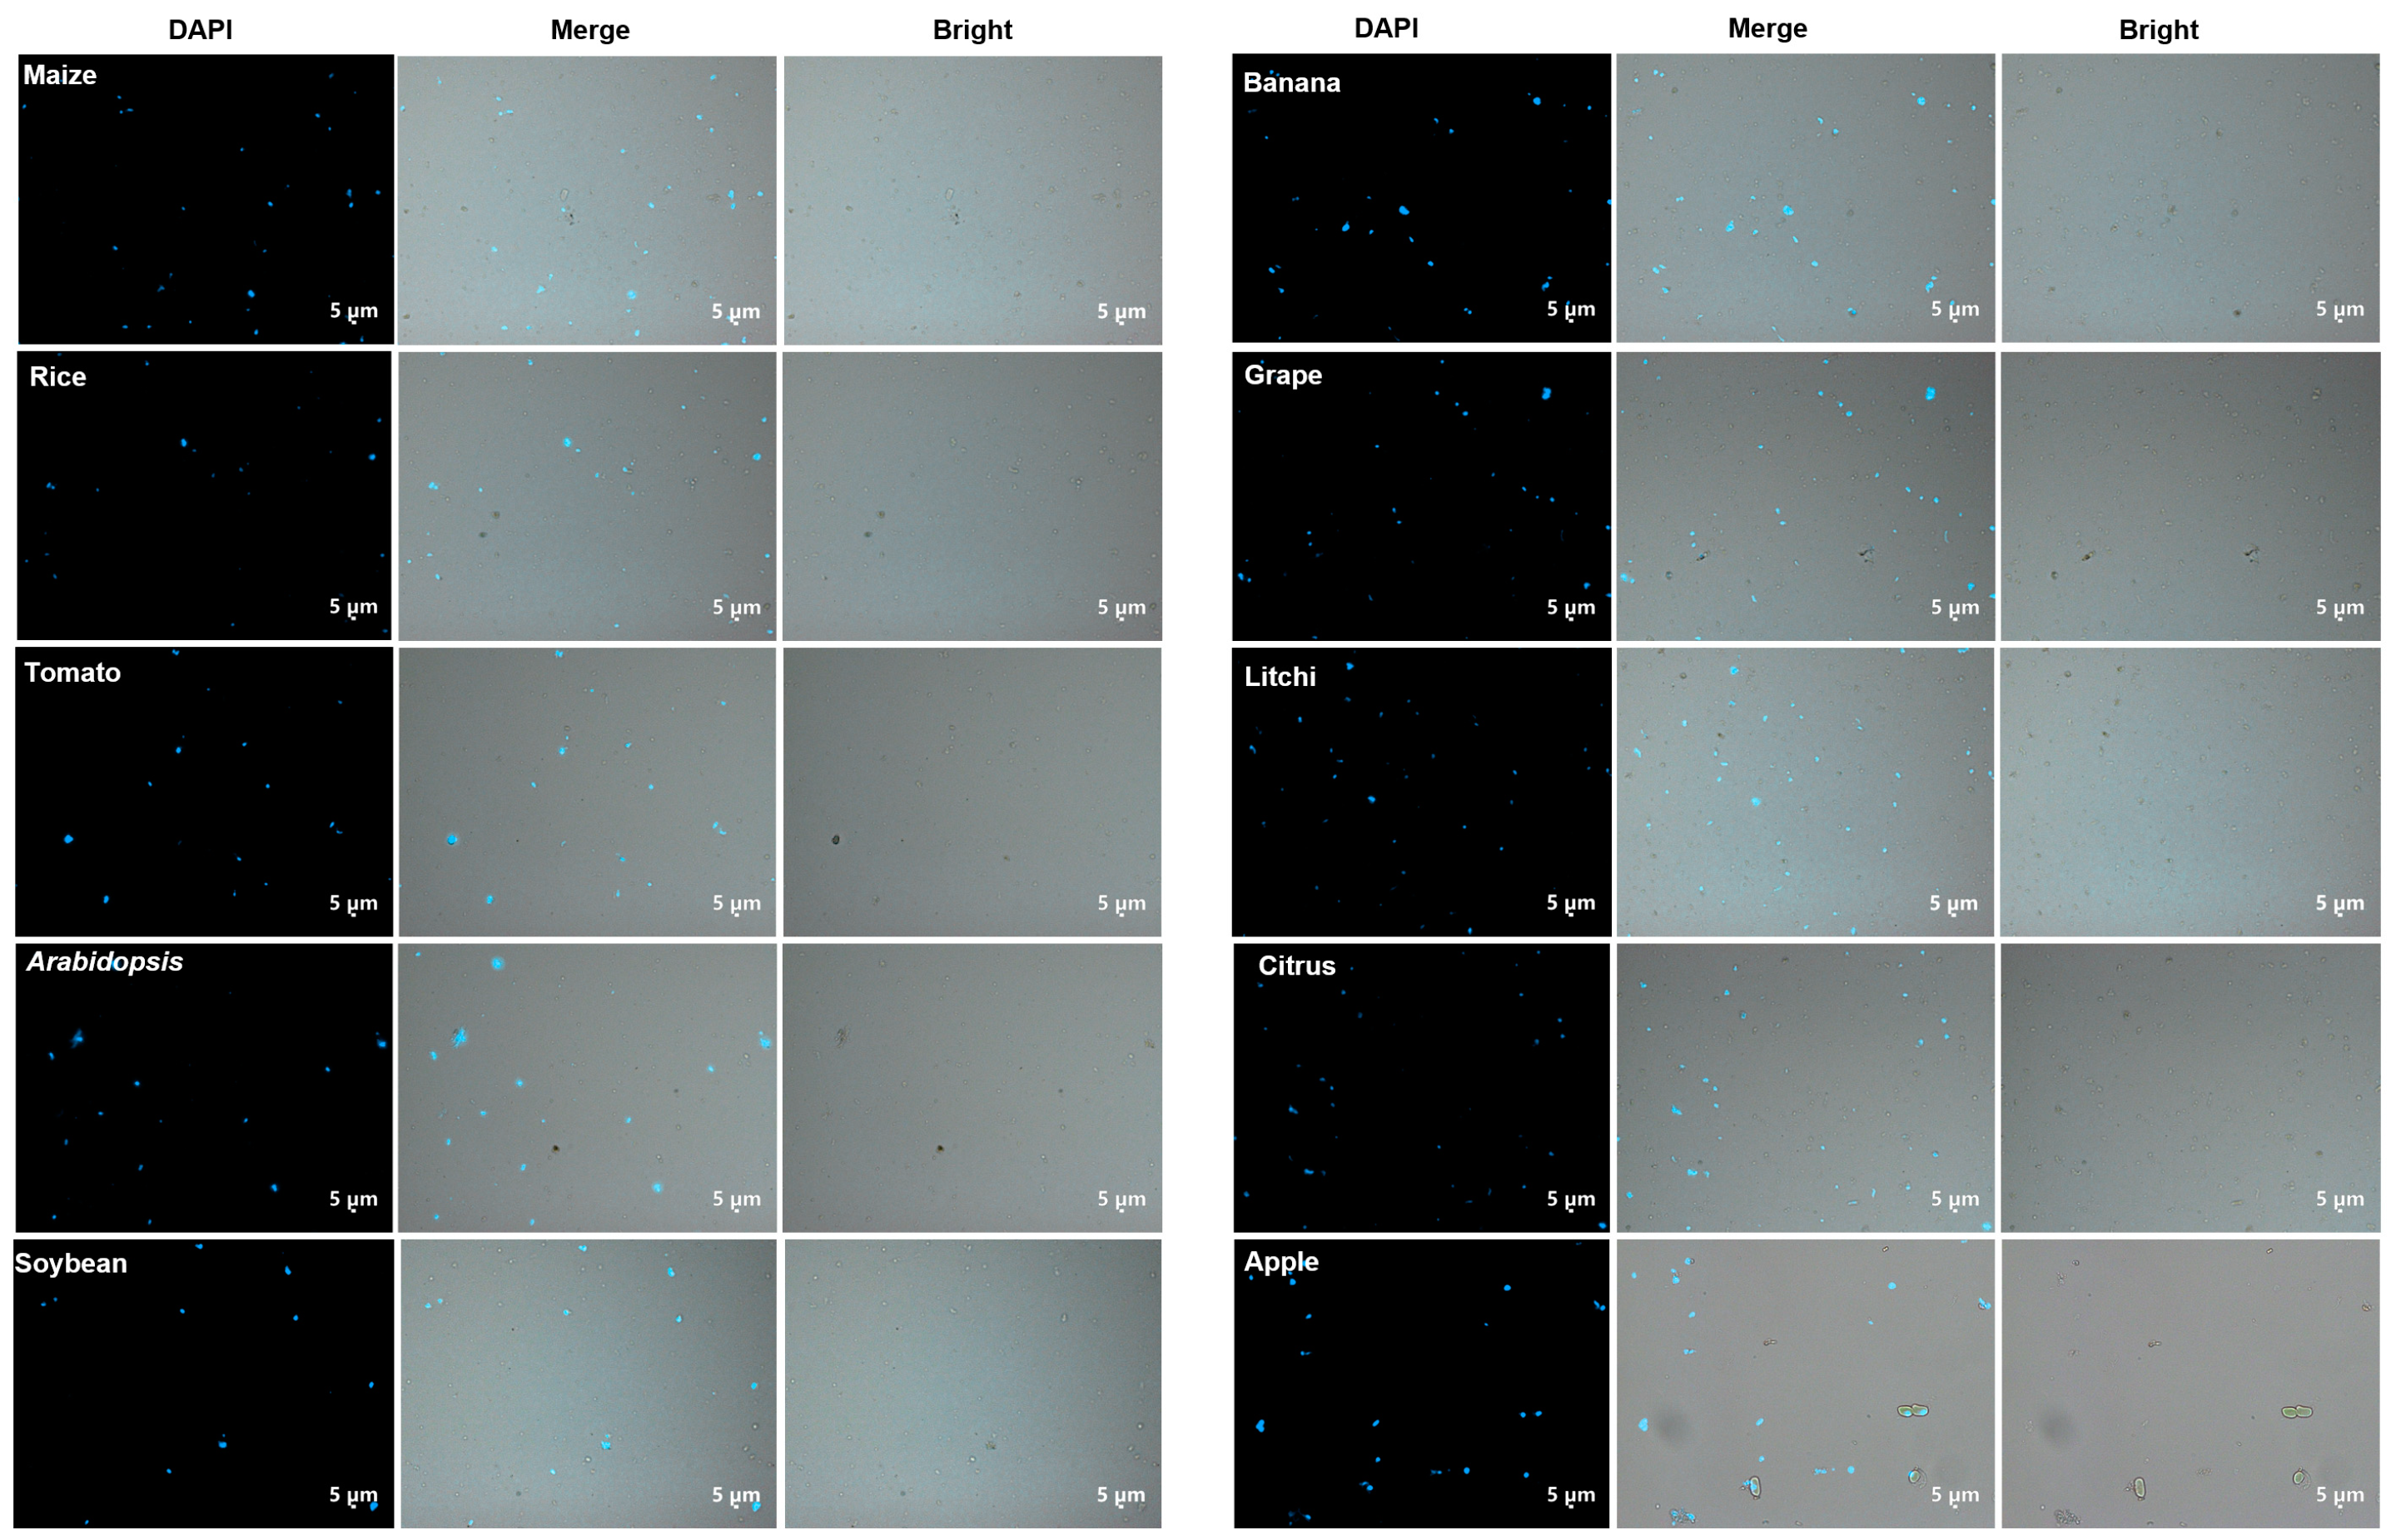
2.6. DAPI or PI Staining and Microscopy Procedure
- 11
- Transfer 100–300 µL solution from step 10 and add more than 3 volumes of 1× DAPI dye solution.
- 12
- Put it on ice for 5 min in the dark.
- 13
- Remove the staining solution by centrifuging it at 1000× g for 5 min at 4 °C and discard the supernatant.
- 14
- Wash the precipitate twice with washing buffer and centrifuge it at 1000× g for 5 min at 4 °C.
- 15
- Resuspend the precipitate with 1–3 mL washing buffer in a flow tube.
- 16
- Examine the nuclei with a ZEISS Axio Imager D2 microscope equipped with an epifluorescence extension and a DAPI filter. Alternatively, propidium iodide (PI) can be used to stain the nuclei. Add 5 μL PI (8 ng/μL) to 100 μL nucleus solution (105–108 nuclei) and keep on ice for 30 min in the dark. The nuclei should then be examined under a microscope or flow cytometer without being washed.
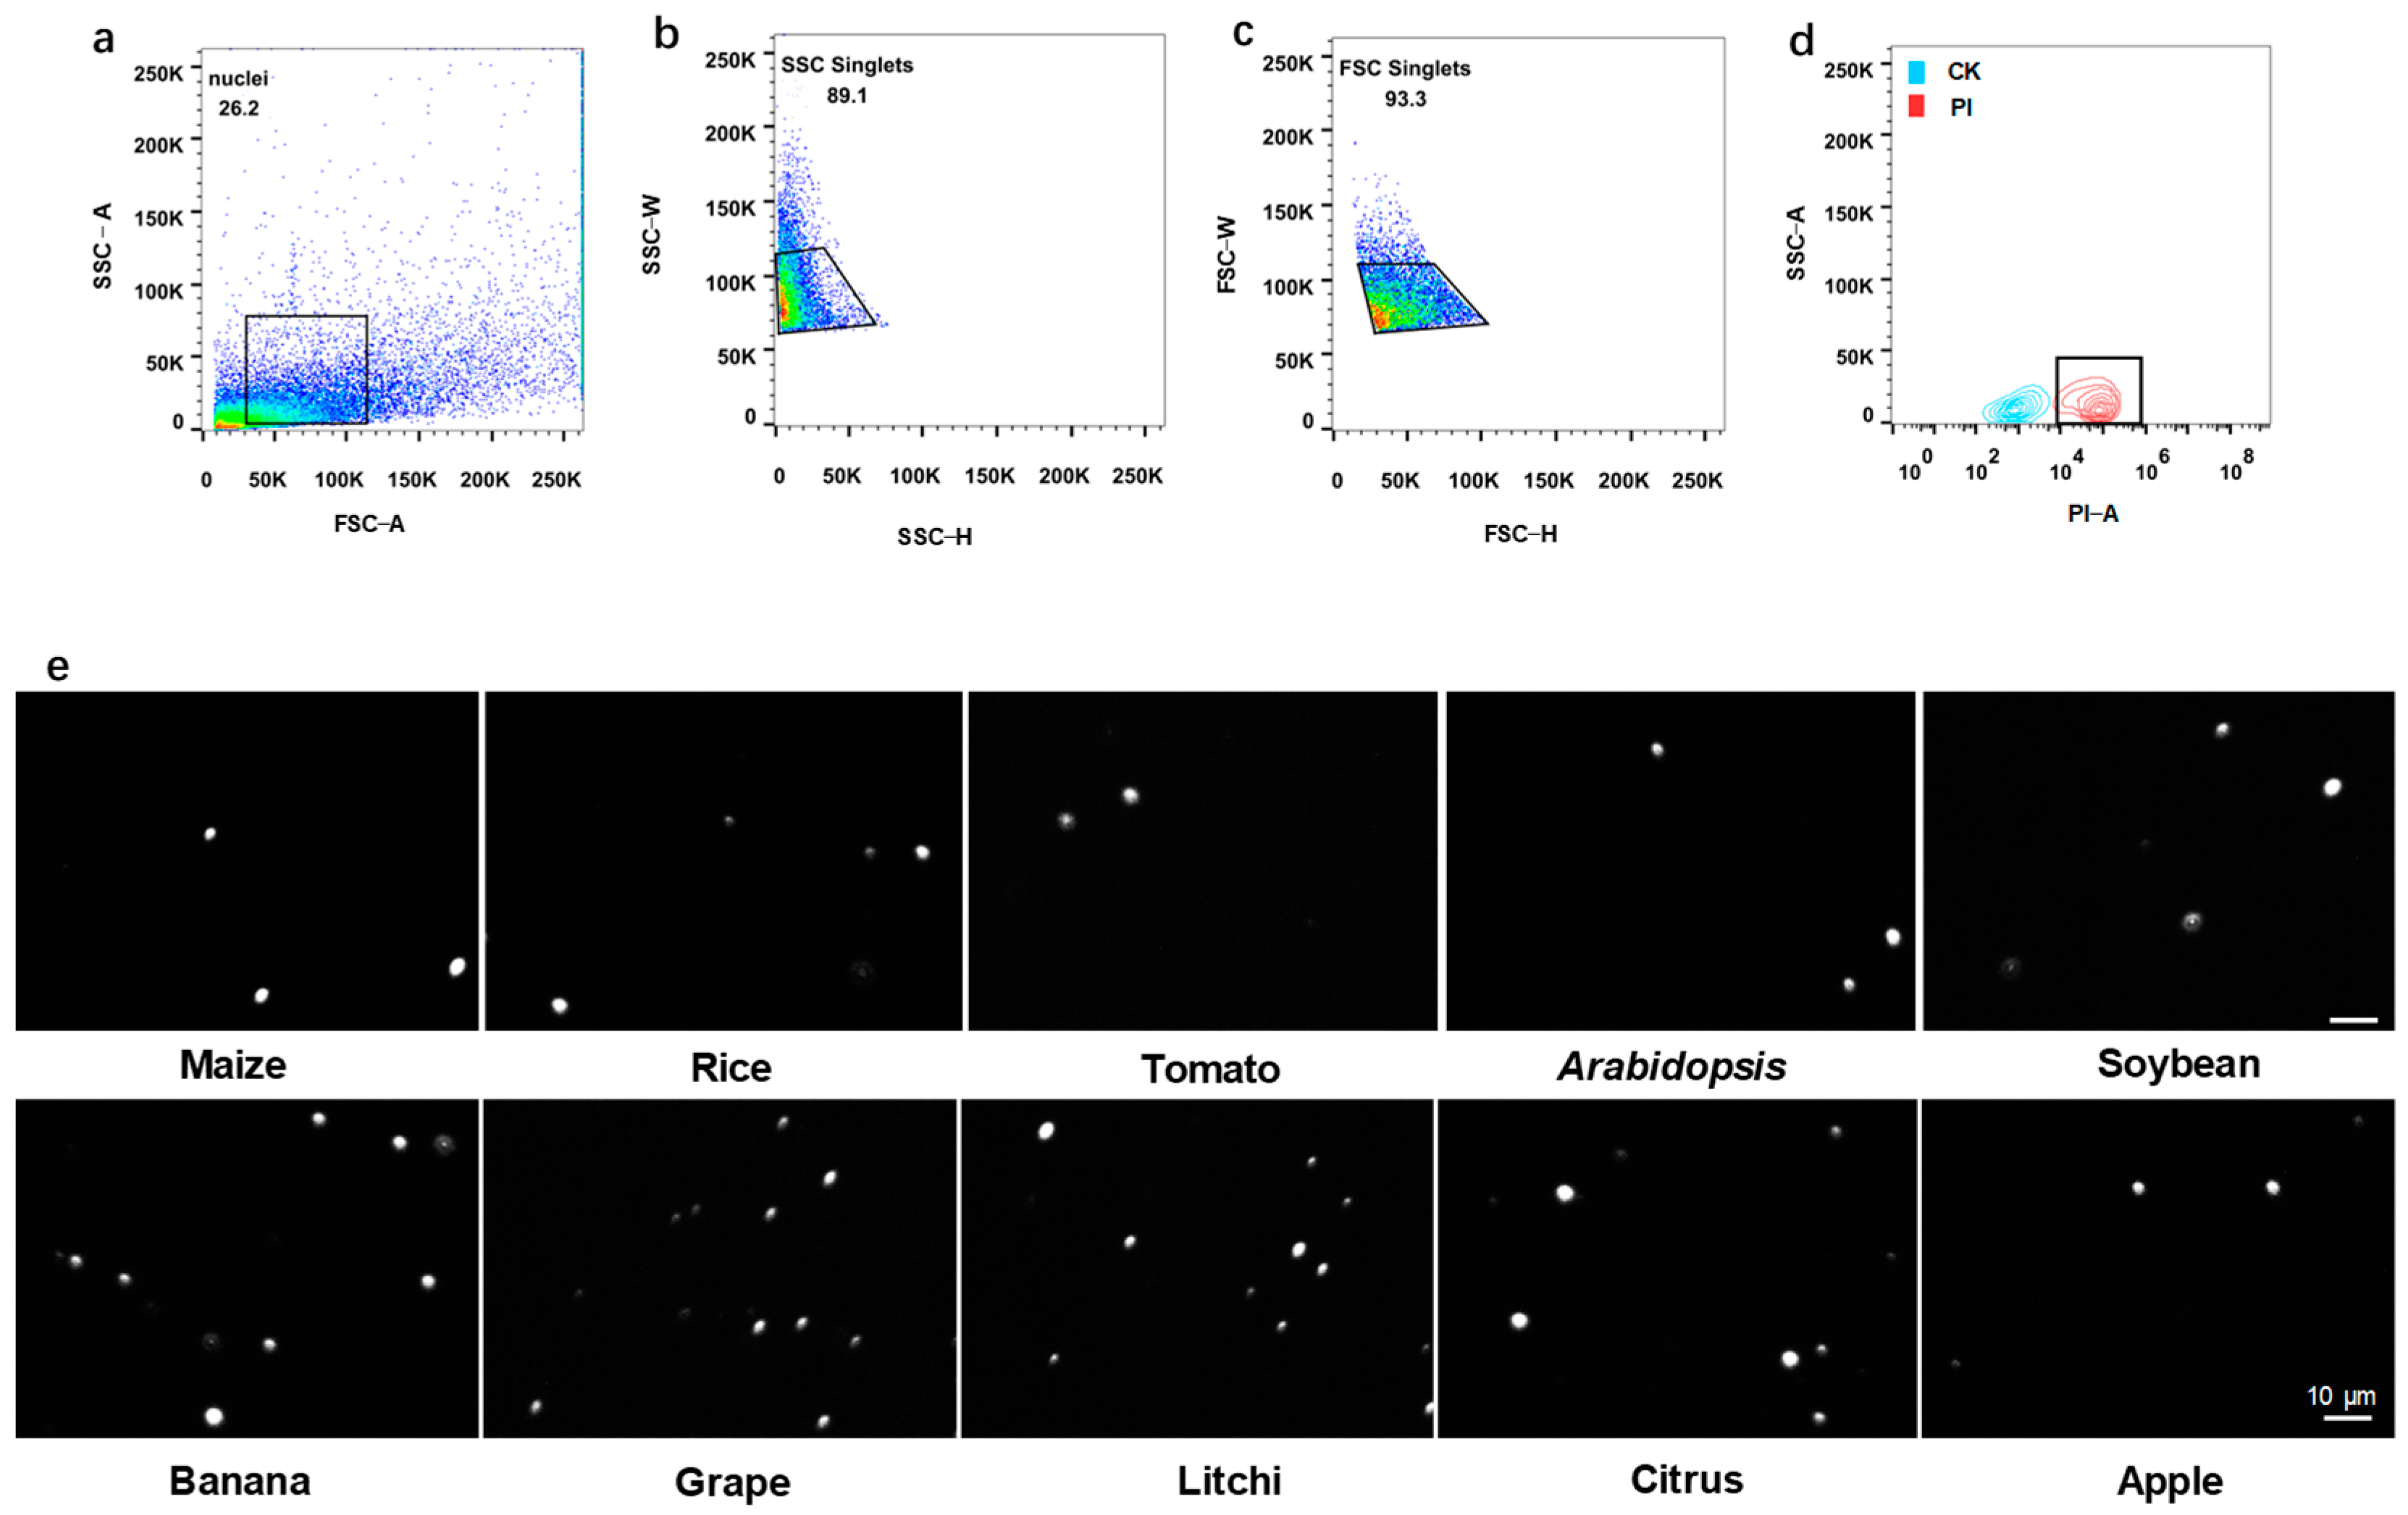
2.7. Procedure of Nuclei Purification on Flow Cytometry
- 17
- Filter the nuclei staining with DAPI or PI through 35 μm cell strainer into a 5 mL flow tube.
- 18
- Apply a 100-μm nozzle on flow cytometry.
- 19
- Using the stain nucleus sample, generate a dot plot of forward scatter (FSC)-area versus side scatter (SSC)-area to determine the size position of nuclei.
- 20
- Note: Retrieve the nuclei by repeated sorting and observe under a microscope to determine the specific SSC and FSC position of the nuclei.
- 21
- Generate a dot plot of SSC-height versus SSC-width to select for SSC single nuclei and exclude doublets.
- 22
- Generate a dot plot of FSC-height versus FSC-width for further selection of FSC singlets and exclusion of doublets.
- 23
- Use the unstained nuclei as control and generate a contour plot of PI or DAPI signal to identify positive nuclei.
- 24
- Add 1.5 mL cold collection buffer in a new flow tube and put it in the right position of BD FACSMelody™. Throughout the process, keep the collection buffer cold.
- 25
- Conduct sorting to collect 200,000–400,000 events (positive nuclei) using a high-purity sorting mode.
- 26
- After sorting, immediately centrifuge the collected tube at 1000× g for 10 min at 4 °C.
- 27
- Remove the upper supernatant with care, leaving about 300 µL of lower supernatant to precipitate.
2.8. Scanning Procedure on the BD Rhapsody™ Scanner
- 28
- Stain 500 μL nuclei solution with 2 μL DyeCycle Green and keep it on ice for 5 min in the dark.
- 29
- Gently pipet 10 uL into the INCYTO disposable hemocytometer.
- 30
- Insert the hemocytometer into the Hemocytometer Adapter.
- 31
- Tap Scan in the BD Rhapsody™ Scanner.
- 32
- Collect and organize the images.
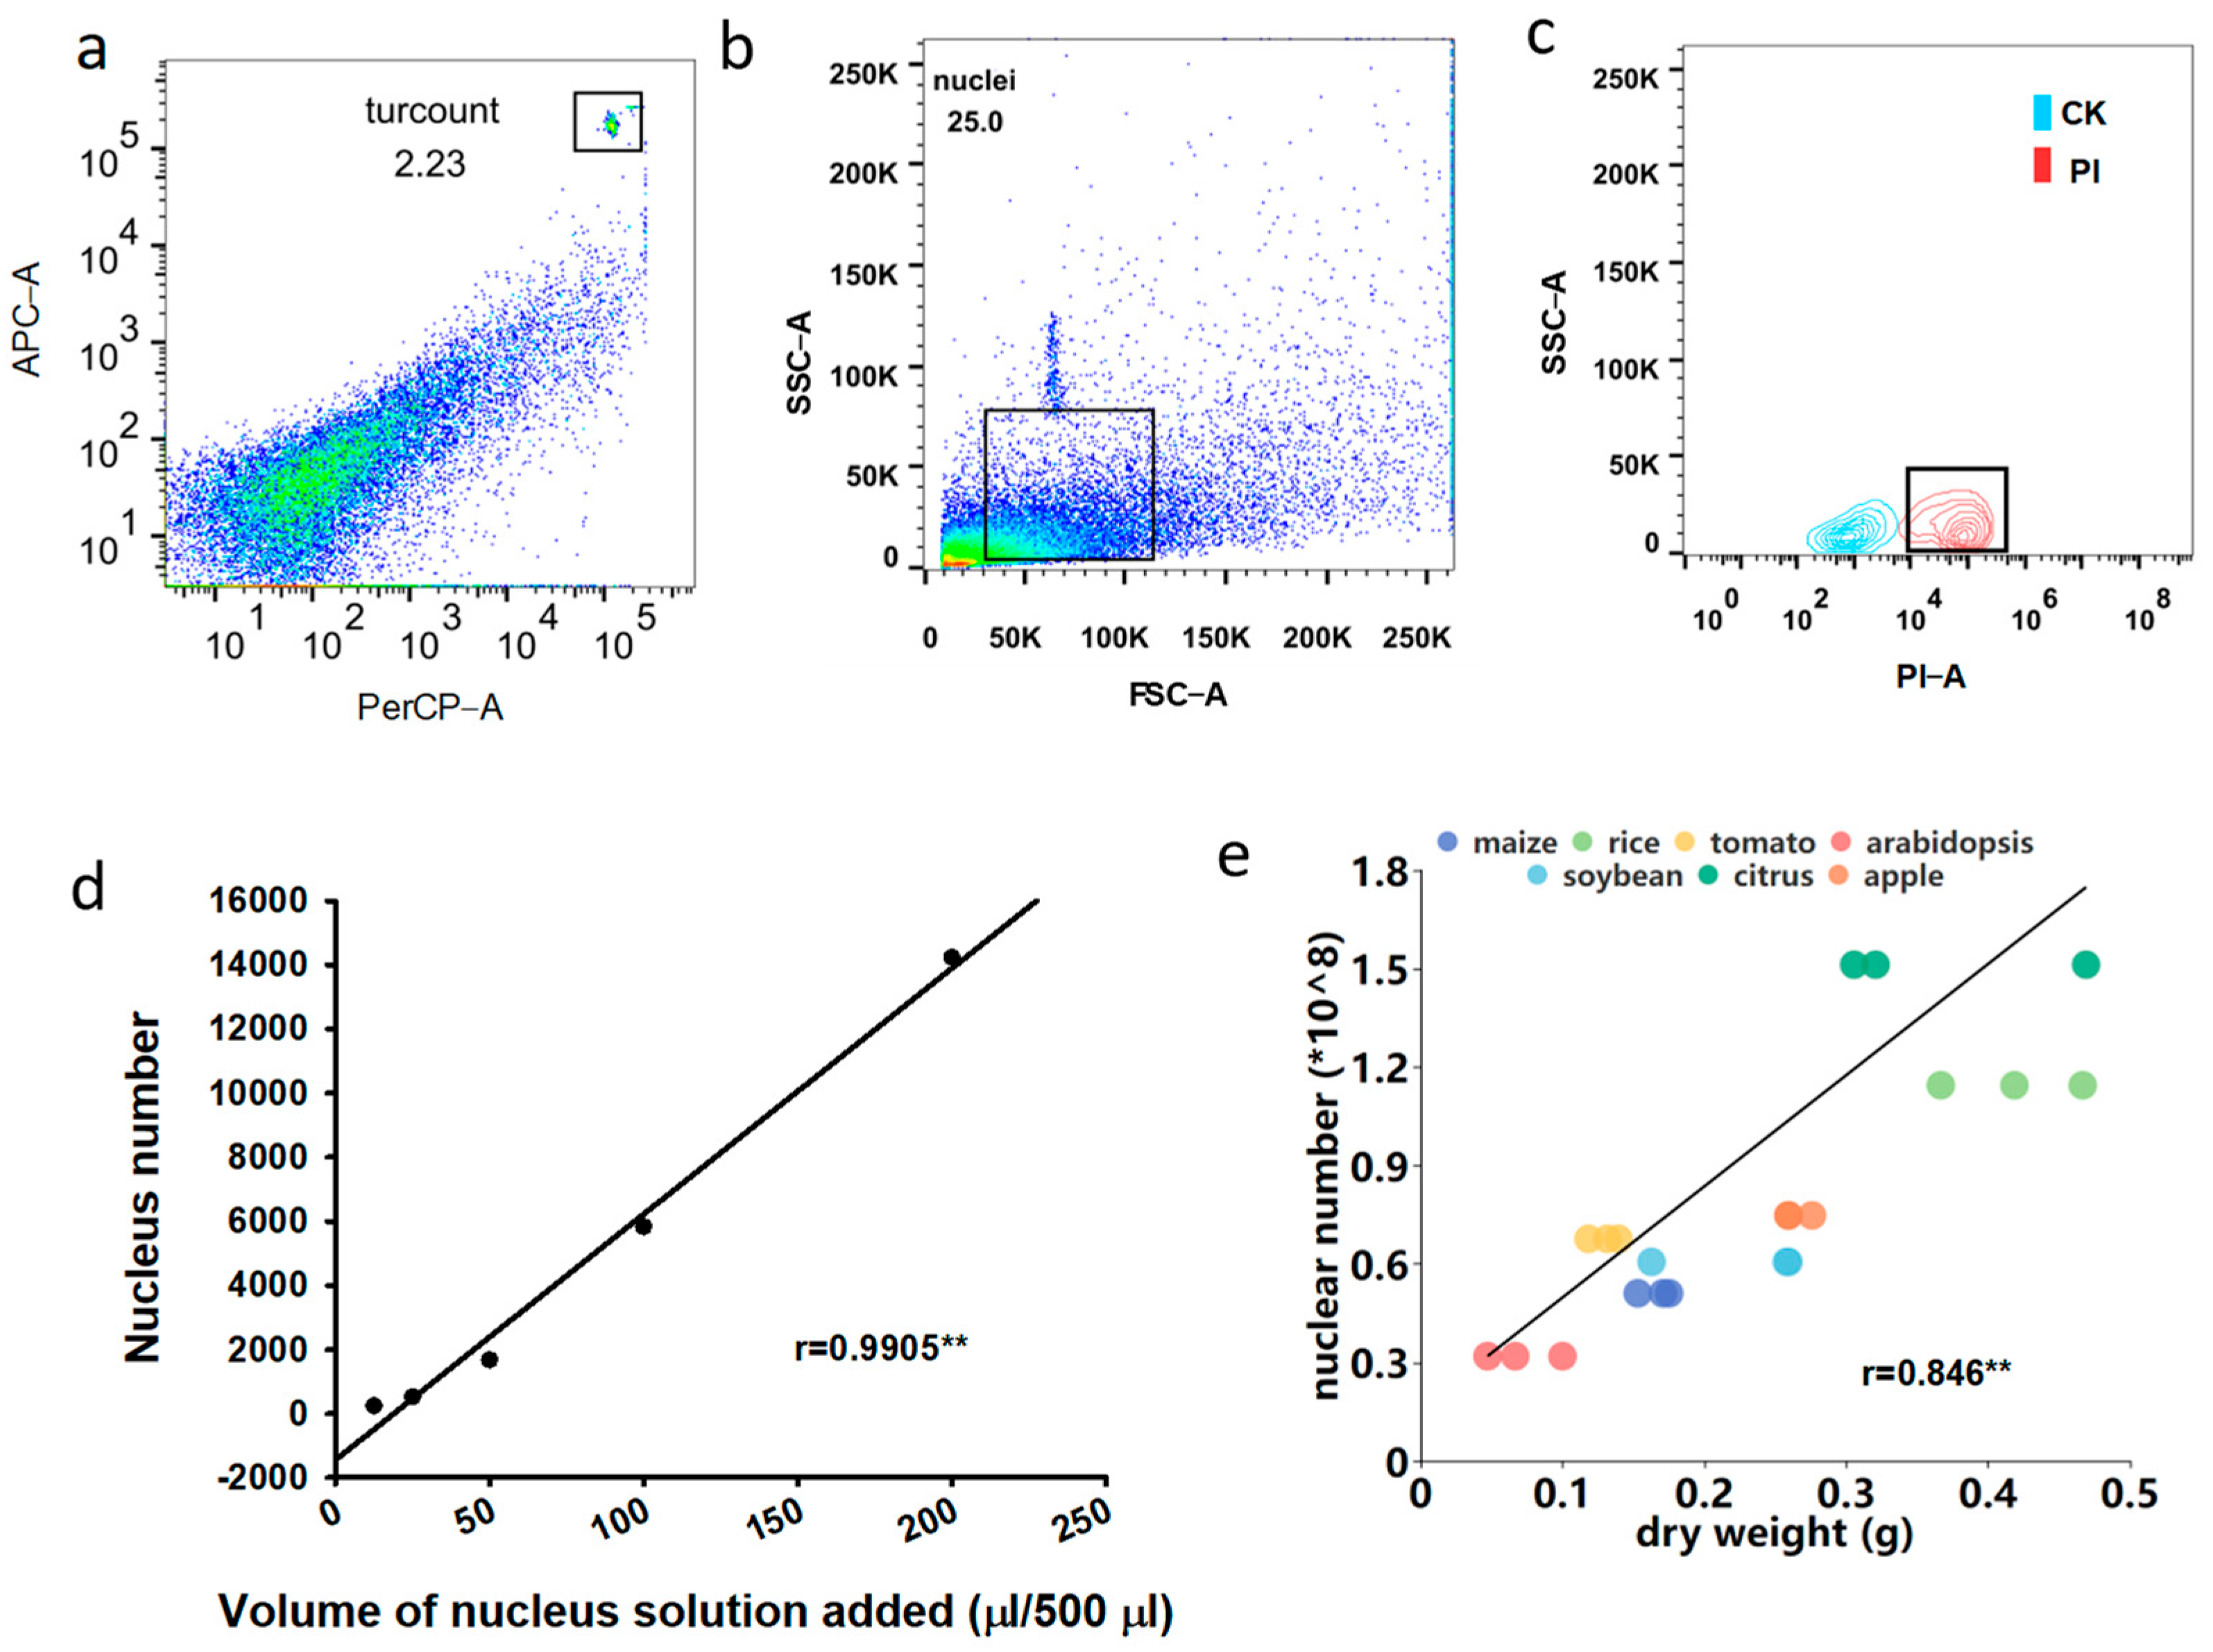
2.9. Procedure of Absolute Quantification of Nuclei in Flow Cytometry
- 33
- Add 425 μL washing buffer and 50 μL nuclei from step 10 into the BD Trucount tube and vortex for 30 s.
- 34
- Add 25 μL PI (Thermo Fisher Scientific Cat. No. 00699050) into the tube followed by vortex.
- 35
- Incubate at room temperature in the dark for 30 min.
- 36
- Load the tube into flow cytometry.
- 37
- Generate a dot plot of PerCP-area versus APC-area to select for the position of Trucount beads, and the Trucount bead number can be obtained.
- 38
- Generate a dot plot of FSC-area versus SSC-area to select the size position of nuclei.
- 39
- Using the unstained nuclei as a control, generate a contour plot of the PI signal for identifying positive nuclei. The nucleus number of samples can be acquired in this step.
- 40
- Acquire the sample for further numerical analysis on the flow cytometry.
- 41
- Calculate the absolute counts of nuclei using the following formula:
- absolute nuclear Count = (target population events/bead events collected) × (beads per test from the package insert).
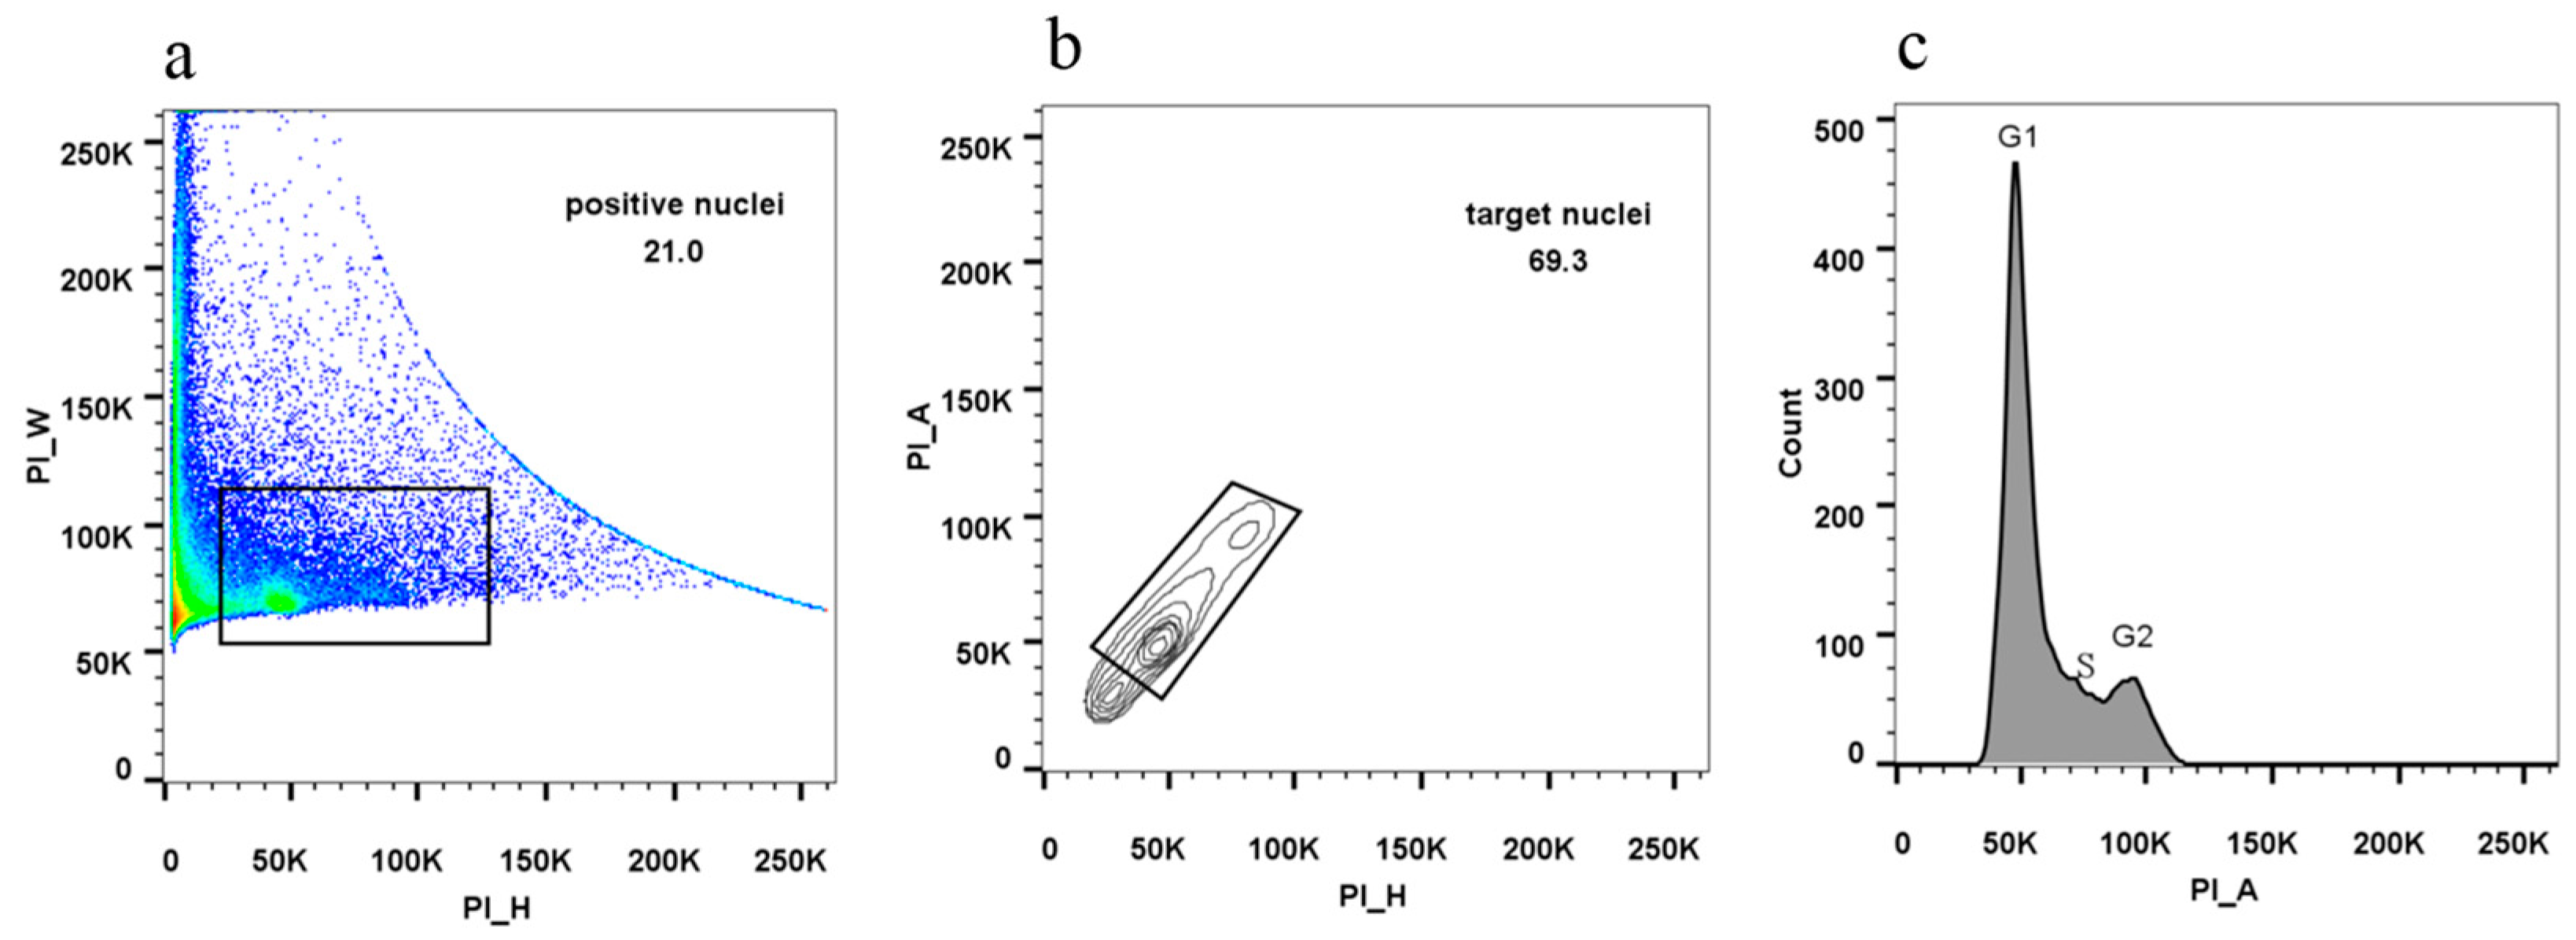
2.10. Assaying Cell Cycle Determination Using Flow Cytometry
- 42
- Resuspend the white precipitate from step 8 with 1 mL WSD buffer.
- 43
- Pipette 20 μL nuclei (about 1 × 10⁶ nuclei) to a new flow tube.
- 44
- Add 500 μL PI/RNase Staining Buffer (BD Cat. No. 550825) to the tube.
- 45
- Incubate for 15 min at room temperature.
- 46
- Filter the solution through a 35 μm cell strainer and load the tube into flow cytometry.
- 47
- Generate a dot plot of PI-height versus PI-width to establish the position of positive nuclei.
- 48
- Under the positive nuclei, generate a contour plot of PI-height versus PI-area to select for target nuclei and exclude debris.
- 49
- Generate a histogram plot of PI-area signal to display cells at the G1 and G2 stages.
2.11. Nuclei RNA Extraction and Quantitative Real-Time PCR (qRT-PCR) Analysis
2.12. Library Construction and Sequencing for Whole Transcriptome Analysis (WTA)
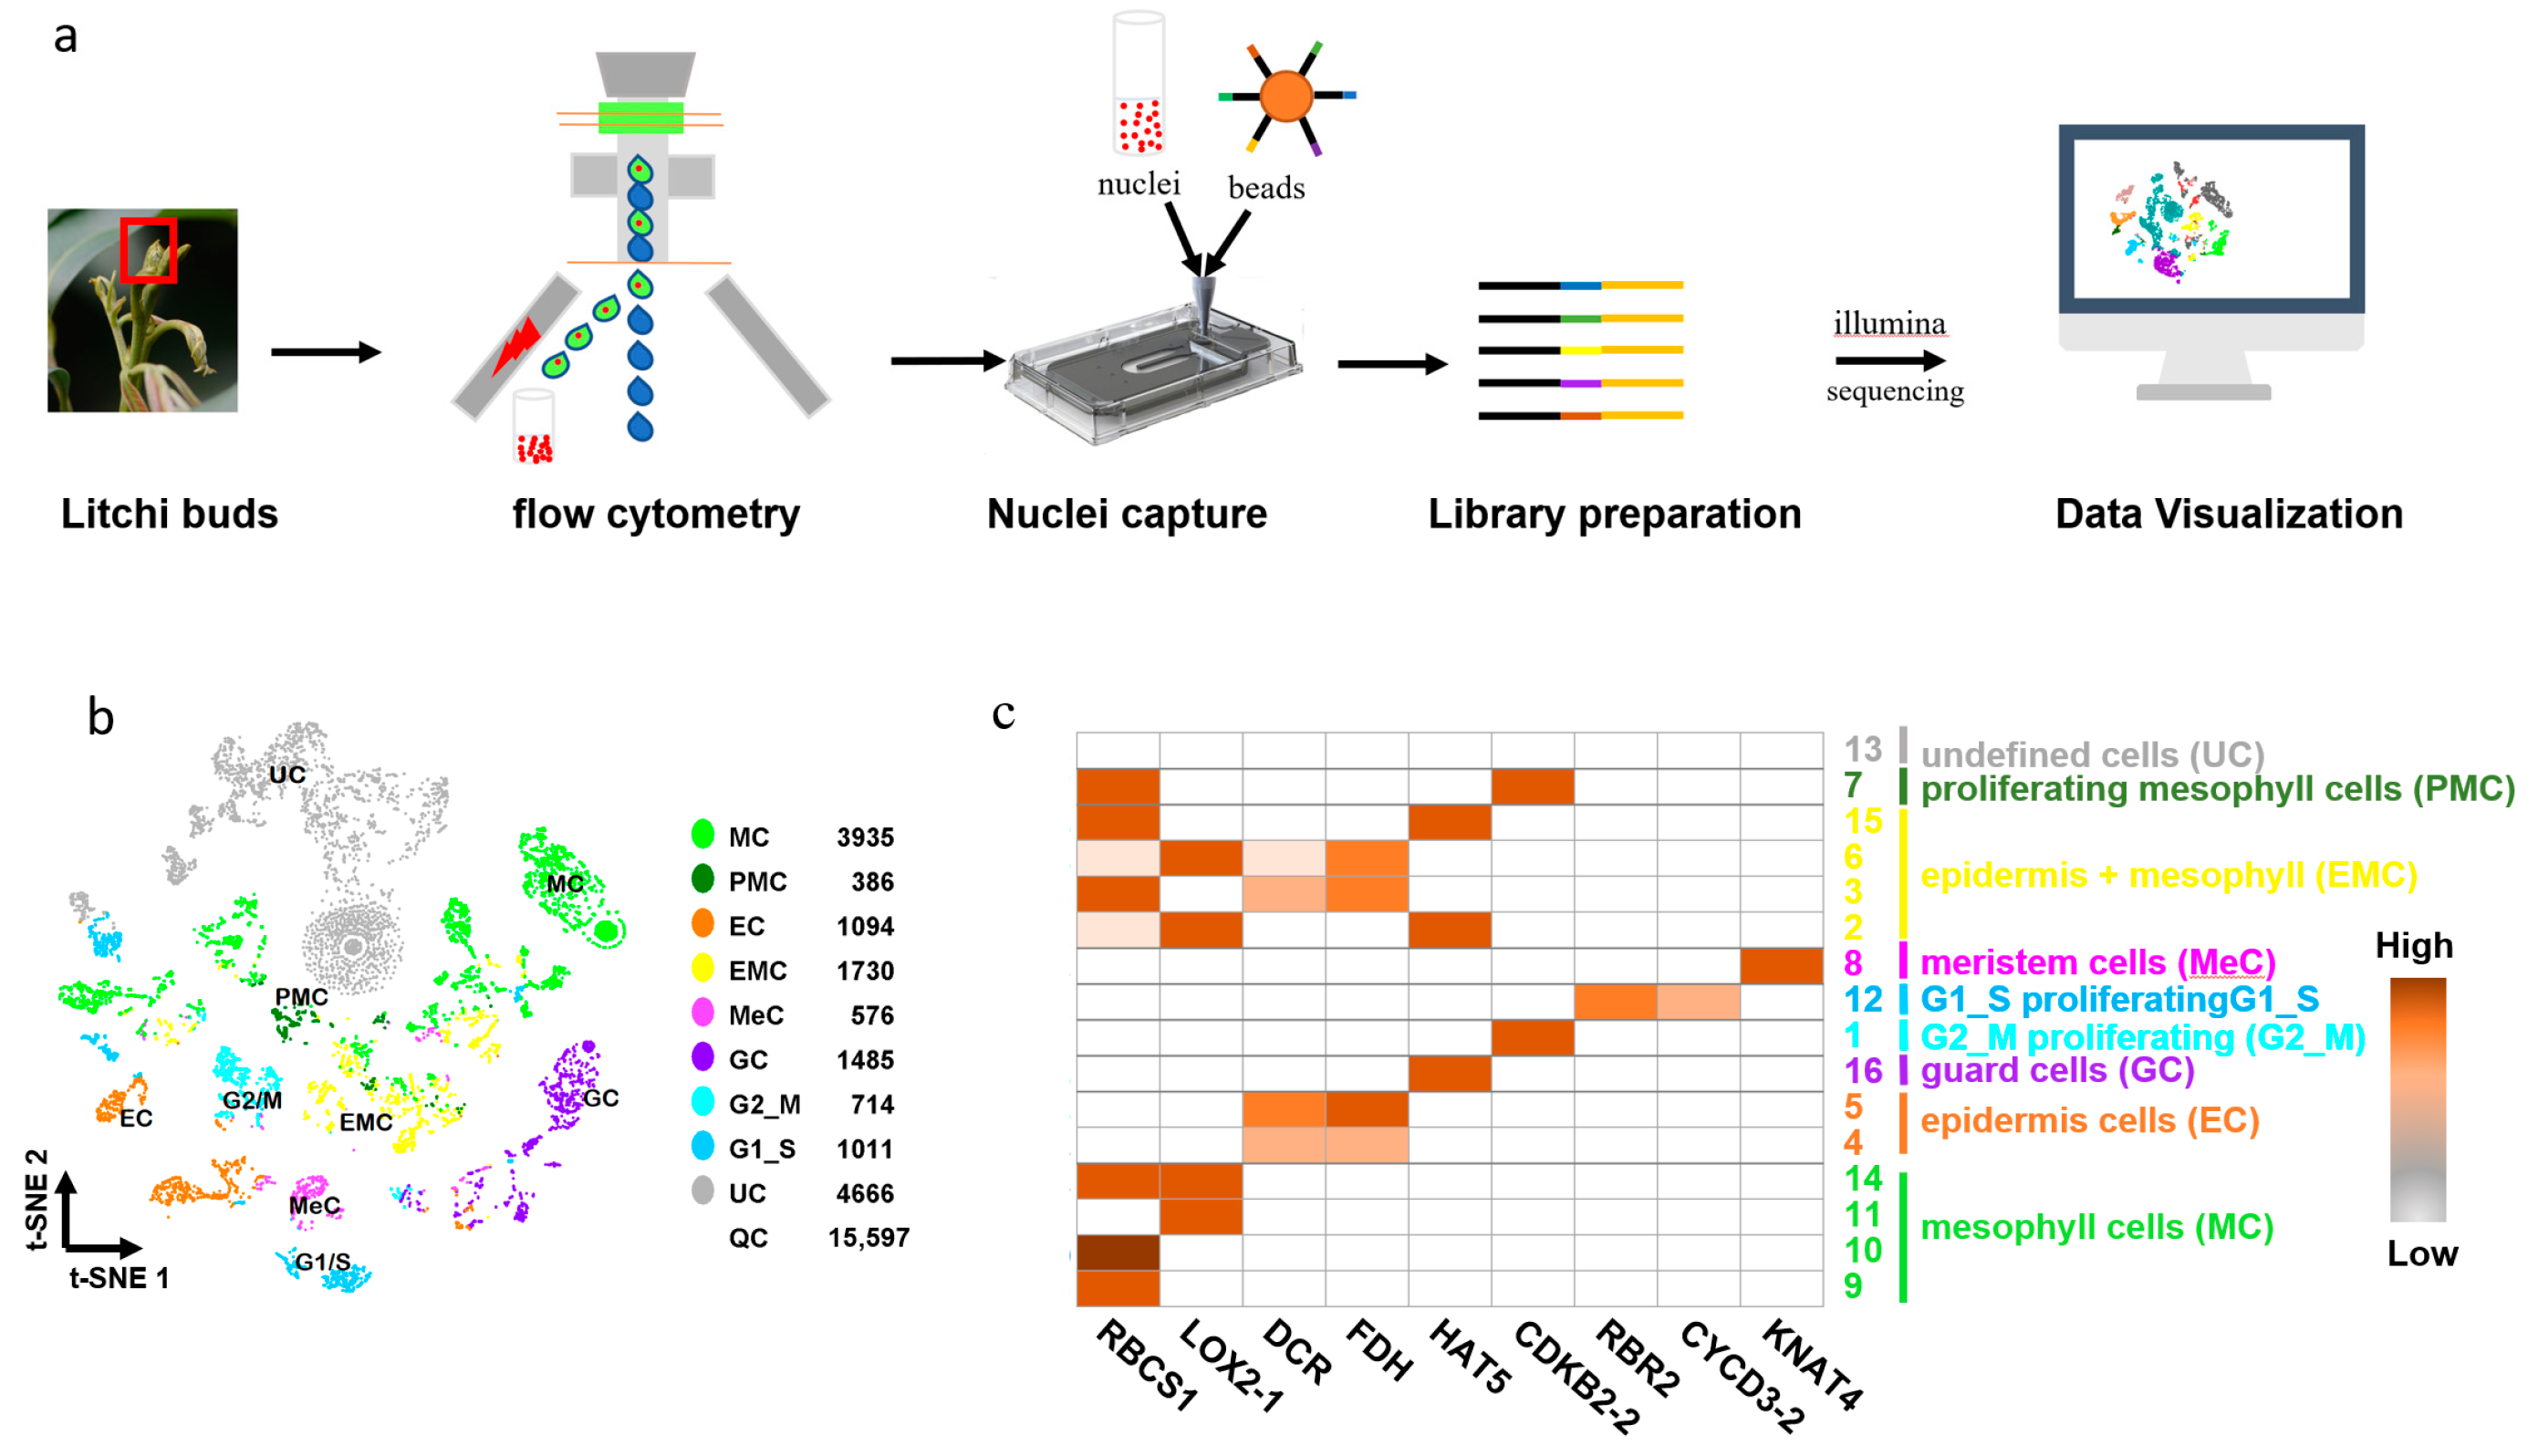
2.13. Data Analysis and Visualization for SnRNA-Seq
2.14. Troubleshooting
3. Results
3.1. Optimization of Nucleus Isolation Buffer for Ten Plants
3.2. Flow Cytometry for Nucleus Purification
3.3. The Absolute Nucleus Count of Ten Plant Species
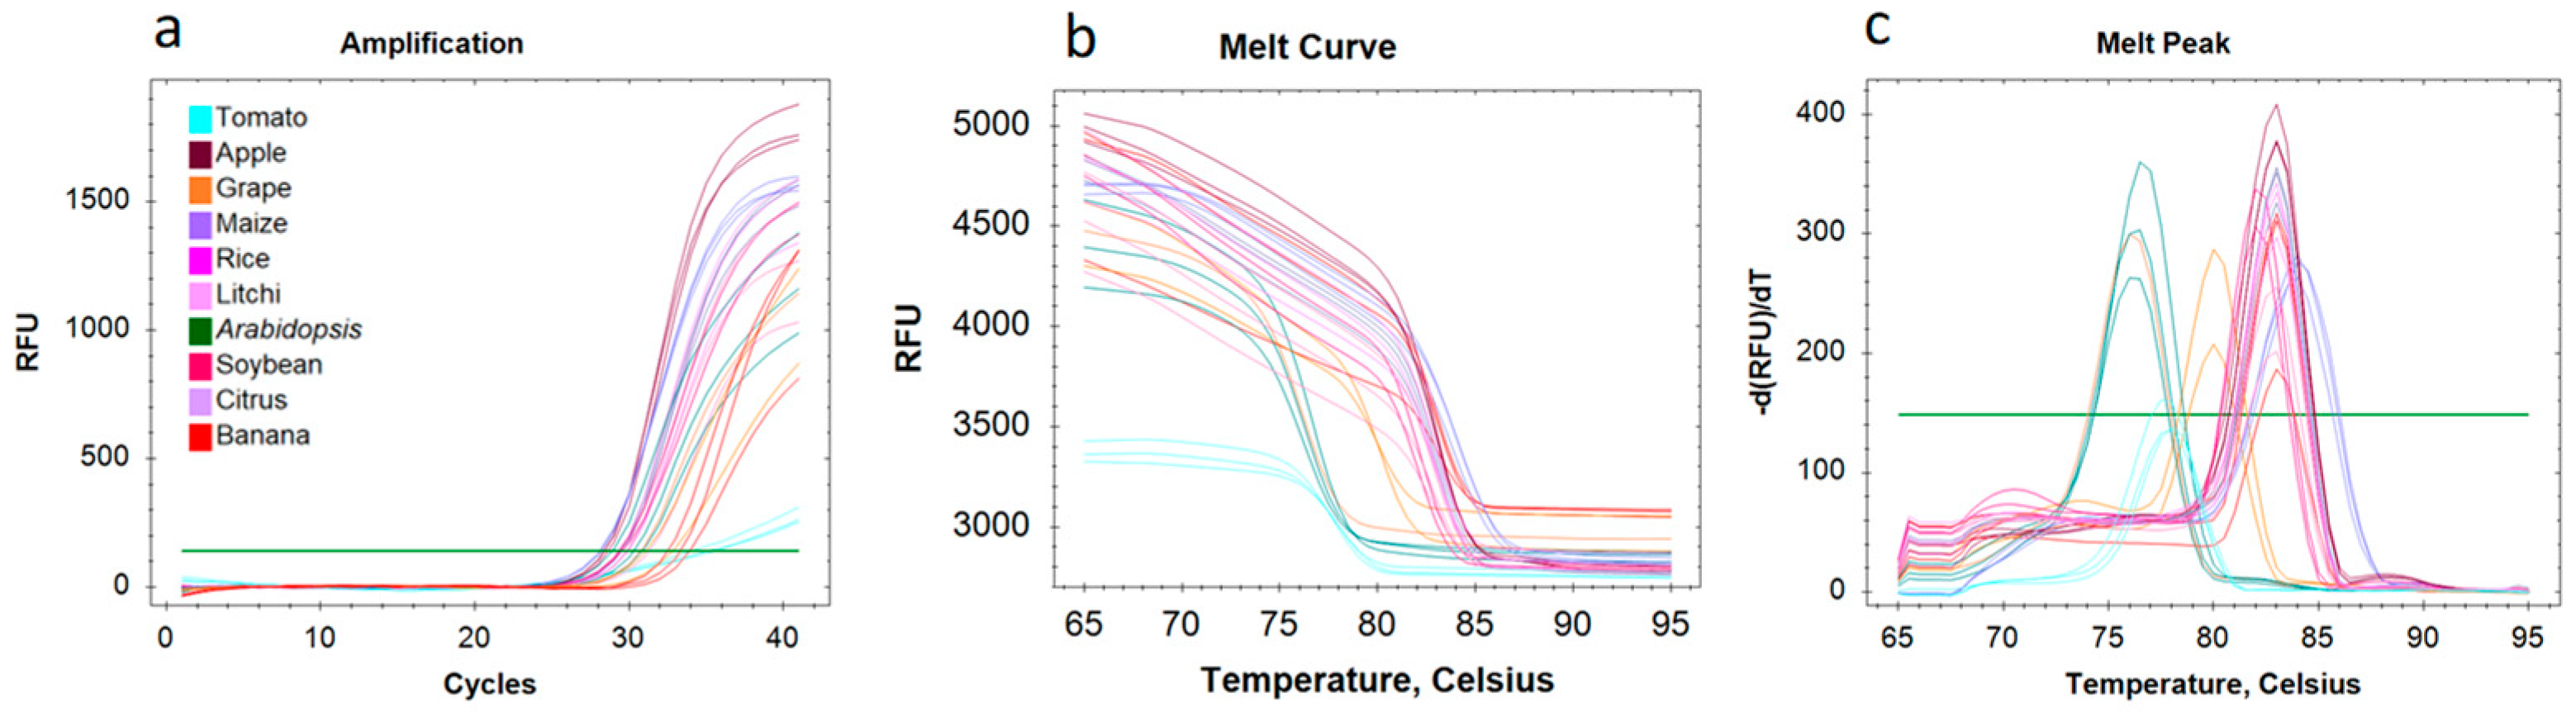
3.4. Nuclear RNA Quality Monitoring and Application in snRNA-Seq
3.5. Nuclear DNA Quality Monitoring
4. Conclusions
Supplementary Materials
Author Contributions
Funding
Institutional Review Board Statement
Informed Consent Statement
Data Availability Statement
Acknowledgments
Conflicts of Interest
References
- Consortium, T.M. A single-cell transcriptomic atlas characterizes ageing tissues in the mouse. Nature 2020, 583, 590–595. [Google Scholar] [CrossRef] [PubMed]
- Taylor, D.M.; Aronow, B.J.; Tan, K.; Bernt, K.; Salomonis, N.; Greene, C.S.; Frolova, A.; Henrickson, S.; Wells, A.; Pei, L.; et al. The Pediatric Cell Atlas: Defining the Growth Phase of Human Development at Single-Cell Resolution. Dev. Cell 2019, 49, 10–29. [Google Scholar] [CrossRef] [PubMed] [Green Version]
- Zhang, T.-Q.; Chen, Y.; Wang, J.-W. A single-cell analysis of the Arabidopsis vegetative shoot apex. Dev. Cell 2021, 56, 1056–1074.e8. [Google Scholar] [CrossRef] [PubMed]
- Picard, C.L.; Povilus, R.A.; Williams, B.P.; Gehring, M. Transcriptional and imprinting complexity in Arabidopsis seeds at single-nucleus resolution. Nat. Plants 2021, 7, 730–738. [Google Scholar] [CrossRef]
- Zhang, T.-Q.; Chen, Y.; Liu, Y.; Lin, W.-H.; Wang, J.-W. Single-cell transcriptome atlas and chromatin accessibility landscape reveal differentiation trajectories in the rice root. Nat. Commun. 2021, 12, 2053. [Google Scholar] [CrossRef]
- Liu, Q.; Liang, Z.; Feng, D.; Jiang, S.; Wang, Y.; Du, Z.; Li, R.; Hu, G.; Zhang, P.; Ma, Y.; et al. Transcriptional landscape of rice roots at the single-cell resolution. Mol. Plant 2021, 14, 384–394. [Google Scholar] [CrossRef] [PubMed]
- Li, X.; Zhang, X.; Gao, S.; Cui, F.; Chen, W.; Fan, L.; Qi, Y. Single-cell RNA sequencing reveals the landscape of maize root tips and assists in identification of cell type-specific nitrate-response genes. Crop. J. 2022, in press. [Google Scholar] [CrossRef]
- Marand, A.P.; Chen, Z.; Gallavotti, A.; Schmitz, R.J. A cis-regulatory atlas in maize at single-cell resolution. Cell 2021, 184, 3041–3055.e21. [Google Scholar] [CrossRef]
- Tian, C.; Du, Q.; Xu, M.; Du, F.; Jiao, Y. Single-nucleus RNA-seq resolves spatiotemporal developmental trajectories in the tomato shoot apex. bioRxiv 2020. [Google Scholar] [CrossRef]
- Liu, H.; Hu, D.; Du, P.; Wang, L.; Liang, X.; Li, H.; Lu, Q.; Li, S.; Liu, H.; Chen, X.; et al. Single-cell RNA-seq describes the transcriptome landscape and identifies critical transcription factors in the leaf blade of the allotetraploid peanut (Arachis hypogaea L.). Plant Biotechnol. J. 2021, 19, 2261–2276. [Google Scholar] [CrossRef] [PubMed]
- Conde, D.; Triozzi, P.M.; Balmant, K.M.; Doty, A.L.; Miranda, M.; Boullosa, A.; Schmidt, H.W.; Pereira, W.J.; Dervinis, C.; Kirst, M. A robust method of nuclei isolation for single-cell RNA sequencing of solid tissues from the plant genus Populus. PLoS ONE 2021, 16, e251149. [Google Scholar] [CrossRef]
- Wu, H.; Kirita, Y.; Donnelly, E.L.; Humphreys, B.D. Advantages of Single-Nucleus over Single-Cell RNA Sequencing of Adult Kidney: Rare Cell Types and Novel Cell States Revealed in Fibrosis. J. Am. Soc. Nephrol. 2019, 30, 23–32. [Google Scholar] [CrossRef] [PubMed] [Green Version]
- Bakken, T.E.; Hodge, R.D.; Miller, J.A.; Yao, Z.; Nguyen, T.N.; Aevermann, B.; Barkan, E.; Bertagnolli, D.; Casper, T.; Dee, N.; et al. Single-nucleus and single-cell transcriptomes compared in matched cortical cell types. PLOS ONE 2018, 13, e0209648. [Google Scholar] [CrossRef] [Green Version]
- Sunaga-Franze, D.Y.; Muino, J.M.; Braeuning, C.; Xu, X.; Zong, M.; Smaczniak, C.; Yan, W.; Fischer, C.; Vidal, R.; Kliem, M.; et al. Single-nuclei RNA-sequencing of plant tissues. bioRxiv 2021. [Google Scholar] [CrossRef]
- Shaw, P.J.; Brown, J.W. Plant nuclear bodies. Curr. Opin. Plant Biol. 2004, 7, 614–620. [Google Scholar] [CrossRef] [PubMed]
- Lutz, K.A.; Wang, W.; Zdepski, A.; Michael, T.P. Isolation and analysis of high quality nuclear DNA with reduced organellar DNA for plant genome sequencing and resequencing. BMC Biotechnol. 2011, 11, 54–59. [Google Scholar] [CrossRef] [Green Version]
- Pandey, A.; Chakraborty, S.; Chakraborty, N. Nuclear Proteome: Isolation of Intact Nuclei, Extraction of Nuclear Proteins, and 2-DE Analysis. Methods Mol Biol. 2018, 1696, 41–55. [Google Scholar] [CrossRef]
- Farmer, A.; Thibivilliers, S.; Ryu, K.H.; Schiefelbein, J.; Libault, M. Single-nucleus RNA and ATAC sequencing reveals the impact of chromatin accessibility on gene expression in Arabidopsis roots at the single-cell level. Mol. Plant 2021, 14, 372–383. [Google Scholar] [CrossRef]
- Morabito, S.; Miyoshi, E.; Michael, N.; Shahin, S.; Martini, A.C.; Head, E.; Silva, J.; Leavy, K.; Perez-Rosendahl, M.; Swarup, V. Single-nucleus chromatin accessibility and transcriptomic characterization of Alzheimer’s disease. Nat. Genet. 2021, 53, 1143–1155. [Google Scholar] [CrossRef]
- Liu, H.; Zhou, J.; Tian, W.; Luo, C.; Bartlett, A.; Aldridge, A.; Lucero, J.; Osteen, J.K.; Nery, J.R.; Chen., H.; et al. DNA methylation atlas of the mouse brain at single-cell resolution. Nature 2021, 598, 120–128. [Google Scholar] [CrossRef]
- Hoffer, P.; Ivashuta, S.; Pontes, O.; Vitins, A.; Pikaard, C.; Mroczka, A.; Wagner, N.; Voelker, T. Posttranscriptional gene silencing in nuclei. Proc. Natl. Acad. Sci. USA 2011, 108, 409–414. [Google Scholar] [CrossRef] [Green Version]
- Park, M.Y.; Wu, G.; Gonzalez-Sulser, A.; Vaucheret, H.; Poethig, R.S. Nuclear processing and export of microRNAs in Arabidopsis. Proc. Natl. Acad. Sci. USA 2005, 102, 3691–3696. [Google Scholar] [CrossRef] [PubMed] [Green Version]
- Sikorskaite, S.; Rajamäki, M.-L.; Baniulis, D.; Stanys, V.; Valkonen, J.P. Protocol: Optimised methodology for isolation of nuclei from leaves of species in the Solanaceae and Rosaceae families. Plant Methods 2013, 9, 31. [Google Scholar] [CrossRef] [PubMed] [Green Version]
- Jianfang, X.; Gao, C.; Li, X.; Liu, G. AB0321 Negative correlation of the absolute number of cd4 +cd25+foxp3+regulatory t cells to the levels of rheumatoid factor in peripheral blood of new onset patients with rheumatoid arthritis. Ann Rheum Dis. 2018, 77, 1336. [Google Scholar] [CrossRef]
- Li, D.L.; Li, X.G.; Gu, Y.J.; Wang, Z. Investigation of Endosperm Cell Development of Different Rice Varieties. Sci. Agric. Sin. 2014, 4719, 3757–3768. [Google Scholar]
- Aghoghovwia, B.E.; Oorschot, D.E. Absolute number of parvicellular and magnocellular neurons in the red nucleus of the rat midbrain: A stereological study. J. Anat. 2016, 229, 406–415. [Google Scholar] [CrossRef] [PubMed]
- Lai, B.; Hu, B.; Qin, Y.-H.; Zhao, J.-T.; Wang, H.-C.; Hu, G.-B. Transcriptomic analysis of Litchi chinensis pericarp during maturation with a focus on chlorophyll degradation and flavonoid biosynthesis. BMC Genom. 2015, 16, 225. [Google Scholar] [CrossRef] [Green Version]
- Hu, G.; Feng, J.; Xiang, X.; Wang, J.; Salojärvi, J.; Liu, C.; Wu, Z.; Zhang, J.; Liang, X.; Jiang, Z.; et al. Two divergent haplotypes from a highly heterozygous lychee genome suggest independent domestication events for early and late-maturing cultivars. Nat. Genet. 2022, 54, 73–83. [Google Scholar] [CrossRef]
- Dobin, A.; Davis, C.A.; Schlesinger, F.; Drenkow, J.; Zaleski, C.; Jha, S.; Batut, P.; Chaisson, M.; Gingeras, T.R. STAR: Ultrafast universal RNA-seq aligner. Bioinformatics 2013, 29, 15–21. [Google Scholar] [CrossRef]
- LoouIs, W.D. Overcoming problems of phenolics and quinoncs in the isolation of plant enzymes and organellcs. Meth. Enzym. 1974, 62, 528–544. [Google Scholar] [CrossRef]
- Erickson, J.R.; Mair, F.; Bugos, G.; Martin, J.; Tyznik, A.J.; Nakamoto, M.; Mortimer, S.; Prlic, M. AbSeq Protocol Using the Nano-Well Cartridge-Based Rhapsody Platform to Generate Protein and Transcript Expression Data on the Single-Cell Level. STAR Protoc. 2020, 1, 100092. [Google Scholar] [CrossRef]
- Valihrach, L.; Androvic, P.; Kubista, M. Platforms for Single-Cell Collection and Analysis. Int. J. Mol. Sci. 2018, 19, 807. [Google Scholar] [CrossRef] [PubMed] [Green Version]
- Hassan, H.; Scheres, B.; Blilou, I. JACKDAW controls epidermal patterning in the Arabidopsis root meristem through a non-cell-autonomous mechanism. Development 2010, 137, 1523–1529. [Google Scholar] [CrossRef] [Green Version]
- Jensen, A.B.; Raventos, D.; Mundy, J. Fusion genetic analysis of jasmonate-signalling mutants in Arabidopsis. Plant J. 2002, 29, 595–606. [Google Scholar] [CrossRef]
- Pichersky, E.; Bernatzky, R.; Tanksley, S.D.; Cashmore, A.R. Evidence for selection as a mechanism in the concerted evolution of Lycopersicon esculentum (tomato) genes encoding the small subunit of ribulose-1,5-bisphosphate carboxylase/oxygenase. Proc. Natl. Acad. Sci. USA 1986, 83, 3880–3884. [Google Scholar] [CrossRef] [PubMed] [Green Version]
- Abe, M.; Katsumata, H.; Komeda, Y.; Takahashi, T. Regulation of shoot epidermal cell differentiation by a pair of homeodomain proteins in Arabidopsis. Development 2003, 130, 635–643. [Google Scholar] [CrossRef] [Green Version]
- Lopez-Anido, C.B.; Vatén, A.; Smoot, N.K.; Sharma, N.; Guo, V.; Gong, Y.; Gil, M.X.A.; Weimer, A.K.; Bergmann, D.C. Single-cell resolution of lineage trajectories in the Arabidopsis stomatal lineage and developing leaf. Dev. Cell 2021, 56, 1043–1055.e4. [Google Scholar] [CrossRef] [PubMed]
- Ach, R.A.; Durfee, T.; Miller, A.B.; Taranto, P.; Hanley-Bowdoin, L.; Zambryski, P.C.; Gruissem, W. RRB1 and RRB2 encode maize retinoblastoma-related proteins that interact with a plant D-type cyclin and geminivirus replication protein. Mol. Cell. Biol. 1997, 17, 5077–5086. [Google Scholar] [CrossRef]


| Maize | Rice | Tomato | Arabidopsis | Soybean | Banana | Grape | Litchi | Citrus | Apple | |
|---|---|---|---|---|---|---|---|---|---|---|
| MES-NaOH (10 mM) | 7.4 | 7.4 | 7.4 | 7.4 | 7.4 | 5.7 | 5.7 | 5.7 | 5.7 | 5.7 |
| NaCl (mM) | 10 | - | 10 | - | 10 | 10 | 10 | 10 | 10 | 10 |
| KCl (mM) | 10 | - | 10 | - | 10 | 10 | 10 | 10 | 10 | 10 |
| MgCl2 (mM) | - | 10 | - | 10 | - | - | - | - | - | - |
| EGTA (mM) | 2 | 2 | 2 | 2 | 2 | - | - | - | - | - |
| EDTA (mM) | - | - | - | - | - | 2.5 | 2.5 | 2.5 | 2.5 | 2.5 |
| Mannitol (mM) | 250 | 400 | 250 | 400 | 250 | 250 | 250 | 250 | 250 | 250 |
| Ficoll 400 (%) | - | 2.5 | - | 2.5 | 0.5 | - | - | - | 0.5 | - |
| Dextran T40 (%) | - | 5 | - | 5 | 1 | - | - | - | 1 | - |
| Spermine (mM) | 0.1 | 0.1 | 0.1 | 0.1 | 0.1 | 0.1 | 0.1 | 0.1 | 0.1 | 0.1 |
| Spermidine (mM) | 0.5 | 0.5 | 0.5 | 0.5 | 0.5 | 0.5 | 0.5 | 0.5 | 0.5 | 0.5 |
| Cocktail (%) | 0.1 | 0.1 | 0.1 | 0.1 | 0.1 | 0.1 | 0.1 | 0.1 | 0.1 | 0.1 |
| RNase inhibitor (U/μL) | 0.2 | 0.2 | 0.2 | 0.2 | 0.2 | 0.2 | 0.2 | 0.2 | 0.2 | 0.2 |
| DTT (uM) | 1 | 1 | - | - | 1 | 500 | 500 | 500 | 500 | 500 |
| Triton-100 (%) | 0.8 | 0.8 | 0.5 | 0.5 | 2 | 1 | 1 | 1 | 2 | 2 |
| Items | Maize | Rice | Tomato | Arabidopsis | Soybean | Banana | Grape | Litchi | Citrus | Apple |
|---|---|---|---|---|---|---|---|---|---|---|
| Sample amount (FW mg) | 10 | 10 | 10 | 10 | 10 | 10 | 10 | 10 | 10 | 10 |
| Dry matter ratio (%) | 16.7 ± 0.7 | 41.8 ± 2.9 | 13.0 ± 0.6 | 7.1 ± 1.5 | 22.7 ± 3.2 | 11.0 ± 0.1 | 30.7 ± 0.5 | 19.0 ± 2.1 | 36.5 ± 5.2 | 26.5 ± 0.6 |
| Sample nuclei (No.) | 282.5 ± 11.8 | 119 ± 7.8 | 170 ± 0.6 | 644 ± 2.3 | 558 ± 11.8 | 1233 ± 157.3 | 506 ± 3.2 | 1457 ± 32.9 | 581 ± 6.4 | 983 ± 10.8 |
| Trucount beads (No.) | 524 ± 2.6 | 99 ± 4.3 | 236 ± 3.2 | 1883 ± 2.3 | 897 ± 18.5 | 296 ± 7.8 | 203 ± 10.1 | 400 ± 5.8 | 361 ± 6.6 | 1340 ± 37.2 |
| Nucleus tested (number ∗ 108 g−1 DW) | 3.03 ± 0.14 | 2.73 ± 0.30 | 5.21 ± 0.05 | 4.52 ± 0.02 | 2.57 ± 0.01 | 35.3 ± 0.36 | 7.66 ± 0.33 | 18.0 ± 0.67 | 4.14 ± 0.03 | 2.81 ± 0.08 |
Publisher’s Note: MDPI stays neutral with regard to jurisdictional claims in published maps and institutional affiliations. |
© 2022 by the authors. Licensee MDPI, Basel, Switzerland. This article is an open access article distributed under the terms and conditions of the Creative Commons Attribution (CC BY) license (https://creativecommons.org/licenses/by/4.0/).
Share and Cite
Yang, M.-C.; Wu, Z.-C.; Huang, L.-L.; Abbas, F.; Wang, H.-C. Systematic Methods for Isolating High Purity Nuclei from Ten Important Plants for Omics Interrogation. Cells 2022, 11, 3919. https://doi.org/10.3390/cells11233919
Yang M-C, Wu Z-C, Huang L-L, Abbas F, Wang H-C. Systematic Methods for Isolating High Purity Nuclei from Ten Important Plants for Omics Interrogation. Cells. 2022; 11(23):3919. https://doi.org/10.3390/cells11233919
Chicago/Turabian StyleYang, Ming-Chao, Zi-Chen Wu, Liang-Liang Huang, Farhat Abbas, and Hui-Cong Wang. 2022. "Systematic Methods for Isolating High Purity Nuclei from Ten Important Plants for Omics Interrogation" Cells 11, no. 23: 3919. https://doi.org/10.3390/cells11233919