
High-Content RNAi Phenotypic Screening Unveils the Involvement of Human Ubiquitin-Related Enzymes in Late Cytokinesis
 , , , and
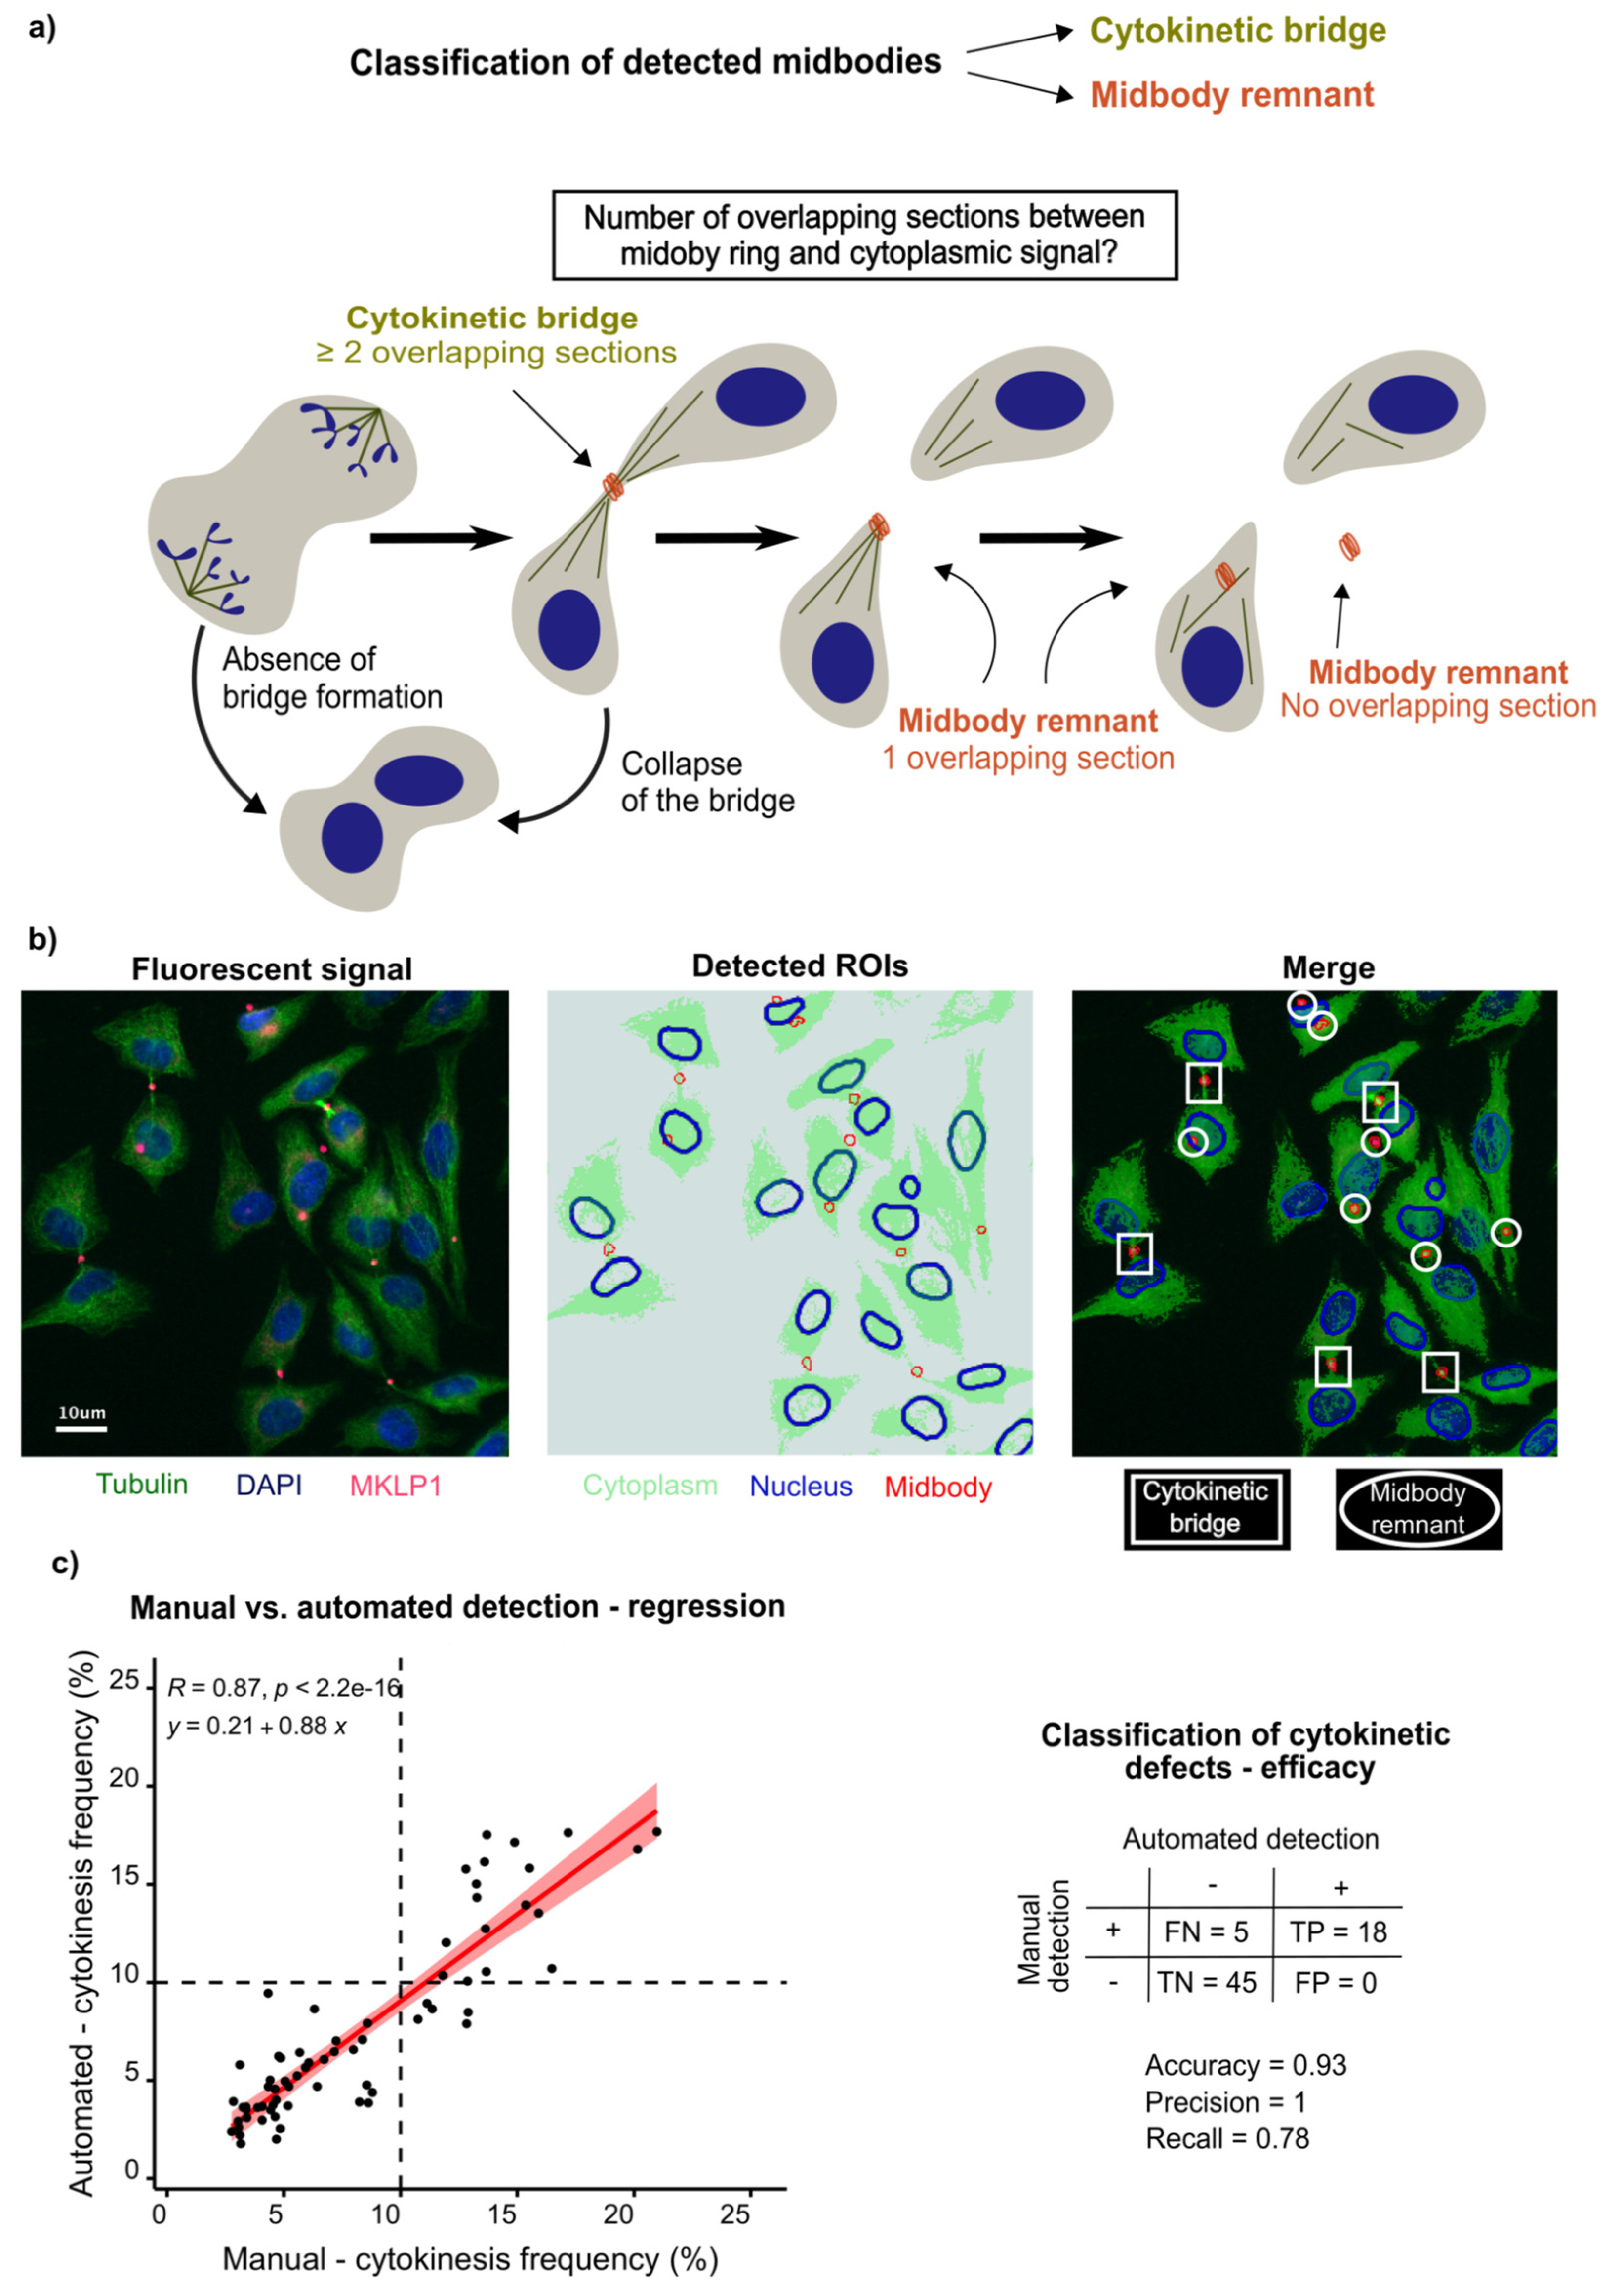
Abstract
:1. Introduction
2. Materials and Methods
2.1. Cell Lines and Cell Culture
2.2. siRNAs and Screening Bank
2.3. Screening and Transfection
2.4. Immunofluorescence and Imaging
2.5. RT-qPCR
2.6. Software Development
2.7. Image Analysis and Quantification
2.8. Representation and Statistical Analysis
3. Results
3.1. Development of Automated Detection of Cytokinetic Bridges
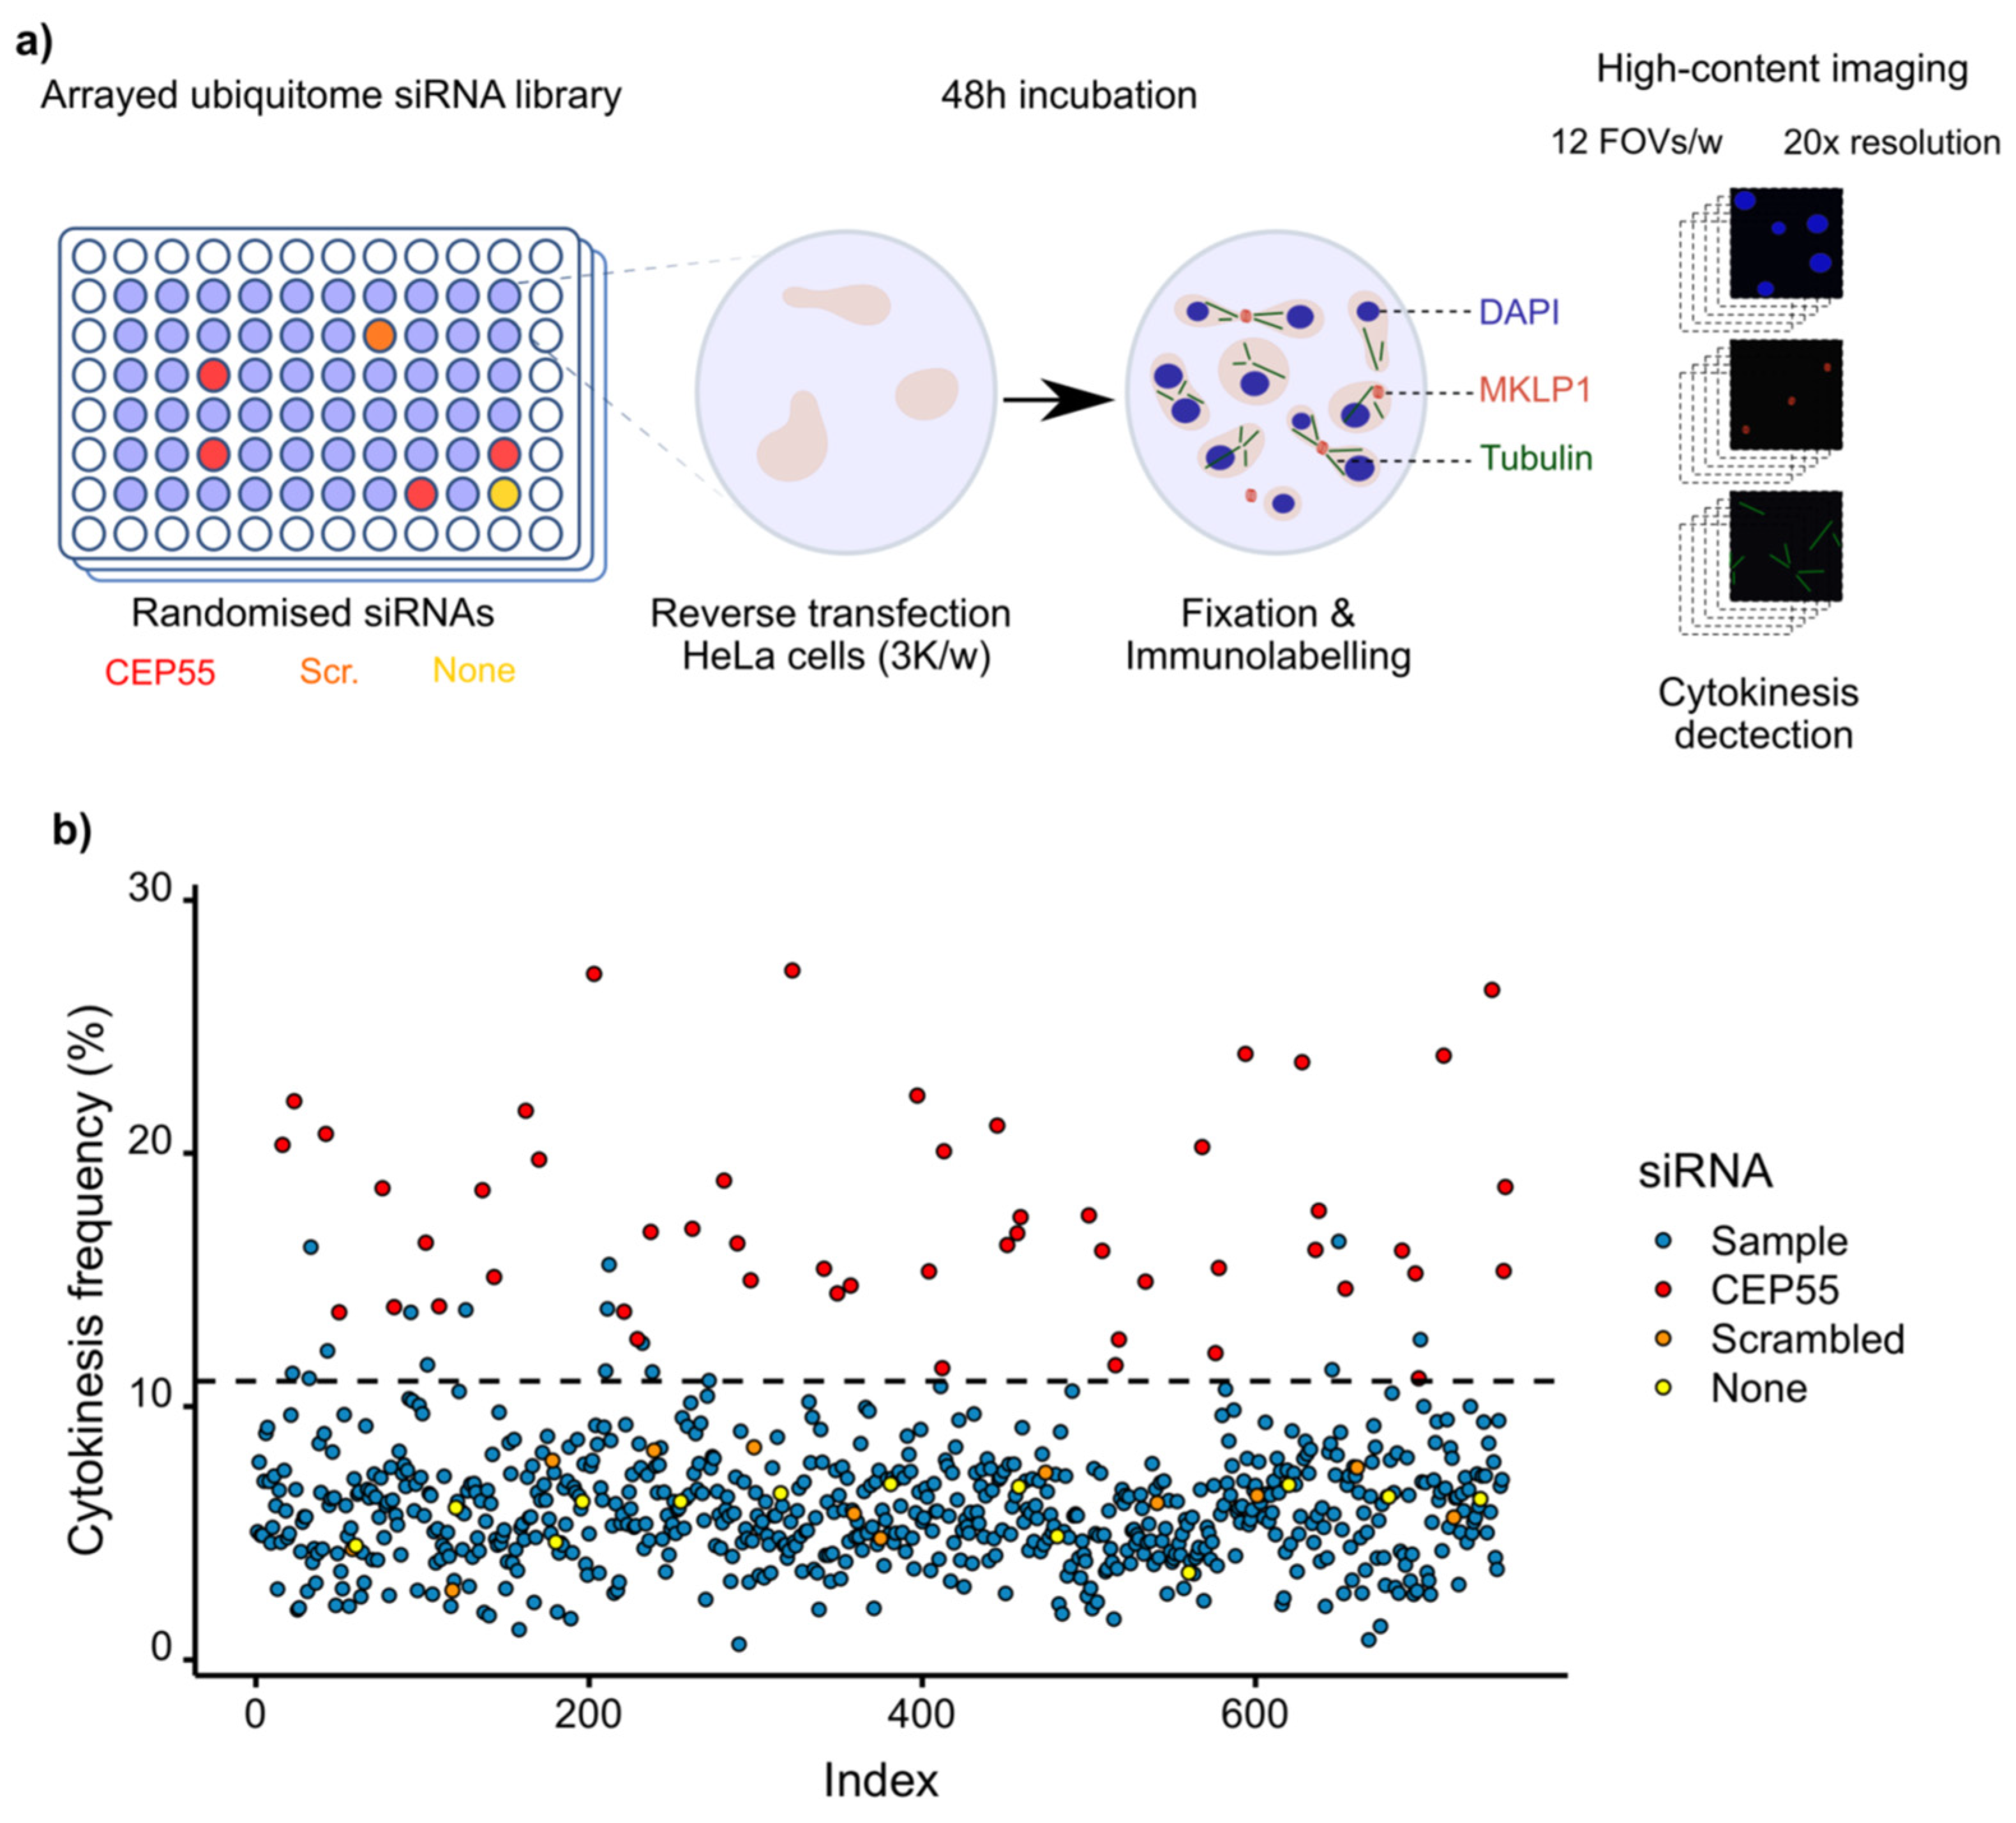
3.2. Screening of Ubiquitin Ligases and Deubiquitinases Involved in Late Cytokinesis
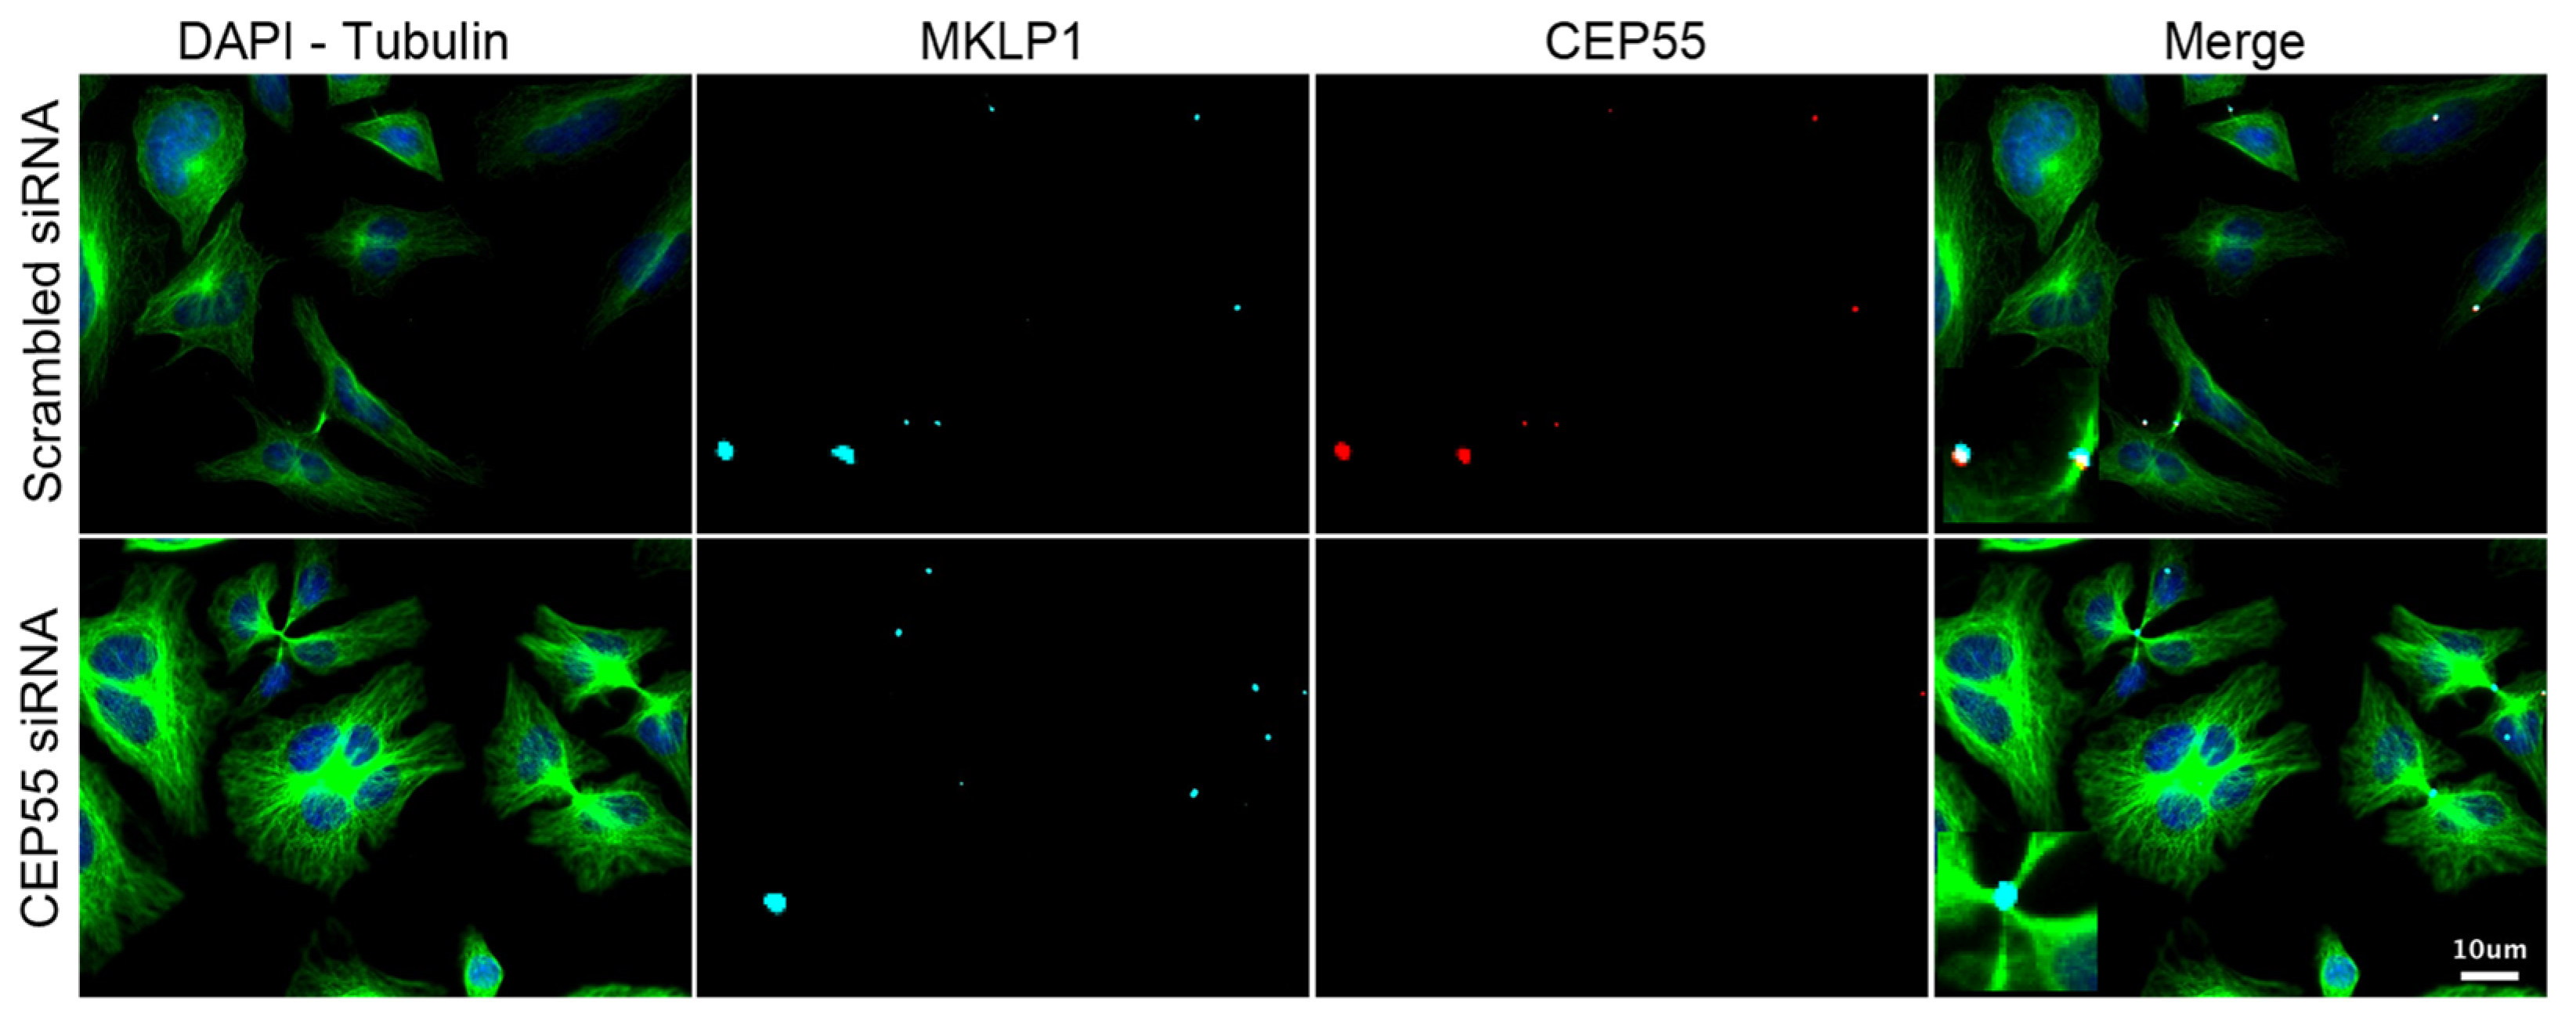
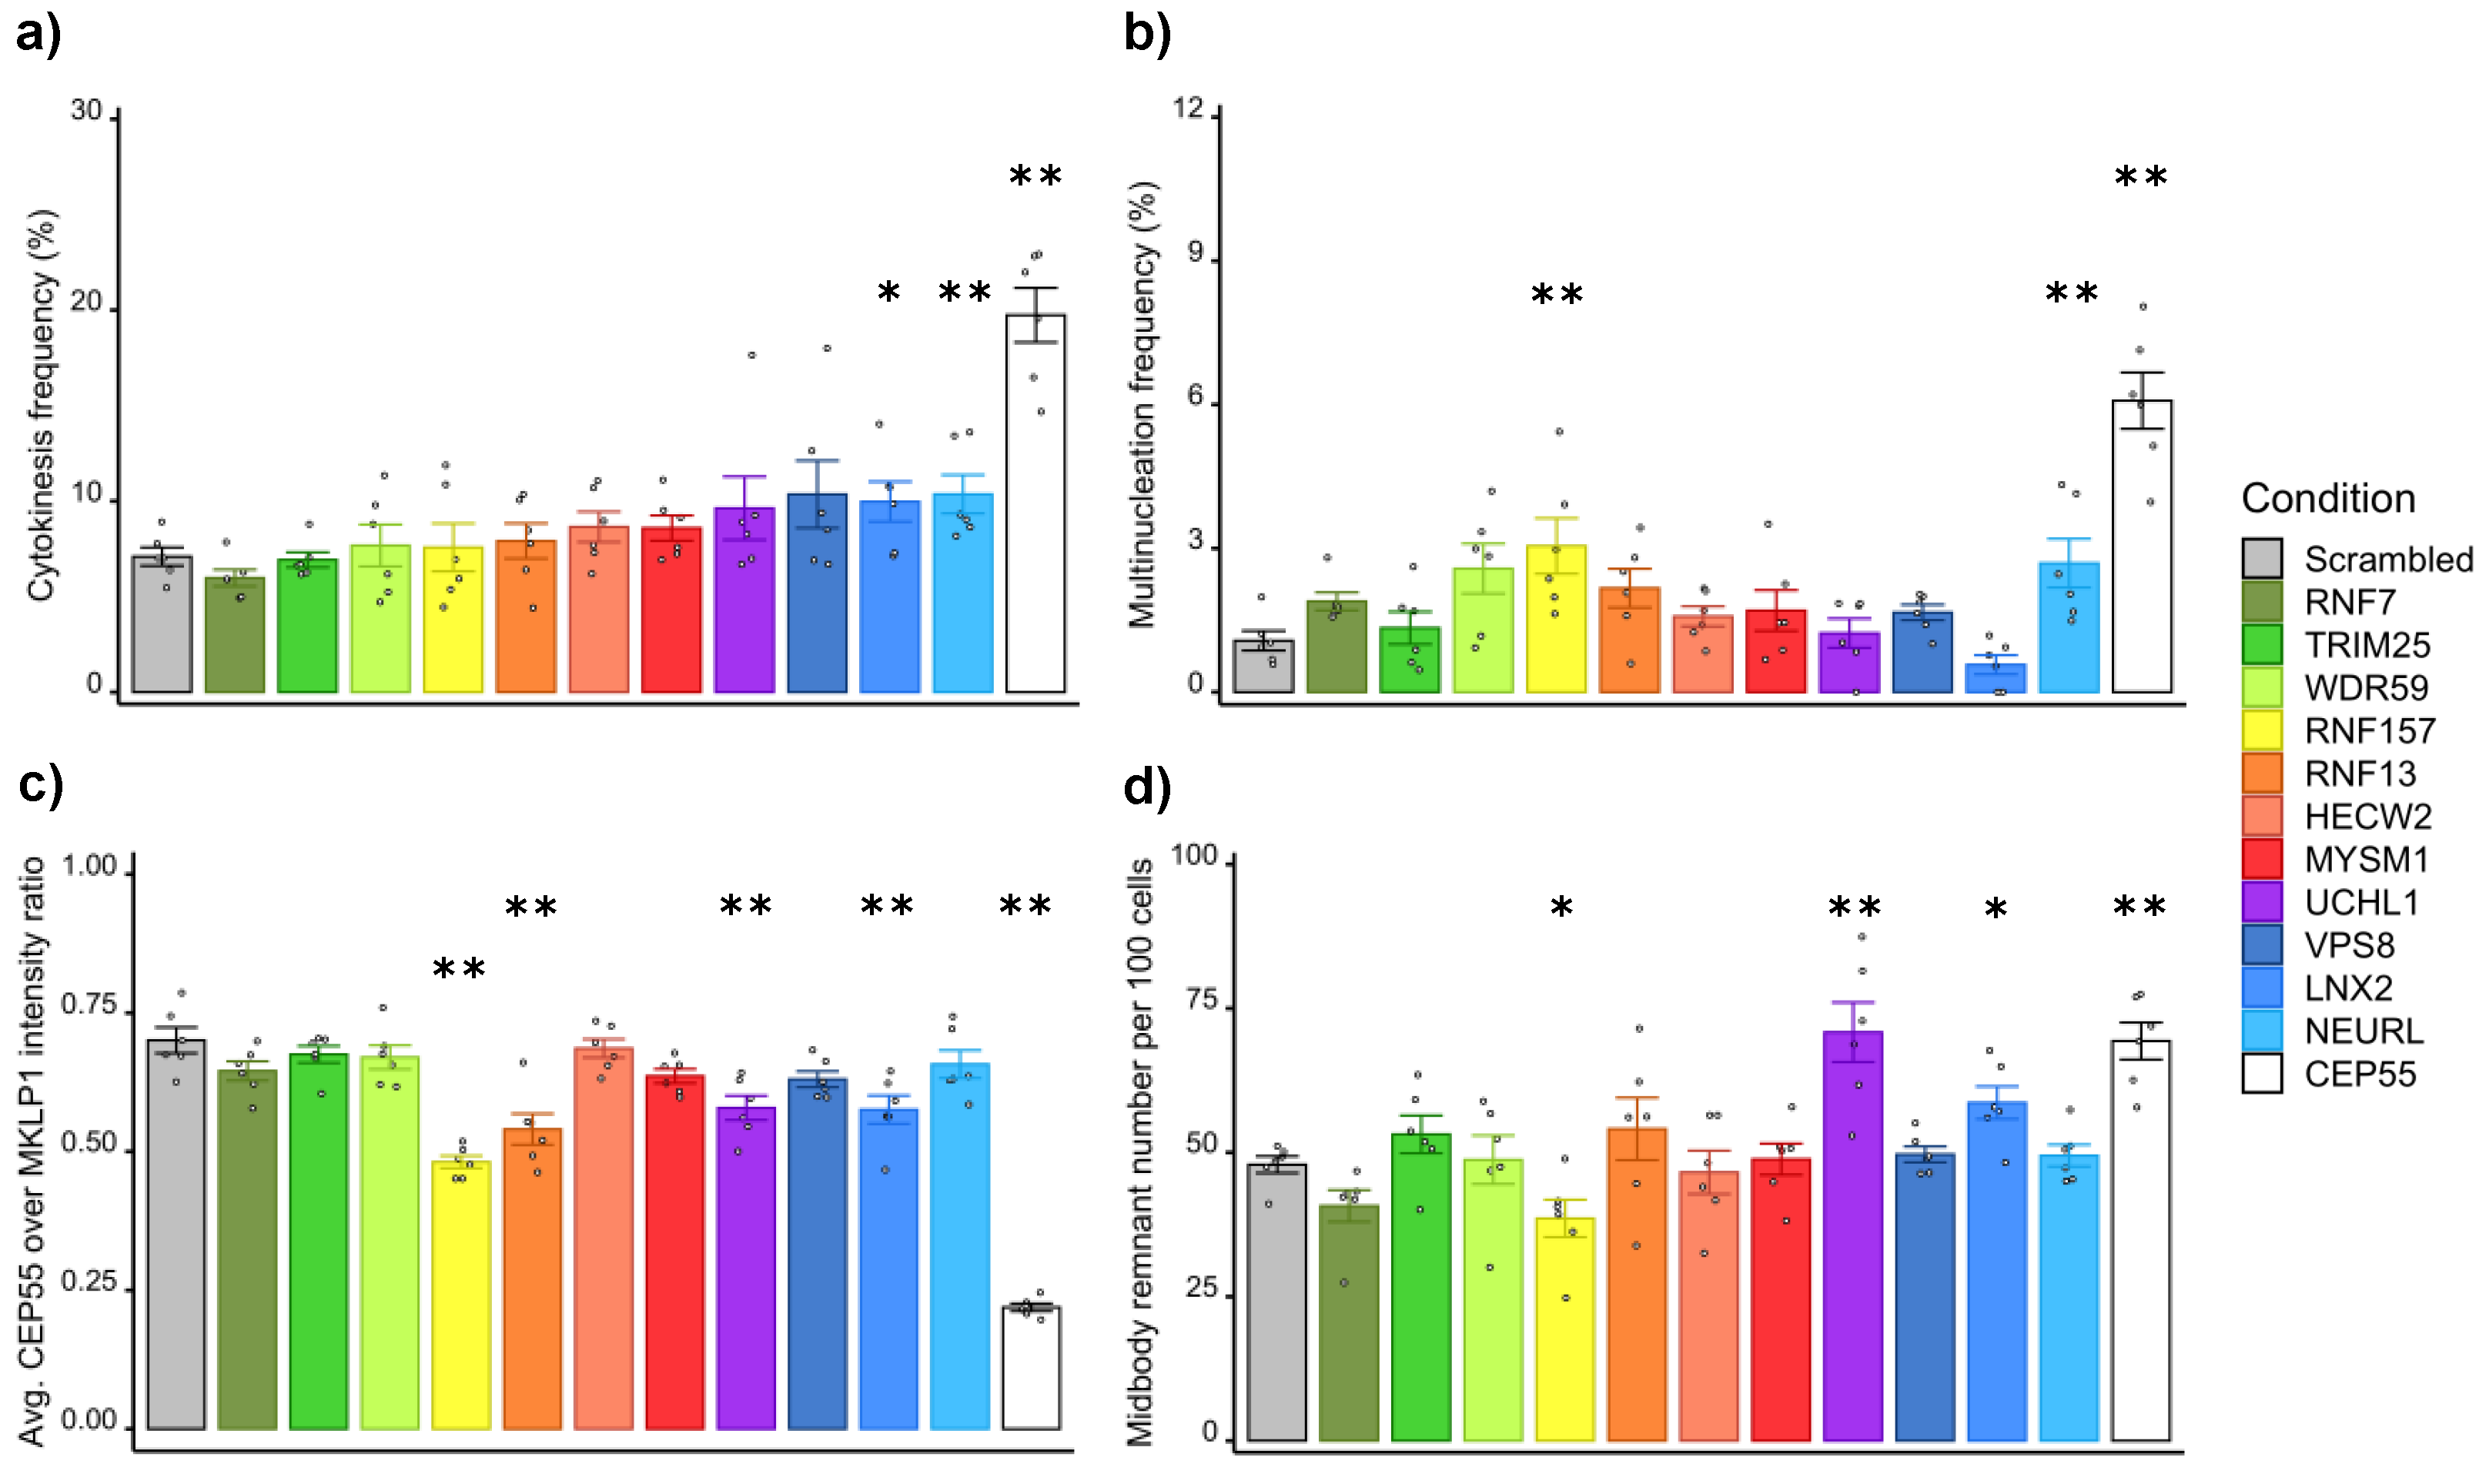
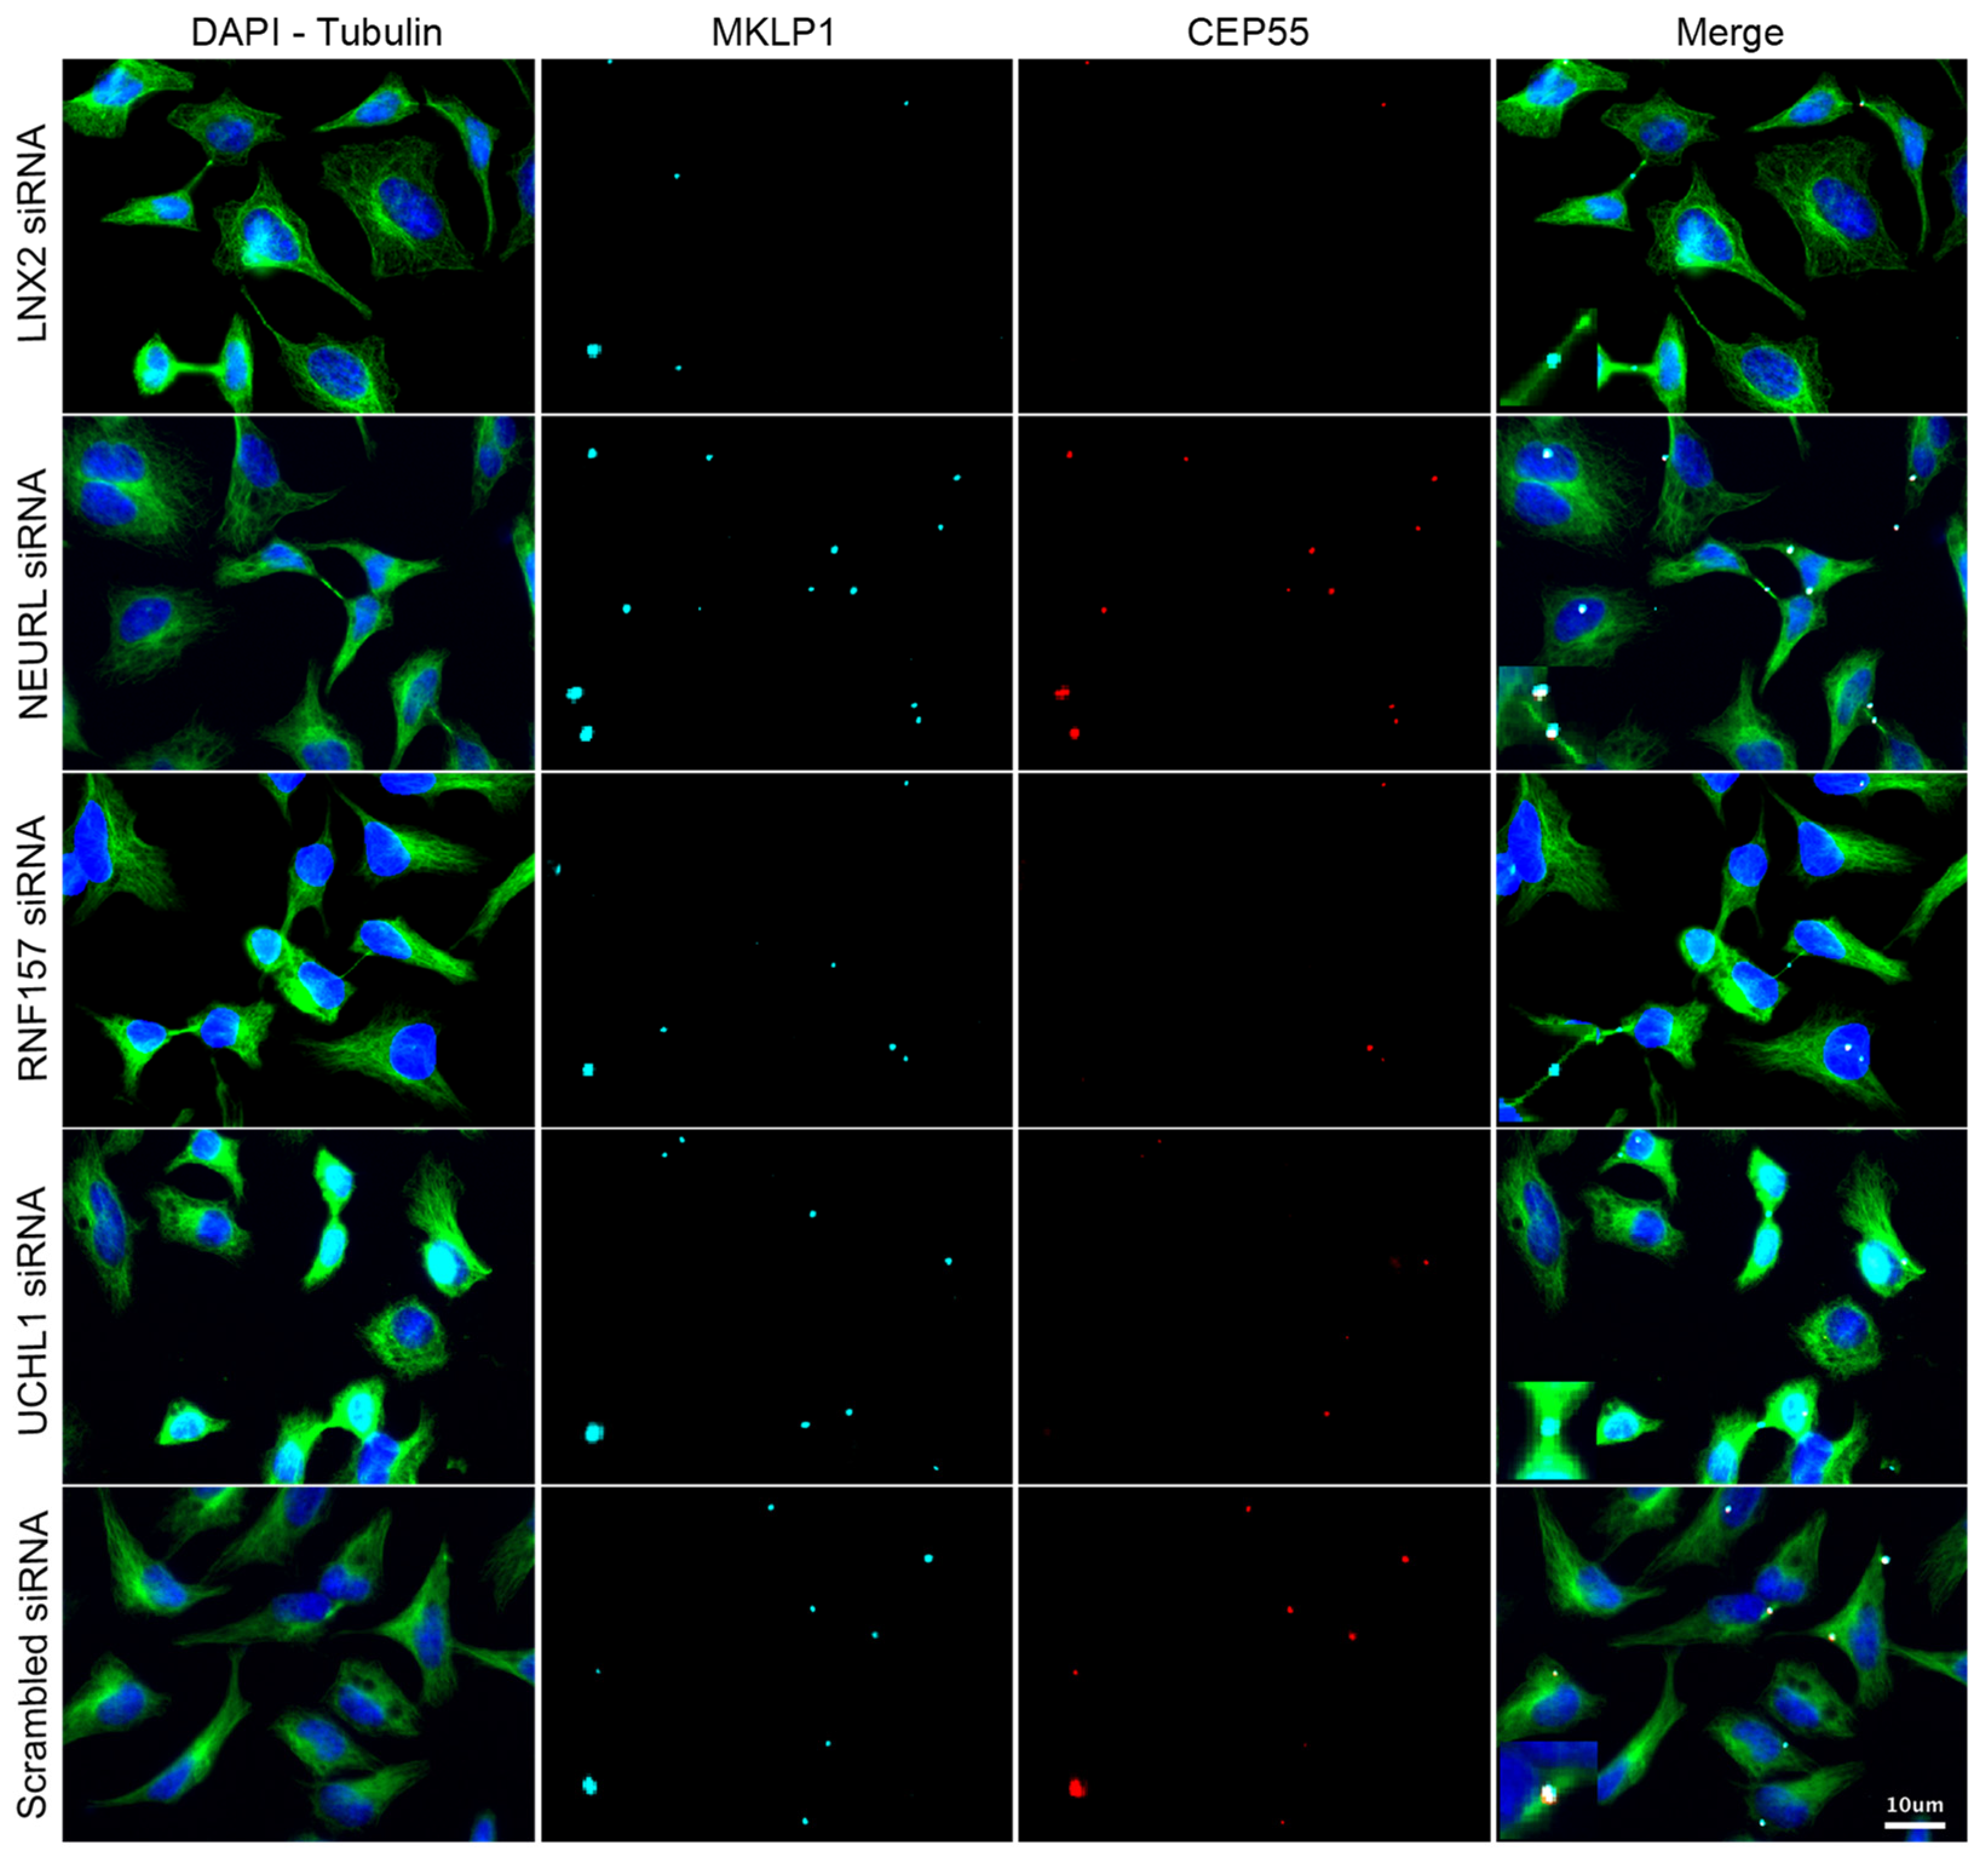
3.3. Validation of the Screening Based on CEP55-Related Phenotypes
4. Discussion
Supplementary Materials
Author Contributions
Funding
Institutional Review Board Statement
Informed Consent Statement
Data Availability Statement
Acknowledgments
Conflicts of Interest
References
- Scholey, J.M.; Brust-Mascher, I.; Mogilner, A. Cell division. Nature 2003, 422, 746–752. [Google Scholar] [CrossRef] [PubMed]
- McIntosh, J.R. Mitosis. Cold Spring Harb. Perspect. Biol. 2016, 8, a023218. [Google Scholar] [CrossRef] [PubMed] [Green Version]
- Pollard, T.D.; O’Shaughnessy, B. Molecular Mechanism of Cytokinesis. Annu. Rev. Biochem. 2019, 88, 661–689. [Google Scholar] [CrossRef] [PubMed] [Green Version]
- Roos, W.P.; Thomas, A.D.; Kaina, B. DNA damage and the balance between survival and death in cancer biology. Nat. Rev. Cancer 2016, 16, 20–33. [Google Scholar] [CrossRef] [PubMed]
- Holder, J.; Poser, E.; Barr, F.A. Getting out of mitosis: Spatial and temporal control of mitotic exit and cytokinesis by PP1 and PP2A. FEBS Lett. 2019, 593, 2908–2924. [Google Scholar] [CrossRef] [Green Version]
- Mierzwa, B.; Gerlich, D.W. Cytokinetic abscission: Molecular mechanisms and temporal control. Dev. Cell 2014, 31, 525–538. [Google Scholar] [CrossRef] [PubMed] [Green Version]
- Zhao, W.M.; Seki, A.; Fang, G. Cep55, a microtubule-bundling protein, associates with centralspindlin to control the midbody integrity and cell abscission during cytokinesis. Mol. Biol. Cell 2006, 17, 3881–3896. [Google Scholar] [CrossRef] [Green Version]
- Petsalaki, E.; Zachos, G. An ATM-Chk2-INCENP pathway activates the abscission checkpoint. J. Cell Biol. 2021, 220, e202008029. [Google Scholar] [CrossRef]
- Ettinger, A.W.; Wilsch-Bräuninger, M.; Marzesco, A.M.; Bickle, M.; Lohmann, A.; Maliga, Z.; Karbanová, J.; Corbeil, D.; Hyman, A.A.; Huttner, W.B. Proliferating versus differentiating stem and cancer cells exhibit distinct midbody-release behaviour. Nat. Commun. 2011, 2, 503. [Google Scholar] [CrossRef] [Green Version]
- Kuo, T.C.; Chen, C.T.; Baron, D.; Onder, T.T.; Loewer, S.; Almeida, S.; Weismann, C.M.; Xu, P.; Houghton, J.M.; Gao, F.B.; et al. Midbody accumulation through evasion of autophagy contributes to cellular reprogramming and tumorigenicity. Nat. Cell Biol. 2011, 13, 1214–1223. [Google Scholar] [CrossRef]
- Crowell, E.F.; Gaffuri, A.L.; Gayraud-Morel, B.; Tajbakhsh, S.; Echard, A. Engulfment of the midbody remnant after cytokinesis in mammalian cells. J. Cell Sci. 2014, 127, 3840–3851. [Google Scholar] [CrossRef] [Green Version]
- Addi, C.; Presle, A.; Frémont, S.; Cuvelier, F.; Rocancourt, M.; Milin, F.; Schmutz, S.; Chamot-Rooke, J.; Douché, T.; Duchateau, M.; et al. The Flemmingsome reveals an ESCRT-to-membrane coupling via ALIX/syntenin/syndecan-4 required for completion of cytokinesis. Nat. Commun. 2020, 11, 1941. [Google Scholar] [CrossRef] [PubMed] [Green Version]
- Fabbro, M.; Zhou, B.B.; Takahashi, M.; Sarcevic, B.; Lal, P.; Graham, M.E.; Gabrielli, B.G.; Robinson, P.J.; Nigg, E.A.; Ono, Y.; et al. Cdk1/Erk2- and Plk1-dependent phosphorylation of a centrosome protein, Cep55, is required for its recruitment to midbody and cytokinesis. Dev. Cell 2005, 9, 477–488. [Google Scholar] [CrossRef] [PubMed] [Green Version]
- van der Horst, A.; Khanna, K.K. The peptidyl-prolyl isomerase Pin1 regulates cytokinesis through Cep55. Cancer Res. 2009, 69, 6651–6659. [Google Scholar] [CrossRef] [PubMed] [Green Version]
- Said Halidi, K.N.; Fontan, E.; Boucharlat, A.; Davignon, L.; Charpentier, M.; Boullé, M.; Weil, R.; Israël, A.; Laplantine, E.; Agou, F. Two NEMO-like Ubiquitin-Binding Domains in CEP55 Differently Regulate Cytokinesis. iScience 2019, 20, 292–309. [Google Scholar] [CrossRef] [PubMed] [Green Version]
- Bastos, R.N.; Barr, F.A. Plk1 negatively regulates Cep55 recruitment to the midbody to ensure orderly abscission. J. Cell Biol. 2010, 191, 751–760. [Google Scholar] [CrossRef] [Green Version]
- Gao, K.; Zhang, Y.; Shi, Q.; Zhang, J.; Zhang, L.; Sun, H.; Jiao, D.; Zhao, X.; Tao, H.; Wei, Y.; et al. iASPP-PP1 complex is required for cytokinetic abscission by controlling CEP55 dephosphorylation. Cell Death Dis. 2018, 9, 528. [Google Scholar] [CrossRef] [Green Version]
- Gilberto, S.; Peter, M. Dynamic ubiquitin signaling in cell cycle regulation. J. Cell Biol. 2017, 216, 2259–2271. [Google Scholar] [CrossRef] [Green Version]
- Basant, A.; Glotzer, M. Spatiotemporal Regulation of RhoA during Cytokinesis. Curr. Biol. 2018, 28, R570–R580. [Google Scholar] [CrossRef] [Green Version]
- Mukai, A.; Mizuno, E.; Kobayashi, K.; Matsumoto, M.; Nakayama, K.I.; Kitamura, N.; Komada, M. Dynamic regulation of ubiquitylation and deubiquitylation at the central spindle during cytokinesis. J. Cell Sci. 2008, 121, 1325–1333. [Google Scholar] [CrossRef]
- Pohl, C.; Jentsch, S. Final stages of cytokinesis and midbody ring formation are controlled by BRUCE. Cell 2008, 132, 832–845. [Google Scholar] [CrossRef] [PubMed] [Green Version]
- Oh, E.; Akopian, D.; Rape, M. Principles of Ubiquitin-Dependent Signaling. Annu. Rev. Cell Dev. Biol. 2018, 34, 137–162. [Google Scholar] [CrossRef] [PubMed]
- Komander, D.; Rape, M. The ubiquitin code. Annu. Rev. Biochem. 2012, 81, 203–229. [Google Scholar] [CrossRef] [Green Version]
- Pickart, C.M. Mechanisms underlying ubiquitination. Annu. Rev. Biochem. 2001, 70, 503–533. [Google Scholar] [CrossRef] [PubMed]
- Ciechanover, A.; Ben-Saadon, R. N-terminal ubiquitination: More protein substrates join in. Trends Cell Biol. 2004, 14, 103–106. [Google Scholar] [CrossRef] [PubMed]
- Mevissen, T.E.T.; Komander, D. Mechanisms of Deubiquitinase Specificity and Regulation. Annu. Rev. Biochem. 2017, 86, 159–192. [Google Scholar] [CrossRef] [Green Version]
- Chahwan, R.; Gravel, S.; Matsusaka, T.; Jackson, S.P. Dma/RNF8 proteins are evolutionarily conserved E3 ubiquitin ligases that target septins. Cell Cycle 2013, 12, 1000–1008. [Google Scholar] [CrossRef] [Green Version]
- Isakson, P.; Lystad, A.H.; Breen, K.; Koster, G.; Stenmark, H.; Simonsen, A. TRAF6 mediates ubiquitination of KIF23/MKLP1 and is required for midbody ring degradation by selective autophagy. Autophagy 2013, 9, 1955–1964. [Google Scholar] [CrossRef] [Green Version]
- Wickström, S.A.; Masoumi, K.C.; Khochbin, S.; Fässler, R.; Massoumi, R. CYLD negatively regulates cell-cycle progression by inactivating HDAC6 and increasing the levels of acetylated tubulin. Embo. J. 2010, 29, 131–144. [Google Scholar] [CrossRef] [Green Version]
- Magliozzi, R.; Carrero, Z.I.; Low, T.Y.; Yuniati, L.; Valdes-Quezada, C.; Kruiswijk, F.; van Wijk, K.; Heck, A.J.R.; Jackson, C.L.; Guardavaccaro, D. Inheritance of the Golgi Apparatus and Cytokinesis Are Controlled by Degradation of GBF1. Cell Rep. 2018, 23, 3381–3391 e3384. [Google Scholar] [CrossRef]
- Zanchetta, M.E.; Meroni, G. Emerging Roles of the TRIM E3 Ubiquitin Ligases MID1 and MID2 in Cytokinesis. Front. Physiol. 2019, 10, 274. [Google Scholar] [CrossRef] [PubMed] [Green Version]
- Georges, A.; Coyaud, E.; Marcon, E.; Greenblatt, J.; Raught, B.; Frappier, L. USP7 Regulates Cytokinesis through FBXO38 and KIF20B. Sci. Rep. 2019, 9, 2724. [Google Scholar] [CrossRef] [Green Version]
- Go, C.D.; Knight, J.D.R.; Rajasekharan, A.; Rathod, B.; Hesketh, G.G.; Abe, K.T.; Youn, J.-Y.; Samavarchi-Tehrani, P.; Zhang, H.; Zhu, L.Y.; et al. A proximity biotinylation map of a human cell. BioRxiv 2019, 595, 120–124. [Google Scholar] [CrossRef] [Green Version]
- Karess, R.E.; Chang, X.J.; Edwards, K.A.; Kulkarni, S.; Aguilera, I.; Kiehart, D.P. The regulatory light chain of nonmuscle myosin is encoded by spaghetti-squash, a gene required for cytokinesis in Drosophila. Cell 1991, 65, 1177–1189. [Google Scholar] [CrossRef] [PubMed]
- Janisch, K.M.; Vock, V.M.; Fleming, M.S.; Shrestha, A.; Grimsley-Myers, C.M.; Rasoul, B.A.; Neale, S.A.; Cupp, T.D.; Kinchen, J.M.; Liem, K.F., Jr.; et al. The vertebrate-specific Kinesin-6, Kif20b, is required for normal cytokinesis of polarized cortical stem cells and cerebral cortex size. Development 2013, 140, 4672–4682. [Google Scholar] [CrossRef] [PubMed] [Green Version]
- Gregory, S.L.; Shandala, T.; O’Keefe, L.; Jones, L.; Murray, M.J.; Saint, R. A Drosophila overexpression screen for modifiers of Rho signalling in cytokinesis. Fly 2007, 1, 13–22. [Google Scholar] [CrossRef] [Green Version]
- Liu, Y.; Ge, Q.; Chan, B.; Liu, H.; Singh, S.R.; Manley, J.; Lee, J.; Weideman, A.M.; Hou, G.; Hou, S.X. Whole-animal genome-wide RNAi screen identifies networks regulating male germline stem cells in Drosophila. Nat. Commun. 2016, 7, 12149. [Google Scholar] [CrossRef] [PubMed] [Green Version]
- Echard, A.; Hickson, G.R.; Foley, E.; O’Farrell, P.H. Terminal cytokinesis events uncovered after an RNAi screen. Curr. Biol. 2004, 14, 1685–1693. [Google Scholar] [CrossRef] [Green Version]
- Somma, M.P.; Fasulo, B.; Cenci, G.; Cundari, E.; Gatti, M. Molecular dissection of cytokinesis by RNA interference in Drosophila cultured cells. Mol. Biol. Cell 2002, 13, 2448–2460. [Google Scholar] [CrossRef] [Green Version]
- Eggert, U.S.; Kiger, A.A.; Richter, C.; Perlman, Z.E.; Perrimon, N.; Mitchison, T.J.; Field, C.M. Parallel chemical genetic and genome-wide RNAi screens identify cytokinesis inhibitors and targets. PLoS Biol. 2004, 2, e379. [Google Scholar] [CrossRef]
- Pollard, T.D. Functional genomics of cell morphology using RNA interference: Pick your style, broad or deep. J. Biol. 2003, 2, 25. [Google Scholar] [CrossRef] [PubMed] [Green Version]
- Kiger, A.A.; Baum, B.; Jones, S.; Jones, M.R.; Coulson, A.; Echeverri, C.; Perrimon, N. A functional genomic analysis of cell morphology using RNA interference. J. Biol. 2003, 2, 27. [Google Scholar] [CrossRef] [PubMed] [Green Version]
- Björklund, M.; Taipale, M.; Varjosalo, M.; Saharinen, J.; Lahdenperä, J.; Taipale, J. Identification of pathways regulating cell size and cell-cycle progression by RNAi. Nature 2006, 439, 1009–1013. [Google Scholar] [CrossRef] [PubMed]
- Neggers, J.E.; Paolella, B.R.; Asfaw, A.; Rothberg, M.V.; Skipper, T.A.; Yang, A.; Kalekar, R.L.; Krill-Burger, J.M.; Dharia, N.V.; Kugener, G.; et al. Synthetic Lethal Interaction between the ESCRT Paralog Enzymes VPS4A and VPS4B in Cancers Harboring Loss of Chromosome 18q or 16q. Cell Rep. 2020, 33, 108493. [Google Scholar] [CrossRef] [PubMed]
- Tedeschi, A.; Almagro, J.; Renshaw, M.J.; Messal, H.A.; Behrens, A.; Petronczki, M. Cep55 promotes cytokinesis of neural progenitors but is dispensable for most mammalian cell divisions. Nat. Commun. 2020, 11, 1746. [Google Scholar] [CrossRef] [PubMed] [Green Version]
- Morita, E.; Sandrin, V.; Chung, H.Y.; Morham, S.G.; Gygi, S.P.; Rodesch, C.K.; Sundquist, W.I. Human ESCRT and ALIX proteins interact with proteins of the midbody and function in cytokinesis. Embo. J. 2007, 26, 4215–4227. [Google Scholar] [CrossRef] [Green Version]
- Iwamori, T.; Iwamori, N.; Ma, L.; Edson, M.A.; Greenbaum, M.P.; Matzuk, M.M. TEX14 interacts with CEP55 to block cell abscission. Mol. Cell Biol. 2010, 30, 2280–2292. [Google Scholar] [CrossRef] [Green Version]
- Christ, L.; Wenzel, E.M.; Liestøl, K.; Raiborg, C.; Campsteijn, C.; Stenmark, H. ALIX and ESCRT-I/II function as parallel ESCRT-III recruiters in cytokinetic abscission. J. Cell Biol. 2016, 212, 499–513. [Google Scholar] [CrossRef] [Green Version]
- Andersen, C.L.; Jensen, J.L.; Ørntoft, T.F. Normalization of real-time quantitative reverse transcription-PCR data: A model-based variance estimation approach to identify genes suited for normalization, applied to bladder and colon cancer data sets. Cancer Res. 2004, 64, 5245–5250. [Google Scholar] [CrossRef] [Green Version]
- Pfaffl, M.W. A new mathematical model for relative quantification in real-time RT-PCR. Nucleic Acids Res. 2001, 29, e45. [Google Scholar] [CrossRef]
- de Chaumont, F.; Dallongeville, S.; Chenouard, N.; Hervé, N.; Pop, S.; Provoost, T.; Meas-Yedid, V.; Pankajakshan, P.; Lecomte, T.; Le Montagner, Y.; et al. Icy: An open bioimage informatics platform for extended reproducible research. Nat. Methods 2012, 9, 690–696. [Google Scholar] [CrossRef] [PubMed]
- Dufour, A.C.; Meas-Yedid, V.; Grassart, A.; Olivo-Marin, J.-C. Automated quantification of cell endocytosis using active contours and wavelets. In Proceedings of the 19th International Conference on Pattern Recognition, Tampa, FL, USA, 8–11 December 2008; pp. 1–4. [Google Scholar]
- Manich, M.; Boquet-Pujadas, A.; Dallongeville, S.; Guillen, N.; Olivo-Marin, J.-C. A Protocol to Quantify Cellular Morphodynamics: From Cell Labelling to Automatic Image Analysis. In Proceedings of the Eukaryome Impact on Human Intestine Homeostasis and Mucosal Immunology; Springer: Berlin/Heidelberg, Germany, 2020; pp. 351–367. [Google Scholar]
- Goliand, I.; Nachmias, D.; Gershony, O.; Elia, N. Inhibition of ESCRT-II-CHMP6 interactions impedes cytokinetic abscission and leads to cell death. Mol. Biol. Cell 2014, 25, 3740–3748. [Google Scholar] [CrossRef] [PubMed] [Green Version]
- Konstantinidis, D.G.; Giger, K.M.; Risinger, M.; Pushkaran, S.; Zhou, P.; Dexheimer, P.; Yerneni, S.; Andreassen, P.; Klingmüller, U.; Palis, J.; et al. Cytokinesis failure in RhoA-deficient mouse erythroblasts involves actomyosin and midbody dysregulation and triggers p53 activation. Blood 2015, 126, 1473–1482. [Google Scholar] [CrossRef] [PubMed] [Green Version]
- Weinmaster, G.; Fischer, J.A. Notch ligand ubiquitylation: What is it good for? Dev. Cell 2011, 21, 134–144. [Google Scholar] [CrossRef] [PubMed] [Green Version]
- Koutelou, E.; Sato, S.; Tomomori-Sato, C.; Florens, L.; Swanson, S.K.; Washburn, M.P.; Kokkinaki, M.; Conaway, R.C.; Conaway, J.W.; Moschonas, N.K. Neuralized-like 1 (Neurl1) targeted to the plasma membrane by N-myristoylation regulates the Notch ligand Jagged1. J. Biol. Chem. 2008, 283, 3846–3853. [Google Scholar] [CrossRef] [Green Version]
- Nayak, D.; Sivaraman, J. Structural basis for the indispensable role of a unique zinc finger motif in LNX2 ubiquitination. Oncotarget 2015, 6, 34342–34357. [Google Scholar] [CrossRef] [Green Version]
- Hong, J.; Won, M.; Ro, H. The Molecular and Pathophysiological Functions of Members of the LNX/PDZRN E3 Ubiquitin Ligase Family. Molecules 2020, 25, 5938. [Google Scholar] [CrossRef]
- Sunchu, B.; Cabernard, C. Principles and mechanisms of asymmetric cell division. Development 2020, 147, dev167650. [Google Scholar] [CrossRef]
- Trylinski, M.; Schweisguth, F. Activation of Arp2/3 by WASp Is Essential for the Endocytosis of Delta Only during Cytokinesis in Drosophila. Cell Rep. 2019, 28, 1–10.e13. [Google Scholar] [CrossRef] [Green Version]
- Liu, S.; Boulianne, G.L. The NHR domains of Neuralized and related proteins: Beyond Notch signalling. Cell Signal. 2017, 29, 62–68. [Google Scholar] [CrossRef]
- Young, P.W. LNX1/LNX2 proteins: Functions in neuronal signalling and beyond. Neuronal. Signal. 2018, 2, Ns20170191. [Google Scholar] [CrossRef]
- Flynn, M.; Saha, O.; Young, P. Molecular evolution of the LNX gene family. BMC Evol. Biol. 2011, 11, 235. [Google Scholar] [CrossRef] [PubMed] [Green Version]
- Lynn, B.D.; Li, X.; Hormuzdi, S.G.; Griffiths, E.K.; McGlade, C.J.; Nagy, J.I. E3 ubiquitin ligases LNX1 and LNX2 localize at neuronal gap junctions formed by connexin36 in rodent brain and molecularly interact with connexin36. Eur. J. Neurosci. 2018, 48, 3062–3081. [Google Scholar] [CrossRef] [PubMed] [Green Version]
- Lenihan, J.A.; Saha, O.; Young, P.W. Proteomic analysis reveals novel ligands and substrates for LNX1 E3 ubiquitin ligase. PLoS ONE 2017, 12, e0187352. [Google Scholar] [CrossRef] [PubMed] [Green Version]
- Gruneberg, U.; Neef, R.; Li, X.; Chan, E.H.; Chalamalasetty, R.B.; Nigg, E.A.; Barr, F.A. KIF14 and citron kinase act together to promote efficient cytokinesis. J. Cell Biol. 2006, 172, 363–372. [Google Scholar] [CrossRef] [PubMed] [Green Version]
- Chen, R.H.; Chen, Y.H.; Huang, T.Y. Ubiquitin-mediated regulation of autophagy. J. Biomed. Sci. 2019, 26, 80. [Google Scholar] [CrossRef]
- Yan, C.; Huo, H.; Yang, C.; Zhang, T.; Chu, Y.; Liu, Y. Ubiquitin C-Terminal Hydrolase L1 regulates autophagy by inhibiting autophagosome formation through its deubiquitinating enzyme activity. Biochem. Biophys. Res. Commun. 2018, 497, 726–733. [Google Scholar] [CrossRef] [PubMed]
- Matz, A.; Lee, S.J.; Schwedhelm-Domeyer, N.; Zanini, D.; Holubowska, A.; Kannan, M.; Farnworth, M.; Jahn, O.; Göpfert, M.C.; Stegmüller, J. Regulation of neuronal survival and morphology by the E3 ubiquitin ligase RNF157. Cell Death Differ. 2015, 22, 626–642. [Google Scholar] [CrossRef] [Green Version]
- Dogan, T.; Gnad, F.; Chan, J.; Phu, L.; Young, A.; Chen, M.J.; Doll, S.; Stokes, M.P.; Belvin, M.; Friedman, L.S.; et al. Role of the E3 ubiquitin ligase RNF157 as a novel downstream effector linking PI3K and MAPK signaling pathways to the cell cycle. J. Biol. Chem. 2017, 292, 14311–14324. [Google Scholar] [CrossRef] [Green Version]
- Jeffery, J.; Neyt, C.; Moore, W.; Paterson, S.; Bower, N.I.; Chenevix-Trench, G.; Verkade, H.; Hogan, B.M.; Khanna, K.K. Cep55 regulates embryonic growth and development by promoting Akt stability in zebrafish. FASEB J. 2015, 29, 1999–2009. [Google Scholar] [CrossRef]
- Frosk, P.; Arts, H.H.; Philippe, J.; Gunn, C.S.; Brown, E.L.; Chodirker, B.; Simard, L.; Majewski, J.; Fahiminiya, S.; Russell, C.; et al. A truncating mutation in CEP55 is the likely cause of MARCH, a novel syndrome affecting neuronal mitosis. J. Med. Genet. 2017, 54, 490–501. [Google Scholar] [CrossRef] [PubMed]


Publisher’s Note: MDPI stays neutral with regard to jurisdictional claims in published maps and institutional affiliations. |
© 2022 by the authors. Licensee MDPI, Basel, Switzerland. This article is an open access article distributed under the terms and conditions of the Creative Commons Attribution (CC BY) license (https://creativecommons.org/licenses/by/4.0/).
Share and Cite
Boullé, M.; Davignon, L.; Nabhane Saïd Halidi, K.; Guez, S.; Giraud, E.; Hollenstein, M.; Agou, F. High-Content RNAi Phenotypic Screening Unveils the Involvement of Human Ubiquitin-Related Enzymes in Late Cytokinesis. Cells 2022, 11, 3862. https://doi.org/10.3390/cells11233862
Boullé M, Davignon L, Nabhane Saïd Halidi K, Guez S, Giraud E, Hollenstein M, Agou F. High-Content RNAi Phenotypic Screening Unveils the Involvement of Human Ubiquitin-Related Enzymes in Late Cytokinesis. Cells. 2022; 11(23):3862. https://doi.org/10.3390/cells11233862
Chicago/Turabian StyleBoullé, Mikaël, Laurianne Davignon, Keïs Nabhane Saïd Halidi, Salomé Guez, Emilie Giraud, Marcel Hollenstein, and Fabrice Agou. 2022. "High-Content RNAi Phenotypic Screening Unveils the Involvement of Human Ubiquitin-Related Enzymes in Late Cytokinesis" Cells 11, no. 23: 3862. https://doi.org/10.3390/cells11233862