
Characterization of Three-Dimensional Trophoblast Spheroids: An Alternative Model to Study the Physiological Properties of the Placental Unit

 , , and
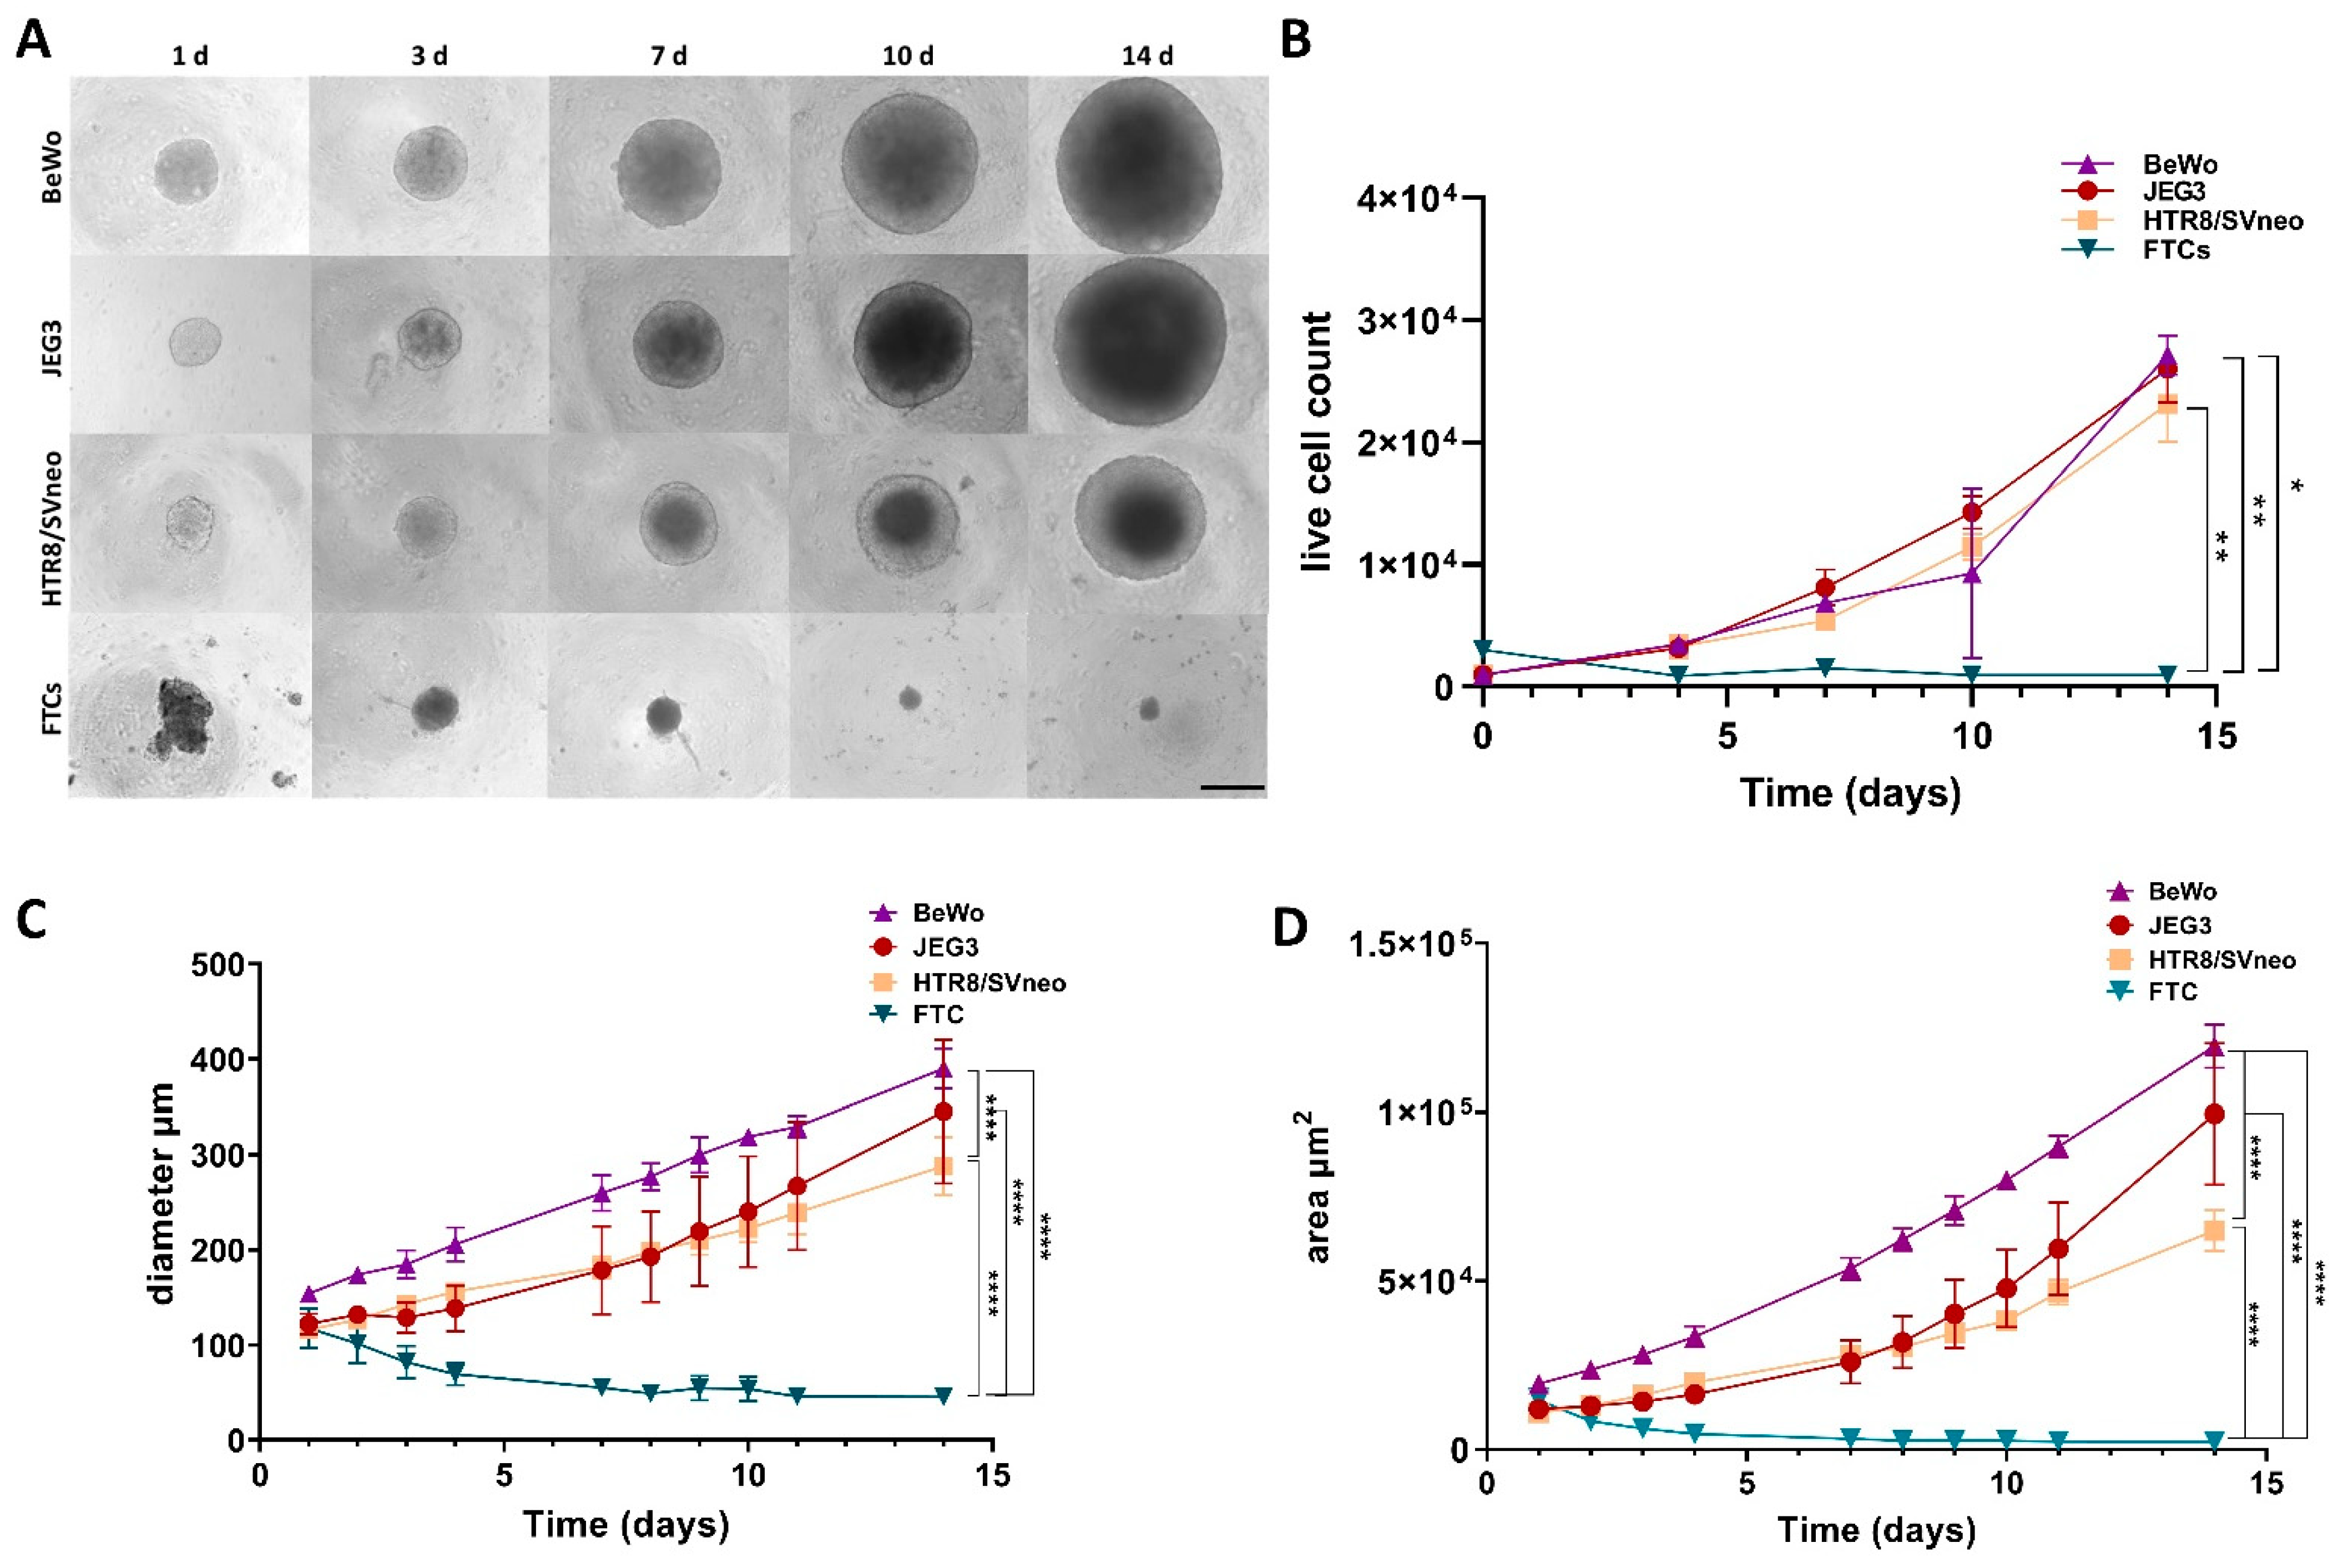
Abstract
:1. Introduction
2. Materials and Methods
2.1. Sampling of Primary Fetal Trophoblast Cells and Ethical Approval
2.2. Cell Lines and Generation of Trophoblast Spheroids
2.3. Cell Counting Assay
2.4. Viability Assay
2.5. 3D Migration Assay
2.6. 3D Invasion Assay
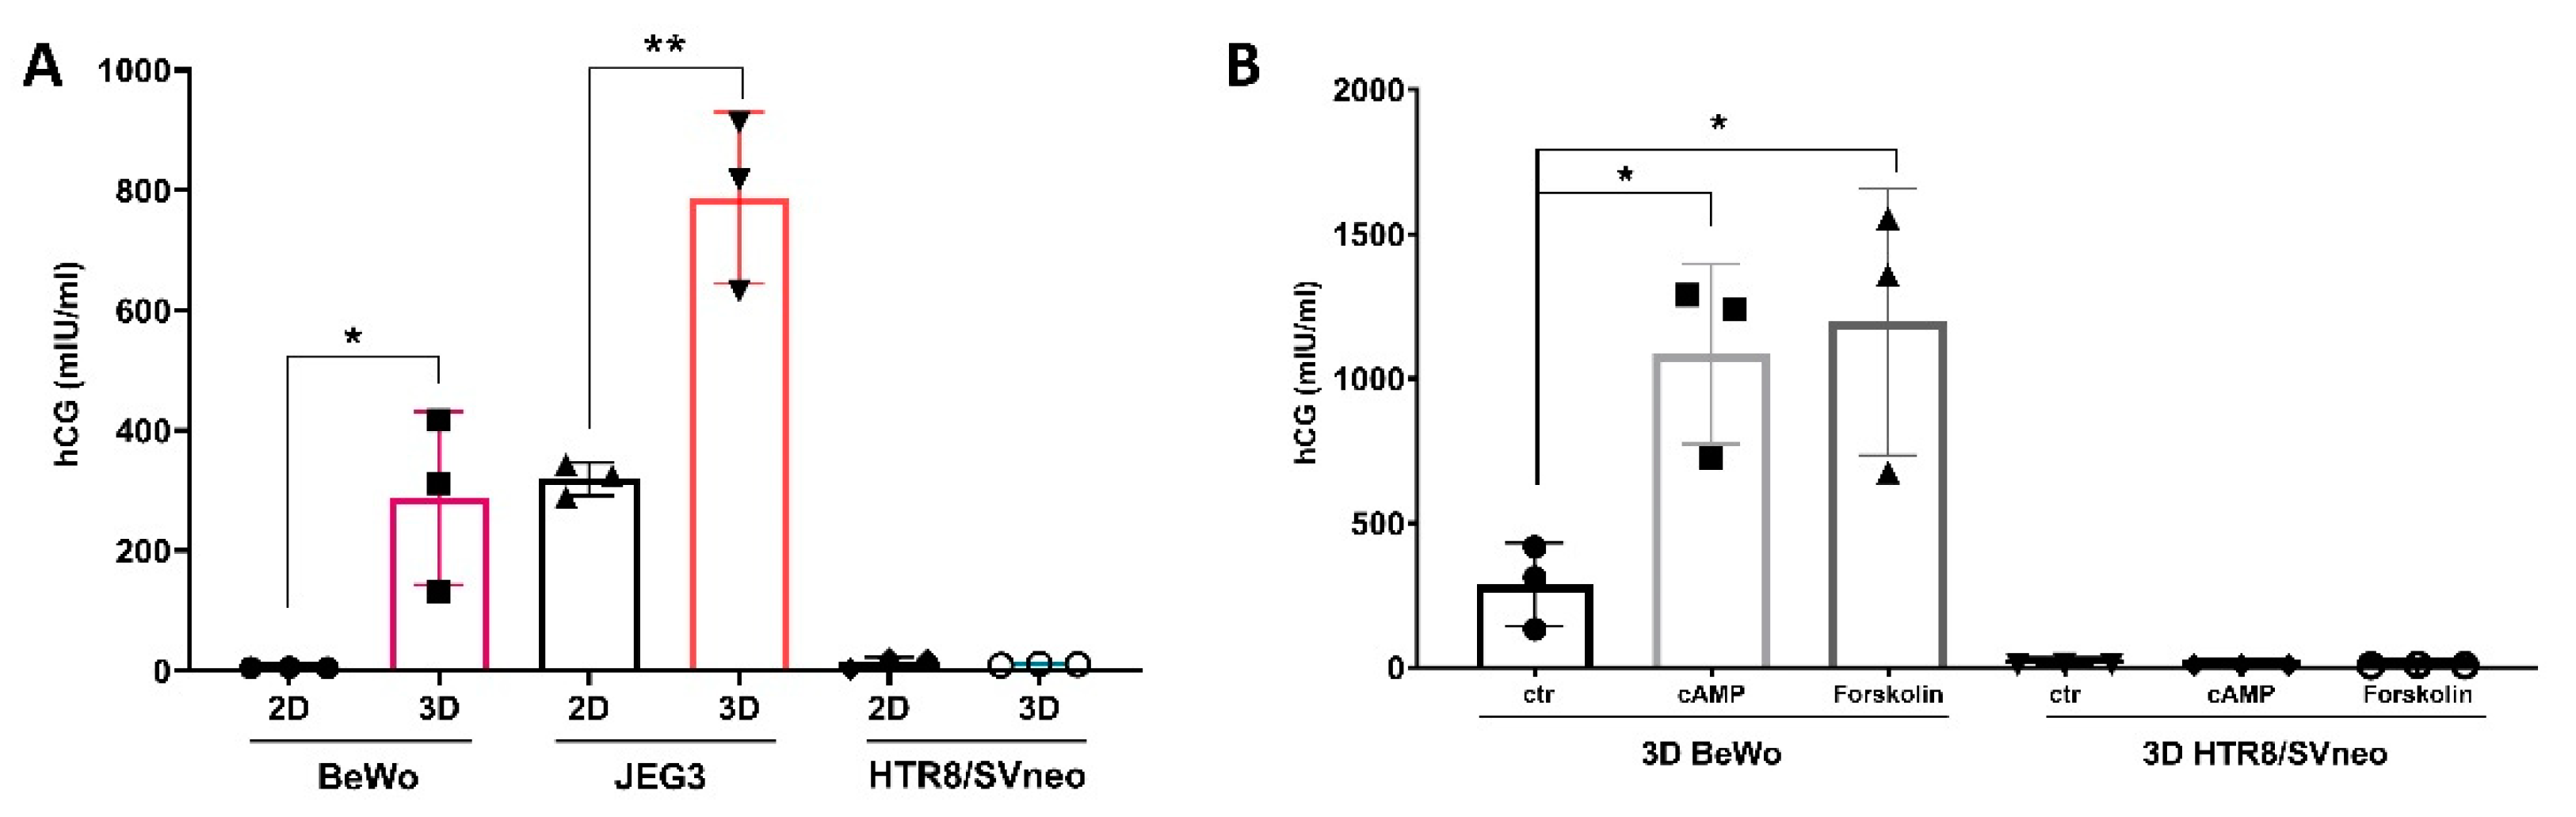
2.7. β-HCG Quantification
2.8. RT-PCR
2.9. Statistical Analysis
3. Results
3.1. Growth Rate Follow-Up of 3D Trophoblast Cell Lines
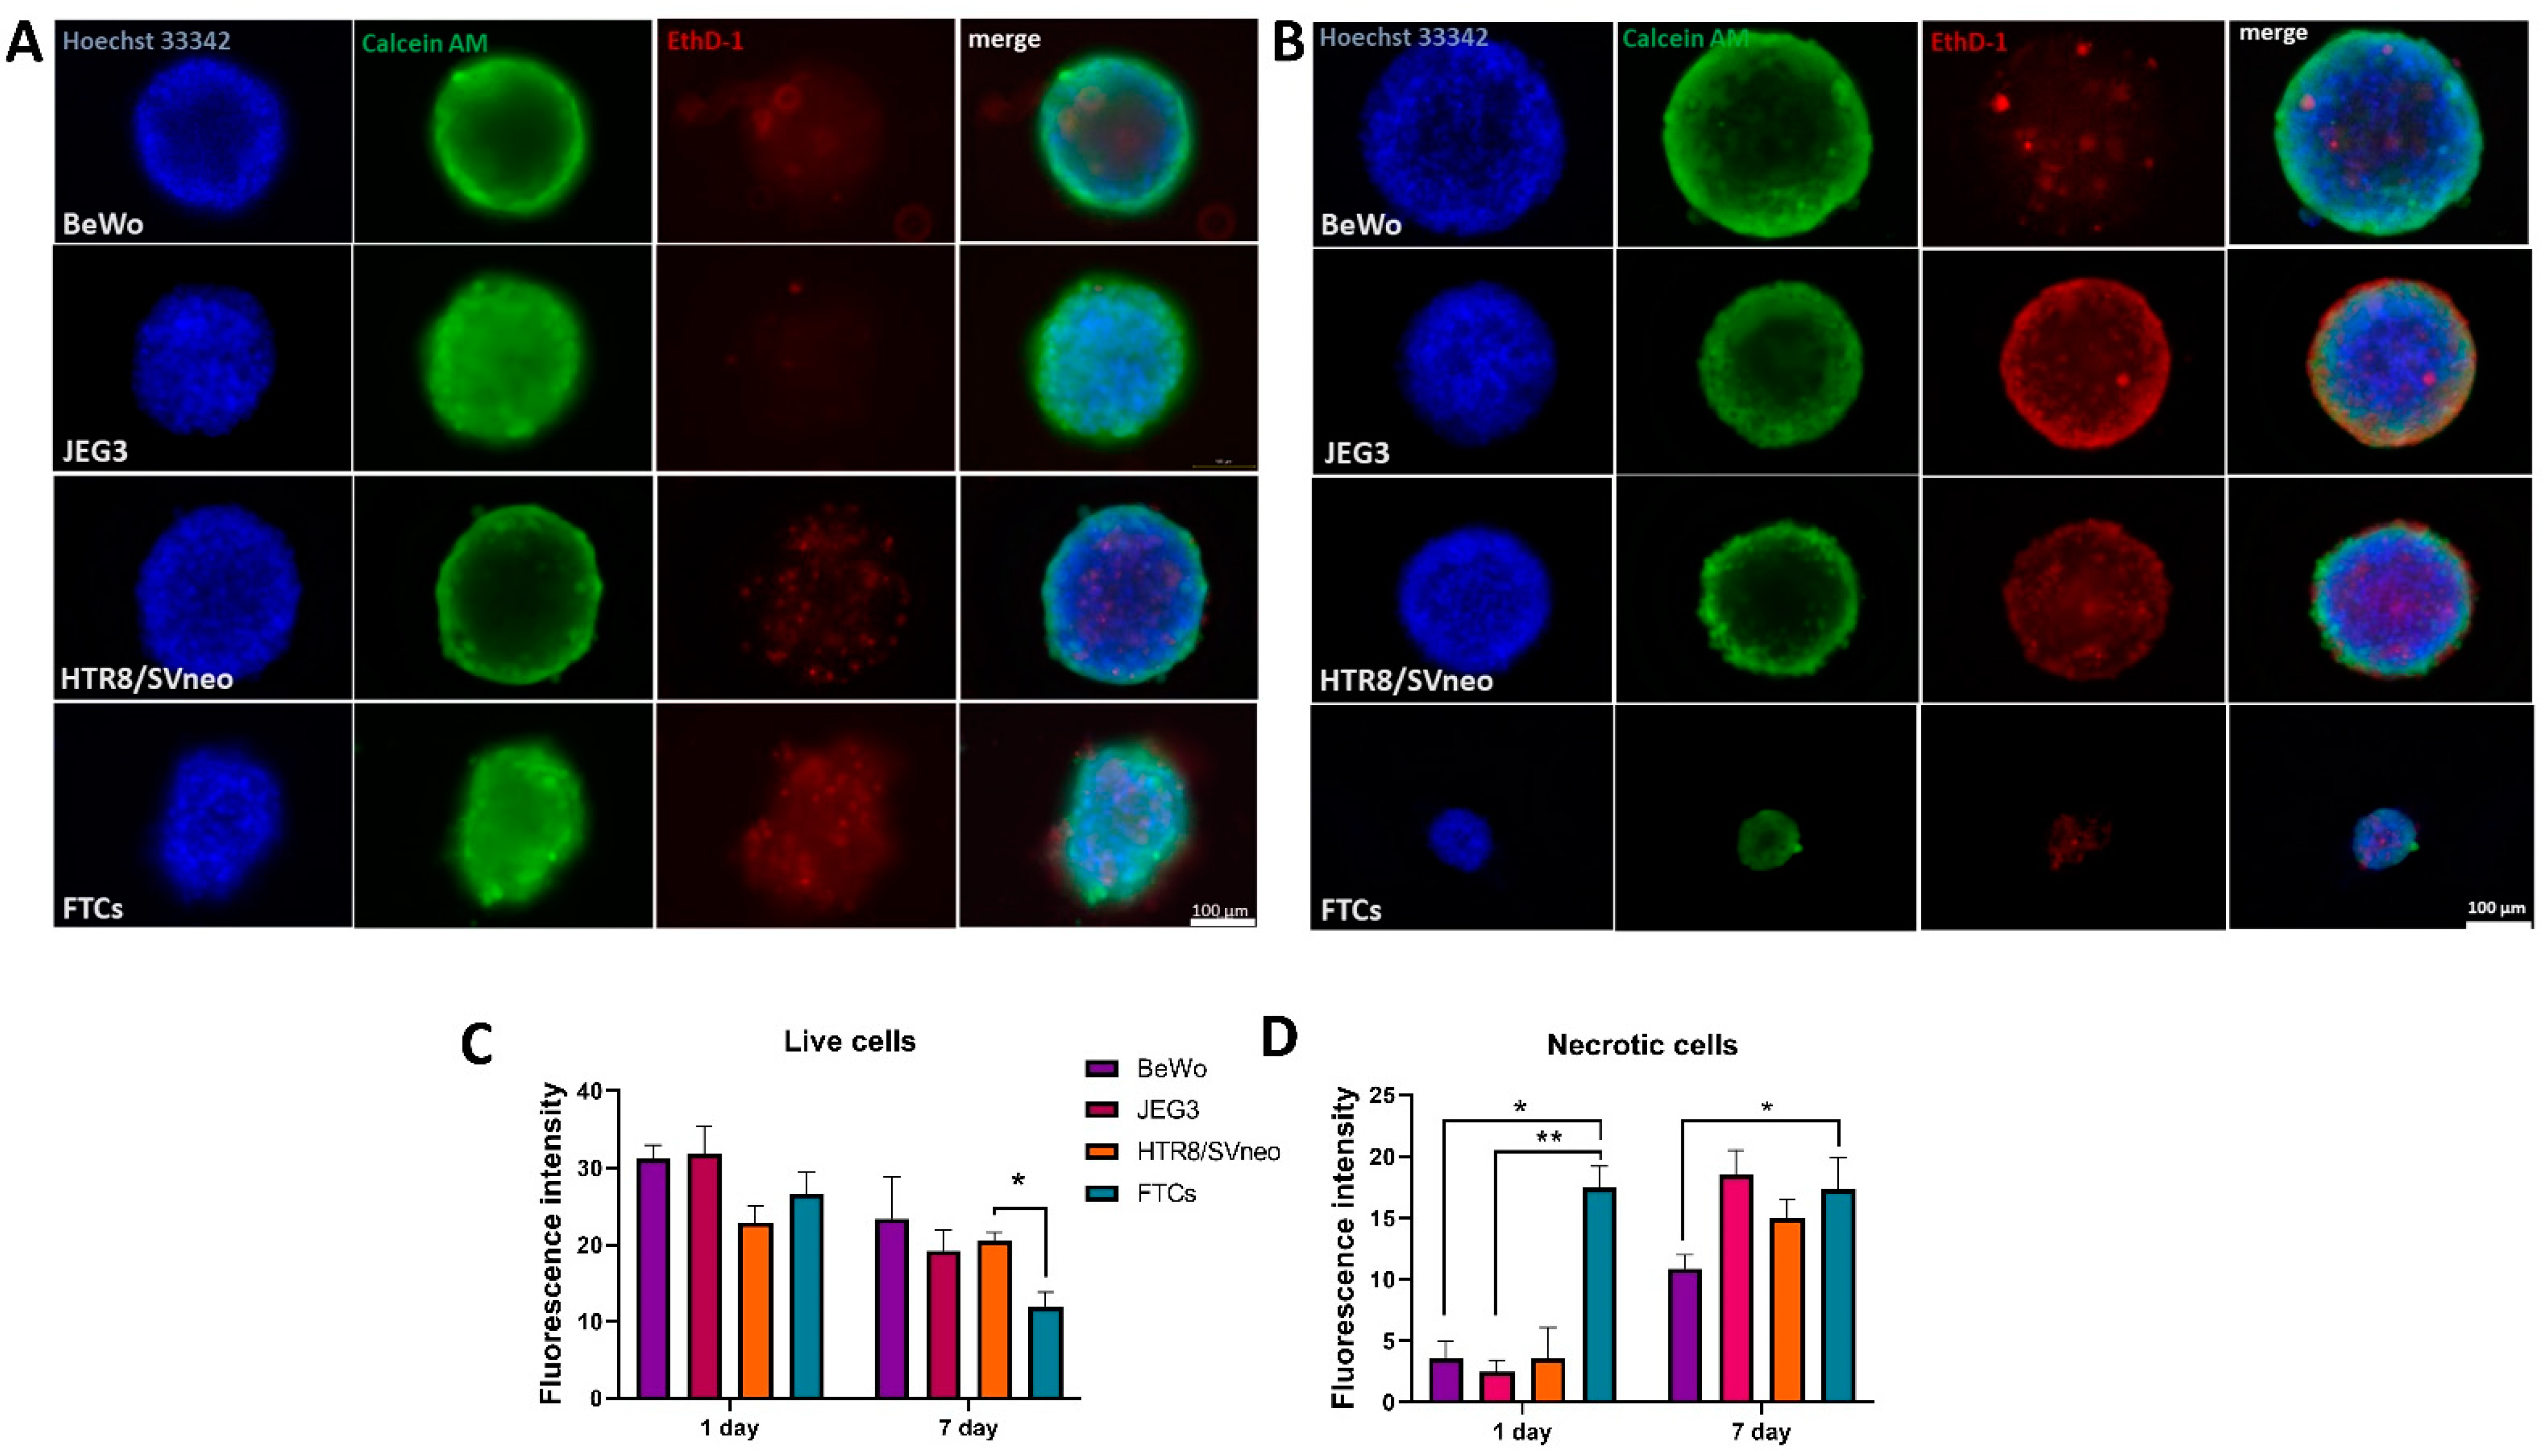
3.2. Viability Evaluation of 3D Trophoblast Cell Lines
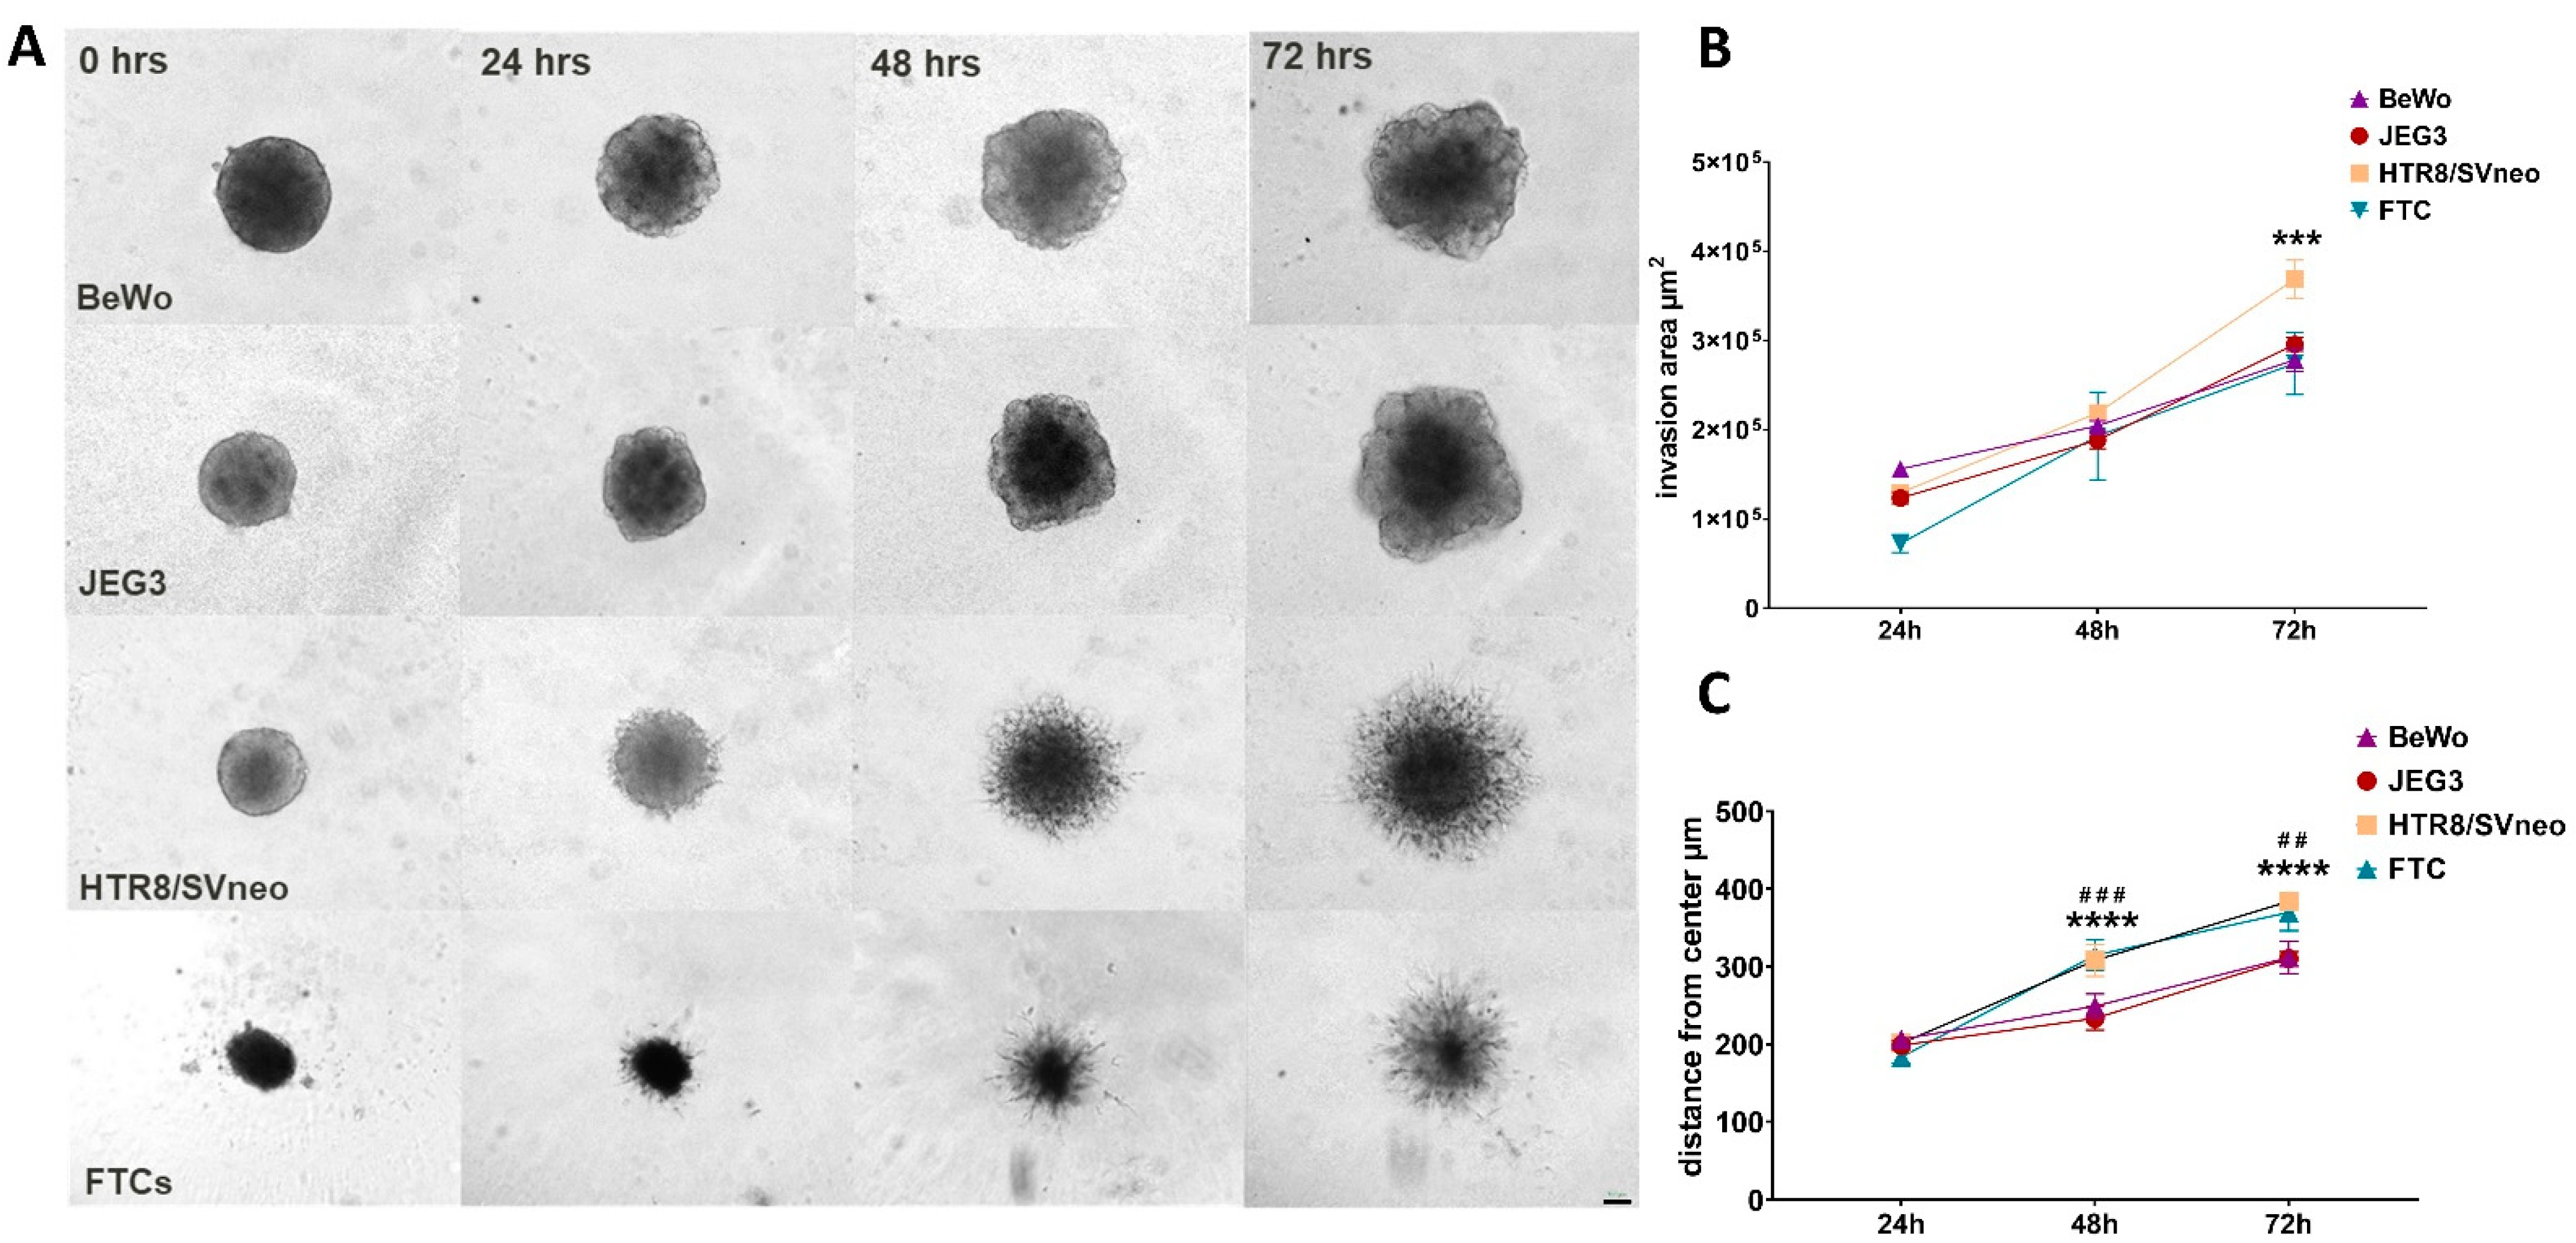
3.3. Migratory Properties of 3D Trophoblast Cell Lines
3.4. Invasion Rates of 3D Trophoblast Cell Lines
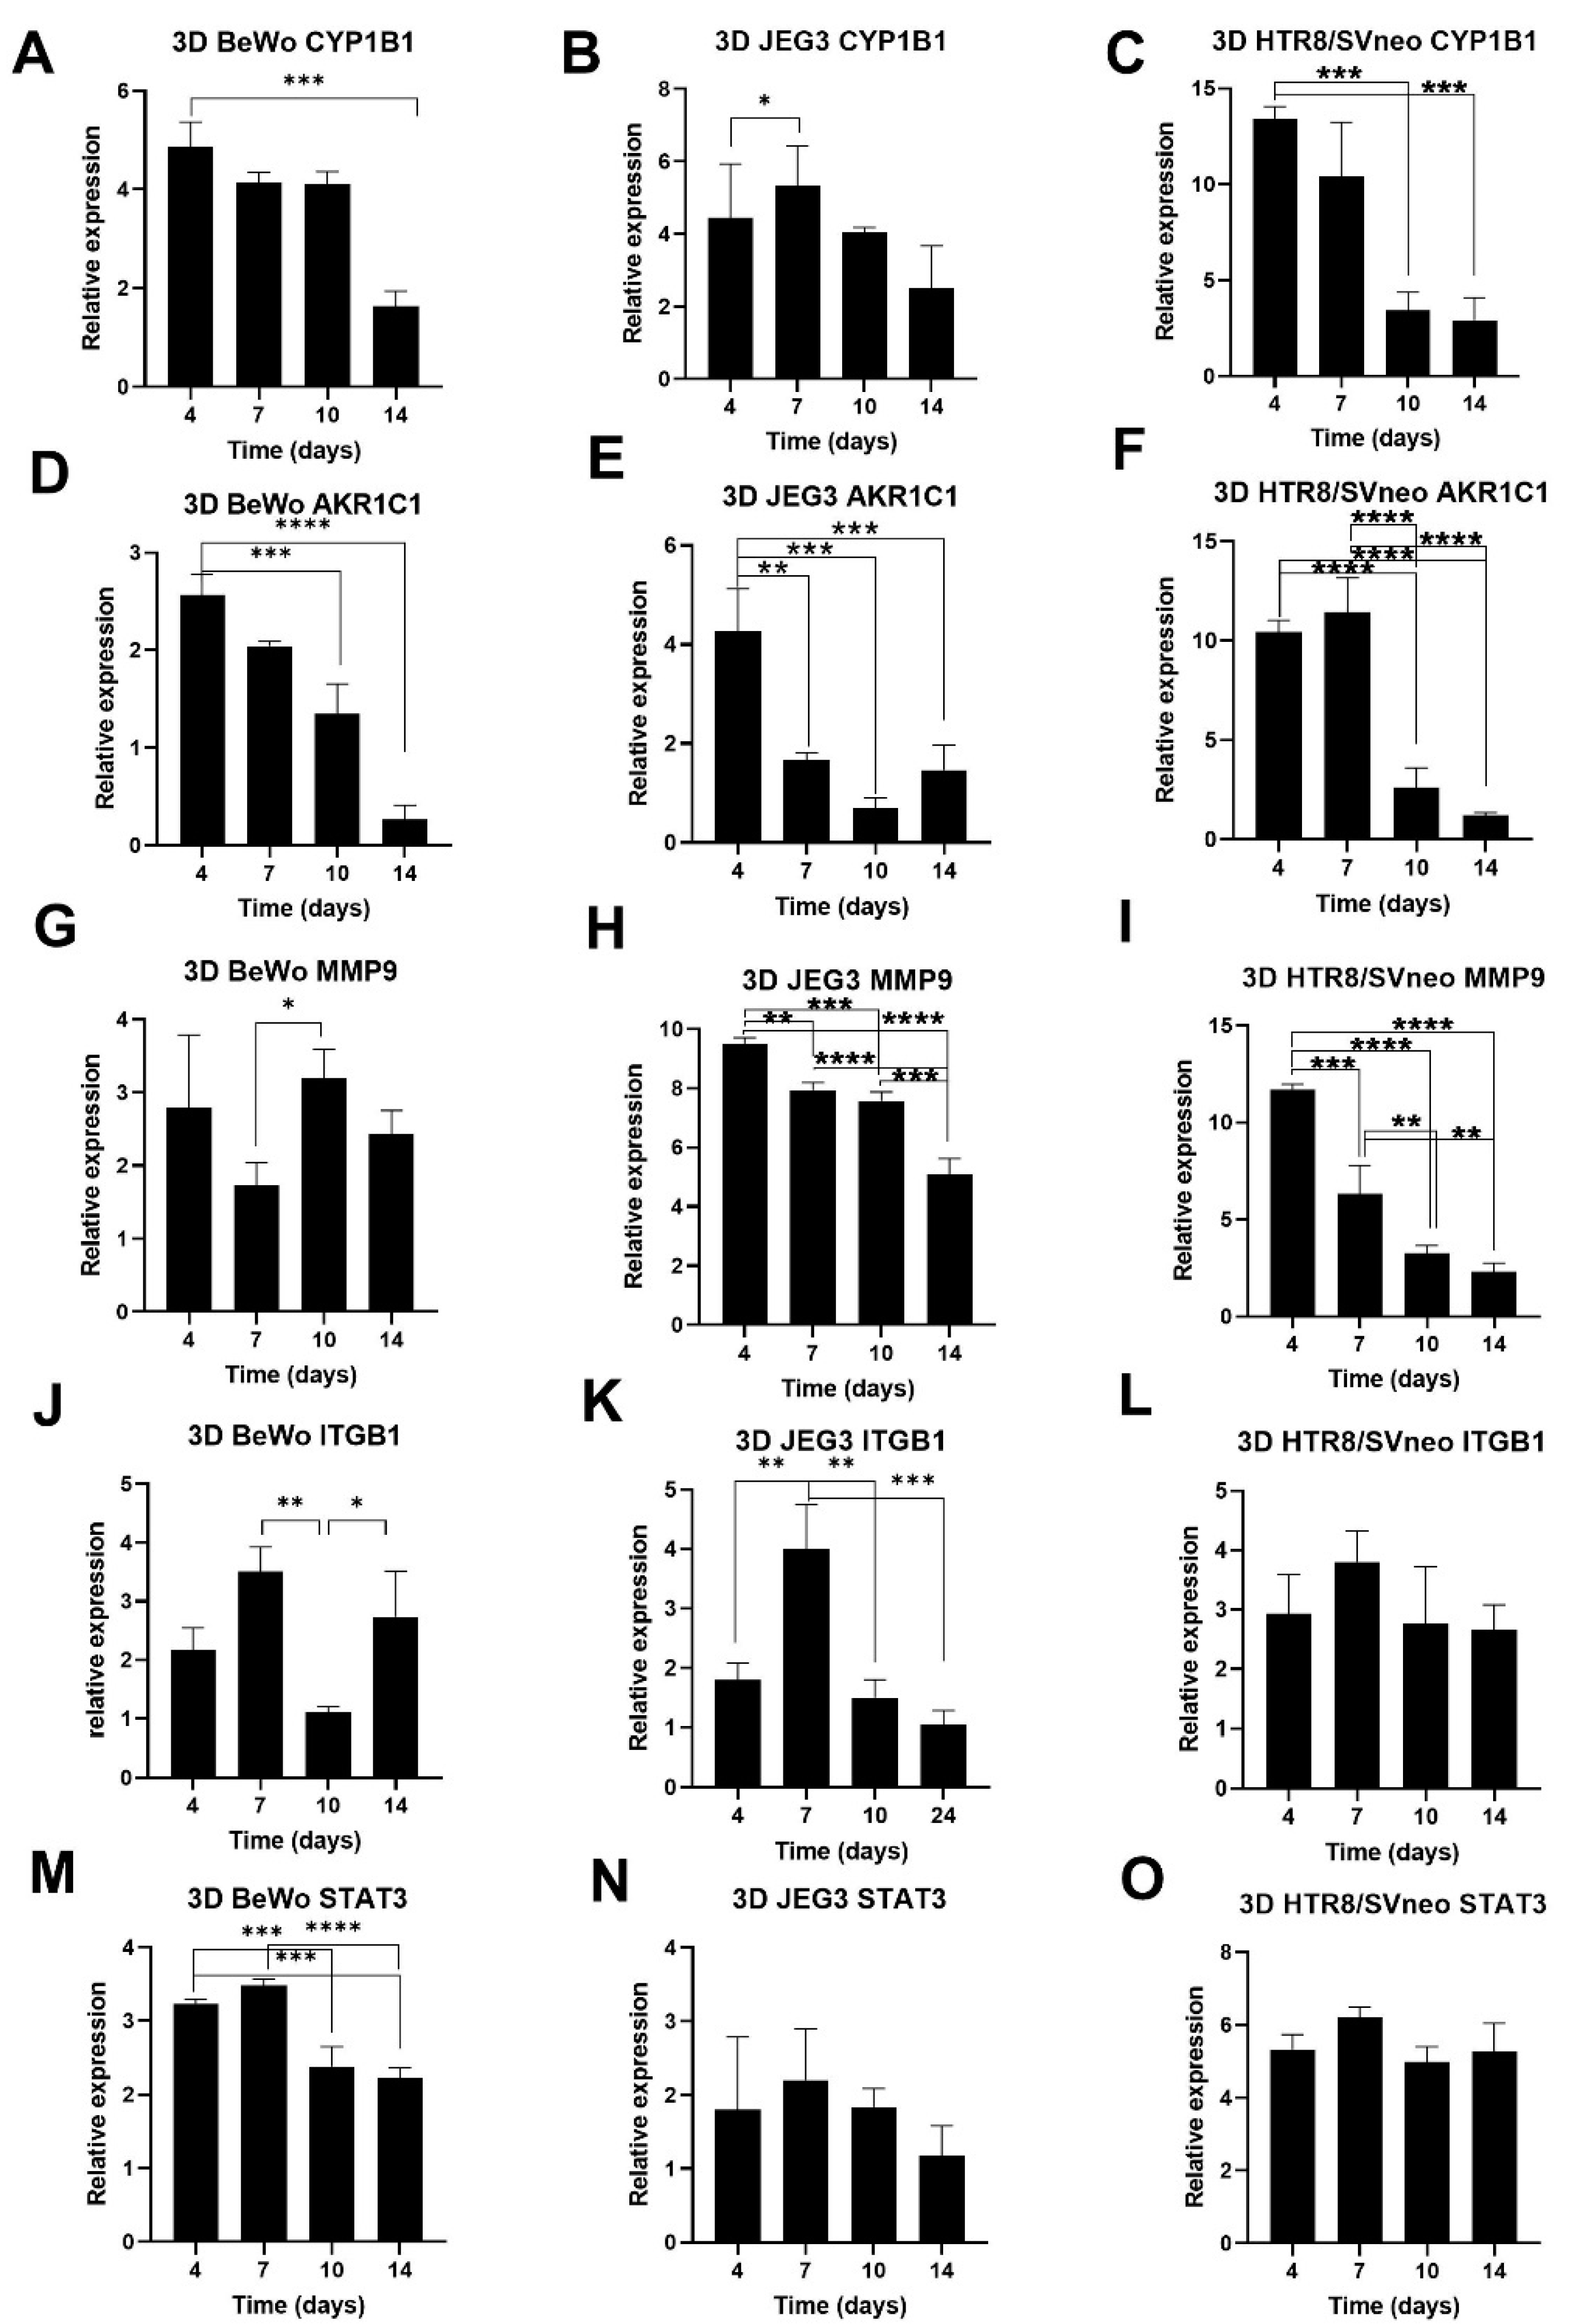
3.5. Growth Rate Follow-Up of 3D Trophoblast Cell Lines
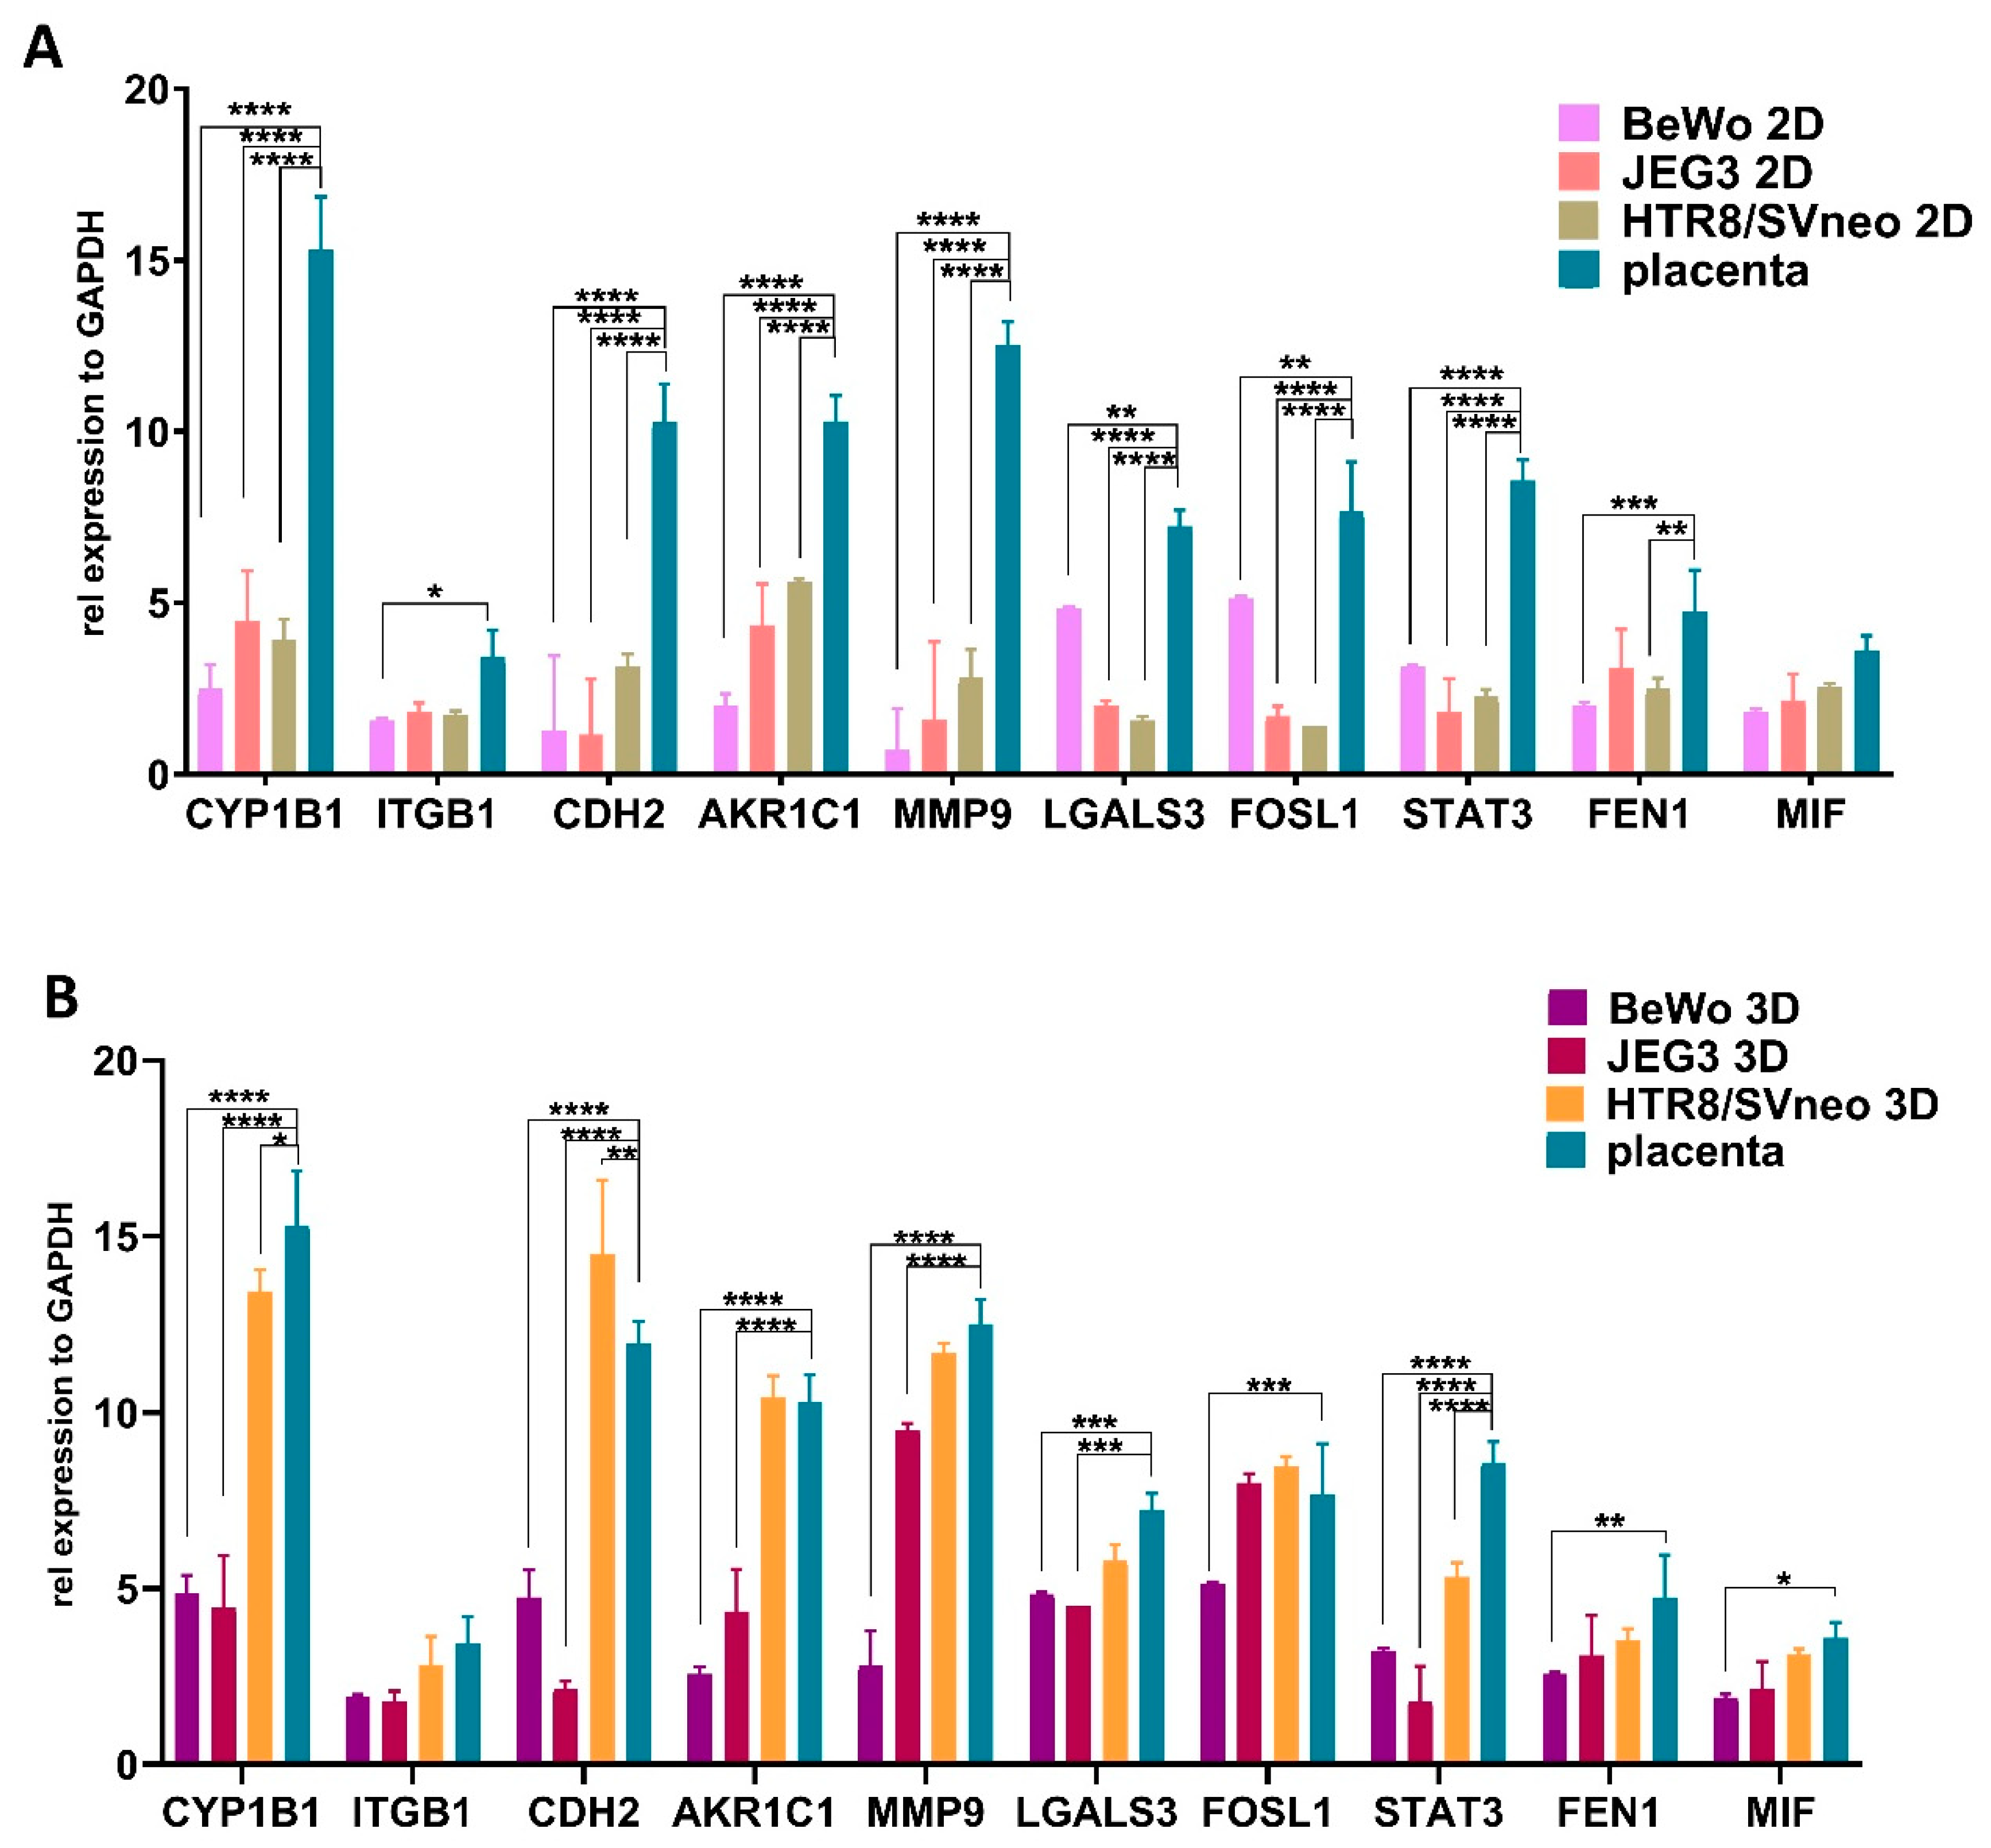
3.6. Comparison of Trophoblast Specific Gene Expression in 3D Trophoblast Spheroids
4. Discussion
5. Conclusions
Supplementary Materials
Author Contributions
Funding
Institutional Review Board Statement
Informed Consent Statement
Data Availability Statement
Acknowledgments
Conflicts of Interest
Abbreviations
| 2D | two-dimensional |
| 3D | three-dimensional |
| HTR-8/SVneo | human trophoblast transfected with plasmid containing Simian Virus T antigen |
| JEG-3 | clonally derived choriocarcinoma cell line |
| BeWo | B30 subclone of choriocarcinoma cell line |
| FTCs | primary fetal trophoblast obtained from 1st trimester placentas |
| CYP1B1 | Cytochrome P450 Family 1 Subfamily B Member 1 |
| CDH2 | Cadherin-2 |
| AKR1C1: | Aldo-Keto Reductase Family 1 Member C1 |
| MMP9: | Matrix metallopeptidase 9 |
| LGALS3: | Galectin 3 |
| FOSL1: | FOS Like 1 AP-1 Transcription Factor Subunit |
| MIF: | Macrophage migration inhibitory factor |
| FEN1: | Flap Structure-Specific Endonuclease 1 |
| STAT3: | Signal transducer and activator of transcription 3 |
References
- Soares, M.J.; Varberg, K.M.; Iqbal, K. Hemochorial placentation: Development, function, and adaptations. Biol. Reprod. 2018, 99, 196–211. [Google Scholar] [CrossRef]
- Turco, M.Y.; Moffett, A. Development of the human placenta. Development 2019, 146, dev163428. [Google Scholar] [CrossRef] [PubMed]
- Schumacher, A.; Zenclussen, A.C. Human Chorionic Gonadotropin-Mediated Immune Responses That Facilitate Embryo Implantation and Placentation. Front. Immunol. 2019, 10, 2896. [Google Scholar] [CrossRef]
- Robbins, J.R.; Skrzypczynska, K.M.; Zeldovich, V.B.; Kapidzic, M.; Bakardjiev, A.I. Placental syncytiotrophoblast constitutes a major barrier to vertical transmission of Listeria monocytogenes. PLoS Pathog. 2010, 6, e1000732. [Google Scholar] [CrossRef]
- Blanco-Castañeda, R.; Galaviz-Hernández, C.; Souto, P.C.S.; Lima, V.V.; Giachini, F.R.; Escudero, C.; Damiano, A.E.; Barragán-Zúñiga, L.J.; Martínez-Aguilar, G.; Sosa-Macías, M. The role of xenobiotic-metabolizing enzymes in the placenta: A growing research field. Expert Rev. Clin. Pharmacol. 2020, 13, 247–263. [Google Scholar] [CrossRef]
- Papageorghiou, A.T.; Prefumo, F.; Leslie, K.; Gaze, D.C.; Collinson, P.O.; Thilaganathan, B. Defective endovascular trophoblast invasion in the first trimester is associated with increased maternal serum ischemia-modified albumin. Hum. Reprod. 2008, 23, 803–806. [Google Scholar] [CrossRef]
- Stojanovska, V.; Shah, A.; Woidacki, K.; Fischer, F.; Bauer, M.; Lindquist, J.A.; Mertens, P.R.; Zenclussen, A.C. Yb-1 is altered in pregnancy-associated disorders and affects trophoblast in vitro properties via alternation of multiple molecular traits. Int. J. Mol. Sci. 2021, 22, 7226. [Google Scholar] [CrossRef]
- Malassiné, A.; Frendo, J.L.; Evain-Brion, D. A comparison of placental development and endocrine functions between the human and mouse model. Hum. Reprod. Update 2003, 9, 531–539. [Google Scholar] [CrossRef] [PubMed]
- Hannan, N.J.; Paiva, P.; Dimitriadis, E.; Salamonsen, L.A. Models for study of human embryo implantation: Choice of cell lines? Biol. Reprod. 2010, 82, 235–245. [Google Scholar] [CrossRef]
- Rothbauer, M.; Patel, N.; Gondola, H.; Siwetz, M.; Huppertz, B.; Ertl, P. A comparative study of five physiological key parameters between four different human trophoblast-derived cell lines. Sci. Rep. 2017, 7, 5892. [Google Scholar] [CrossRef] [Green Version]
- Duval, K.; Grover, H.; Han, L.H.; Mou, Y.; Pegoraro, A.F.; Fredberg, J.; Chen, Z. Modeling physiological events in 2D vs. 3D cell culture. Physiology 2017, 32, 266–277. [Google Scholar] [CrossRef] [PubMed]
- Jensen, C.; Teng, Y. Is It Time to Start Transitioning From 2D to 3D Cell Culture? Front. Mol. Biosci. 2020, 7, 33. [Google Scholar] [CrossRef] [PubMed]
- Barros, A.S.; Costa, E.C.; Nunes, A.S.; de Melo-Diogo, D.; Correia, I.J. Comparative study of the therapeutic effect of Doxorubicin and Resveratrol combination on 2D and 3D (spheroids) cell culture models. Int. J. Pharm. 2018, 551, 76–83. [Google Scholar] [CrossRef] [PubMed]
- Souza, A.G.; Silva, I.B.B.; Campos-Fernandez, E.; Barcelos, L.S.; Souza, J.B.; Marangoni, K.; Goulart, L.R.; Alonso-Goulart, V. Comparative Assay of 2D and 3D Cell Culture Models: Proliferation, Gene Expression and Anticancer Drug Response. Curr. Pharm. Des. 2018, 24, 1689–1694. [Google Scholar] [CrossRef] [PubMed]
- Haider, S.; Meinhardt, G.; Saleh, L.; Kunihs, V.; Gamperl, M.; Kaindl, U.; Ellinger, A.; Burkard, T.R.; Fiala, C.; Pollheimer, J.; et al. Self-Renewing Trophoblast Organoids Recapitulate the Developmental Program of the Early Human Placenta. Stem Cell Rep. 2018, 11, 537–551. [Google Scholar] [CrossRef]
- Turco, M.Y.; Gardner, L.; Kay, R.G.; Hamilton, R.S.; Prater, M.; Hollinshead, M.S.; McWhinnie, A.; Esposito, L.; Fernando, R.; Skelton, H.; et al. Trophoblast organoids as a model for maternal–fetal interactions during human placentation. Nature 2018, 564, 263–281. [Google Scholar] [CrossRef]
- Brüningk, S.C.; Rivens, I.; Box, C.; Oelfke, U.; ter Haar, G. 3D tumour spheroids for the prediction of the effects of radiation and hyperthermia treatments. Sci. Rep. 2020, 10, 1653. [Google Scholar] [CrossRef]
- Heredia-Soto, V.; Redondo, A.; Berjón, A.; Martín, M.M.; Díaz, E.; Crespo, R.; Hernández, A.; Yébenes, L.; Gallego, A.; Feliu, J.; et al. High-throughput 3-dimensional culture of epithelial ovarian cancer cells as preclinical model of disease. Oncotarget 2018, 9, 21893–21903. [Google Scholar] [CrossRef]
- Jeppesen, M.; Hagel, G.; Glenthoj, A.; Vainer, B.; Ibsen, P.; Harling, H.; Thastrup, O.; Jørgensen, L.N.; Thastrup, J. Short-term spheroid culture of primary colorectal cancer cells as an in vitro model for personalizing cancer medicine. PLoS ONE 2017, 12, e0183074. [Google Scholar] [CrossRef]
- Casey, R.C.; Burleson, K.M.; Skubitz, K.M.; Pambuccian, S.E.; Oegema, T.R.; Ruff, L.E.; Skubitz, A.P.N. Β1-Integrins Regulate the Formation and Adhesion of Ovarian Carcinoma Multicellular Spheroids. Am. J. Pathol. 2001, 159, 2071–2080. [Google Scholar] [CrossRef]
- Boylan, K.L.M.; Manion, R.D.; Shah, H.; Skubitz, K.M.; Skubitz, A.P.N. Inhibition of ovarian cancer cell spheroid formation by synthetic peptides derived from nectin-4. Int. J. Mol. Sci. 2020, 21, 4637. [Google Scholar] [CrossRef]
- Kozyra, M.; Johansson, I.; Nordling, Å.; Ullah, S.; Lauschke, V.M.; Ingelman-Sundberg, M. Human hepatic 3D spheroids as a model for steatosis and insulin resistance. Sci. Rep. 2018, 8, 14297. [Google Scholar] [CrossRef] [PubMed]
- Elberskirch, L.; Knoll, T.; Königsmark, R.; Renner, J.; Wilhelm, N.; von Briesen, H.; Wagner, S. Microfluidic 3D intestine tumor spheroid model for efficient in vitro investigation of nanoparticular formulations. J. Drug Deliv. Sci. Technol. 2021, 63, 102496. [Google Scholar] [CrossRef]
- Kim, J.J.; Jorfi, M.; Tanzi, R.E.; Kim, D.Y.; Doyle, P.S.; Irimia, D. Patterning of interconnected human brain spheroids. Lab Chip 2021, 21, 3532–3540. [Google Scholar] [CrossRef] [PubMed]
- Oraiopoulou, M.E.; Tzamali, E.; Tzedakis, G.; Liapis, E.; Zacharakis, G.; Vakis, A.; Papamatheakis, J.; Sakkalis, V. Integrating in vitro experiments with in silico approaches for Glioblastoma invasion: The role of cell-to-cell adhesion heterogeneity. Sci. Rep. 2018, 8, 16200. [Google Scholar] [CrossRef]
- Yuste, I.; Luciano, F.C.; González-Burgos, E.; Lalatsa, A.; Serrano, D.R. Mimicking bone microenvironment: 2D and 3D in vitro models of human osteoblasts. Pharmacol. Res. 2021, 169, 105626. [Google Scholar] [CrossRef]
- Saiz, A.M.; Gionet-Gonzales, M.A.; Lee, M.A.; Leach, J.K. Conditioning of myoblast secretome using mesenchymal stem/stromal cell spheroids improves bone repair. Bone 2019, 125, 151–159. [Google Scholar] [CrossRef]
- Loessner, D.; Stok, K.S.; Lutolf, M.P.; Hutmacher, D.W.; Clements, J.A.; Rizzi, S.C. Bioengineered 3D platform to explore cell-ECM interactions and drug resistance of epithelial ovarian cancer cells. Biomaterials 2010, 31, 8494–8506. [Google Scholar] [CrossRef]
- Wong, M.K.; Wahed, M.; Shawky, S.A.; Dvorkin-Gheva, A.; Raha, S. Transcriptomic and functional analyses of 3D placental extravillous trophoblast spheroids. Sci. Rep. 2019, 9, 12607. [Google Scholar] [CrossRef]
- Alexandrova, M.; Manchorova, D.; You, Y.; Mor, G.; Dimitrova, V.; Dimova, T. Functional HLA-C expressing trophoblast spheroids as a model to study placental–maternal immune interactions during human implantation. Sci. Rep. 2022, 12, 10224. [Google Scholar] [CrossRef]
- Silberstein, E.; Kim, K.S.; Acosta, D.; Debrabant, A. Human Placental Trophoblasts Are Resistant to Trypanosoma cruzi Infection in a 3D-Culture Model of the Maternal-Fetal Interface. Front. Microbiol. 2021, 12, 626370. [Google Scholar] [CrossRef] [PubMed]
- Sirenko, O.; Mitlo, T.; Hesley, J.; Luke, S.; Owens, W.; Cromwell, E.F. High-Content Assays for Characterizing the Viability and Morphology of 3D Cancer Spheroid Cultures. Assay Drug Dev. Technol. 2015, 13, 402–414. [Google Scholar] [CrossRef]
- Vinci, M.; Gowan, S.; Boxall, F.; Patterson, L.; Zimmermann, M.; Court, W.; Lomas, C.; Mendiola, M.; Hardisson, D.; Eccles, S.A. Advances in establishment and analysis of three-dimensional tumor spheroid-based functional assays for target validation and drug evaluation. BMC Biol. 2012, 10, 29. [Google Scholar] [CrossRef] [PubMed]
- Grimes, D.R.; Kelly, C.; Bloch, K.; Partridge, M. A method for estimating the oxygen consumption rate in multicellular tumour spheroids. J. R. Soc. Interface 2014, 11, 20131124. [Google Scholar] [CrossRef] [PubMed]
- Al-Nasiry, S.; Spitz, B.; Hanssens, M.; Luyten, C.; Pijnenborg, R. Differential effects of inducers of syncytialization and apoptosis on BeWo and JEG-3 choriocarcinoma cells. Hum. Reprod. 2006, 21, 193–201. [Google Scholar] [CrossRef]
- Białkowska, K.; Komorowski, P.; Bryszewska, M.; Miłowska, K. Spheroids as a type of three-dimensional cell cultures—examples of methods of preparation and the most important application. Int. J. Mol. Sci. 2020, 21, 6225. [Google Scholar] [CrossRef]
- Vantangoli, M.M.; Madnick, S.J.; Huse, S.M.; Weston, P.; Boekelheide, K. MCF-7 human breast cancer cells form differentiated microtissues in scaffold-free hydrogels. PLoS ONE 2015, 10, e0135426. [Google Scholar] [CrossRef]
- Granato, G.; Ruocco, M.R.; Iaccarino, A.; Masone, S.; Calì, G.; Avagliano, A.; Russo, V.; Bellevicine, C.; Di Spigna, G.; Fiume, G.; et al. Generation and analysis of spheroids from human primary skin myofibroblasts: An experimental system to study myofibroblasts deactivation. Cell Death Discov. 2017, 3, 17038. [Google Scholar] [CrossRef] [PubMed]
- Liu, H.; Wang, L.; Wang, Y.; Zhu, Q.; Aldo, P.; Ding, J.; Mor, G.; Liao, A. Establishment and characterization of a new human first trimester Trophoblast cell line, AL07. Placenta 2020, 100, 122–132. [Google Scholar] [CrossRef]
- Okae, H.; Toh, H.; Sato, T.; Hiura, H.; Takahashi, S.; Shirane, K.; Kabayama, Y.; Suyama, M.; Sasaki, H.; Arima, T. Derivation of Human Trophoblast Stem Cells. Cell Stem Cell 2018, 22, 50–63. [Google Scholar] [CrossRef] [Green Version]
- Kaufmann, P.; Black, S.; Huppertz, B. Endovascular trophoblast invasion: Implications for the pathogenesis of intrauterine growth retardation and preeclampsia. Biol. Reprod. 2003, 69, 1–7. [Google Scholar] [CrossRef] [PubMed]
- Suman, P.; Gupta, S.K. Comparative analysis of the invasion-associated genes expression pattern in first trimester trophoblastic (HTR-8/SVneo) and JEG-3 choriocarcinoma cells. Placenta 2012, 33, 874–877. [Google Scholar] [CrossRef] [PubMed]
- Evseenko, D.A.; Paxton, J.W.; Keelan, J.A. ABC drug transporter expression and functional activity in trophoblast-like cell lines and differentiating primary trophoblast. Am. J. Physiol. Regul. Integr. Comp. Physiol. 2006, 290, 1357–1365. [Google Scholar] [CrossRef] [PubMed]
- Edmondson, R.; Broglie, J.J.; Adcock, A.F.; Yang, L. Three-dimensional cell culture systems and their applications in drug discovery and cell-based biosensors. Assay Drug Dev. Technol. 2014, 12, 207–218. [Google Scholar] [CrossRef]
- McConkey, C.A.; Delorme-Axford, E.; Nickerson, C.A.; Kim, K.S.; Sadovsky, Y.; Boyle, J.P.; Coyne, C.B. A three-dimensional culture system recapitulates placental syncytiotrophoblast development and microbial resistance. Sci. Adv. 2016, 2, 83–92. [Google Scholar] [CrossRef]
- Velicky, P.; Meinhardt, G.; Plessl, K.; Vondra, S.; Weiss, T.; Haslinger, P.; Lendl, T.; Aumayr, K.; Mairhofer, M.; Zhu, X.; et al. Genome amplification and cellular senescence are hallmarks of human placenta development. PLoS Genet. 2018, 14, e1007698. [Google Scholar] [CrossRef]
- Graham, C.H.; Hawley, T.S.; Hawley, R.G.; MacDougall, J.R.; Kerbel, R.S.; Khoo, N.; Lala, P.K. Establishment and characterization of first trimester trophoblast cells with extended lifespan. Exp. Cell Res. 1993, 206, 204–211. [Google Scholar] [CrossRef]
- Jaiswal, D.; Cowley, N.; Bian, Z.; Zheng, G.; Claffey, K.P.; Hoshino, K. Stiffness analysis of 3D spheroids using microtweezers. PLoS ONE 2017, 12, e0188346. [Google Scholar] [CrossRef]
- Puls, T.J.; Tan, X.; Husain, M.; Whittington, C.F.; Fishel, M.L.; Voytik-Harbin, S.L. Development of a Novel 3D Tumor-tissue Invasion Model for High-throughput, High-content Phenotypic Drug Screening. Sci. Rep. 2018, 8, 13039. [Google Scholar] [CrossRef]
- Bromberg, J.; Darnell, J.E. The role of STATs in transcriptional control and their impact on cellular function. Oncogene 2000, 19, 2468–2473. [Google Scholar] [CrossRef] [Green Version]
- Demaria, M.; Misale, S.; Giorgi, C.; Miano, V.; Camporeale, A.; Campisi, J.; Pinton, P.; Poli, V. STAT3 can serve as a hit in the process of malignant transformation of primary cells. Cell Death Differ. 2012, 19, 1390–1397. [Google Scholar] [CrossRef] [PubMed]
- Schumacher, A.; Sharkey, D.J.; Robertson, S.A.; Zenclussen, A.C. Immune Cells at the Fetomaternal Interface: How the microenvironment modulates immune cells to foster fetal development. J. Immunol. 2018, 201, 325–334. [Google Scholar] [CrossRef] [PubMed]
- Makrigiannakis, A.; Vrekoussis, T.; Zoumakis, E.; Kalantaridou, S.N.; Jeschke, U. The role of HCG in implantation: A mini-review of molecular and clinical evidence. Int. J. Mol. Sci. 2017, 18, 1305. [Google Scholar] [CrossRef] [PubMed]
- Msheik, H.; Azar, J.; El Sabeh, M.; Abou-Kheir, W.; Daoud, G. HTR-8/SVneo: A model for epithelial to mesenchymal transition in the human placenta. Placenta 2020, 90, 90–97. [Google Scholar] [CrossRef]
- Orendi, K.; Gauster, M.; Moser, G.; Meiri, H.; Huppertz, B. The choriocarcinoma cell line BeWo: Syncytial fusion and expression of syncytium-specific proteins. Reproduction 2010, 140, 759–766. [Google Scholar] [CrossRef] [Green Version]


Publisher’s Note: MDPI stays neutral with regard to jurisdictional claims in published maps and institutional affiliations. |
© 2022 by the authors. Licensee MDPI, Basel, Switzerland. This article is an open access article distributed under the terms and conditions of the Creative Commons Attribution (CC BY) license (https://creativecommons.org/licenses/by/4.0/).
Share and Cite
Stojanovska, V.; Arnold, S.; Bauer, M.; Voss, H.; Fest, S.; Zenclussen, A.C. Characterization of Three-Dimensional Trophoblast Spheroids: An Alternative Model to Study the Physiological Properties of the Placental Unit. Cells 2022, 11, 2884. https://doi.org/10.3390/cells11182884
Stojanovska V, Arnold S, Bauer M, Voss H, Fest S, Zenclussen AC. Characterization of Three-Dimensional Trophoblast Spheroids: An Alternative Model to Study the Physiological Properties of the Placental Unit. Cells. 2022; 11(18):2884. https://doi.org/10.3390/cells11182884
Chicago/Turabian StyleStojanovska, Violeta, Susanne Arnold, Mario Bauer, Hermann Voss, Stefan Fest, and Ana Claudia Zenclussen. 2022. "Characterization of Three-Dimensional Trophoblast Spheroids: An Alternative Model to Study the Physiological Properties of the Placental Unit" Cells 11, no. 18: 2884. https://doi.org/10.3390/cells11182884